Superior Drilling Products Inc
Superior Drilling Products — Q3 2020 Earnings Presentation
16 slides from Superior Drilling Products's earnings presentation, Nov 6, 2020
Slide 1: Third Quarter 2020 Financial Results Conference Call
Ny SUPERIOR DRILLING PRODUCTS THIRD QUARTER 2020 FINANCIAL RESULTS CONFERENCE CALL NOVEMBER 6, 2020 NYSE American: SDPI www.sdpi.com © 2020 Superior Drilling Products
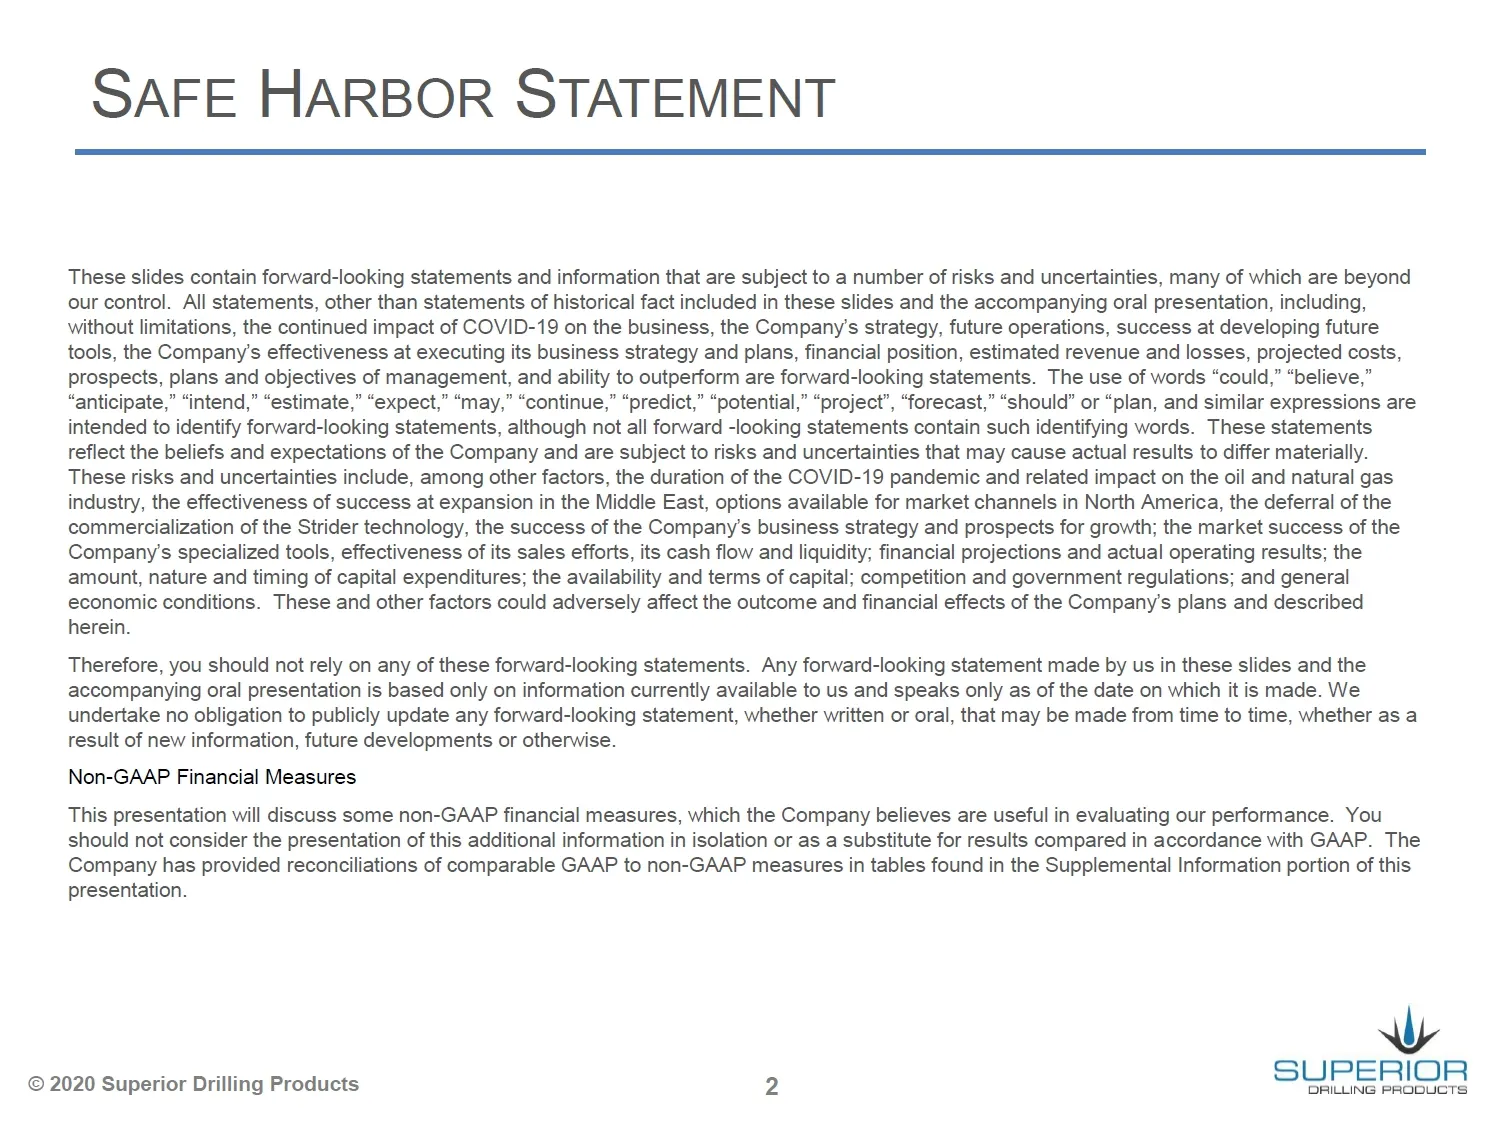
Slide 2: Safe Harbor Statement
SAFE HARBOR STATEMENT These slides contain forward-looking statements and information that are subject to a number of risks and uncertainties, many of which are beyond our control. All statements, other than statements of historical fact included in these slides and the accompanying oral presentatio
Slide 3: Troy Meier, Chairman and Chief Executive Officer
Ny SUPERIOR DRILLING PRODUCTS TROY MEIER CHAIRMAN AND CHIEF EXECUTIVE OFFICER © 2020 Superior Drilling Products
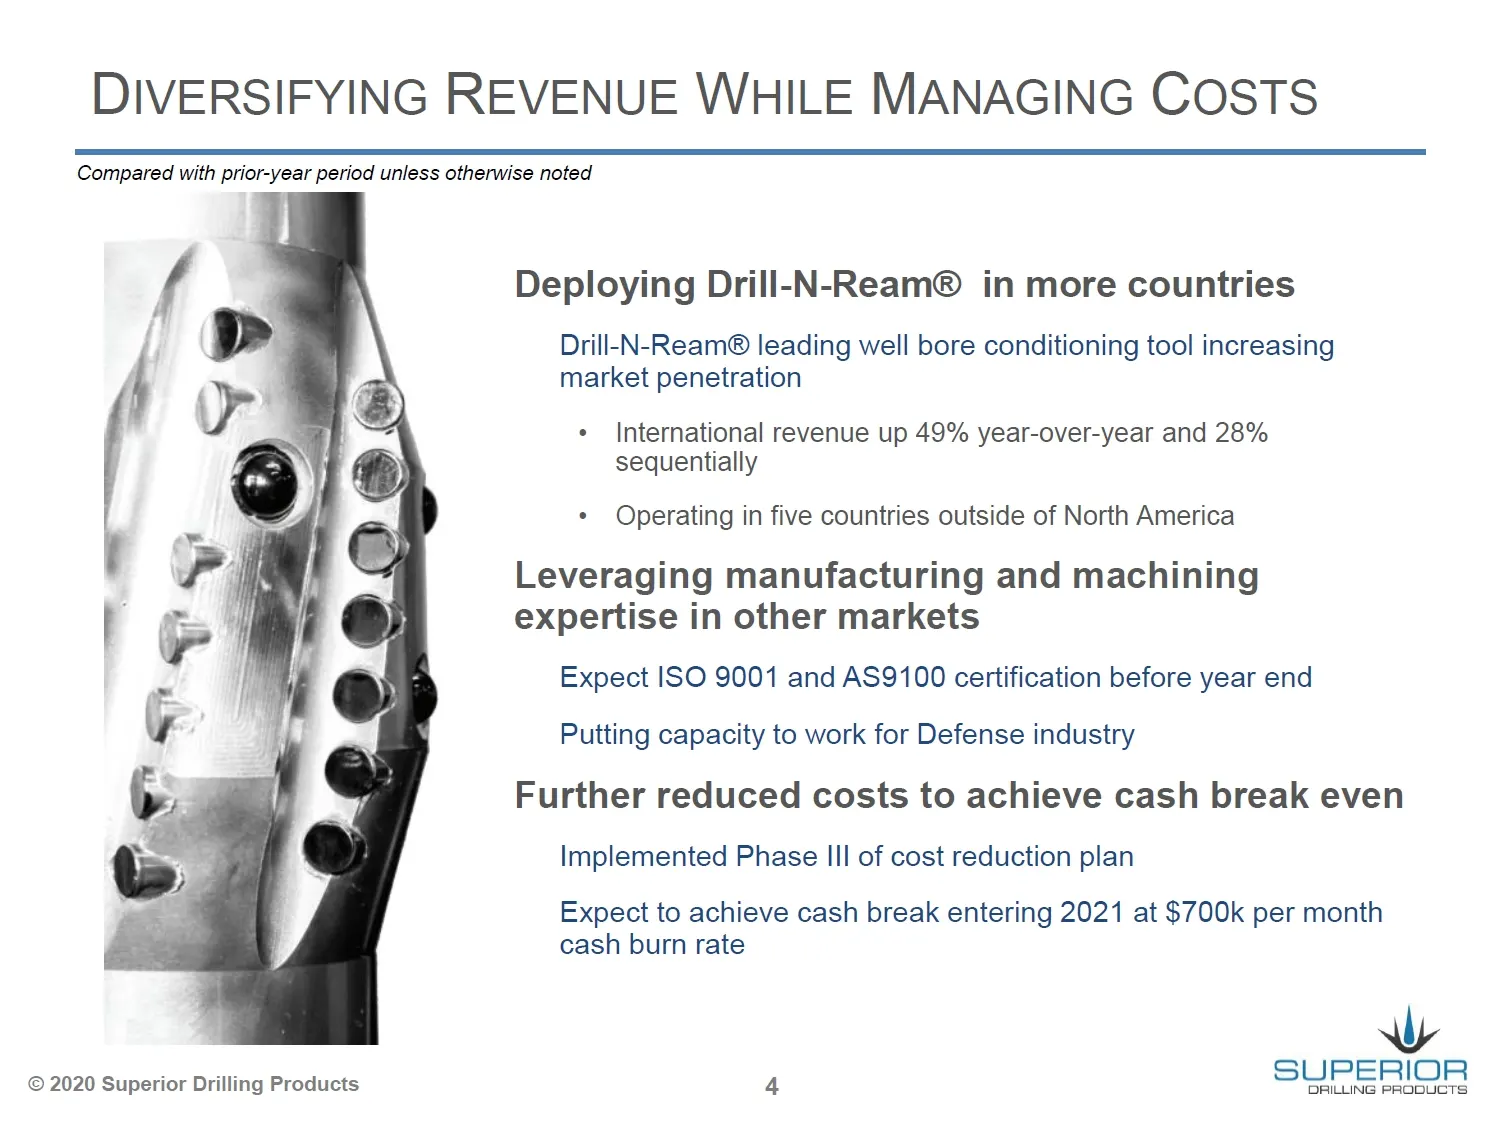
Slide 4: Diversifying Revenue While Managing Costs
DIVERSIFYING REVENUE WHILE MANAGING COSTS Compared with prior-year period unless otherwise noted © 2020 Superior Drilling Products Deploying Drill-N-Ream® in more countries Drill-N-Ream® leading well bore conditioning tool increasing market penetration «International revenue up 49% year-over-year an
Slide 5: Christopher Cashion, Chief Financial Officer
Ny SUPERIOR DRILLING PRODUCTS CHRISTOPHER CASHION CHIEF FINANCIAL OFFICER © 2020 Superior Drilling Products
Slide 6: Revenue Expected to Improve from Q3 2020
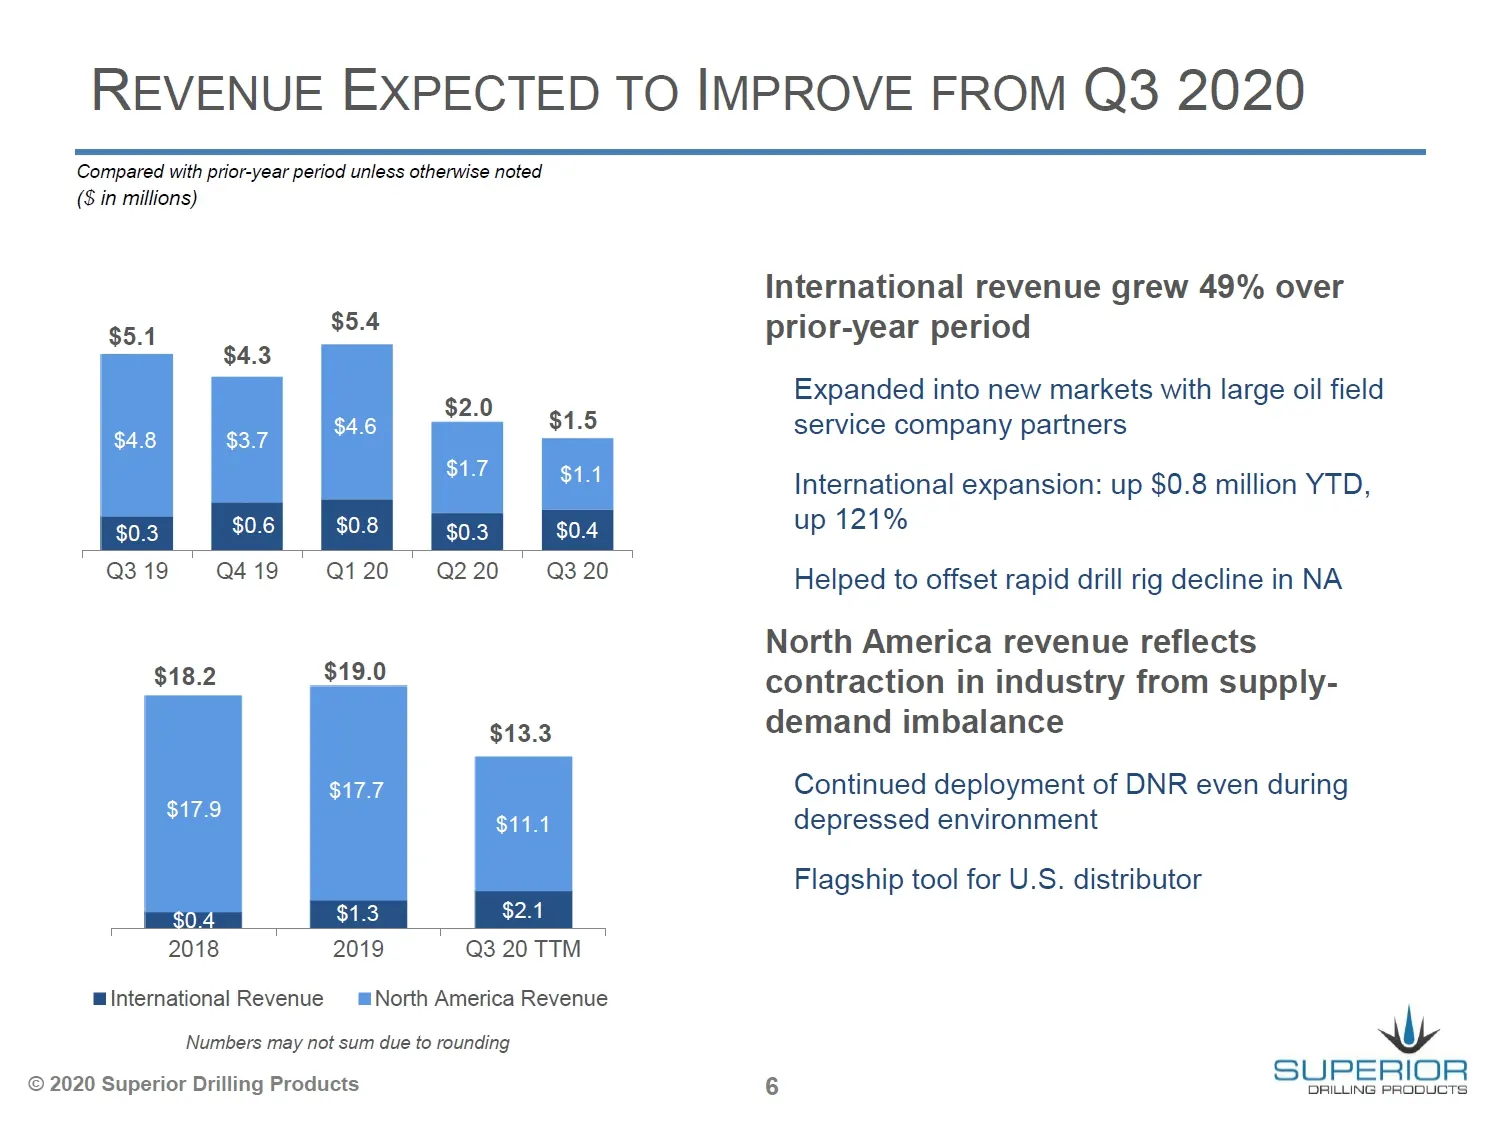
REVENUE EXPECTED TO IMPROVE FROM Q3 2020 Compared with prior-year period unless otherwise noted ($ in millions) $5.4 5.1 he $4.3 2.0 $4.8 $3.7 oa : Sts E ead $0.3 $0.6 $0.8 $0.4 Q3 19 Q419 Q1 20 Q2 20 Q3 20 $18.2 $19.0 $13.3 $17.7 $11.1 $1.3 $2.1 2019 Q3 20 TTM mlnternational Revenue = North America
Slide 7: Tool and Contract Services Revenue
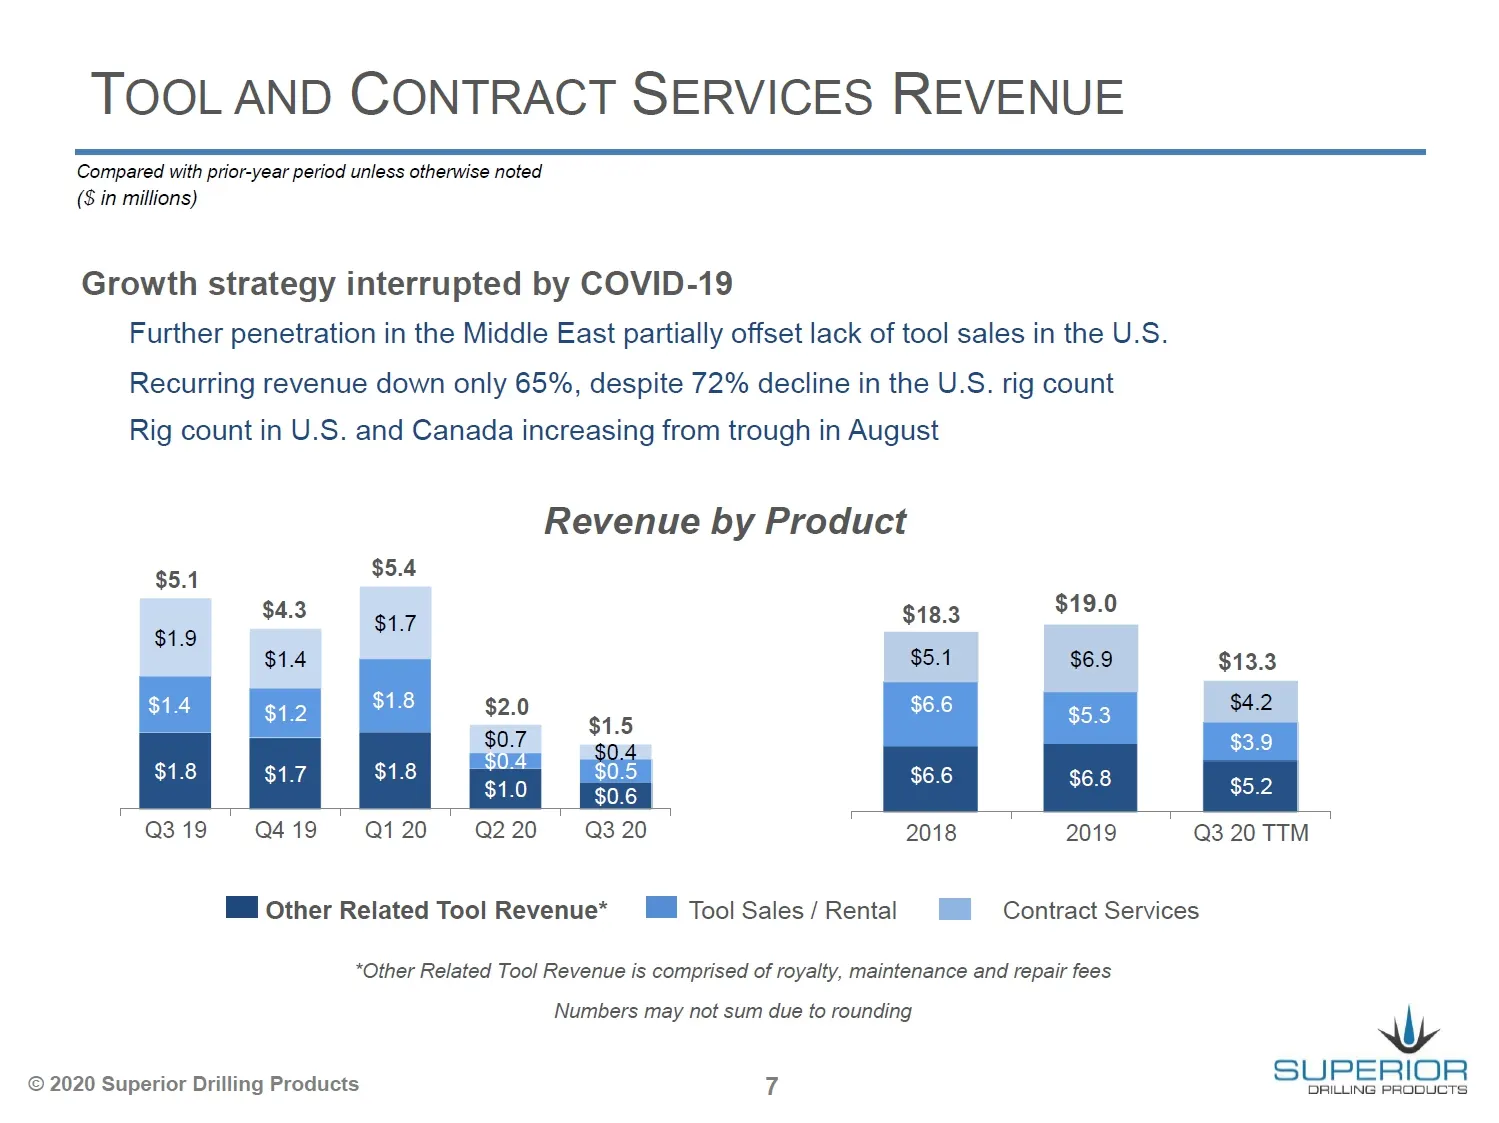
TOOL AND CONTRACT SERVICES REVENUE Compared with prior-year period unless otherwise noted ($ in millions) Growth strategy interrupted by COVID-19 Further penetration in the Middle East partially offset lack of tool sales in the U.S. Recurring revenue down only 65%, despite 72% decline in the U.S. ri
Slide 8: Reducing Cost and Operational Structures
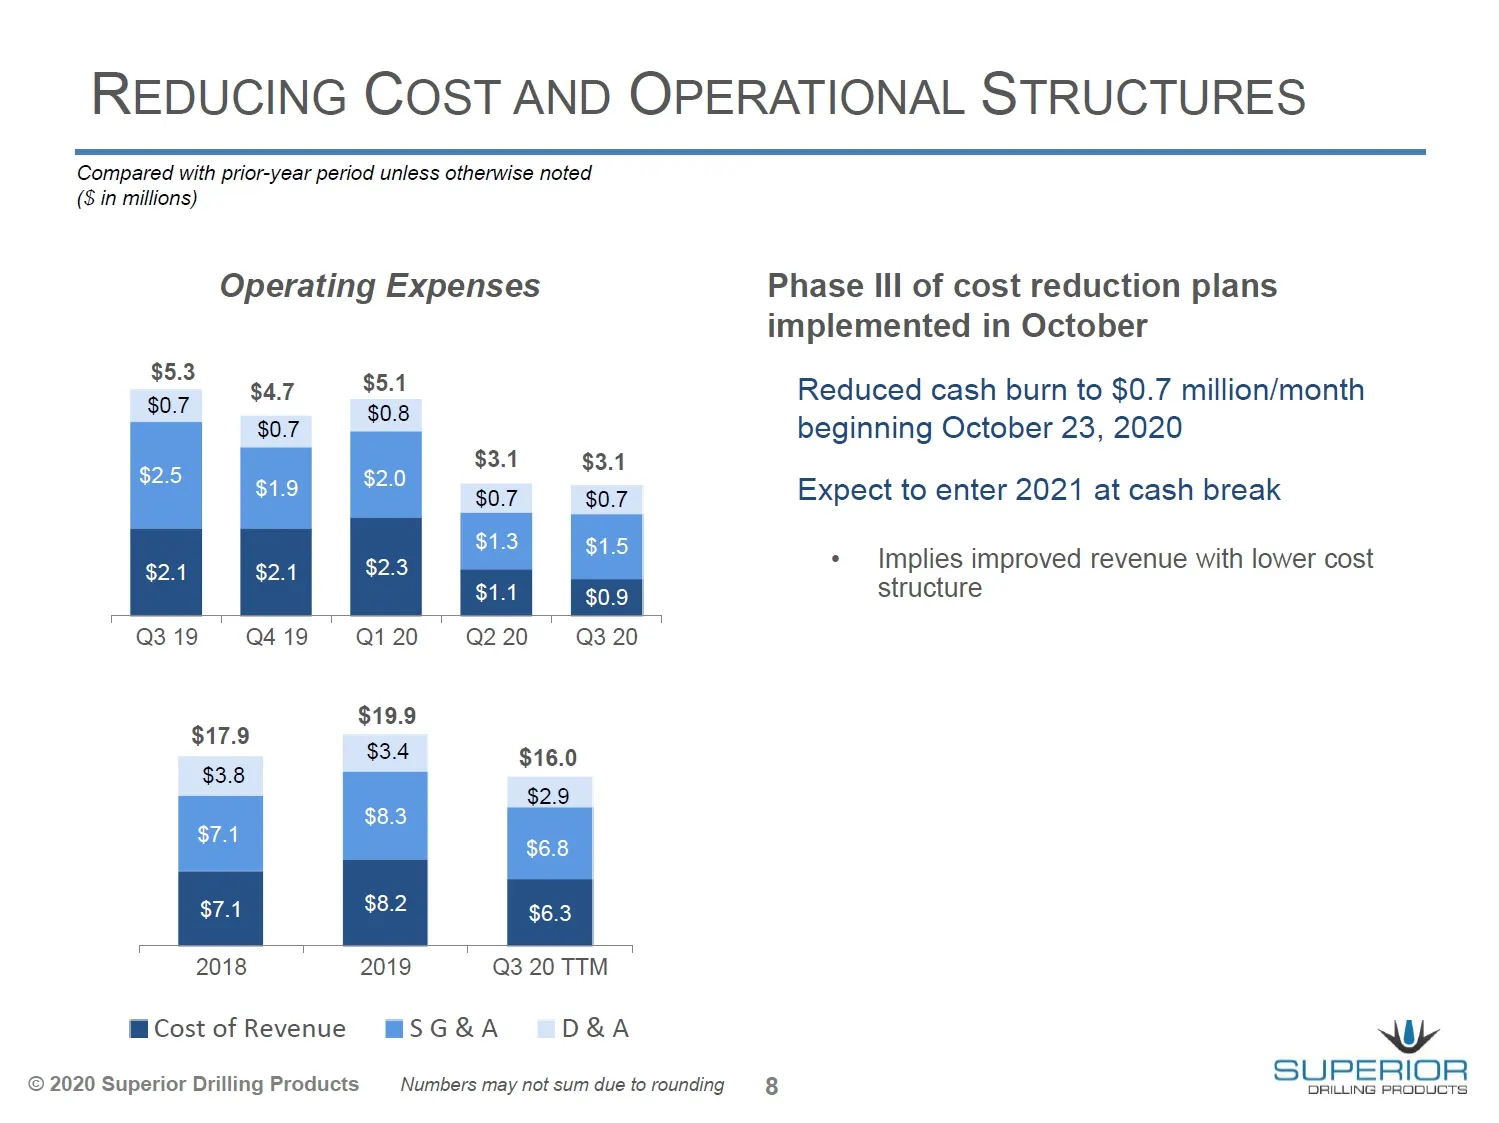
REDUCING COST AND OPERATIONAL STRUCTURES Compared with prior-year period unless otherwise noted ($ in millions) Operating Expenses Phase Ill of cost reduction plans implemented in October aa . $5.1 Reduced cash burn to $0.7 million/month : beginning October 23, 2020 ong $3.1 $3.1 : $0.7 $07 Expect t
Slide 9: Results Impacted by COVID-19
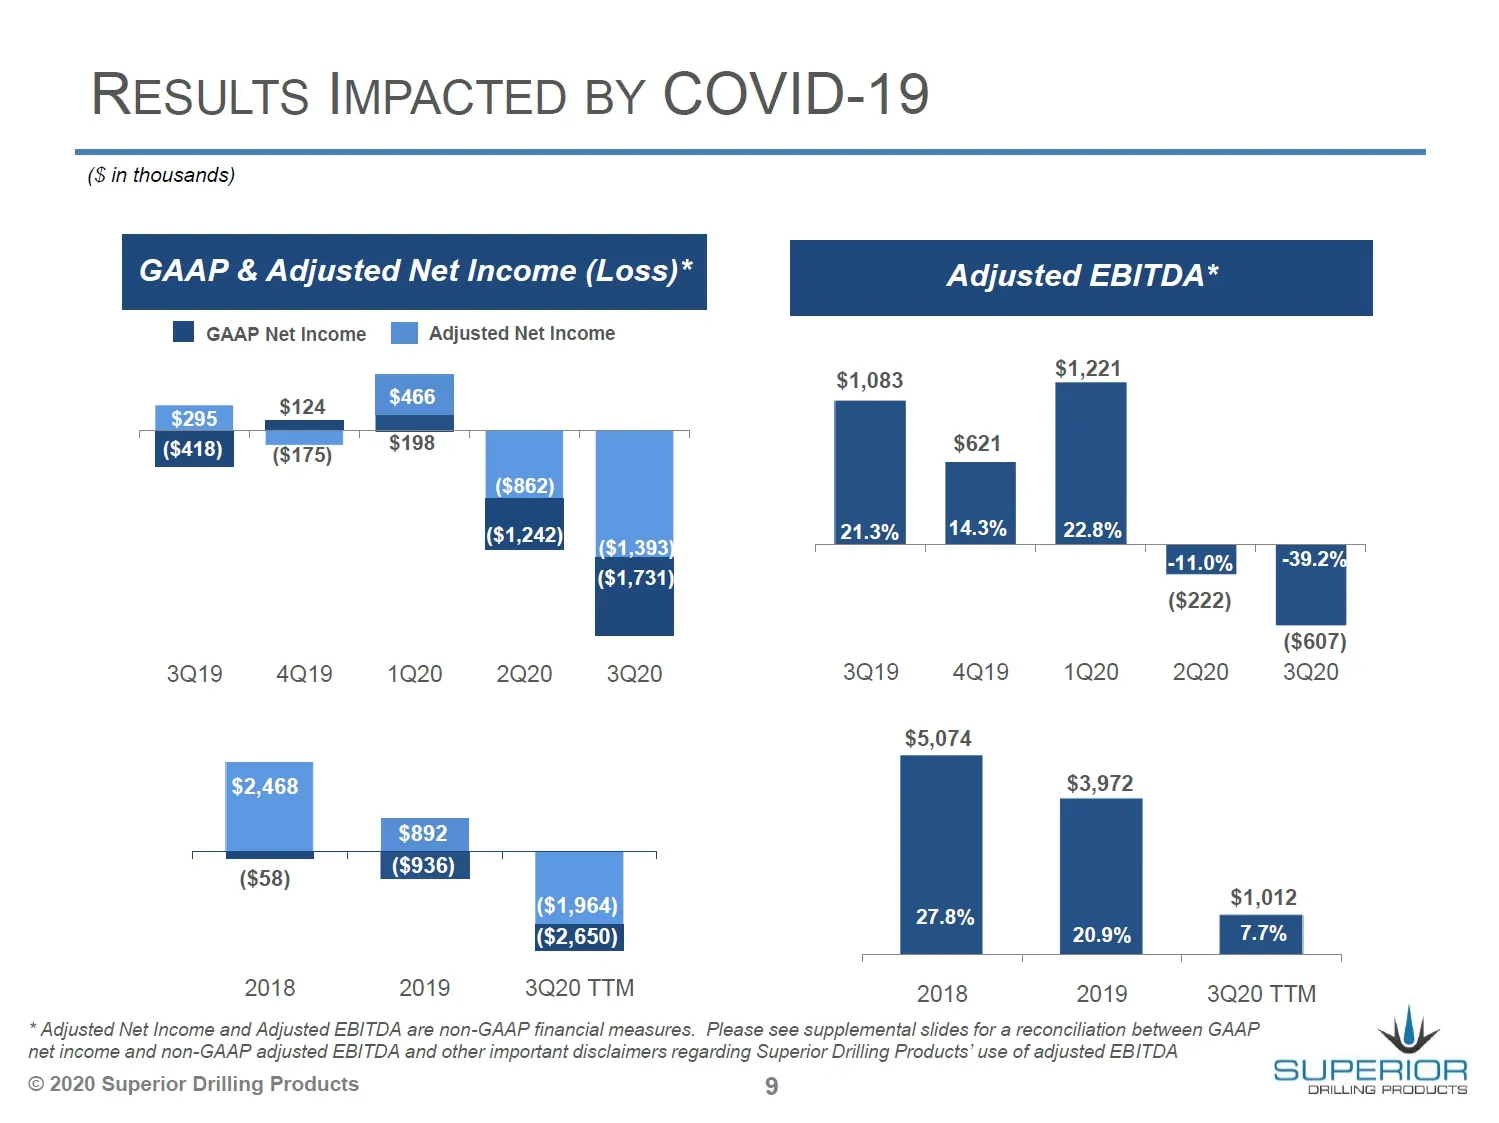
RESULTS IMPACTED BY COVID-19 (3 in thousands) GAAP & Adjusted Net Income (Loss)* Adjusted EBITDA* HB caap Net Income I Adjusted Net Income $1,221 Ea $1,083 $124 $295 =e 3021 22.8% ($222) 3Q19 4Q19 1Q20 2Q20 3Q20 3Q19 4Q19 1Q20 2Q20 soe $5,074 $2,468 $3,972 $892 | (898) | = | | $1,012 cant a1. 20.9%
Slide 10: Balance Sheet Improving
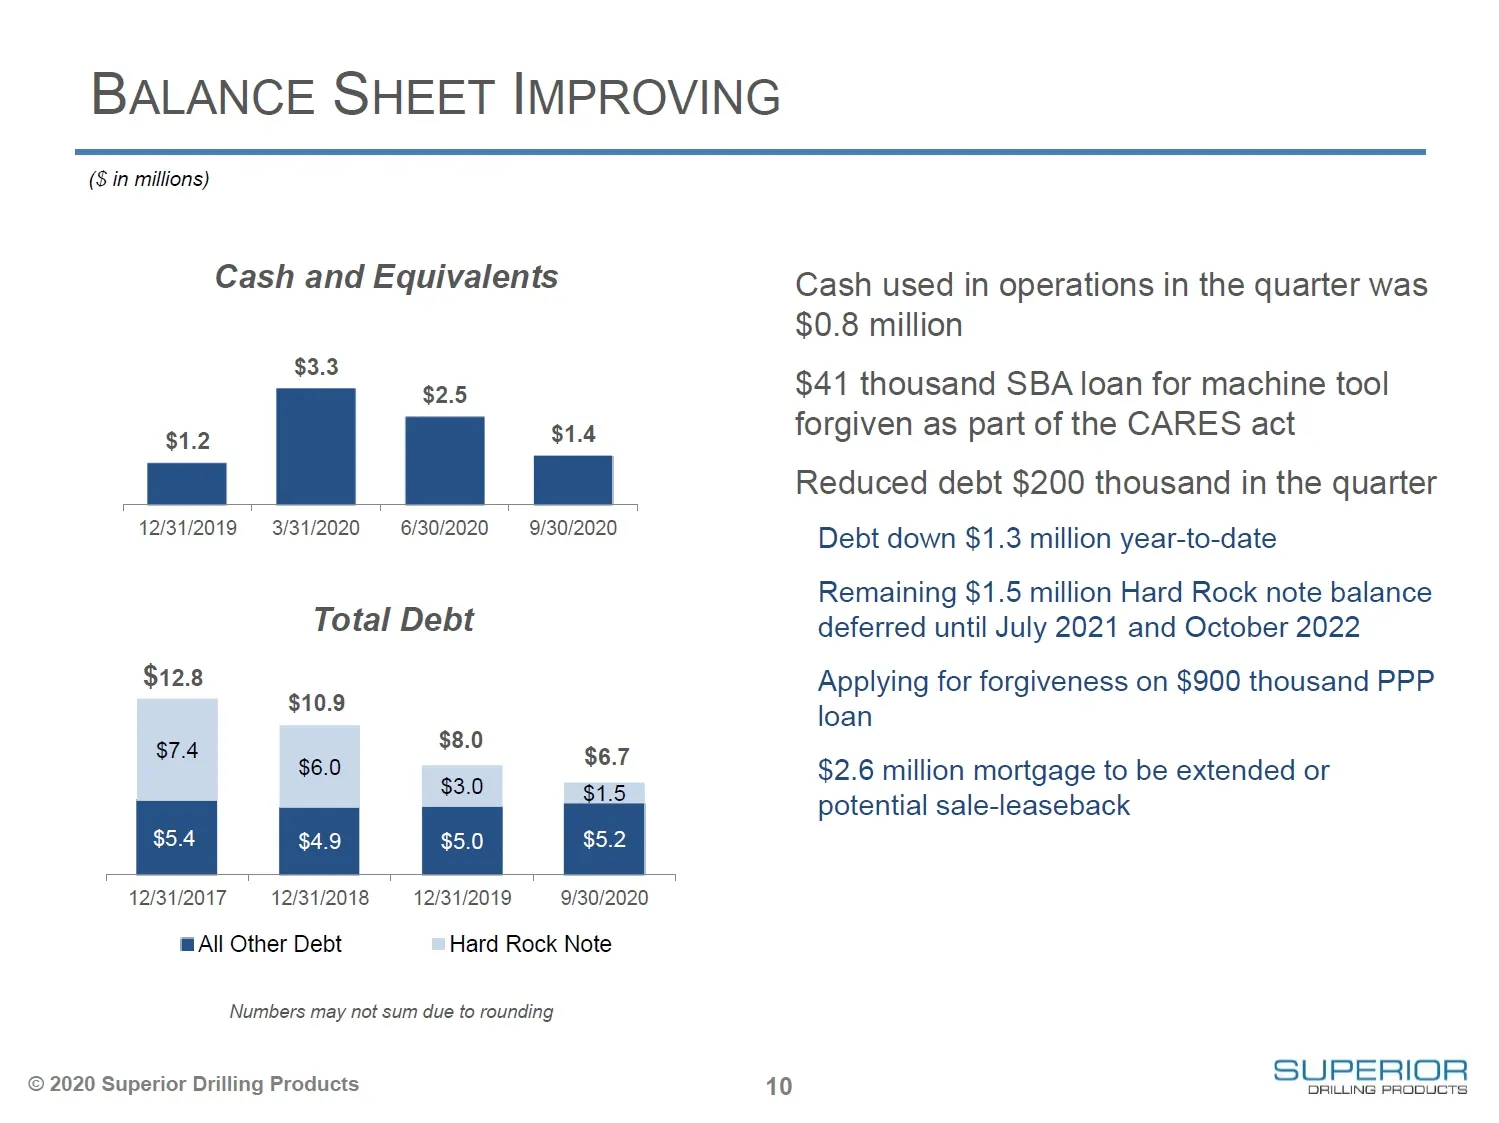
BALANCE SHEET IMPROVING ($ in millions) Cash and Equivalents $3.3 $2.5 $1.2 $1.4 12/31/2019 , 3/31/2020 6/30/2020 , 9/30/2020 Total Debt $12.8 $10.9 $8.0 $6.0 $6.7 $3.0 E 5 12/31/2017 12/31/2018 12/31/2019 9/30/2020 All Other Debt Hard Rock Note Numbers may not sum due to rounding © 2020 Superior Dr
Slide 11: Outlook and Opportunities
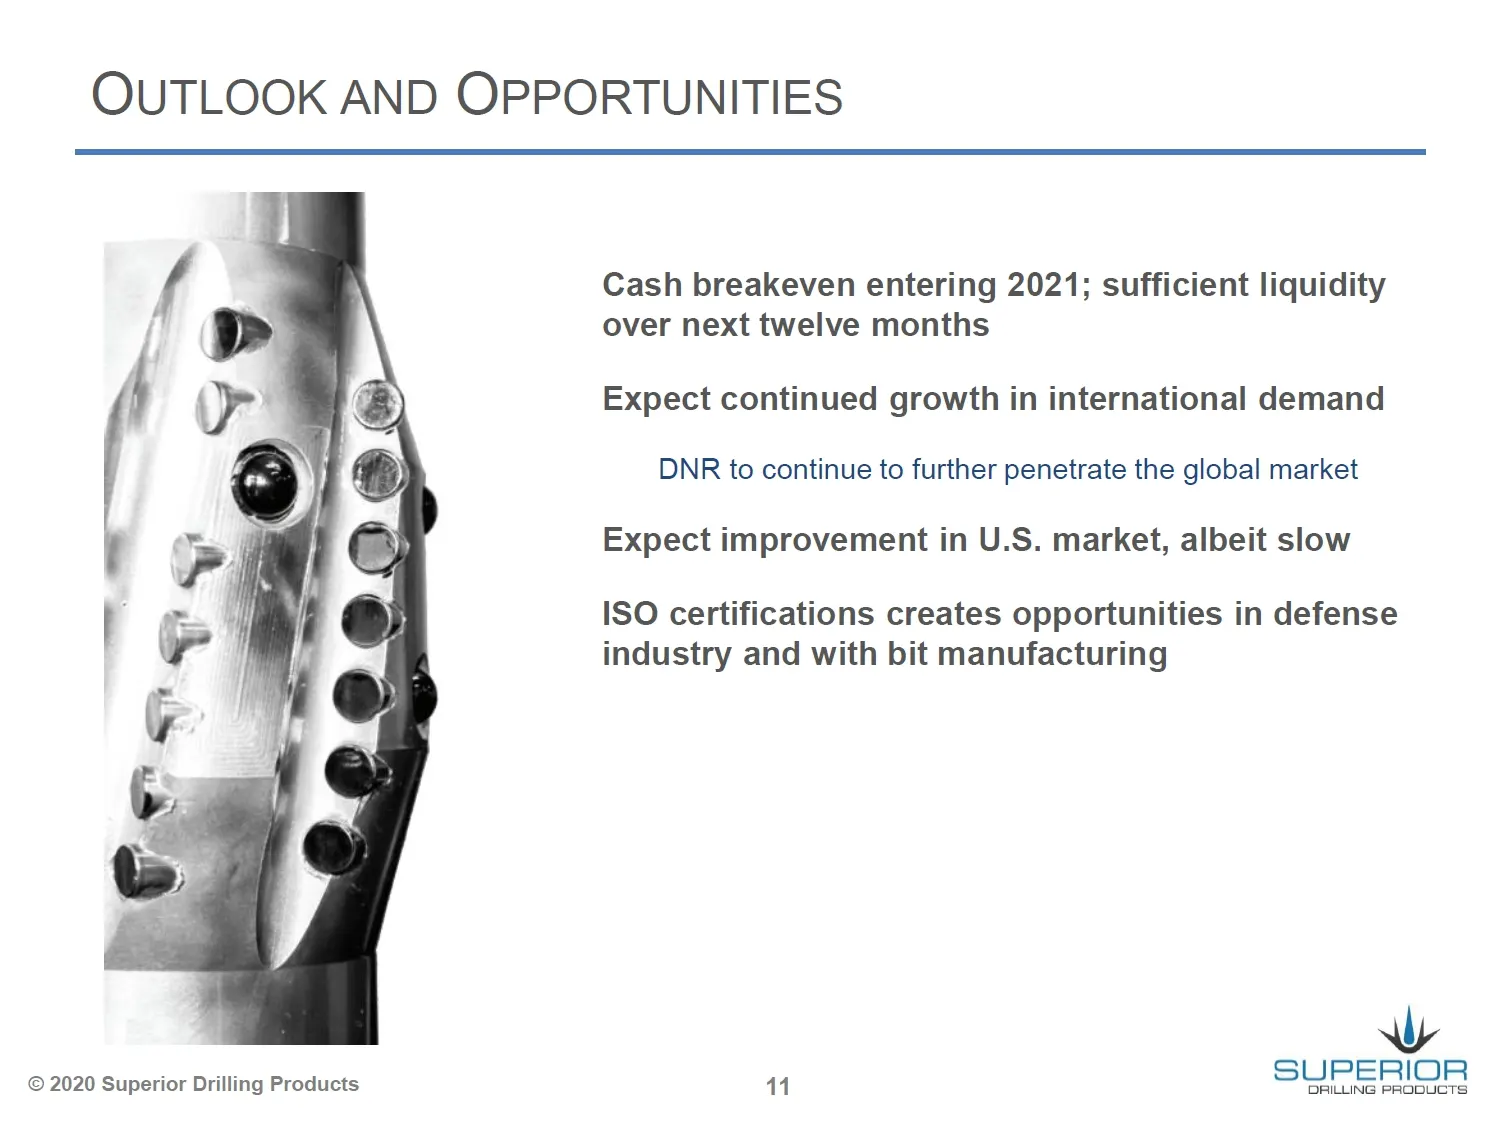
OUTLOOK AND OPPORTUNITIES Cash breakeven entering 2021; sufficient liquidity over next twelve months Expect continued growth in international demand DNR to continue to further penetrate the global market Expect improvement in U.S. market, albeit slow ISO certifications creates opportunities in defen
Slide 12: Supplemental Information
Ny SUPERIOR DRILLING PRODUCTS SUPPLEMENTAL INFORMATION © 2020 Superior Drilling Products
Slide 13: Adjusted Net Income Reconciliation
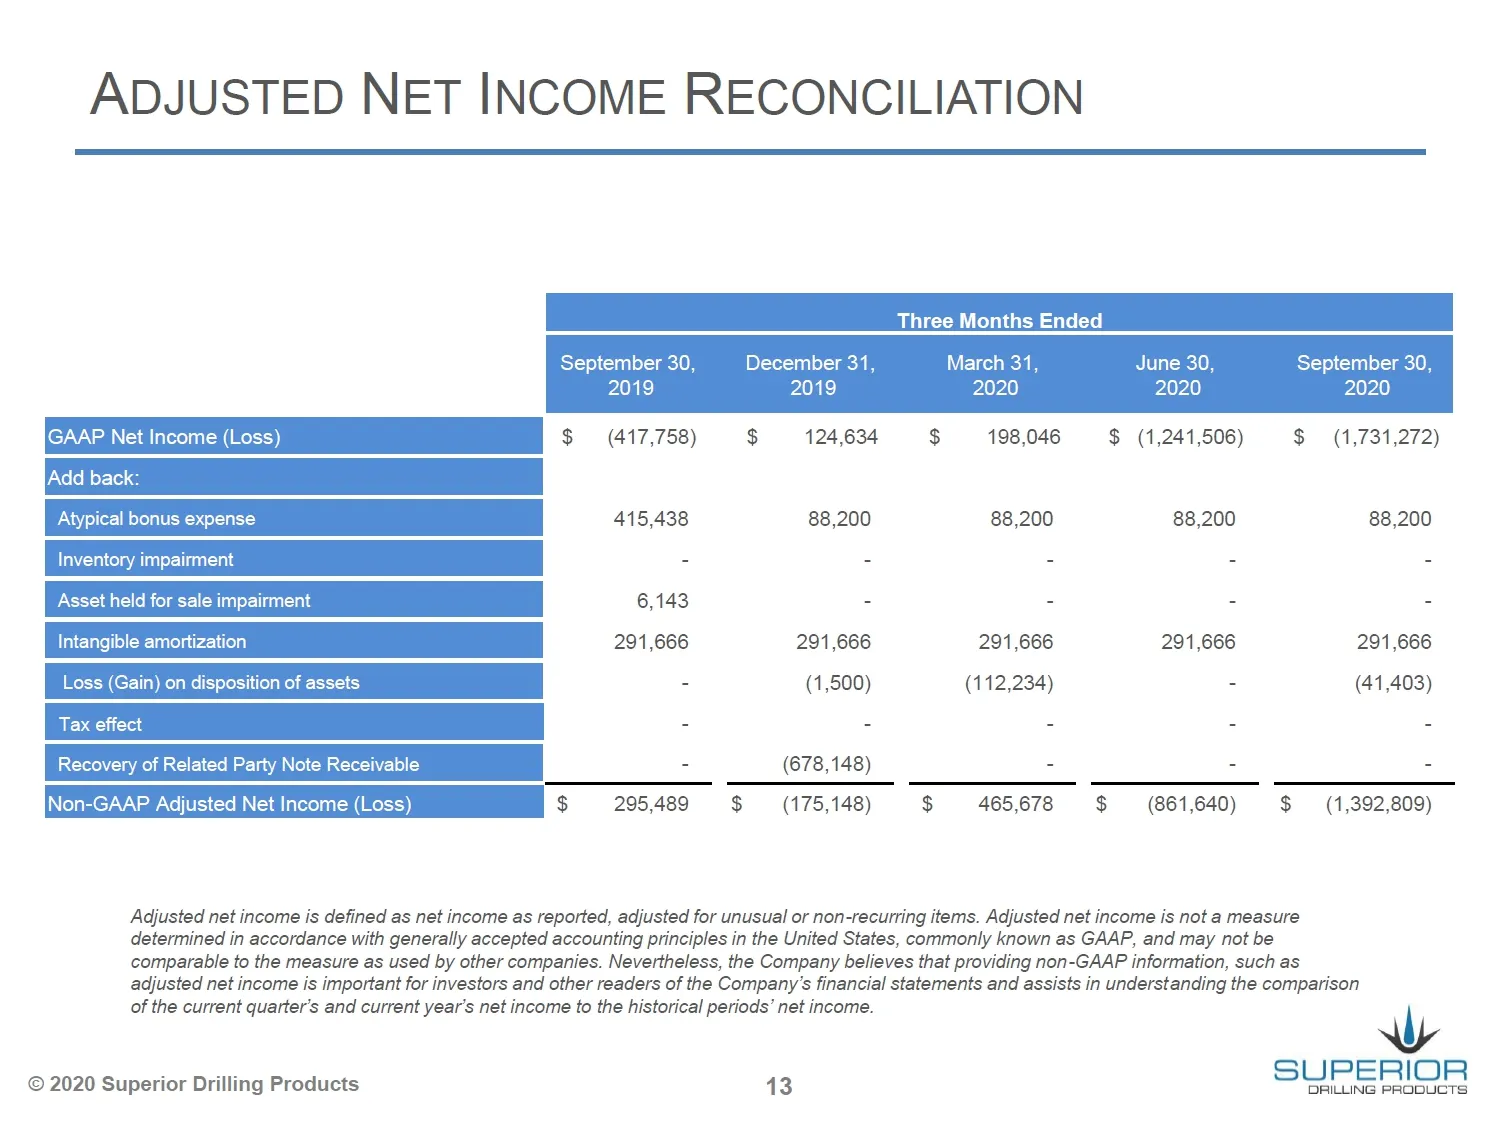
ADJUSTED NET INCOME RECONCILIATION September 30, December 31, ; L September 30, 2019 2019 2020 $ (417,758) $ 124634 $ 198,046 $ (1,241,506) $ (1,731,272) 415,438 88,200 88,200 88,200 88,200 6,143 - - - - 291,666 291,666 291,666 291,666 291,666 er) ata rae Non-GAAP Adjusted Net Income (Loss) $ 205,48
Slide 14: Adjusted Net Income Reconciliation
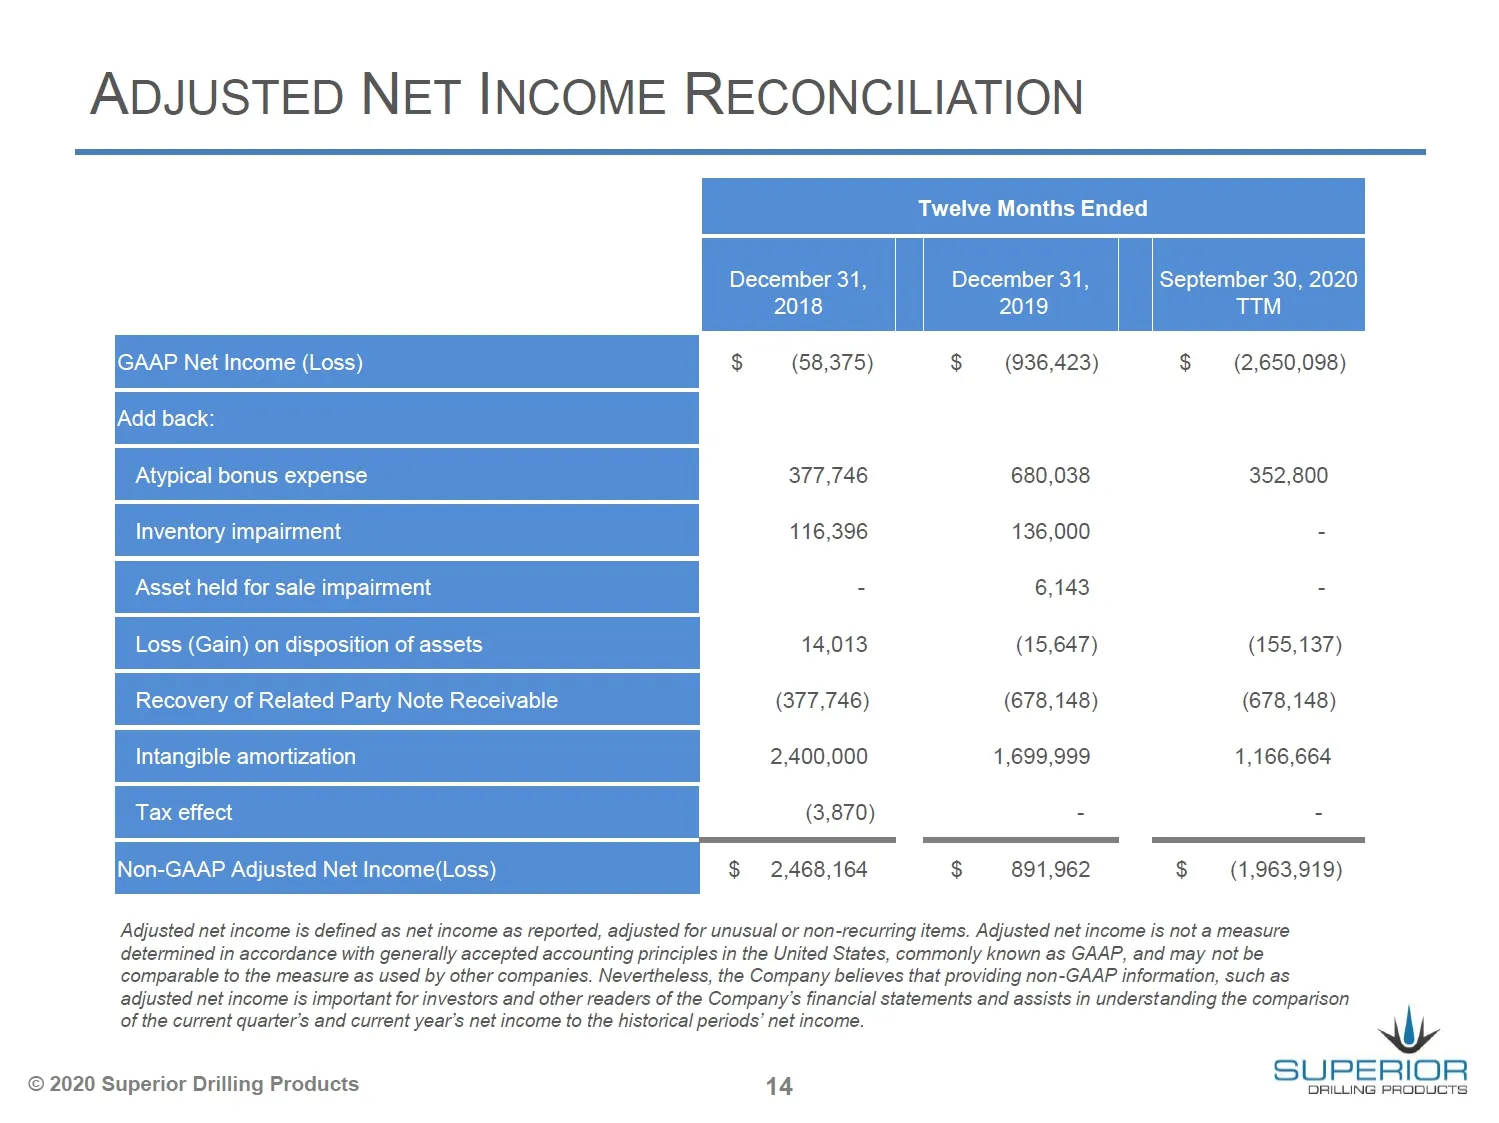
ADJUSTED NET INCOME RECONCILIATION welve M: is Ended December 31, September 30, 2020 December 31, 2018 2019 TIM $ (58,375) $ (936,423) $ (2,650,098) Loss (Gain) on disposition of assets 14,013 (15,647) (155,137) Recovery of Related Party Note Receivable (377,746) (678,148) (678,148) Tax effect (3,87
Slide 15: Adjusted EBITDA Reconciliation
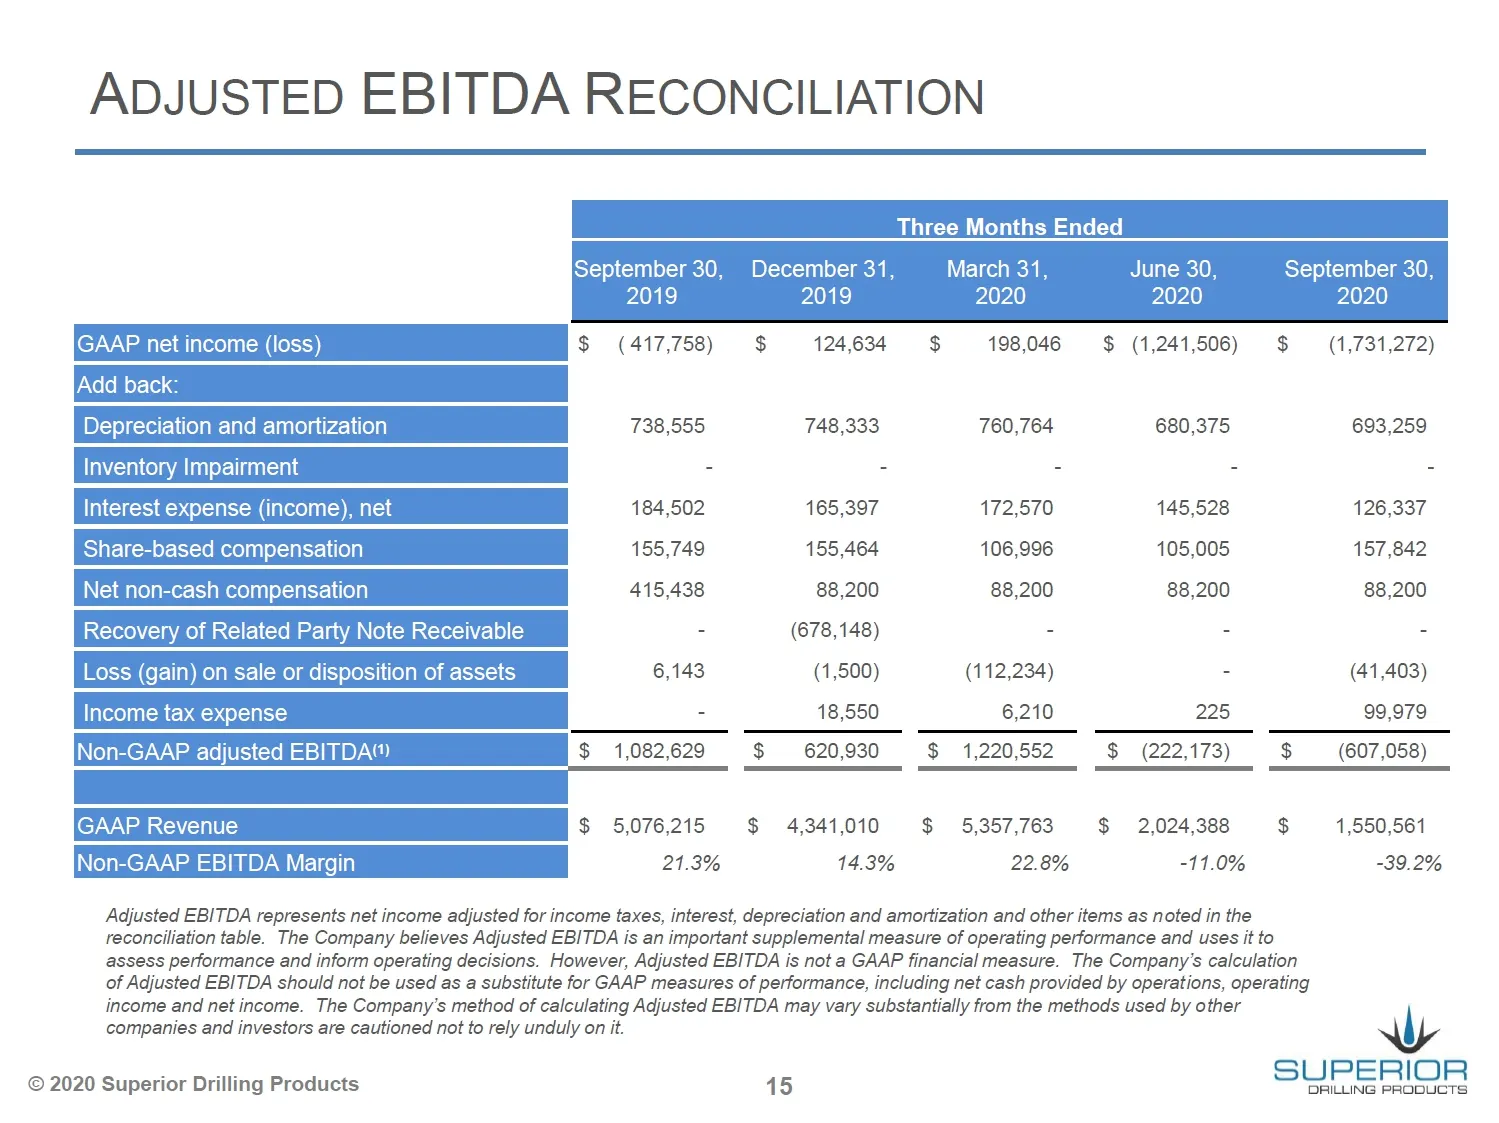
ADJUSTED EBITDA RECONCILIATION September 30, December 31, March 31, September 30, 2019 2019 2020 2020 GAAP net income (loss) $ (417,758) $ 124,634 $ 198,046 $ (1,241,506) $ (1,731,272) Add back: Depreciation and amortizati 738,555 748,333 760,764 680,375 693,259 Inventory Imp: 7 7 . 7 . Interest exp
Slide 16: Adjusted EBITDA Reconciliation
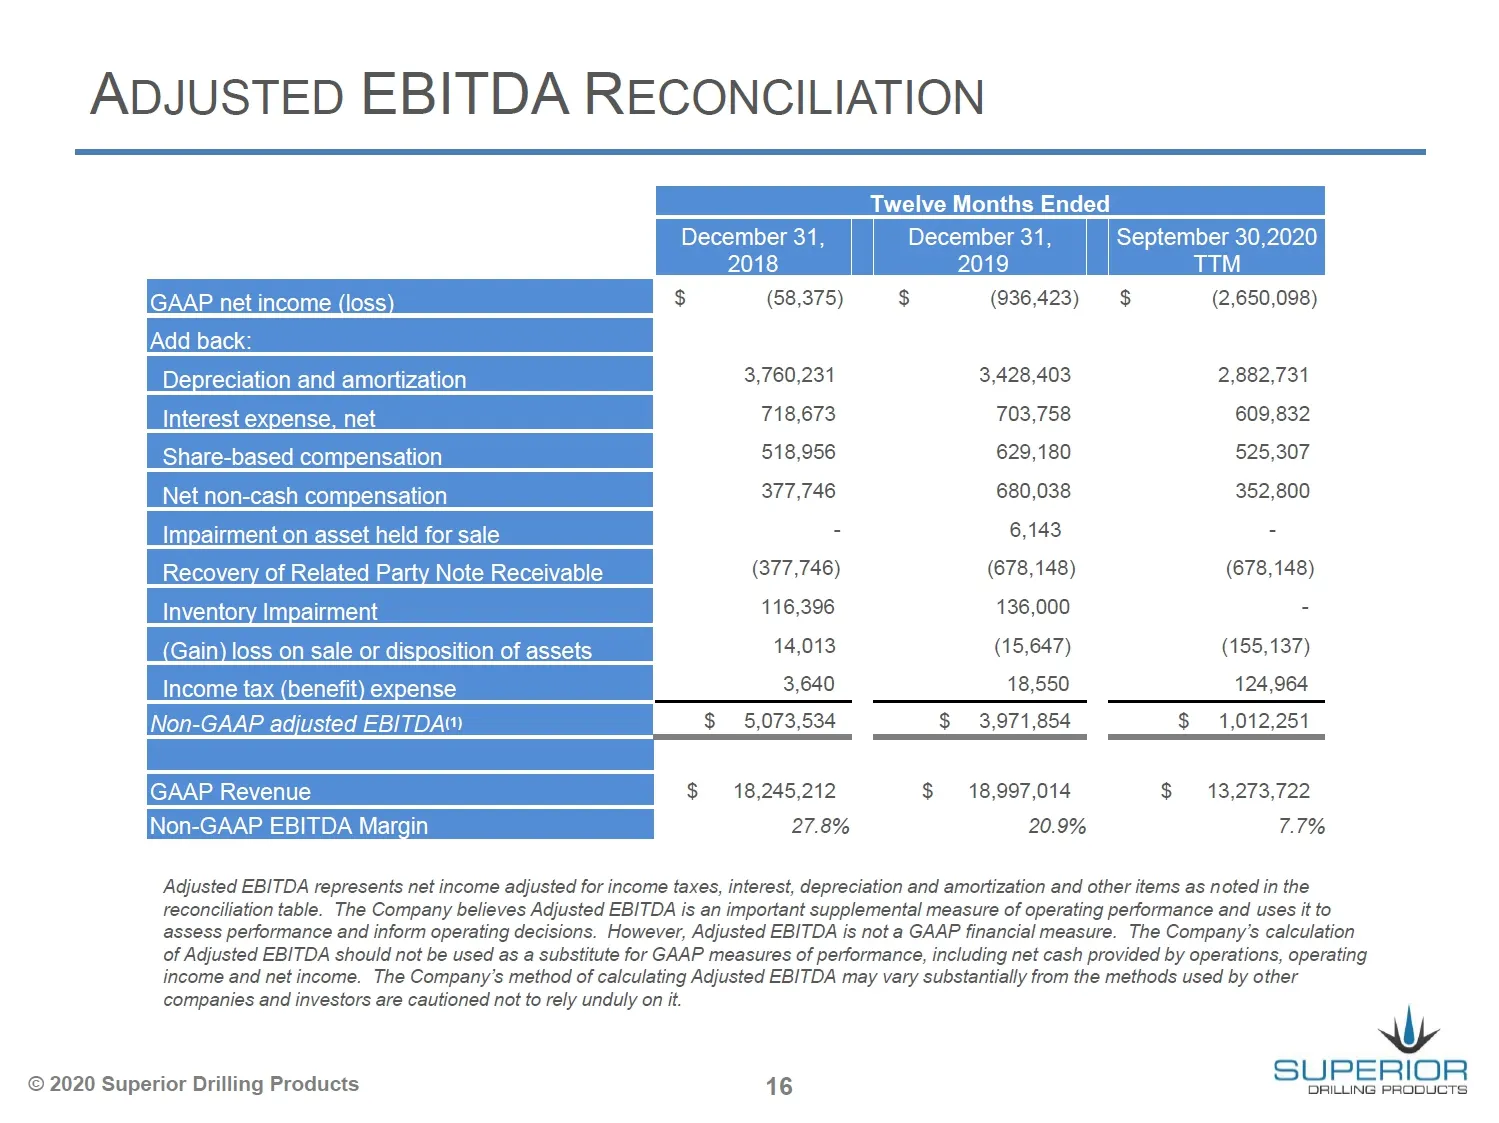
ADJUSTED EBITDA RECONCILIATION elve Months Ended December 31 | December 31 September 30,20: 2018 2019 TT GAAP net income (loss $ (58,375) $ (936,423) $ (2,650,098) 3,760,231 3,428,403 2,882,731 718,673 703,758 609,832 518,956 629,180 525,307 377,746 680,038 352,800 - 6,143 - (377,746) (678,148) (678
Source: SEC EDGAR · 8-K filed Nov 6, 2020
More decks from Superior Drilling Products Inc
 Q3 2023 Earnings Presentation12 slides · Nov 9, 2023
 Q2 2023 Earnings Presentation12 slides · Aug 14, 2023
 Q1 2023 Earnings Presentation12 slides · May 15, 2023
 FY2022 Earnings Presentation13 slides · Mar 10, 2023
 Q3 2022 Earnings Presentation12 slides · Nov 14, 2022
 MicroCap Rodeo Windy City Roundup 202220 slides · Oct 12, 2022