Hellenic Telecommunications Organization SA · ATHEX:HTO
Hellenic Telecommunications Organization SA — Cosmote — H1 2006 Earnings Presentation
21 slides from Hellenic Telecommunications Organization SA's earnings presentation, August 2006
Slide 1: 1st Half 2006 Results: Growth Dynamics with Strong Financial Performance
1st HALF 2006 RESULTS: GROWTH DYNAMICS WITH STRONG FINANCIAL PERFORMANCE August 2006 Visit our website: www.cosmote.com
Slide 2: Operational & Financial Review: Consolidated Performance
Operational & Financial Review Consolidated Performance
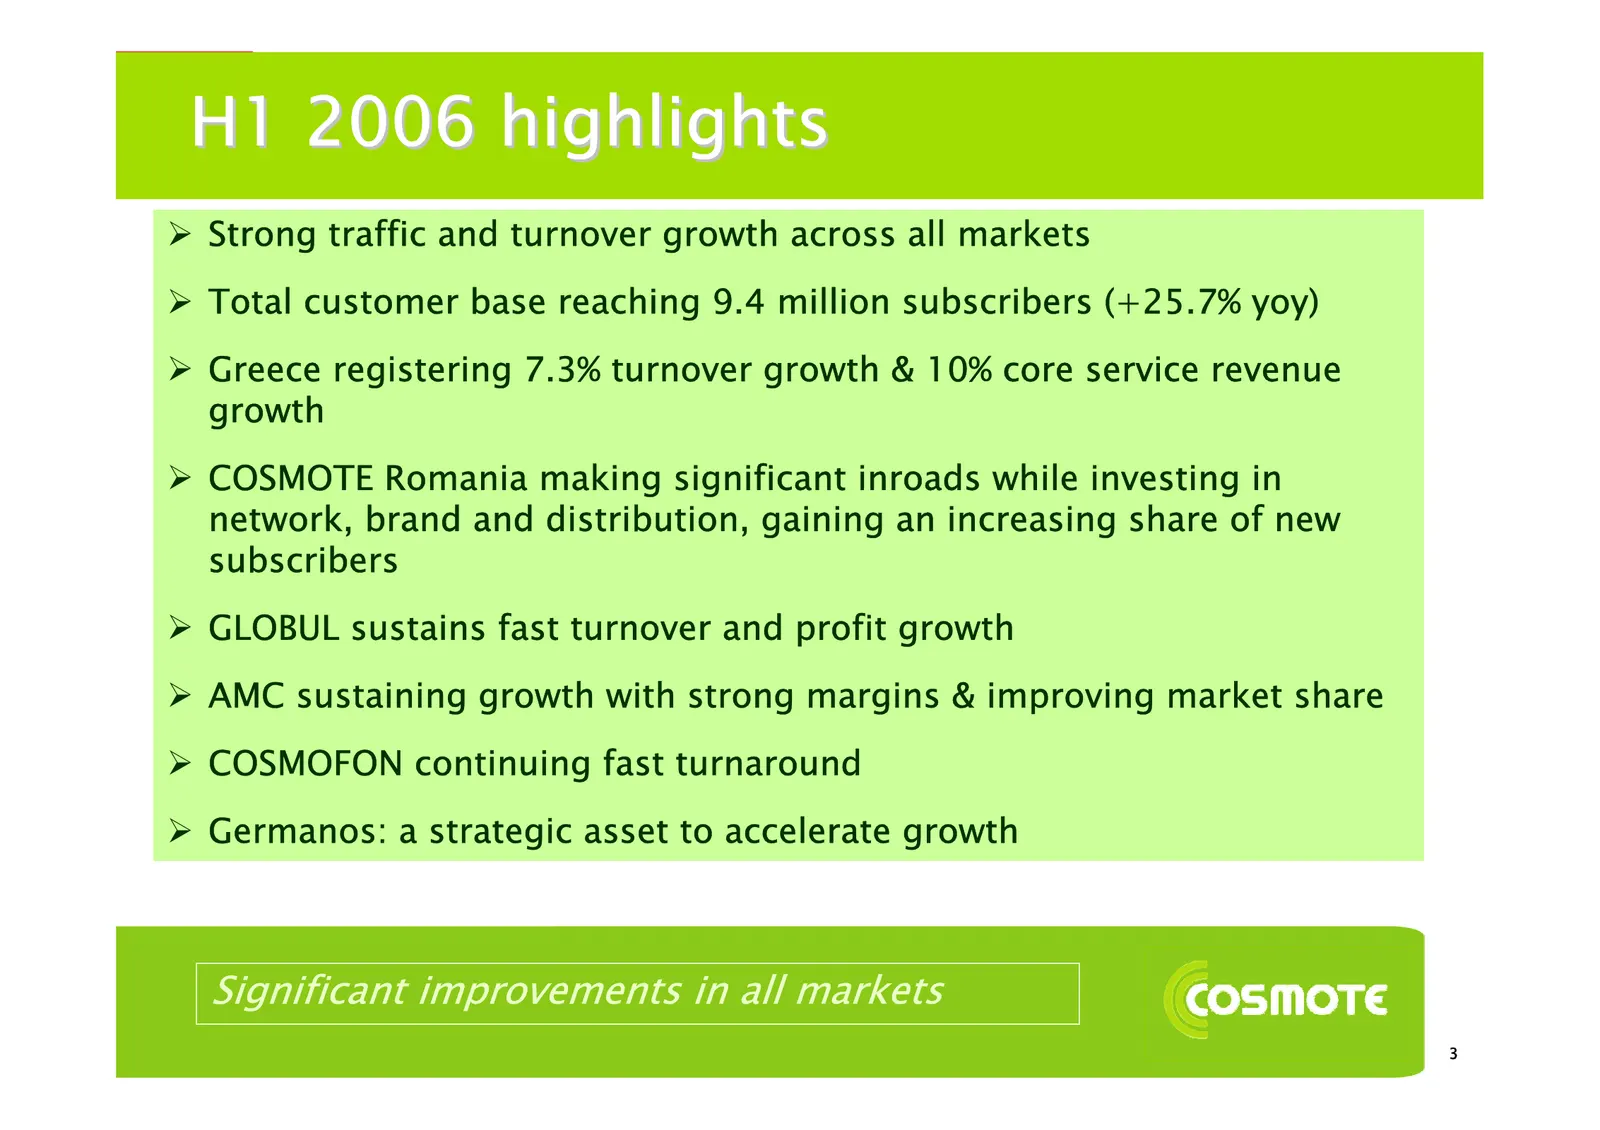
Slide 3: H1 2006 highlights
H1 2006 highlights ¾ Strong traffic and turnover growth across all markets ¾ Total customer base reaching 9.4 million subscribers (+25.7% yoy) ¾ Greece registering 7.3% turnover growth & 10% core service revenue growth ¾ COSMOTE Romania making significant inroads while investing in network, brand an
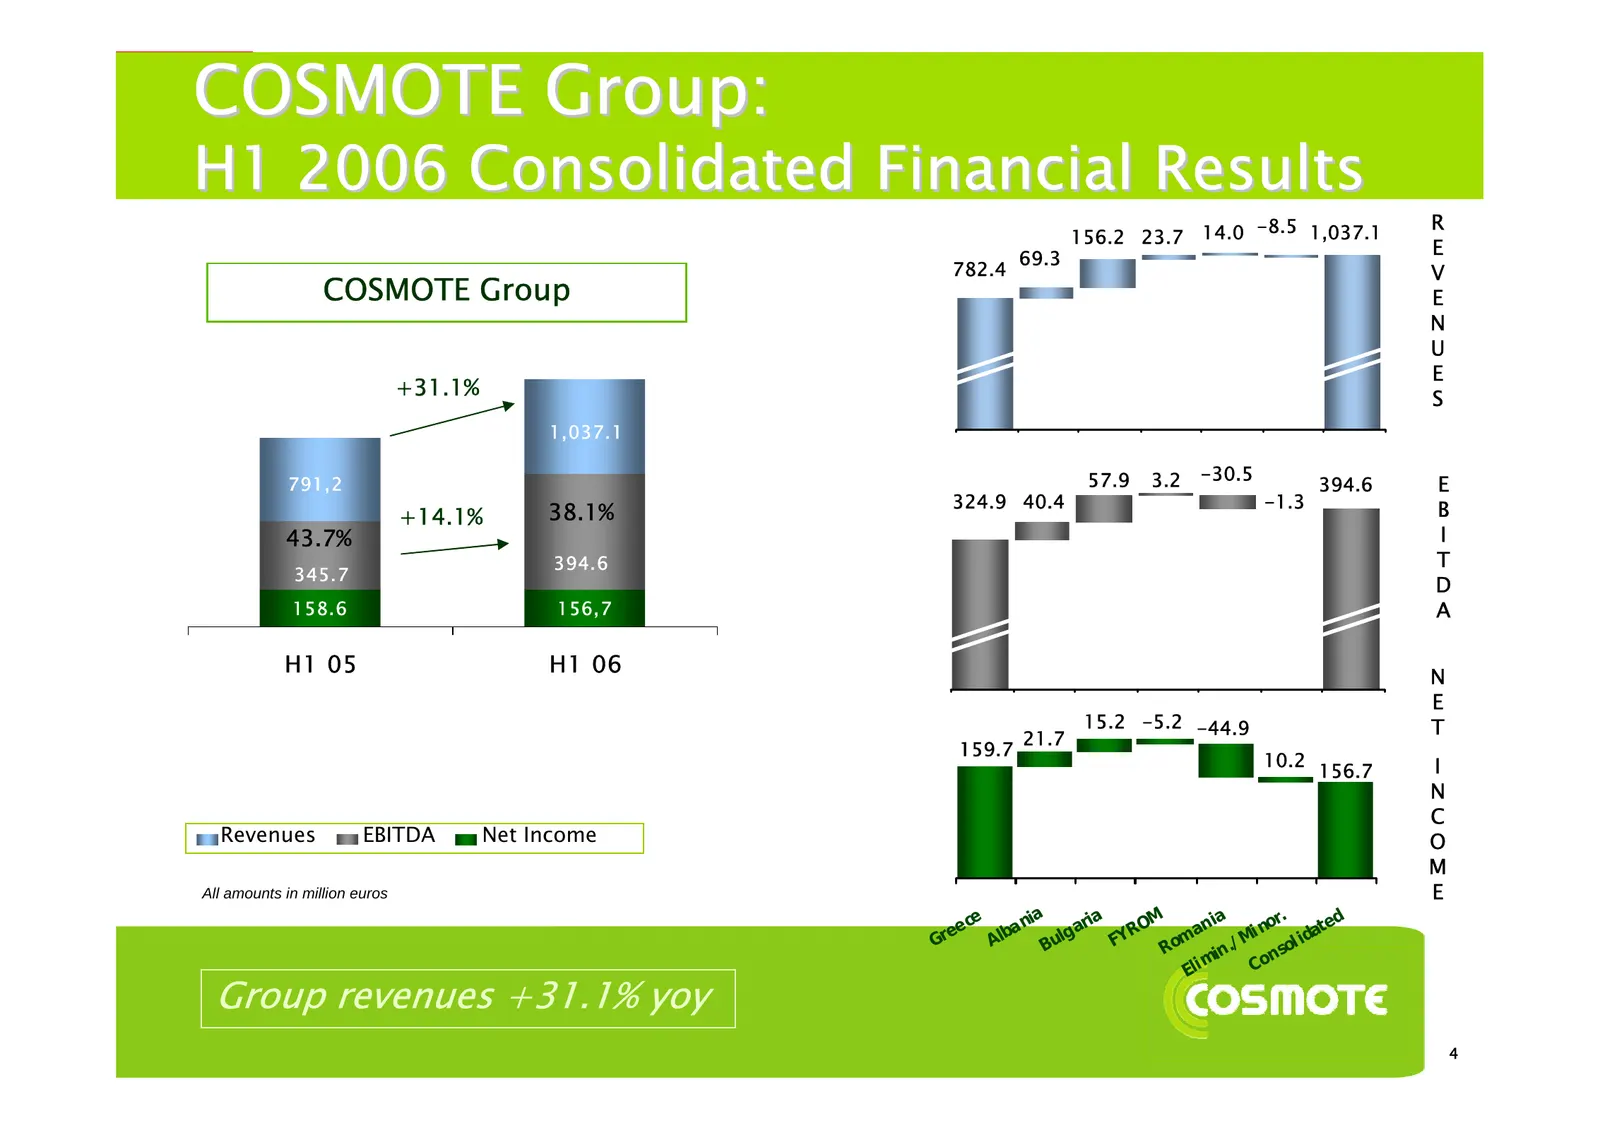
Slide 4: COSMOTE Group: H1 2006 Consolidated Financial Results
COSMOTE Group: H1 2006 Consolidated Financial Results -8.5 1,037.1 R 156.2 23.7 14.0 69.3 E 782.4 V COSMOTE Group E N U E +31.1% S 1,037.1 Greece Alb an ia Bu lg aria FYROM Roman ia Elimin ation s Con solid ated 57.9 3.2 -30.5 791,2 394.6 E 324.9 40.4 -1.3 B +14.1% 38.1% 43.7% I 394.6 T 345.7 D 158.
Slide 5: COSMOTE Group: Summary Income Statement
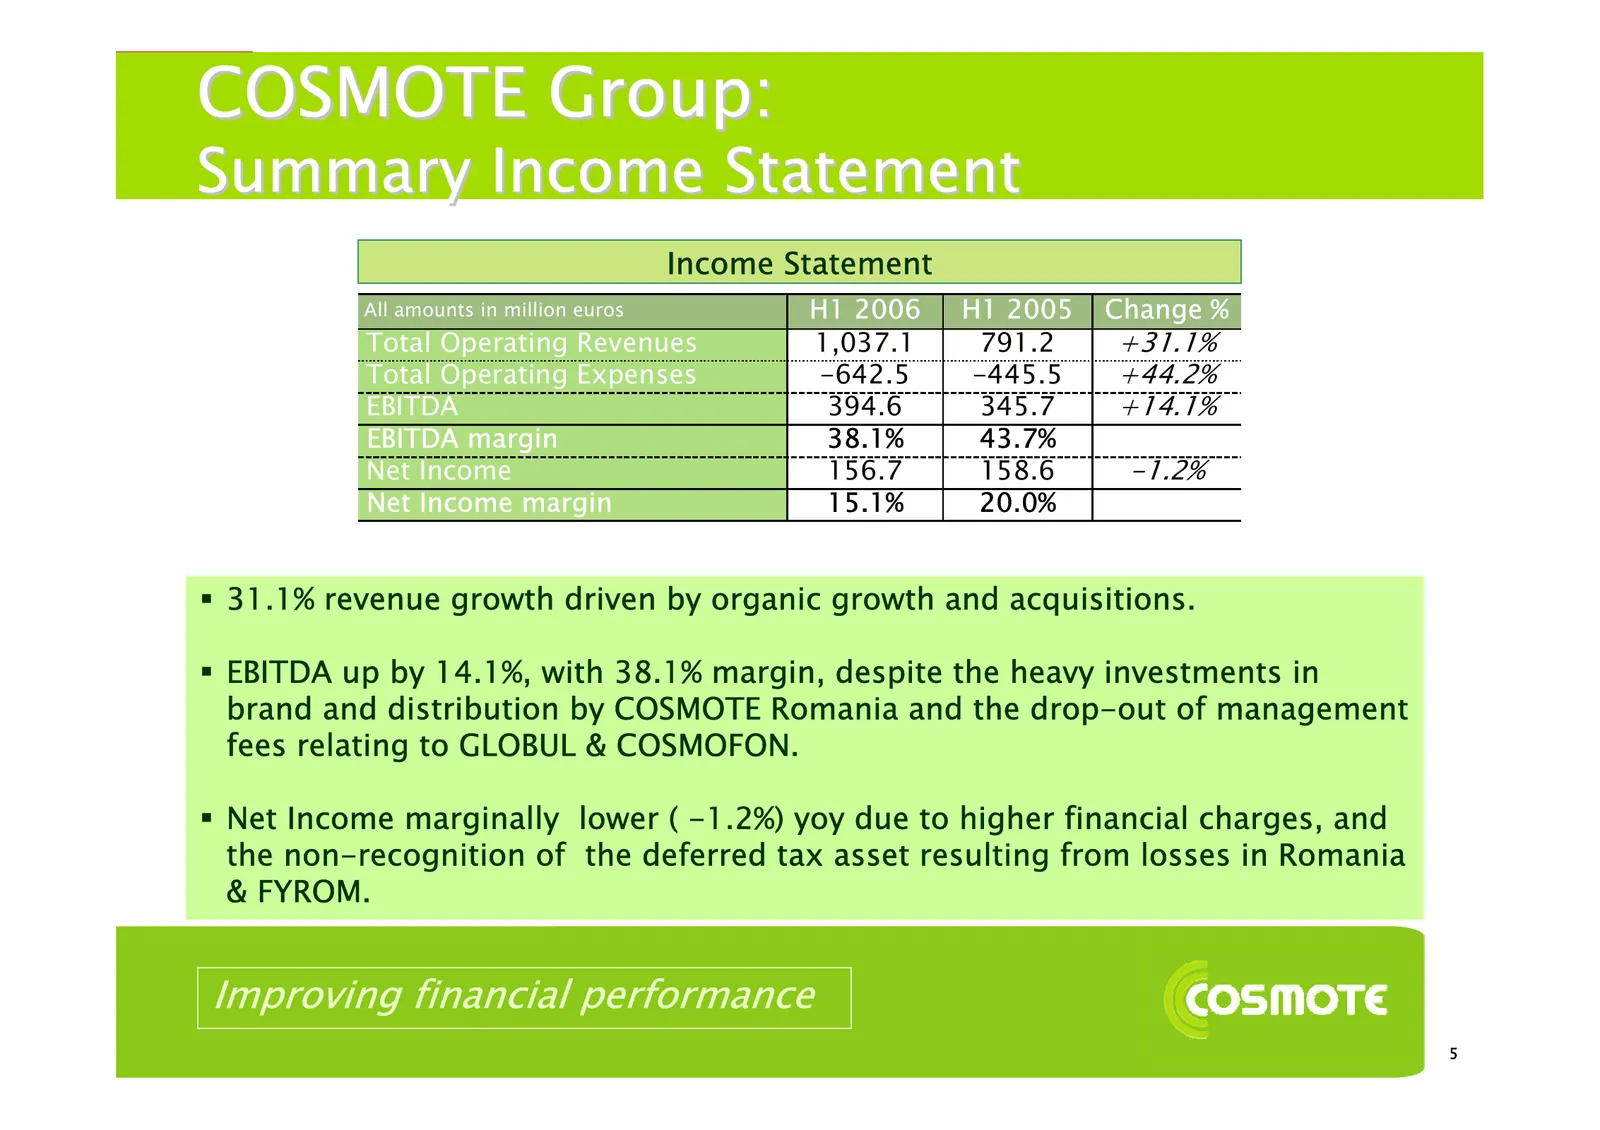
COSMOTE Group: Summary Income Statement Income Statement All amounts in million euros H1 2006 H1 2005 Change % Total Operating Revenues 1,037.1 791.2 +31.1% Total Operating Expenses -642.5 -445.5 +44.2% EBITDA 394.6 345.7 +14.1% EBITDA margin 38.1% 43.7% Net Income 156.7 158.6 -1.2% Net Income margi
Slide 6: Operational & Financial Review by Market
Operational & Financial Review by Market
Slide 7: COSMOTE Greece
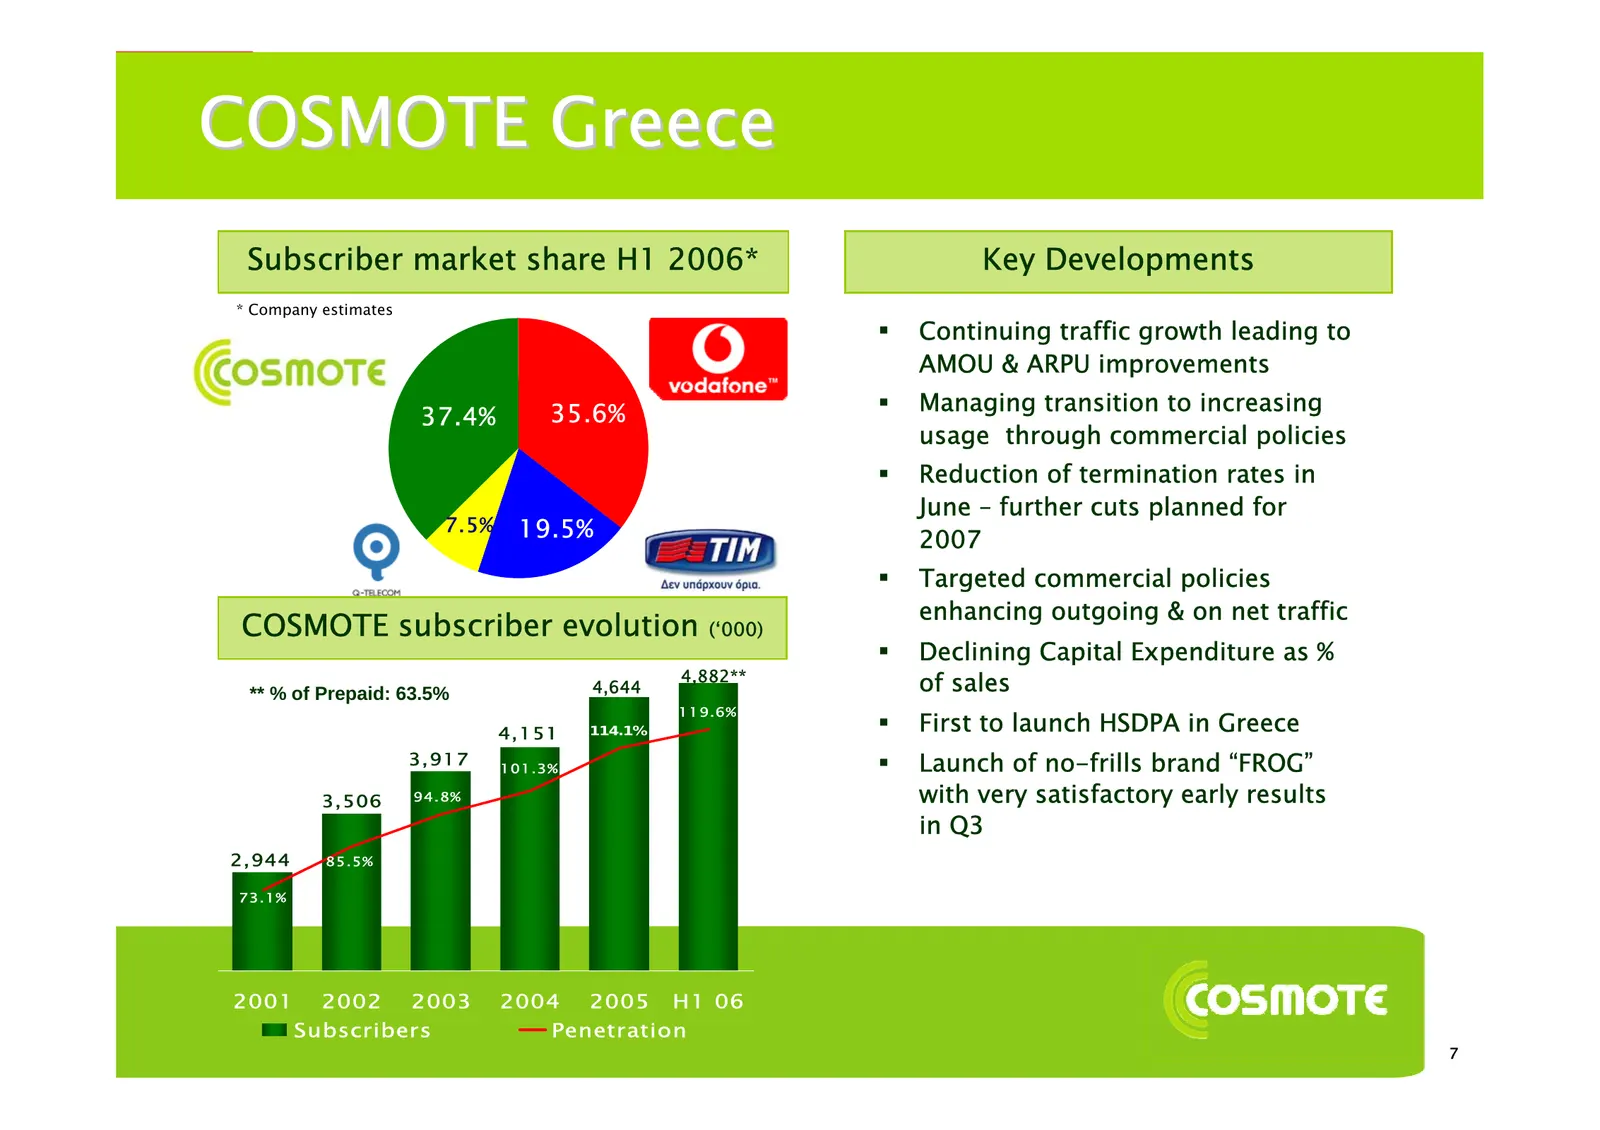
COSMOTE Greece Subscriber market share H1 2006* Key Developments * Company estimates Continuing traffic growth leading to AMOU & ARPU improvements 35.6% Managing transition to increasing 37.4% usage through commercial policies Reduction of termination rates in June – further cuts planned for 7
Slide 8: COSMOTE Greece
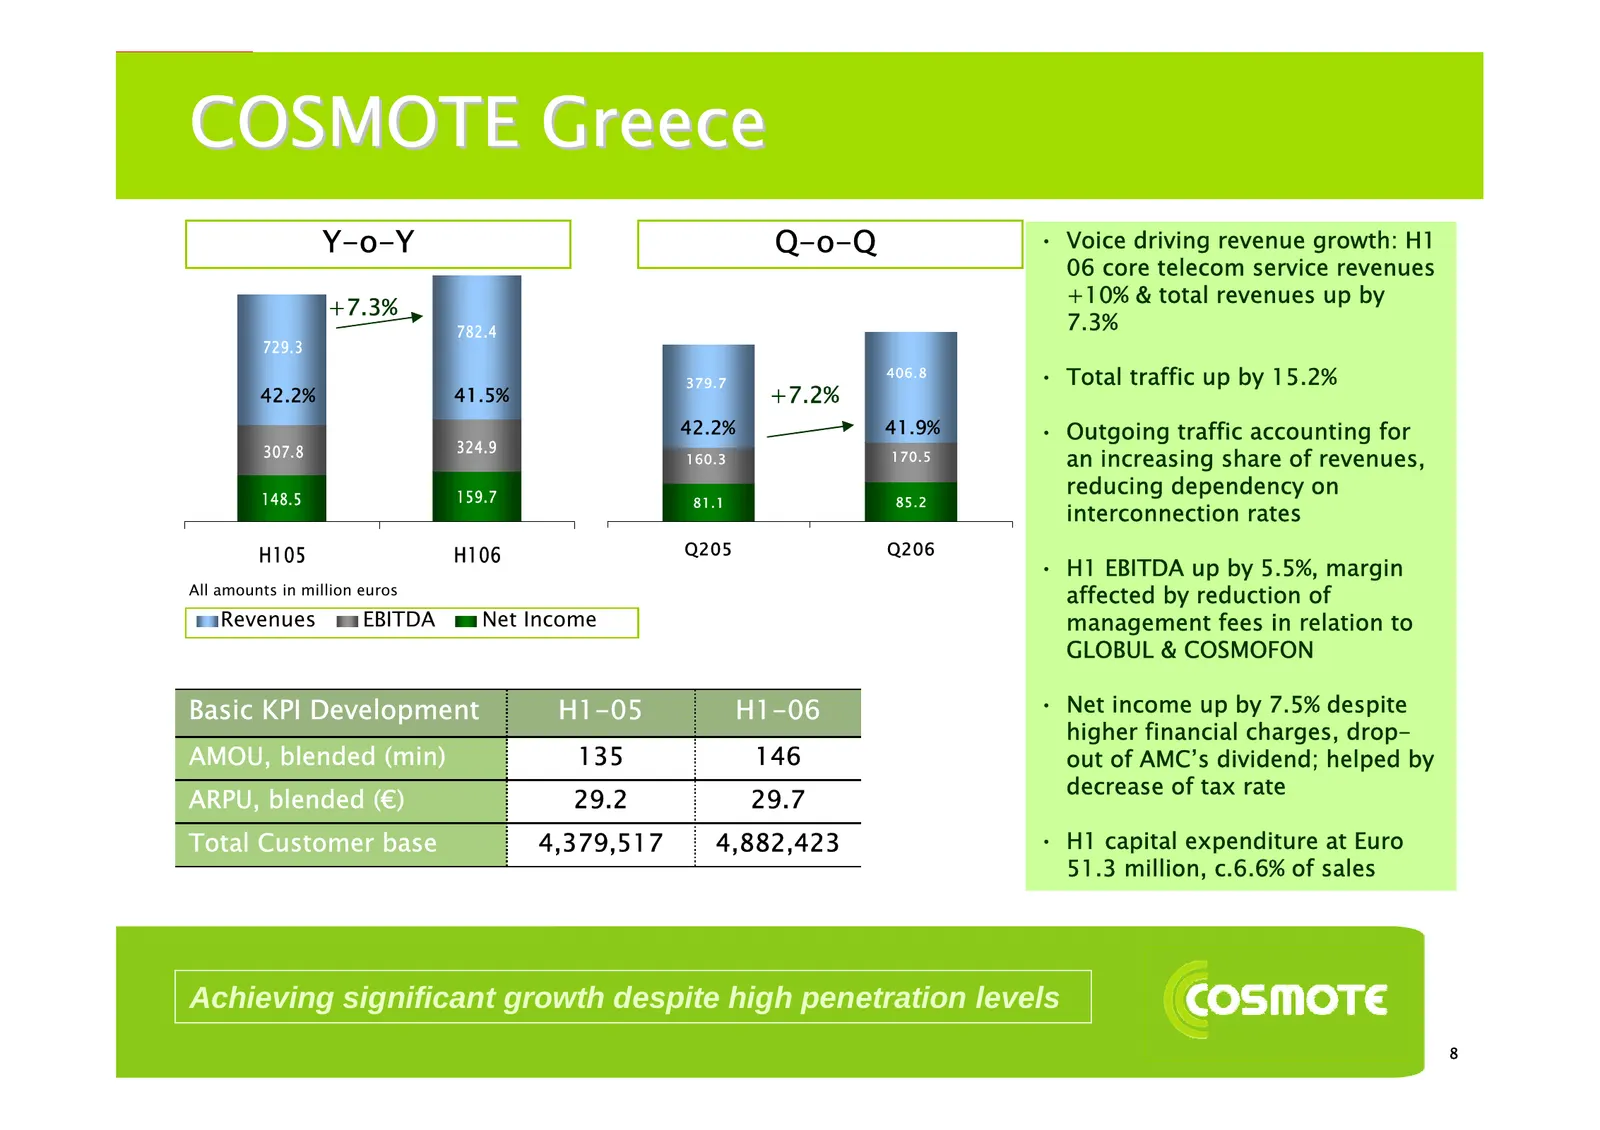
COSMOTE Greece Y-o-Y Q-o-Q • Voice driving revenue growth: H1 06 core telecom service revenues +10% & total revenues up by +7.3% 782.4 7.3% 729.3 379.7 406.8 • Total traffic up by 15.2% 42.2% 41.5% +7.2% 42.2% 41.9% • Outgoing traffic accounting for 307.8 324.9 160.3 170.5 an increasing share of rev
Slide 9: COSMOTE Greece: Regulatory developments
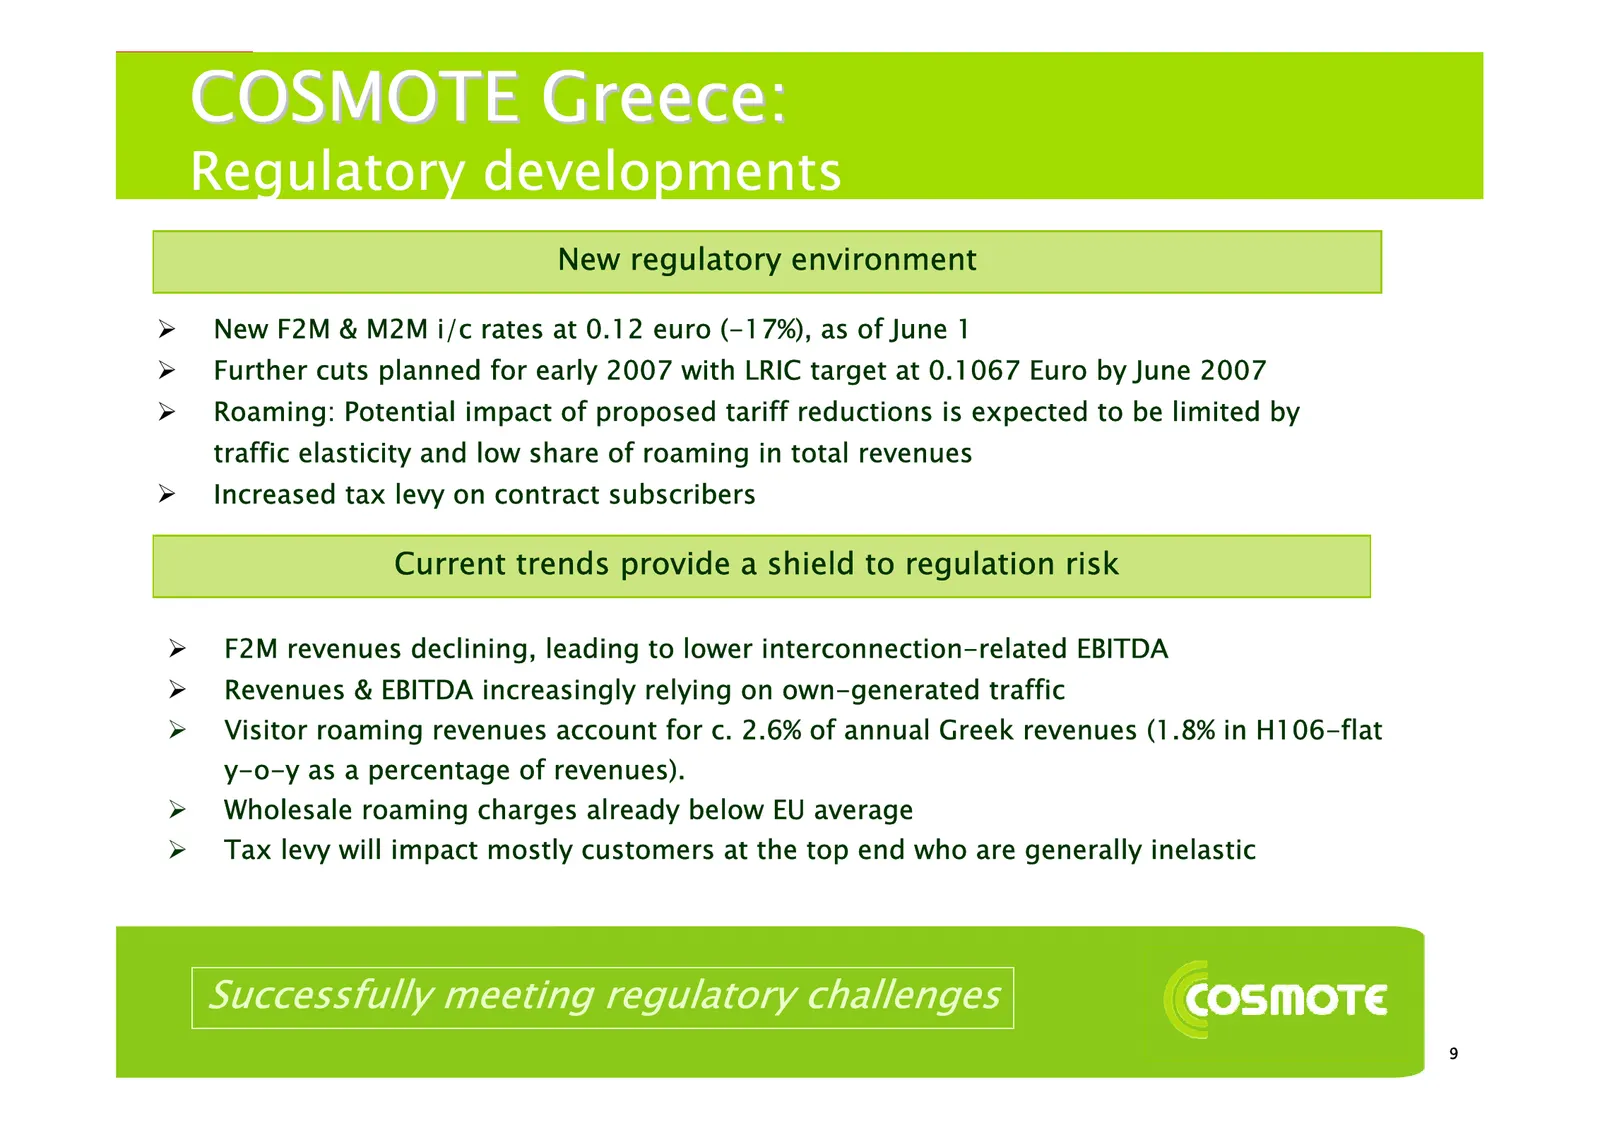
COSMOTE Greece: Regulatory developments New regulatory environment ¾ New F2M & M2M i/c rates at 0.12 euro (-17%), as of June 1 ¾ Further cuts planned for early 2007 with LRIC target at 0.1067 Euro by June 2007 ¾ Roaming: Potential impact of proposed tariff reductions is expected to be limited by tra
Slide 10: COSMOTE Greece: Traffic patterns & Interconnection impact
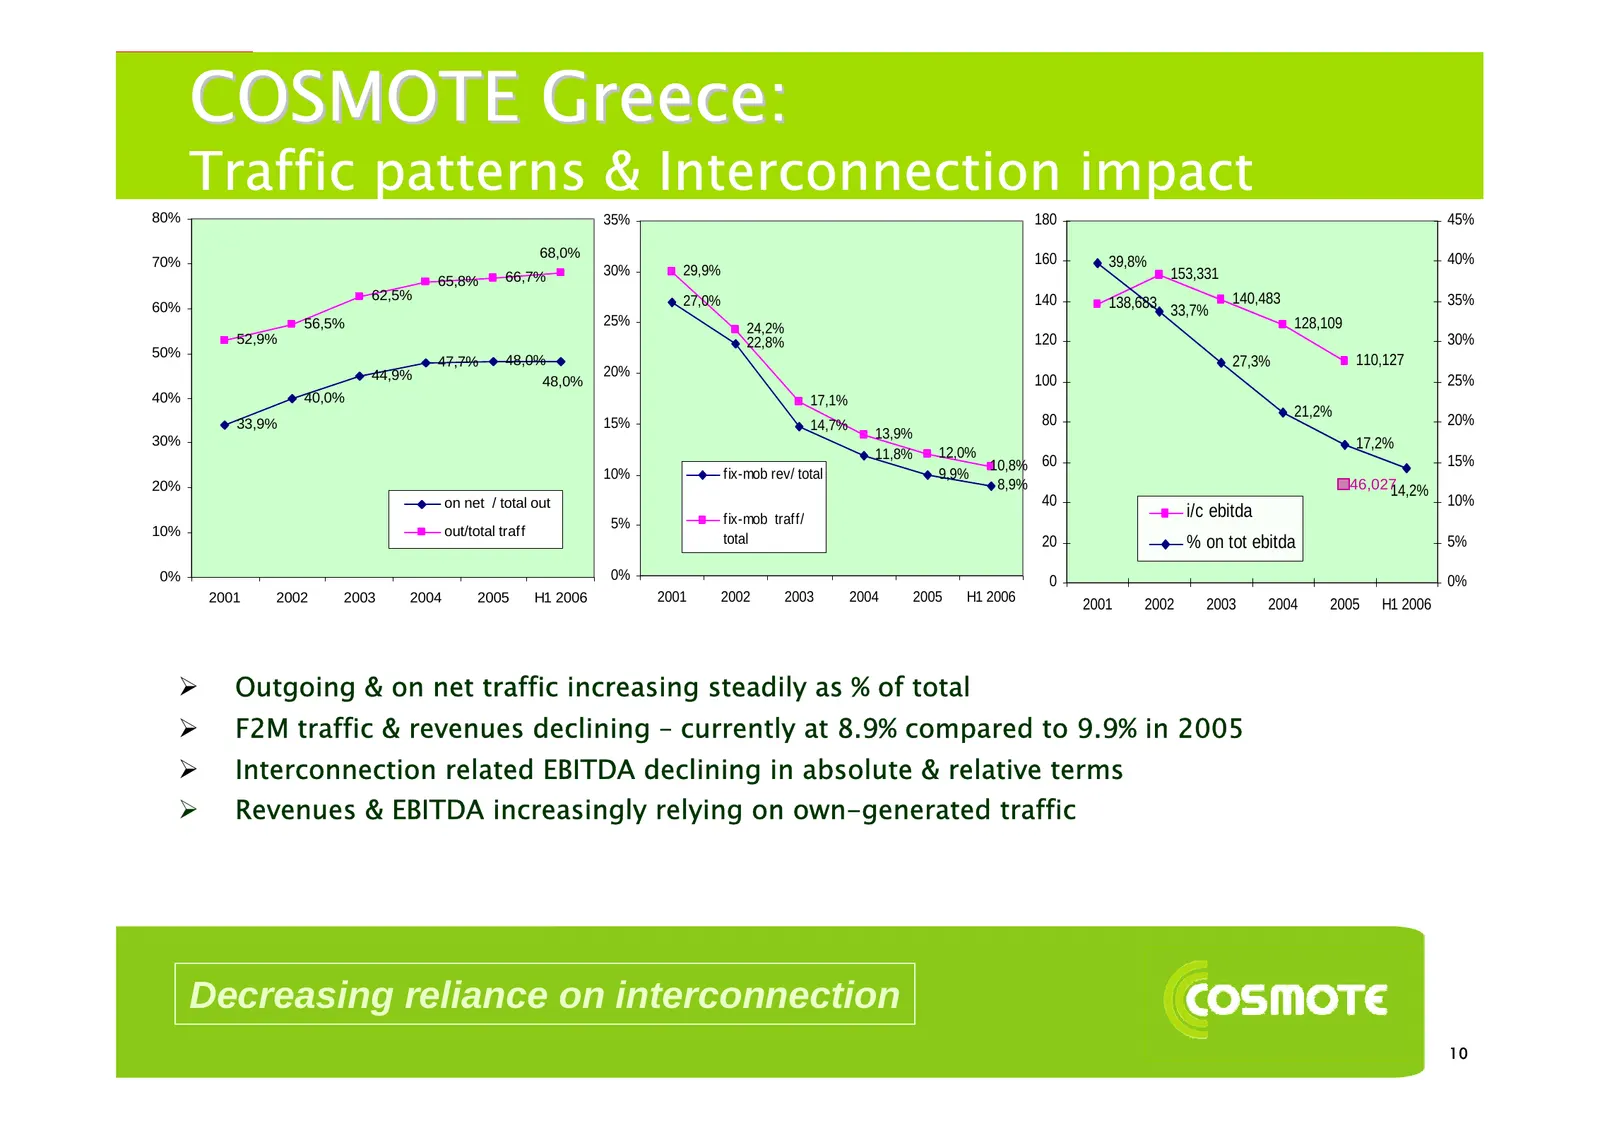
COSMOTE Greece: Traffic patterns & Interconnection impact 80% 35% 180 45% 68,0% 160 40% 70% 39,8% 66,7% 30% 29,9% 153,331 65,8% 62,5% 27,0% 140 140,483 35% 60% 138,683 33,7% 56,5% 25% 128,109 24,2% 52,9% 22,8% 120 30% 50% 47,7% 48,0% 27,3% 110,127 44,9% 20% 48,0% 100 25% 40% 40,0% 17,1% 21,2% 33,9%
Slide 11: AMC
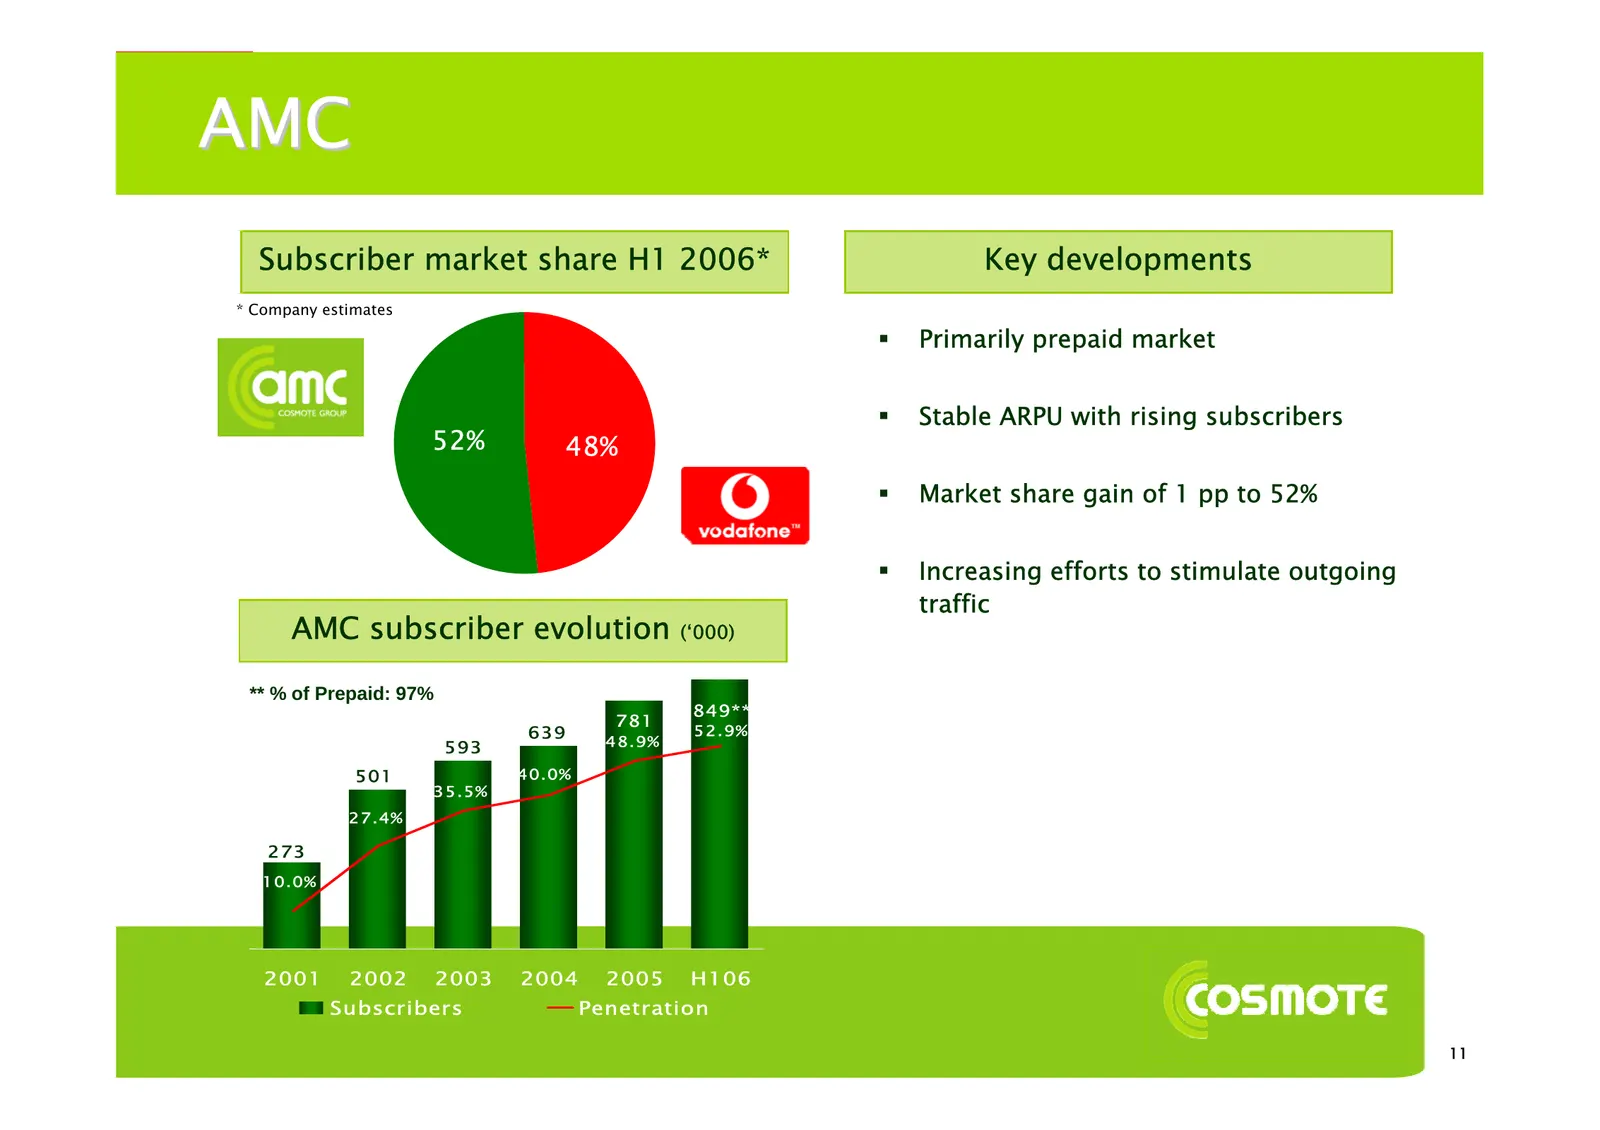
AMC Subscriber market share H1 2006* Key developments * Company estimates Primarily prepaid market Stable ARPU with rising subscribers 52% 48% Market share gain of 1 pp to 52% Increasing efforts to stimulate outgoing traffic AMC subscriber evolution (‘000) ** % of Prepaid: 97% 849** 781 639
Slide 12: AMC
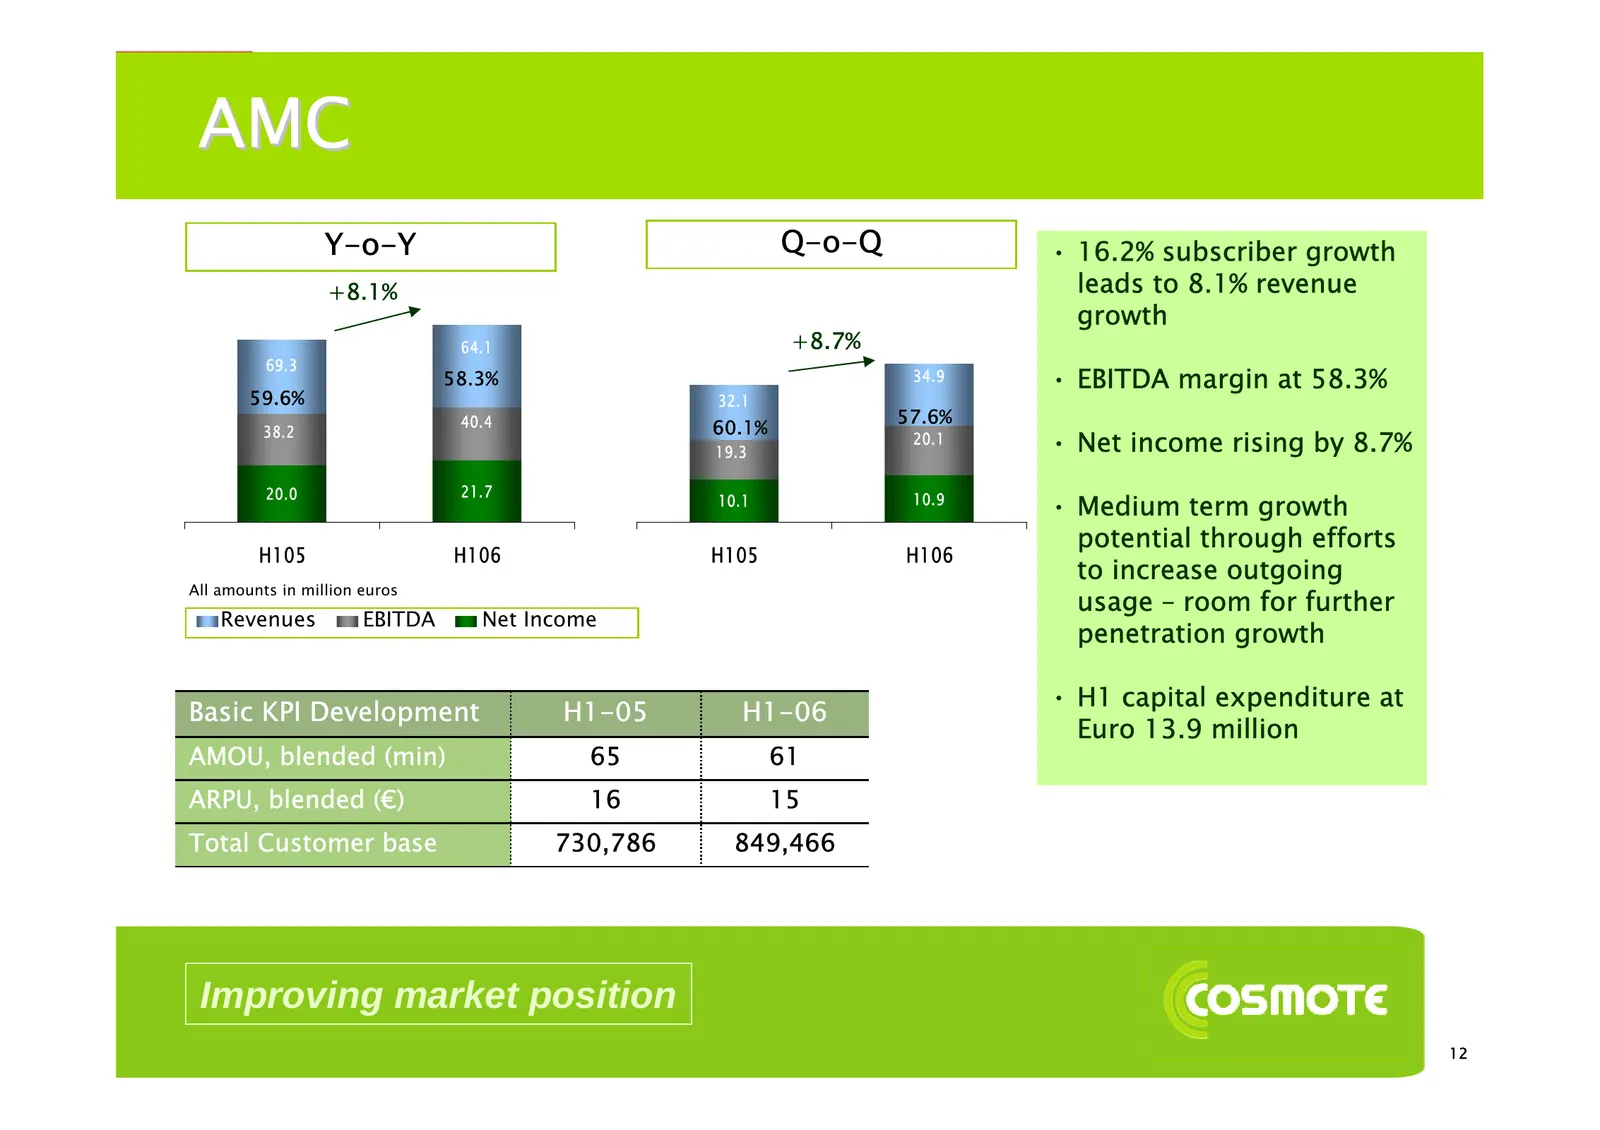
AMC Y-o-Y Q-o-Q • 16.2% subscriber growth +8.1% leads to 8.1% revenue growth 64.1 +8.7% 69.3 58.3% 34.9 • EBITDA margin at 58.3% 59.6% 32.1 40.4 57.6% 38.2 60.1% 19.3 20.1 • Net income rising by 8.7% 20.0 21.7 10.1 10.9 • Medium term growth potential through efforts H105 H106 H105 H106 to increase o
Slide 13: GLOBUL
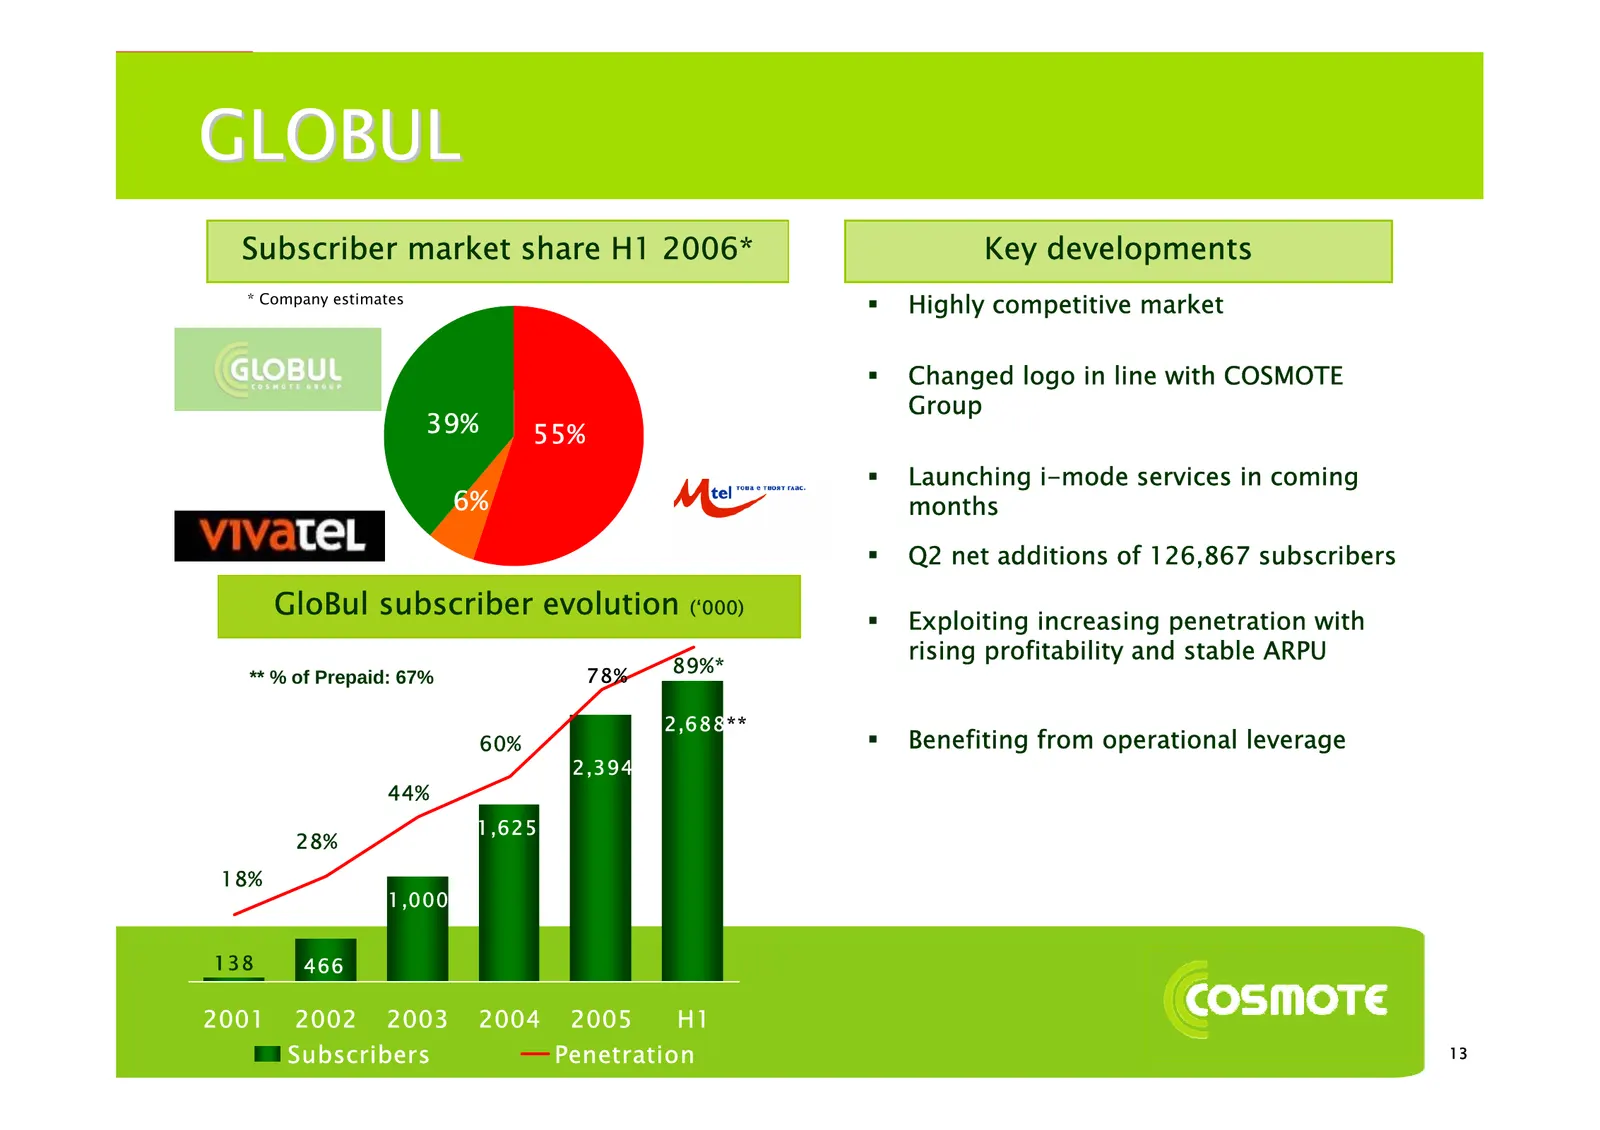
GLOBUL Subscriber market share H1 2006* Key developments * Company estimates Highly competitive market Changed logo in line with COSMOTE Group 39% 55% Launching i-mode services in coming 6% months Q2 net additions of 126,867 subscribers GloBul subscriber evolution (‘000) Exploiting increas
Slide 14: GLOBUL
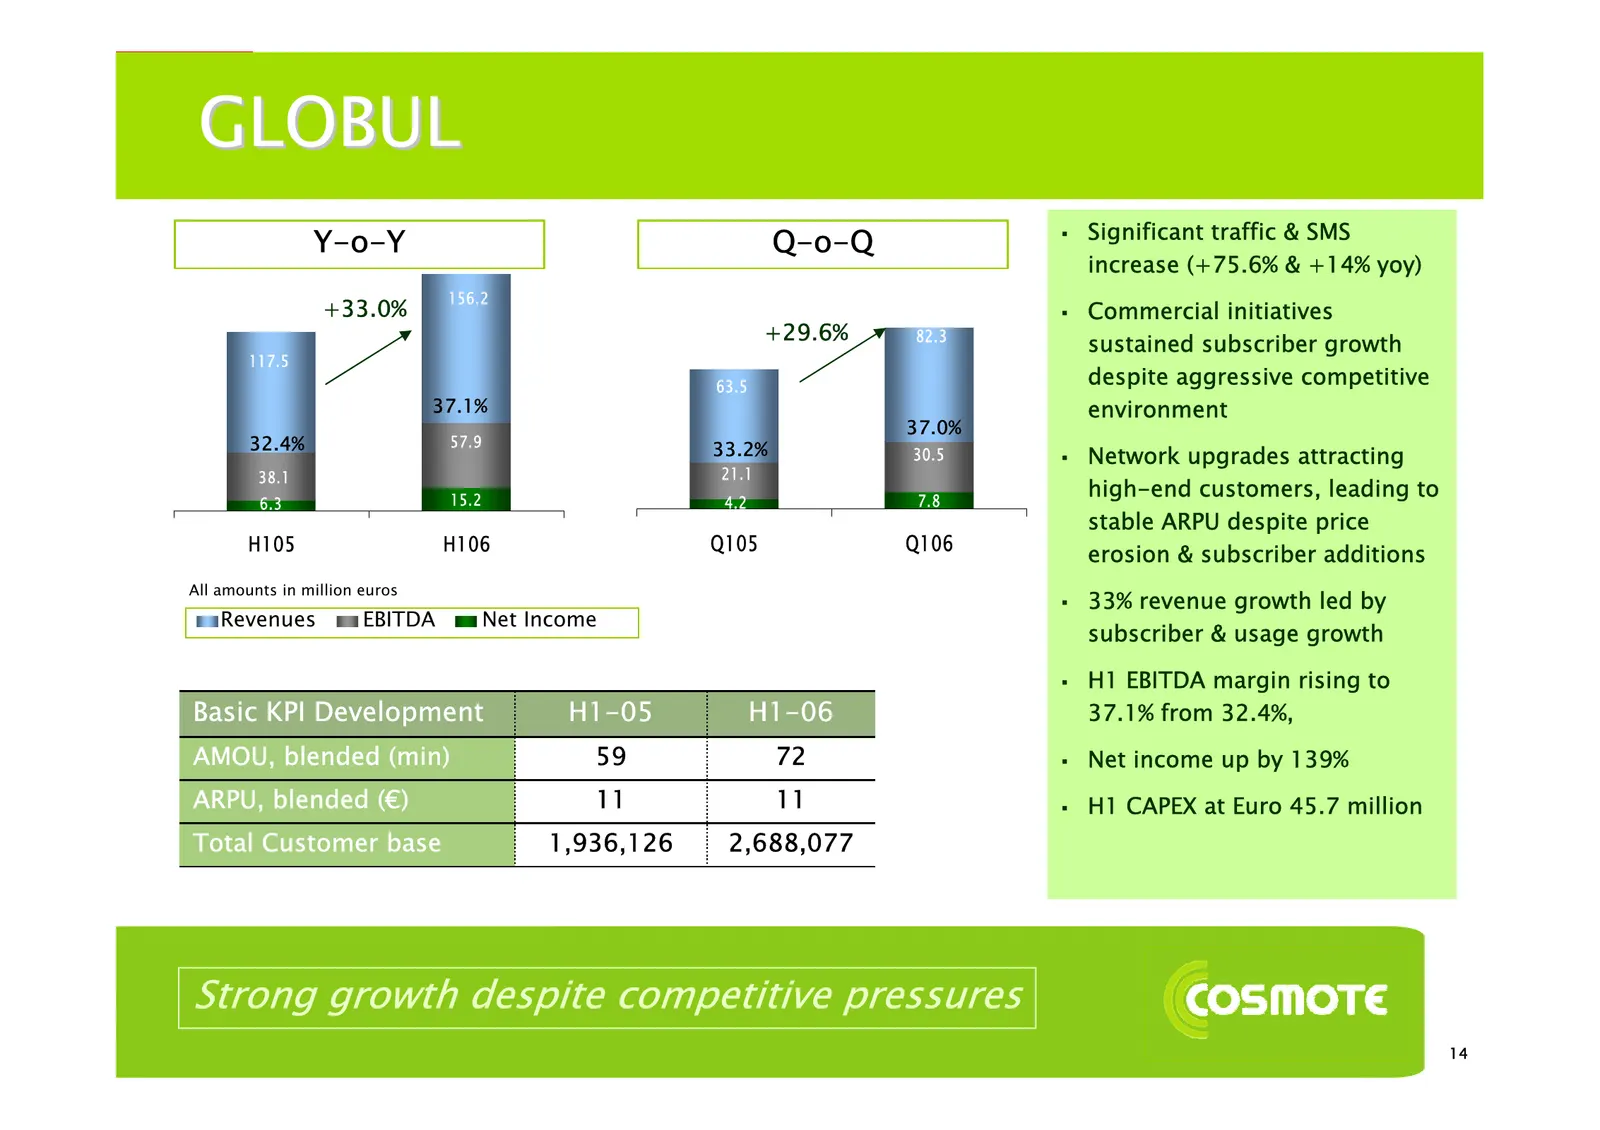
GLOBUL Significant traffic & SMS Y-o-Y Q-o-Q increase (+75.6% & +14% yoy) 156.2 +33.0% Commercial initiatives +29.6% 82.3 sustained subscriber growth 117.5 63.5 despite aggressive competitive 37.1% environment 37.0% 32.4% 57.9 33.2% 30.5 Network upgrades attracting 38.1 21.1 15.2 7.8 high-end
Slide 15: COSMOFON
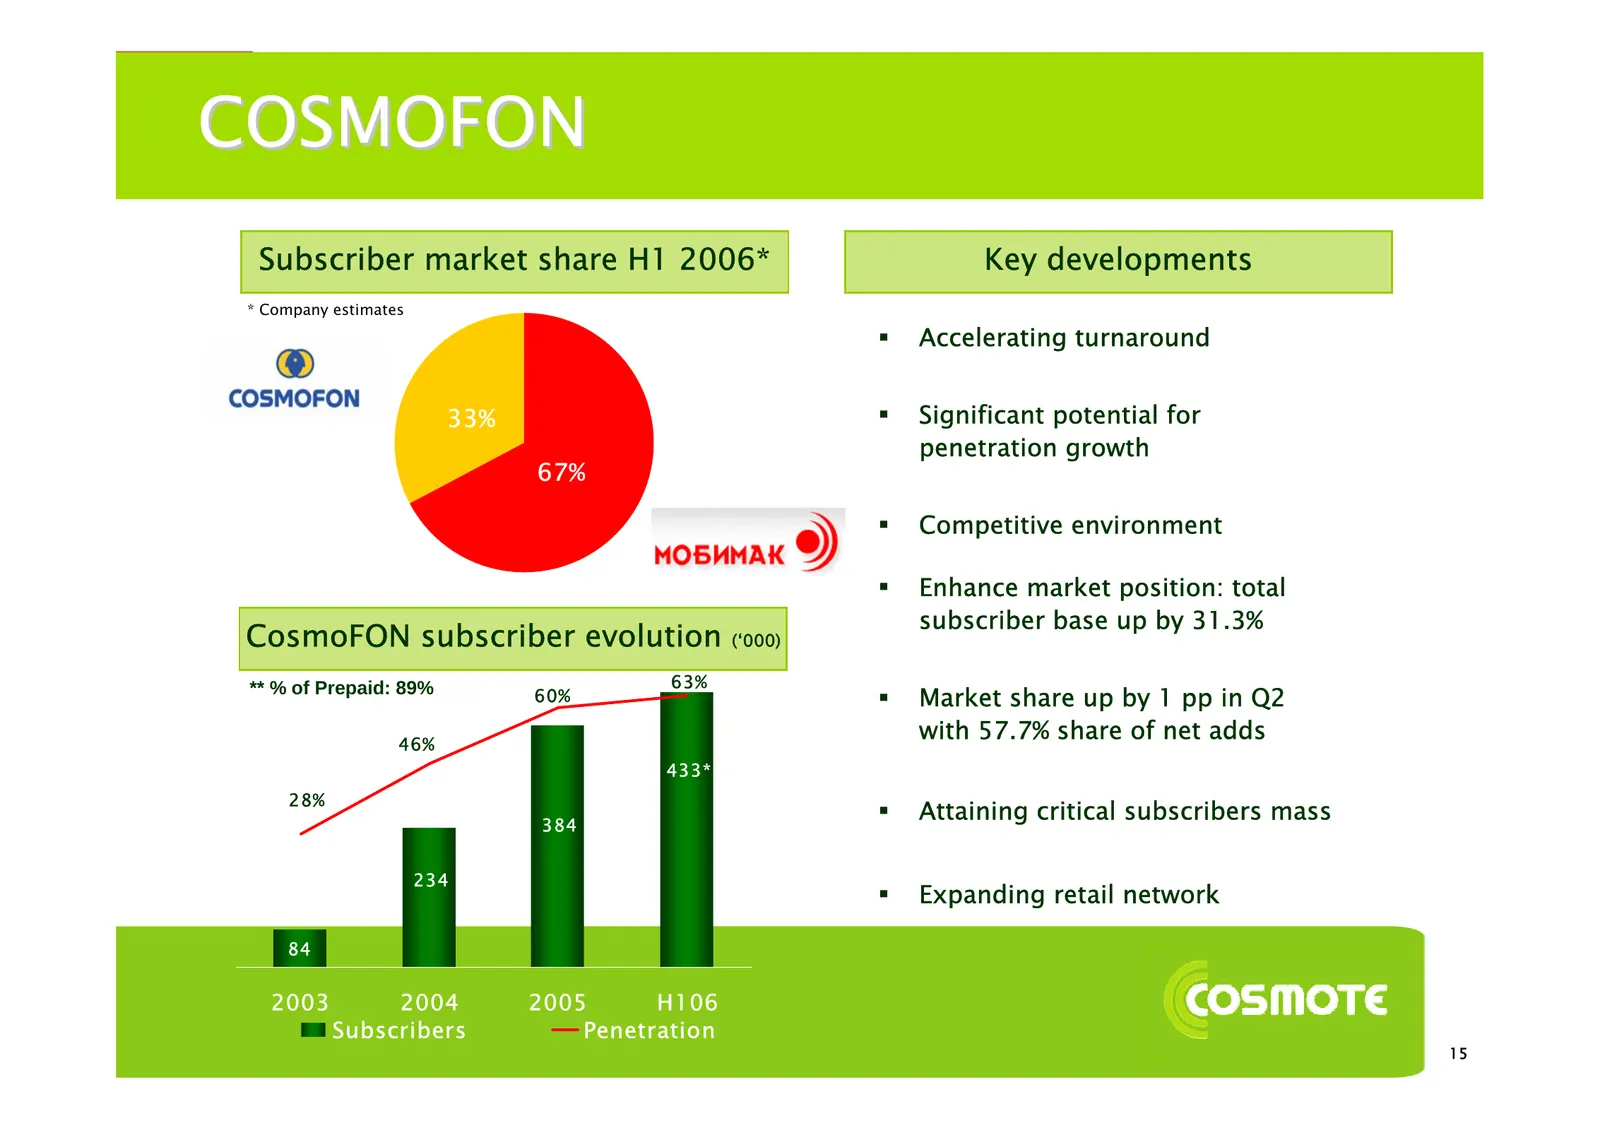
COSMOFON Subscriber market share H1 2006* Key developments * Company estimates Accelerating turnaround 33% Significant potential for penetration growth 67% Competitive environment Enhance market position: total subscriber base up by 31.3% CosmoFON subscriber evolution (‘000) 63% ** % of Prep
Slide 16: COSMOFON
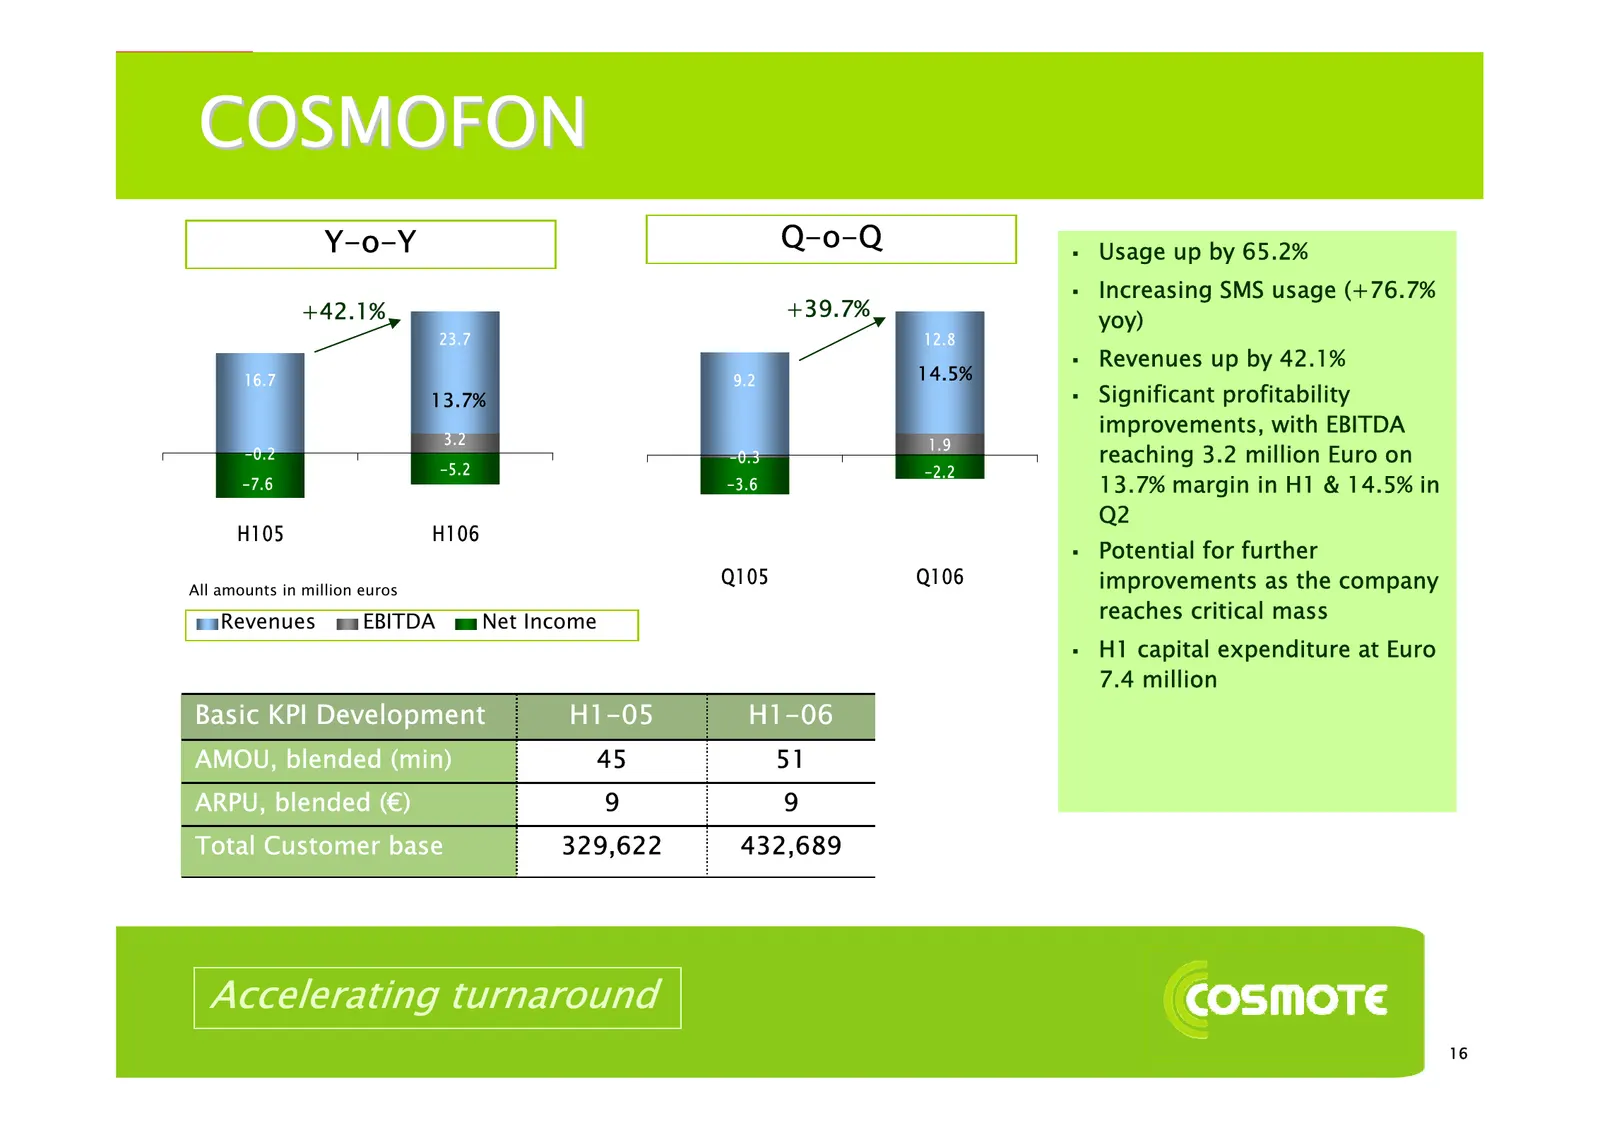
COSMOFON Y-o-Y Q-o-Q Usage up by 65.2% Increasing SMS usage (+76.7% +42.1% +39.7% yoy) 23.7 12.8 Revenues up by 42.1% 16.7 9.2 14.5% 13.7% Significant profitability improvements, with EBITDA 3.2 1.9 -0.2 -0.3 reaching 3.2 million Euro on -5.2 -2.2 -7.6 -3.6 13.7% margin in H1 & 14.5% in Q2 H
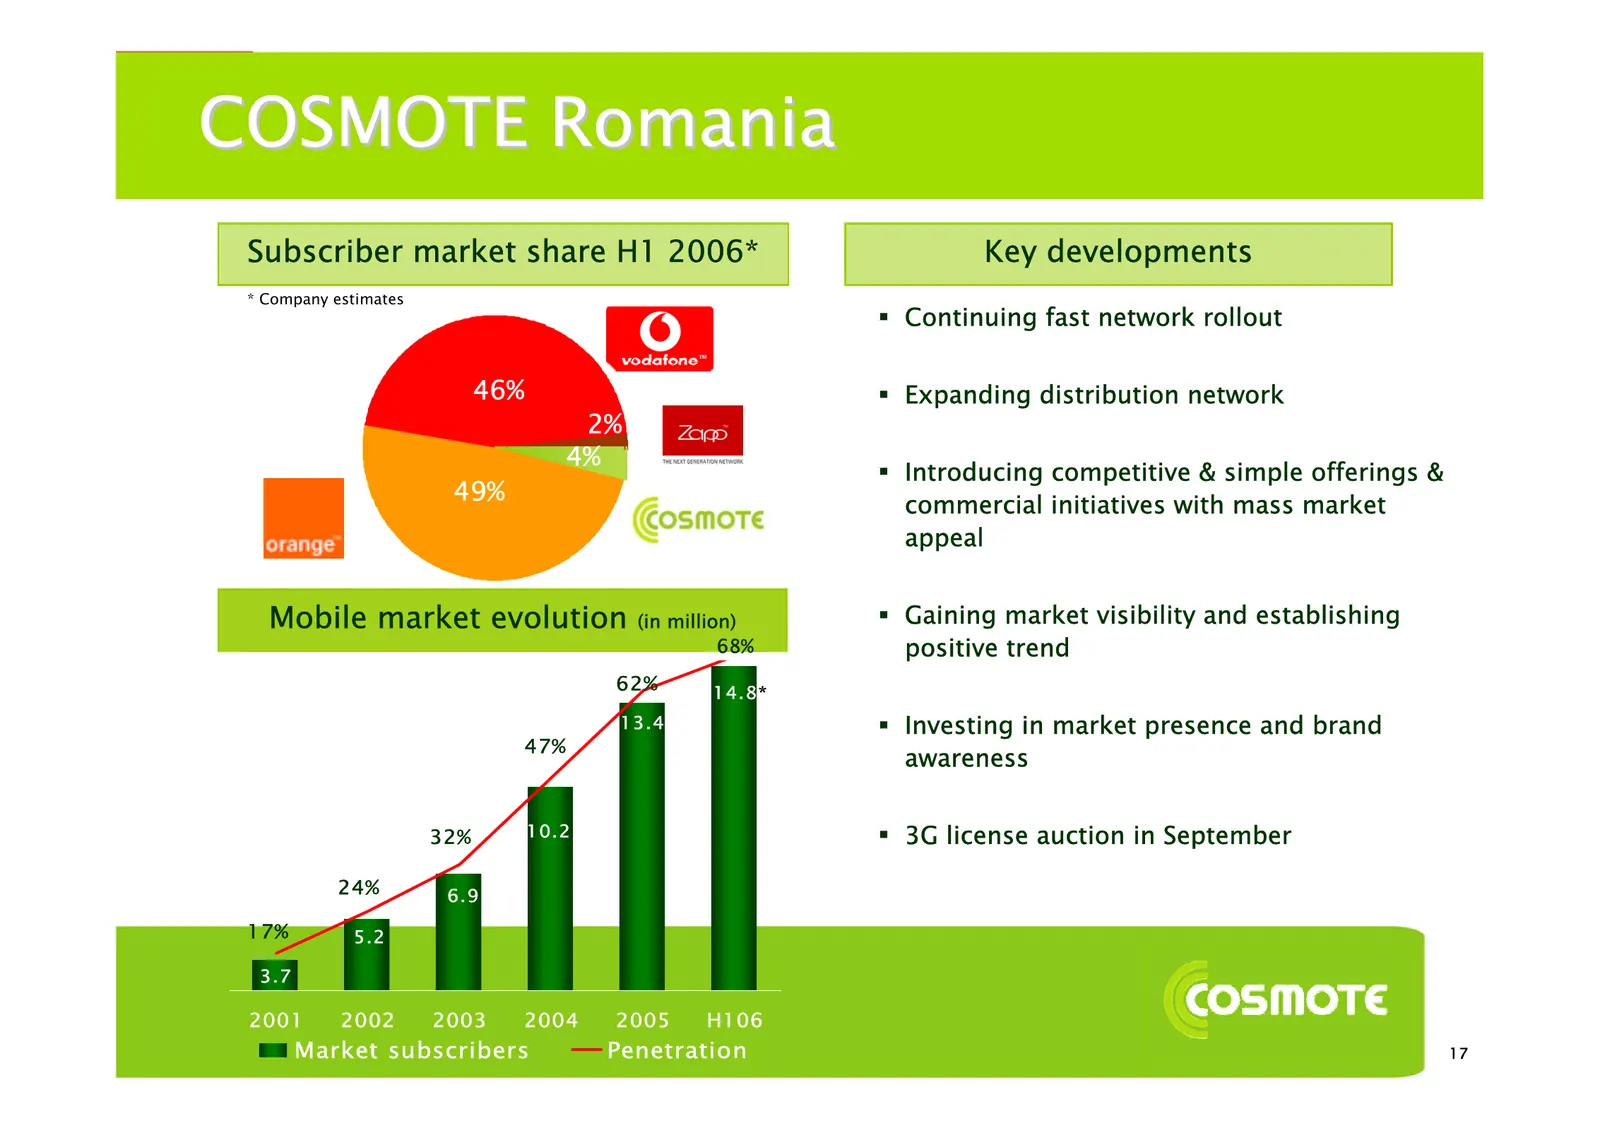
Slide 17: COSMOTE Romania
COSMOTE Romania Subscriber market share H1 2006* Key developments * Company estimates Continuing fast network rollout 45% 46% Expanding distribution network 2% 4% Introducing competitive & simple offerings & 49% commercial initiatives with mass market appeal Mobile market evolution (in million
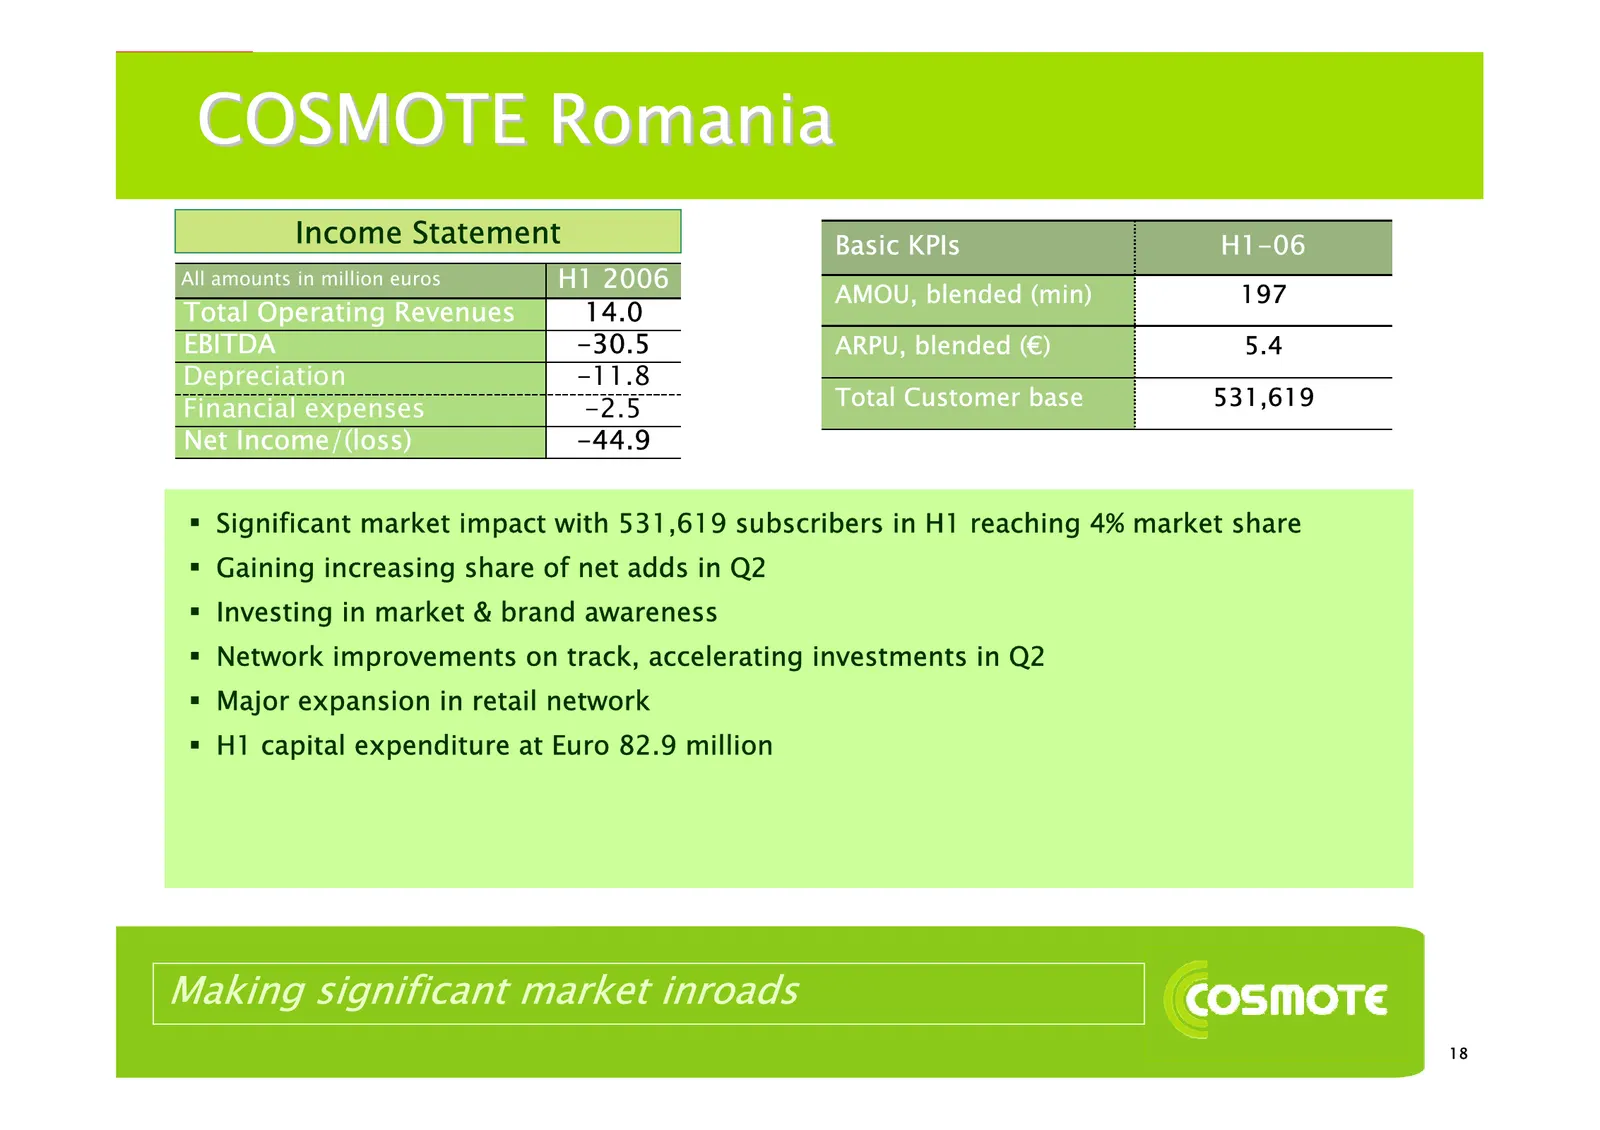
Slide 18: COSMOTE Romania
COSMOTE Romania Income Statement Basic KPIs H1-06 All amounts in million euros H1 2006 AMOU, blended (min) 197 Total Operating Revenues 14.0 EBITDA -30.5 ARPU, blended (€) 5.4 Depreciation -11.8 Financial expenses -2.5 Total Customer base 531,619 Net Income/(loss) -44.9 Significant market impact w
Slide 19: Conclusion: Growth dynamics with strong financial performance
Conclusion: Growth dynamics with strong financial performance
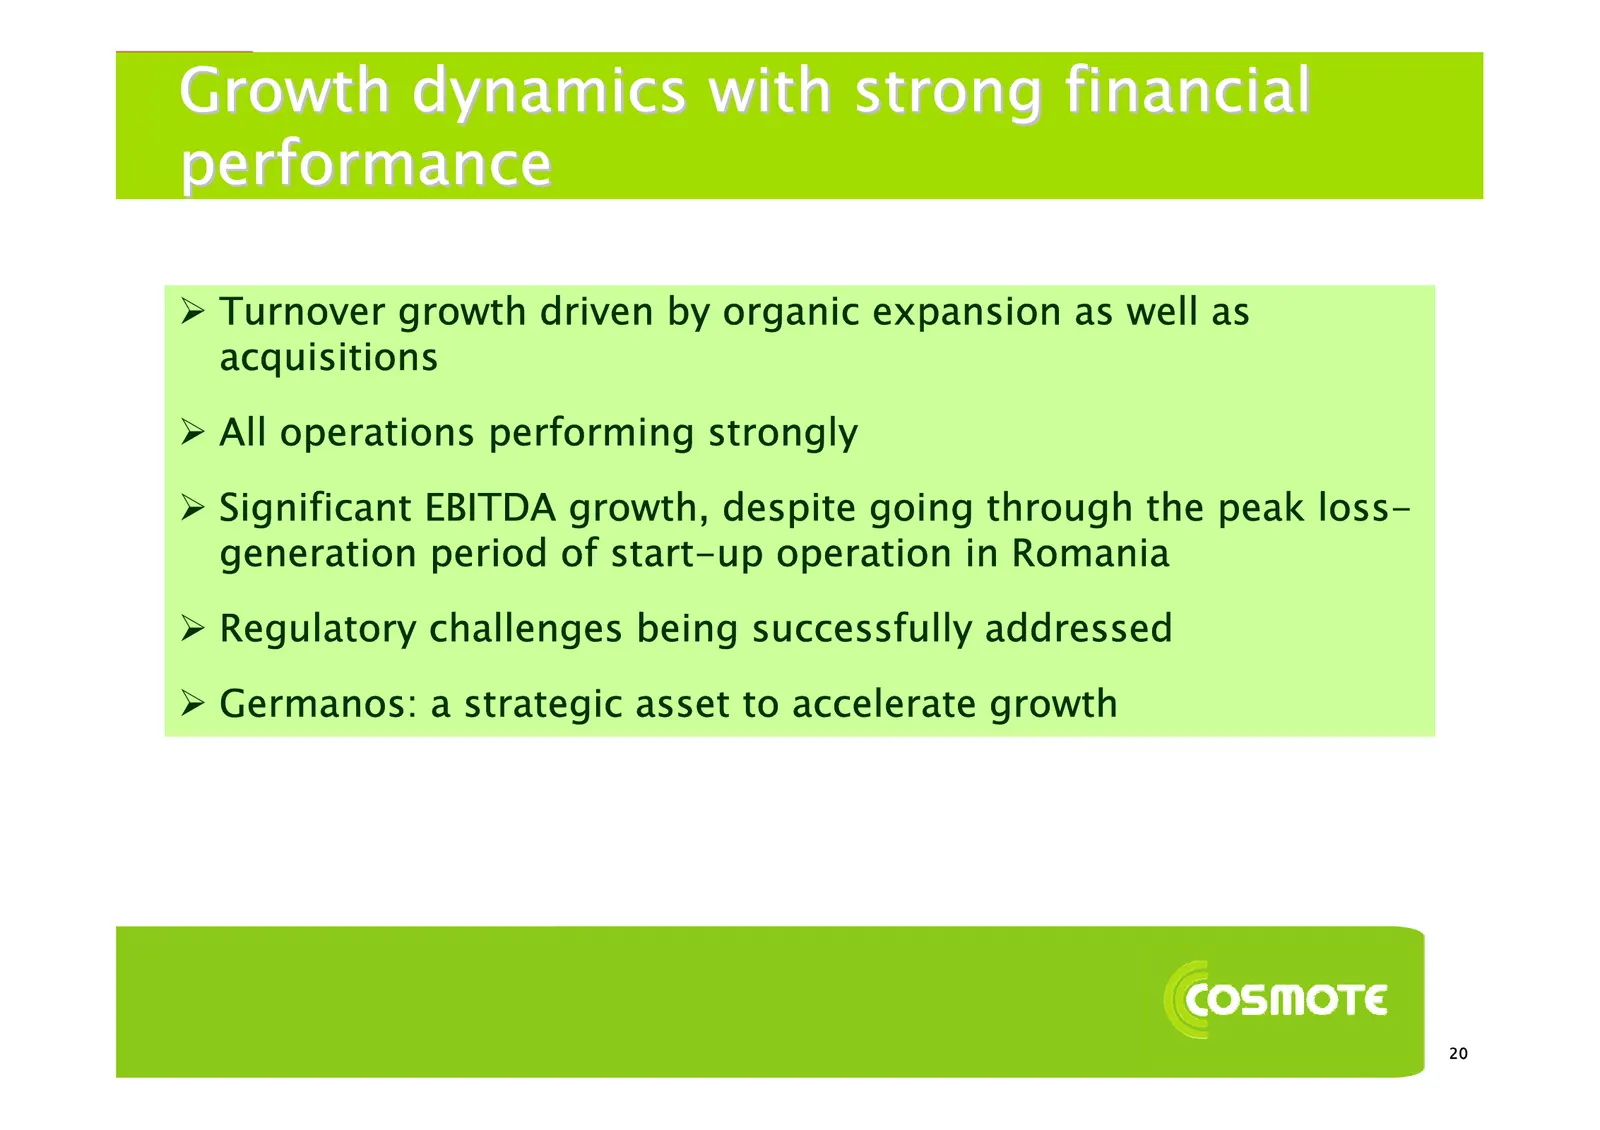
Slide 20: Growth dynamics with strong financial performance
Growth dynamics with strong financial performance ¾ Turnover growth driven by organic expansion as well as acquisitions ¾ All operations performing strongly ¾ Significant EBITDA growth, despite going through the peak loss- generation period of start-up operation in Romania ¾ Regulatory challenges be
Slide 21: Note on Forward-Looking Statements
NOTE ON FORWARD-LOOKING STATEMENTS Some of the statements in this document are "forward-looking statements". Forward-looking statements are derived from information that we currently have and assumptions that we make. Words such as "believes", "anticipates", "expects", “targets”, intends","seeks", "
Source: Internet Archive copy of cosmote.gr
More decks from Hellenic Telecommunications Organization SA
 OTE Group — Q2 2026 Earnings Presentation25 slides · July 2026
 OTE Group — Q1 2026 Earnings Presentation25 slides · May 2026
 Q4 2025 Earnings Presentation23 slides · Feb 26, 2026
 Q3 2025 Earnings Presentation23 slides · Nov 14, 2025
 Q2 2025 Earnings Presentation31 slides · Aug 6, 2025
 OTE Group — Q1 2025 Earnings Presentation31 slides · May 2025