Superior Drilling Products Inc
Superior Drilling Products — FY2018 Earnings Presentation
19 slides from Superior Drilling Products's earnings presentation, Mar 7, 2019

Slide 1: Fourth Quarter and Full Year 2018 Financial Results Conference Call
Wy SUPERIOR DRILLING PRODUCTS FOURTH QUARTER AND FULL YEAR 2018 FINANCIAL RESULTS CONFERENCE CALL MARCH 7, 2019 NYSE American: SDPI www.sdpi.com
Slide 2: Safe Harbor Statement
SAFE HARBOR STATEMENT These slides and the accompanying oral presentation contain forward-looking statements and information that are subject to a number of risks and uncertainties, many of which are beyond our control. All statements, other than statements of historical fact included in this releas
Slide 3: Troy Meier, Chairman and Chief Executive Officer
Wy SUPERIOR DRILLING PRODUCTS TROY MEIER CHAIRMAN AND CHIEF EXECUTIVE OFFICER ©2019 Superior Drilling Products
Slide 4: 2018: Year of Progress
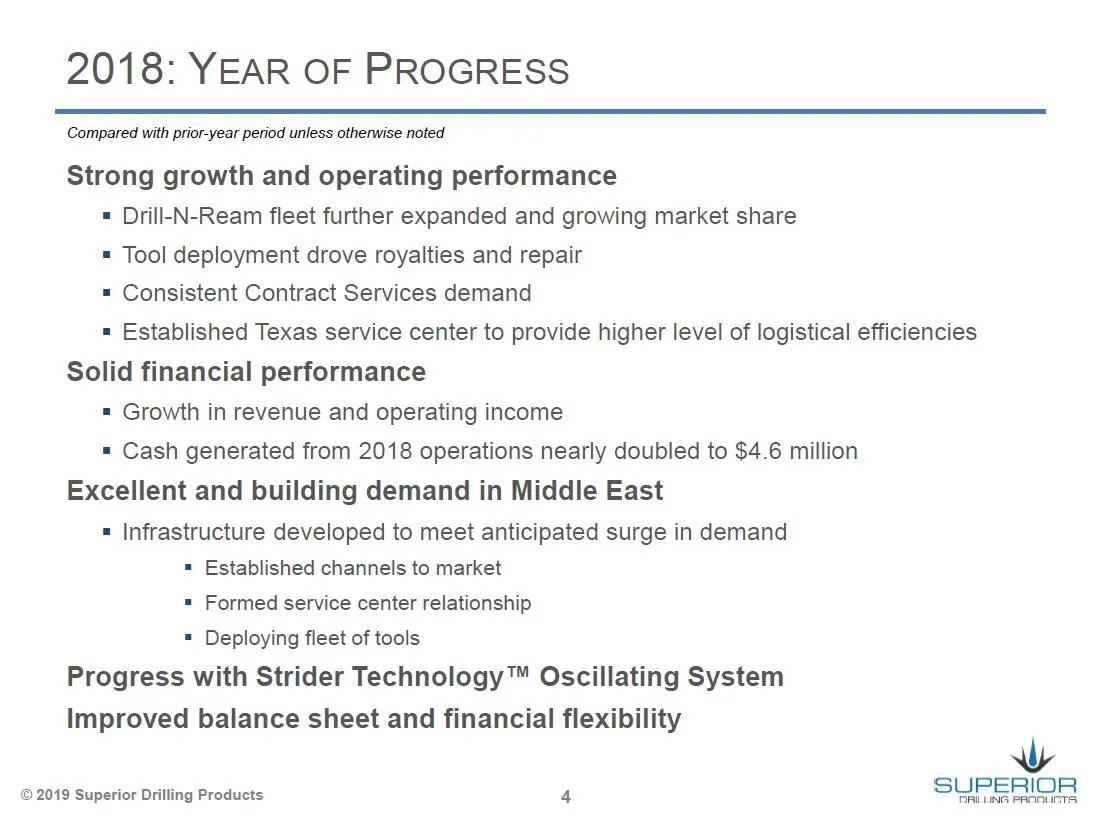
2018: YEAR OF PROGRESS Compared with prior-year period unless otherwise noted Strong growth and operating performance = Drill-N-Ream fleet further expanded and growing market share = Tool deployment drove royalties and repair = Consistent Contract Services demand = Established Texas service center t
Slide 5: Christopher Cashion, Chief Financial Officer
Wy SUPERIOR DRILLING PRODUCTS CHRISTOPHER CASHION CHIEF FINANCIAL OFFICER
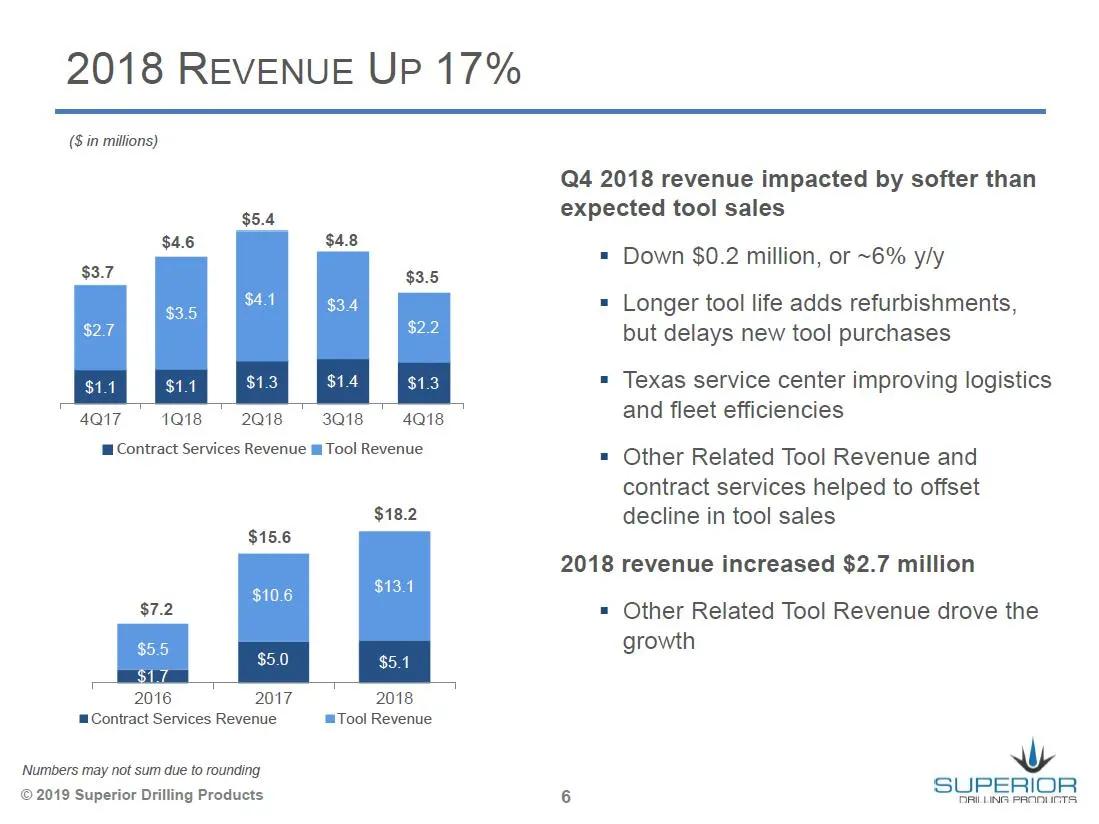
Slide 6: 2018 Revenue Up 17%
2018 REVENUE UP 17% (8 in millions) Q4 2018 revenue impacted by softer than expected tool sales $5.4 = Down $0.2 million, or ~6% y/y = Longer tool life adds refurbishments, but delays new tool purchases = Texas service center improving logistics 4ai7 " 1ais " 2018 " 3a18 ' 4a18 and fleet efficiencie
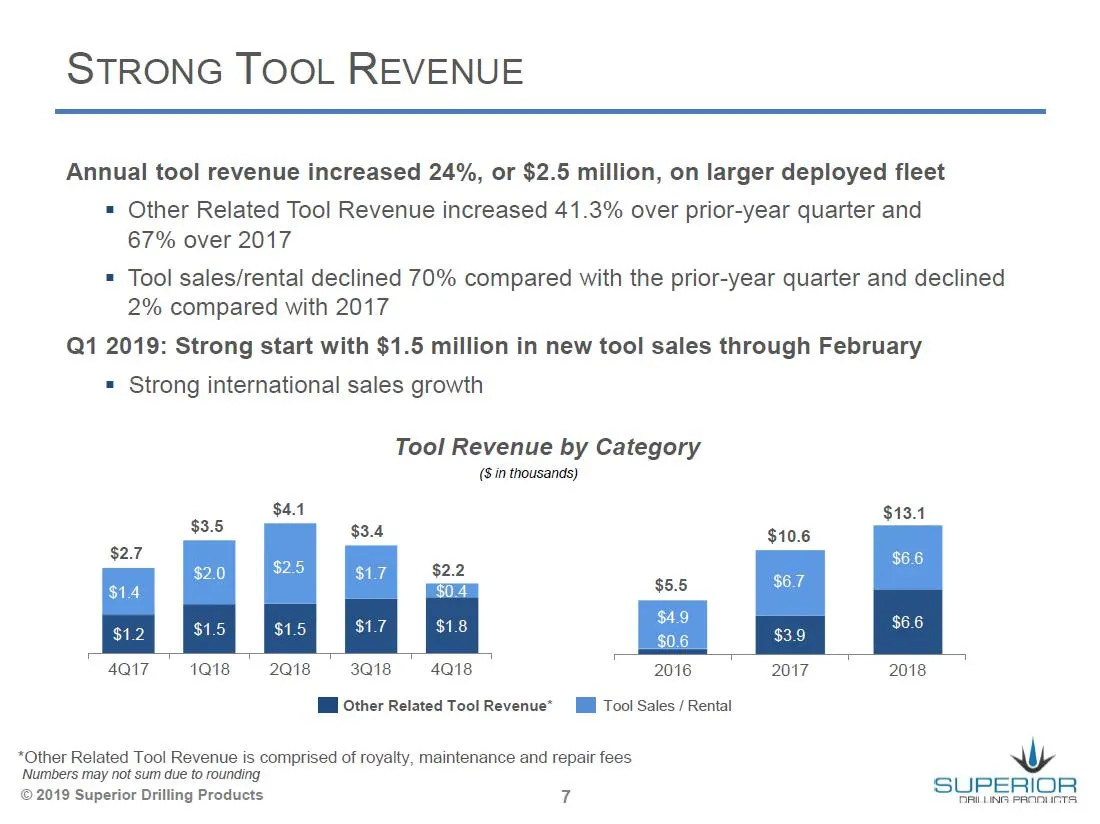
Slide 7: Strong Tool Revenue
STRONG TOOL REVENUE Annual tool revenue increased 24%, or $2.5 million, on larger deployed fleet = Other Related Tool Revenue increased 41.3% over prior-year quarter and 67% over 2017 = Tool sales/rental declined 70% compared with the prior-year quarter and declined 2% compared with 2017 Q1 2019: St
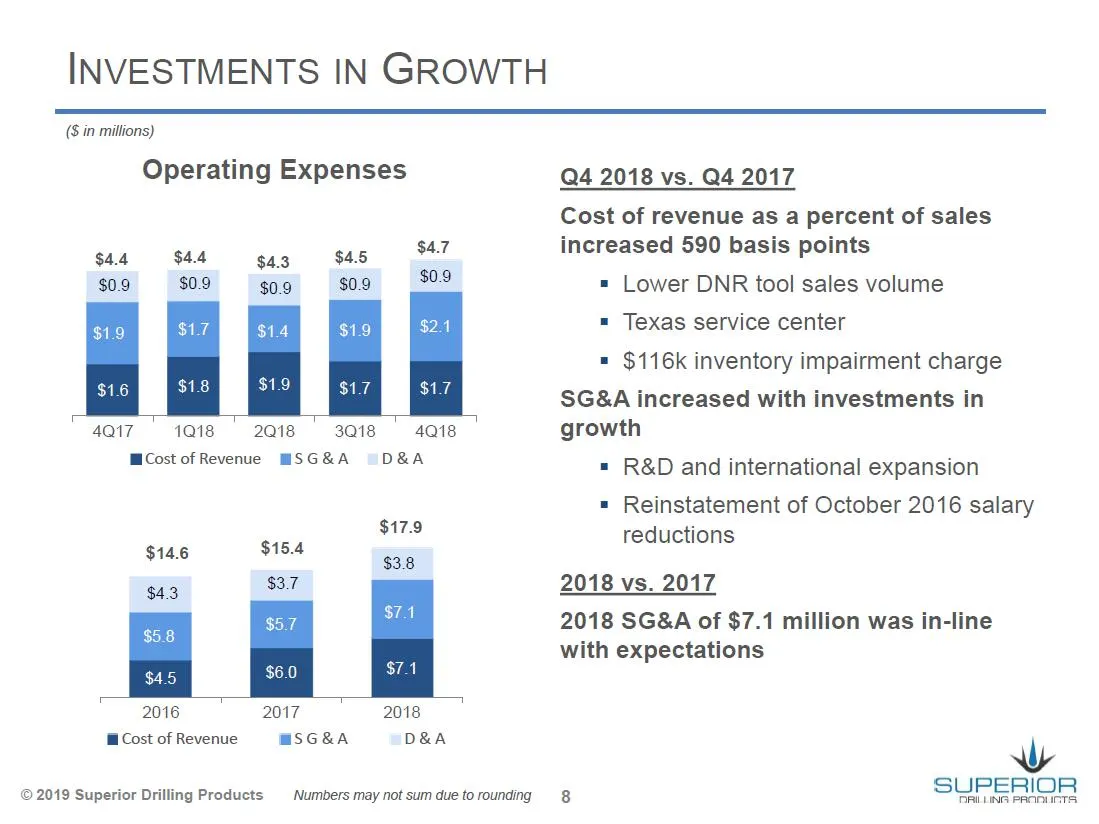
Slide 8: Investments in Growth
INVESTMENTS IN GROWTH ($ in millions) Operating Expenses Q4 2018 vs. Q4 2017 Cost of revenue as a percent of sales gad $44 Zag $45 $4.7 increased 590 basis points $0.9 $0.9 cae $0.9 sv = Lower DNR tool sales volume = Texas service center = $116k inventory impairment charge SG&A increased with invest
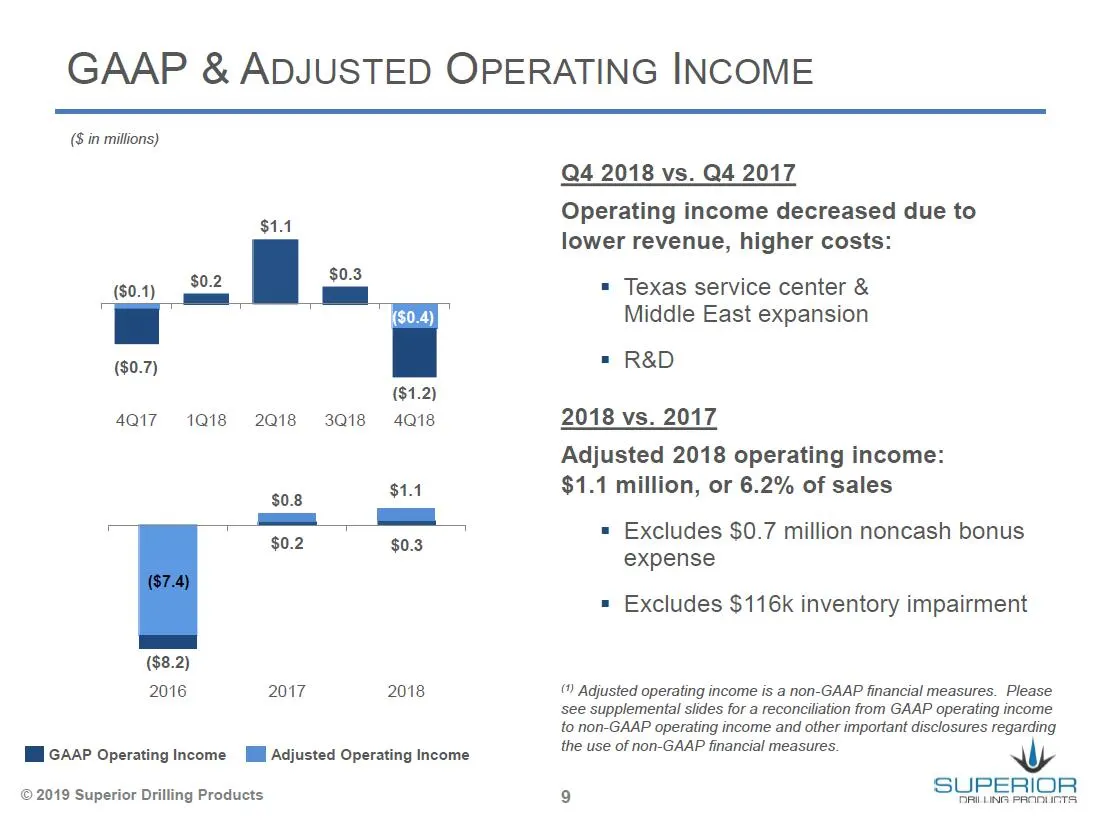
Slide 9: GAAP & Adjusted Operating Income
GAAP & ADJUSTED OPERATING INCOME (8 in millions) $1.1 ($1.2) 4017 1018 2018 3018 4Q18 $08 $1.41 ———) = $0.2 $0.3 ($8.2) 2016 2017 2018 HNGAAP Operating Income [lJ Adjusted Operating Income © 2019 Superior Drilling Products Q4 2018 vs. Q4 2017 Operating income decreased due to lower revenue, higher c
Slide 10: Strong Operating Leverage
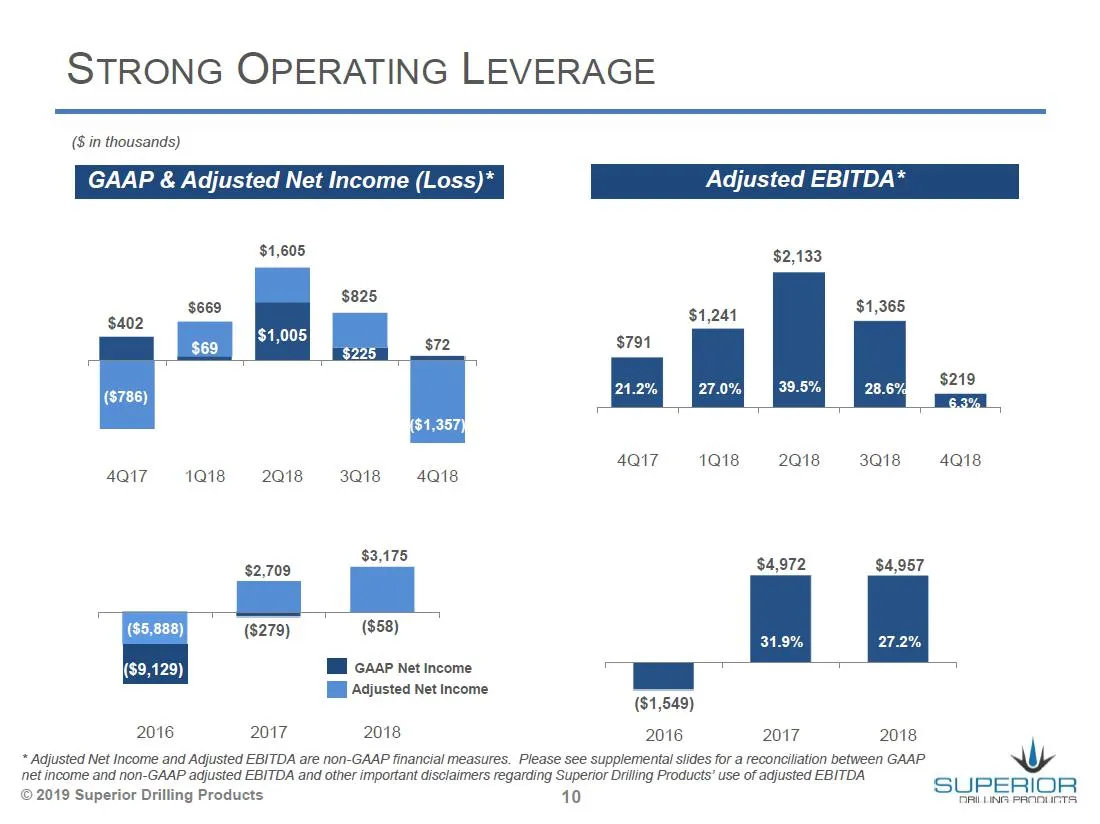
STRONG OPERATING LEVERAGE (Sin thousands) GAAP & Adjusted Net Income (Loss)* $1,605 4Q17 1018 2Q18 3Q18 4Q18 4Q17 1018 2Q18 3Q18 4018 mal $4,972 $4,957 ($58) 31.9% 27.2% TM aap net Income [Hl Adjusted Net Income | ($1,549) 2016 2017 2018 2016 2017 2018 * Adjusted Net Income and Adjusted EBITDA are n
Slide 11: Solid Balance Sheet
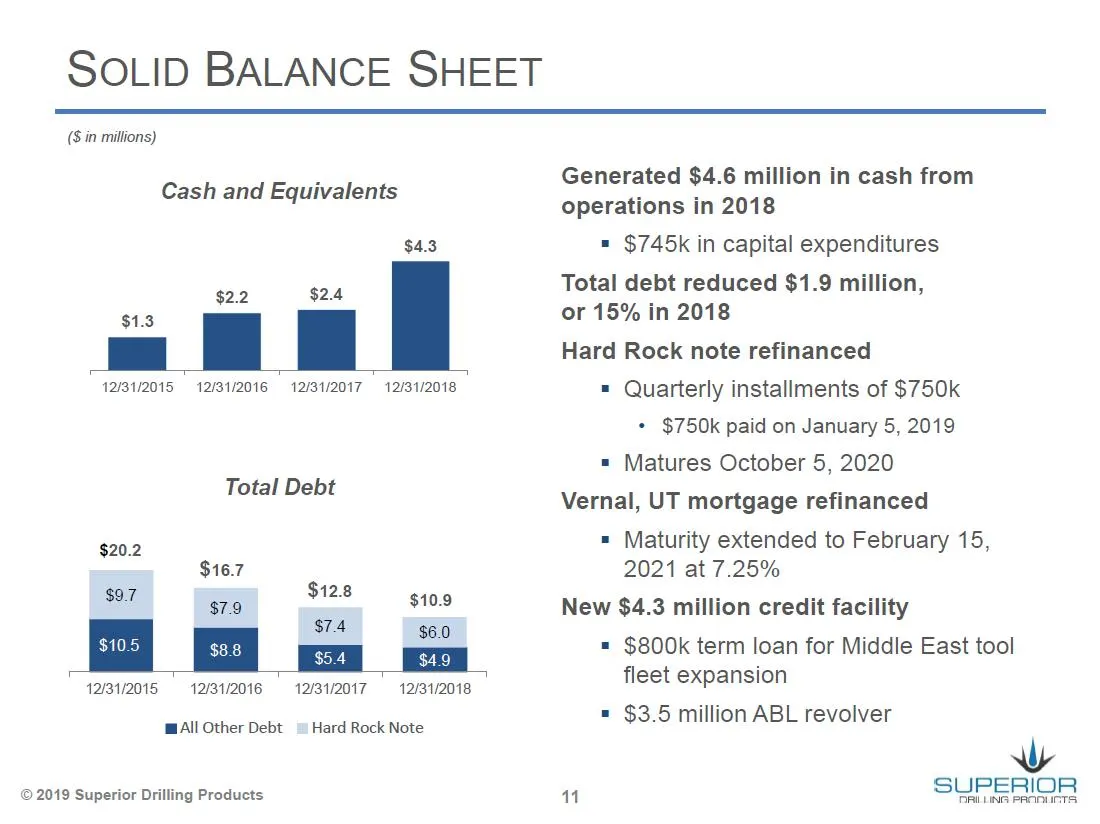
SOLID BALANCE SHEET (Sin millions) Cash and Equivalents $4.3 $2.2 $2.4 $1.3 12/31/2015 12/31/2016 = 12/31/2017 = 12/31/2018 Total Debt $20.2 $16.7 97 $12.8 : $7.9 $10.9 12/31/2015 121312016 = 12/31/2017 12/31/2018 All Other Debt ™ Hard Rock Note © 2019 Superior Drilling Products Generated $4.6 milli
Slide 12: Expect 24% Growth in 2019
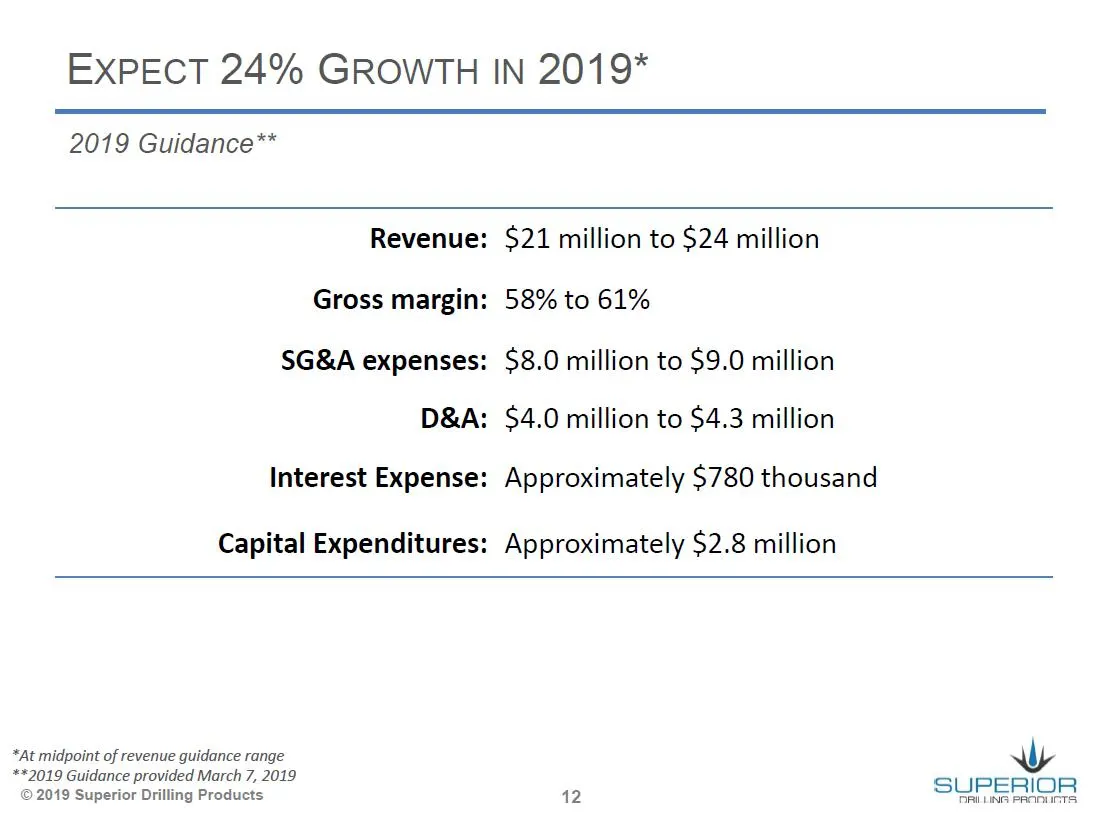
EXPECT 24% GROWTH IN 2019* 2019 Guidance** Revenue: Gross margin: SG&A expenses: D&A: Interest Expense: Capital Expenditures: $21 million to $24 million 58% to 61% $8.0 million to $9.0 million $4.0 million to $4.3 million Approximately $780 thousand Approximately $2.8 million *At midpoint of revenue
Slide 13: Supplemental Information
Wy SUPERIOR DRILLING PRODUCTS SUPPLEMENTAL INFORMATION
Slide 14: Adjusted Income from Operations Reconciliation
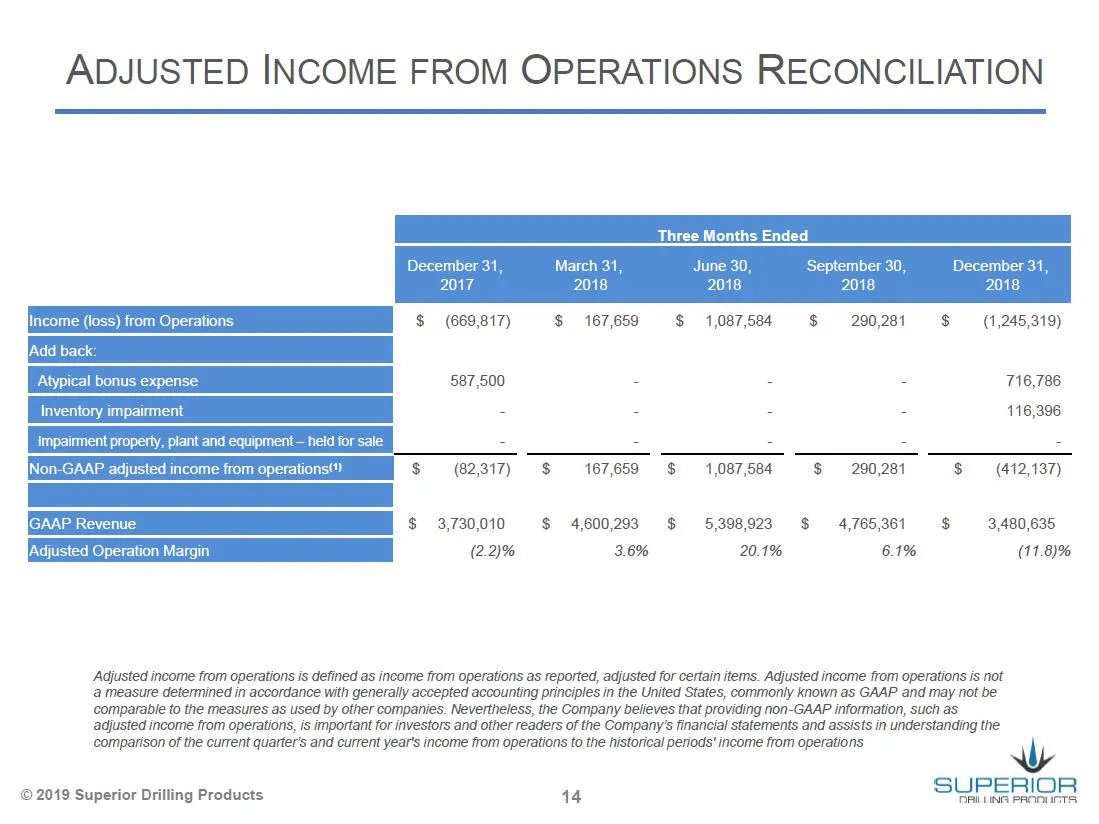
ADJUSTED INCOME FROM OPERATIONS RECONCILIATION September 3 2018 $ (669,817) $ 167,659 $ 1,087,584 $ 290,281 $ (1,245,319) Atypical bonus expense 587,500 = = 716,786 impairment property, plant and equipment — held for sale < = - - - Non-GAAP adjusted income from operations?) $ (82,317) $ 167,659 $ 1,
Slide 15: Adjusted Income from Operations Reconciliation
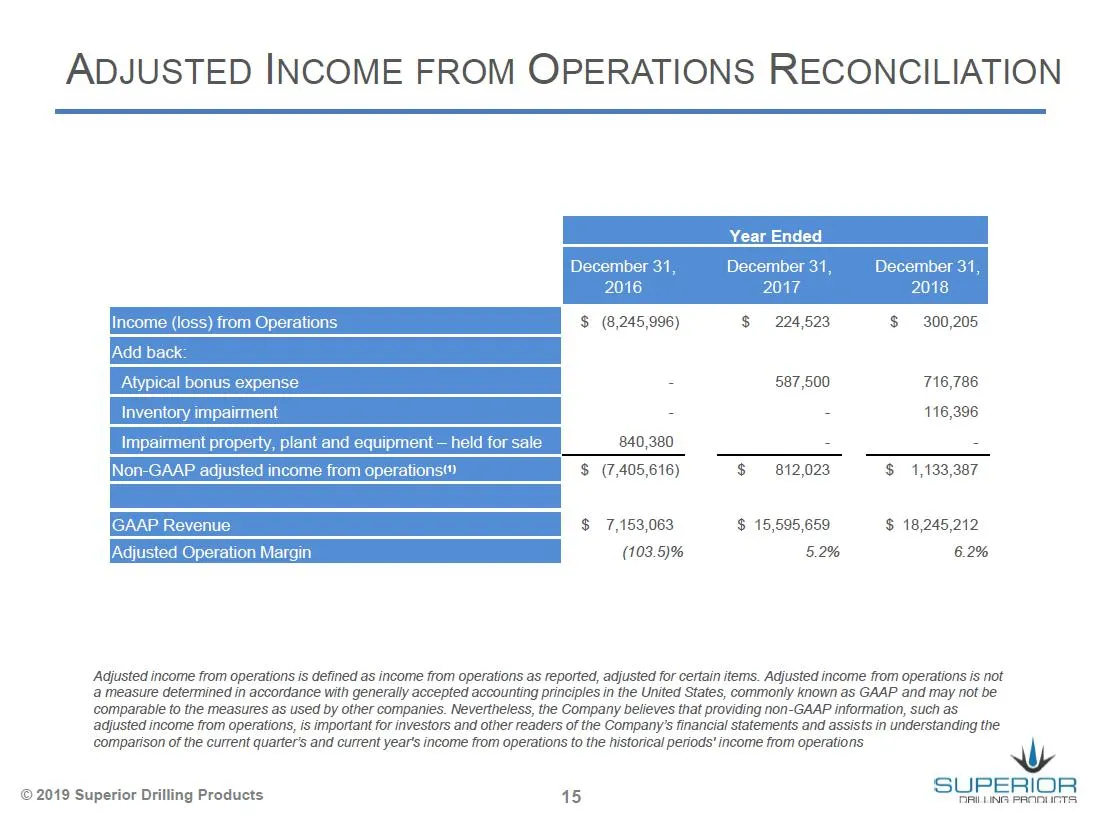
ADJUSTED INCOME FROM OPERATIONS RECONCILIATION $ (245.986) 2248623 $300,206 - 887 600 716,788 ; : 116.306 Impairment property, plant and equipment — held for sale 840,380 = : Non-GAAP adjusted income from operations” $ (7,405,616) $ 812,023 $ 1,133,387 IGAAP Revenue $ 7,153,063 $ 15,595,659 $ 18,245
Slide 16: Adjusted Net Income Reconciliation
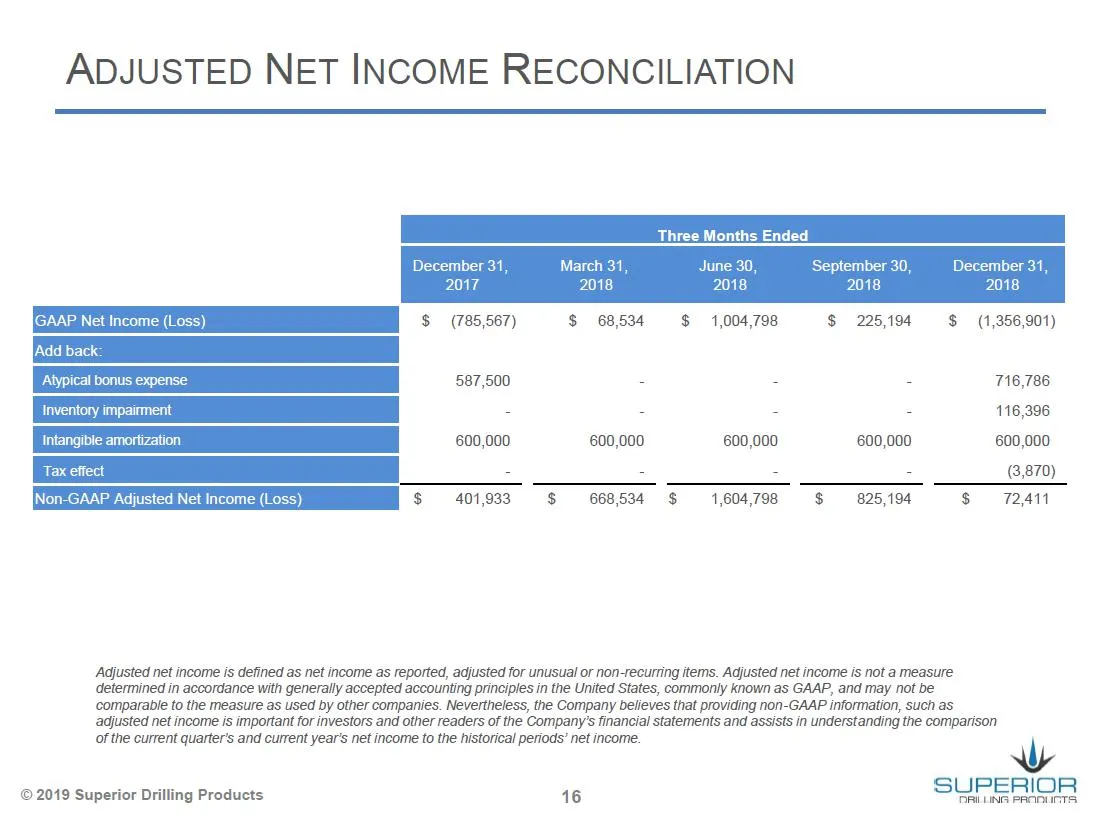
ADJUSTED NET INCOME RECONCILIATION December 31 2017 $ (785,567) $ 68,534 $ 1,004,798 $225,194 $ (1,356,901) 600,000 600,000 600,000 600,000 600,000 earn $ 401,933 $ 668,534 $ 1,604,798 = $ ~—825,194 $72,411 Adjusted net income is defined as net income as reported, adjusted for unusual or non-recurri
Slide 17: Adjusted Net Income Reconciliation
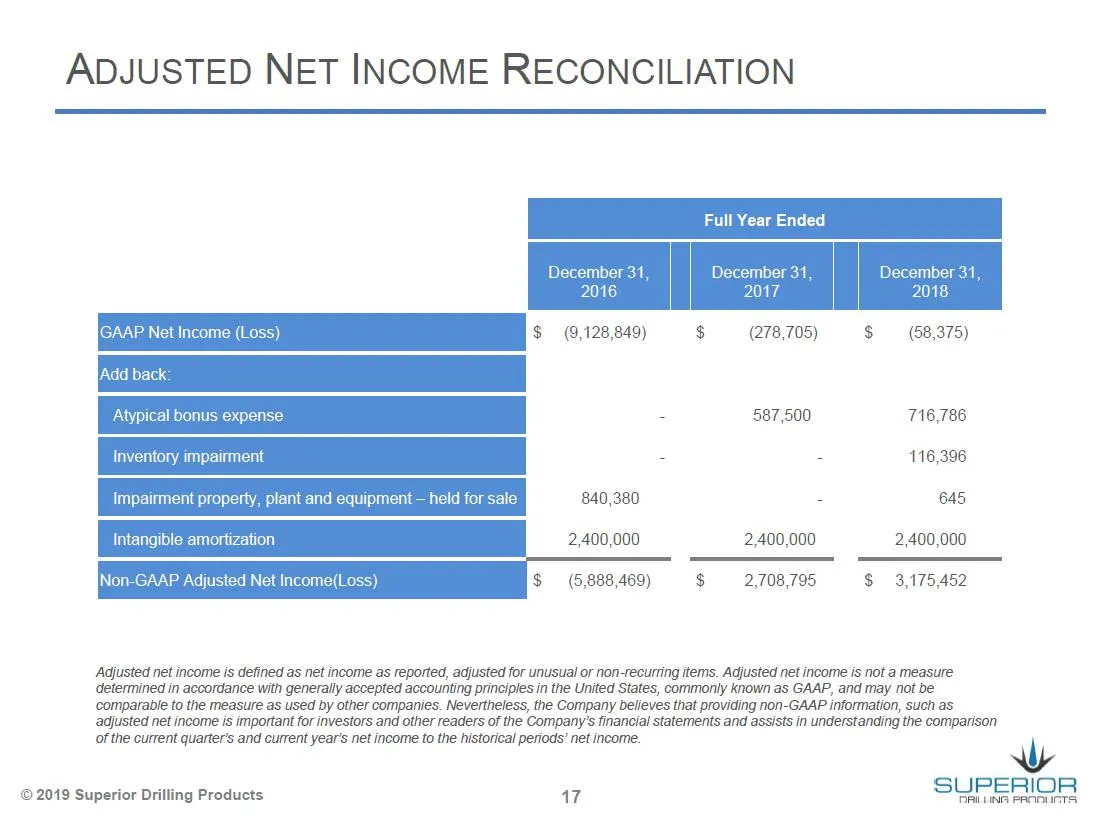
ADJUSTED NET INCOME RECONCILIATION $ (9,128,849) $ (278,705) $ (58,375) fw 840,380 - 645 Intangible amortization 2,400,000 2,400,000 2,400,000 INon-GAAP Adjusted 2 (5,888,469) $ 2,708,795 $ 3,175,452 Adjusted net income is defined as net income as reported, adjusted for unusual or non-recurring item
Slide 18: Adjusted EBITDA Reconciliation
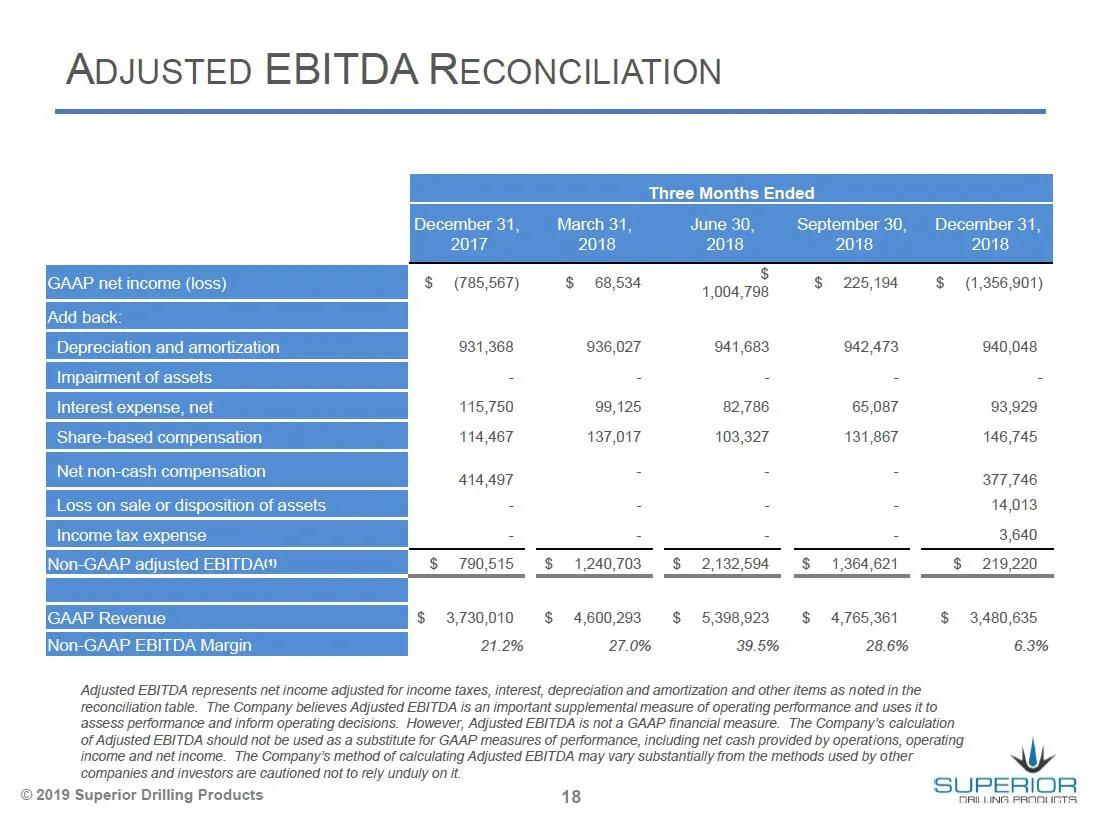
ADJUSTED EBITDA RECONCILIATION > $ AAP net income (loss) $ (785,567) $ 68,534 1,004,798 $ 225,194 $ (1,356,901) Add Depreciation and amortization 931,368 936,027 941,683 942,473 940,048 Impairment of assets Inter 115,750 99,125 82,786 65,087 93,929 114,467 137,017 103,327 131,867 146,745 414,497 a a
Slide 19: Adjusted EBITDA Reconciliation
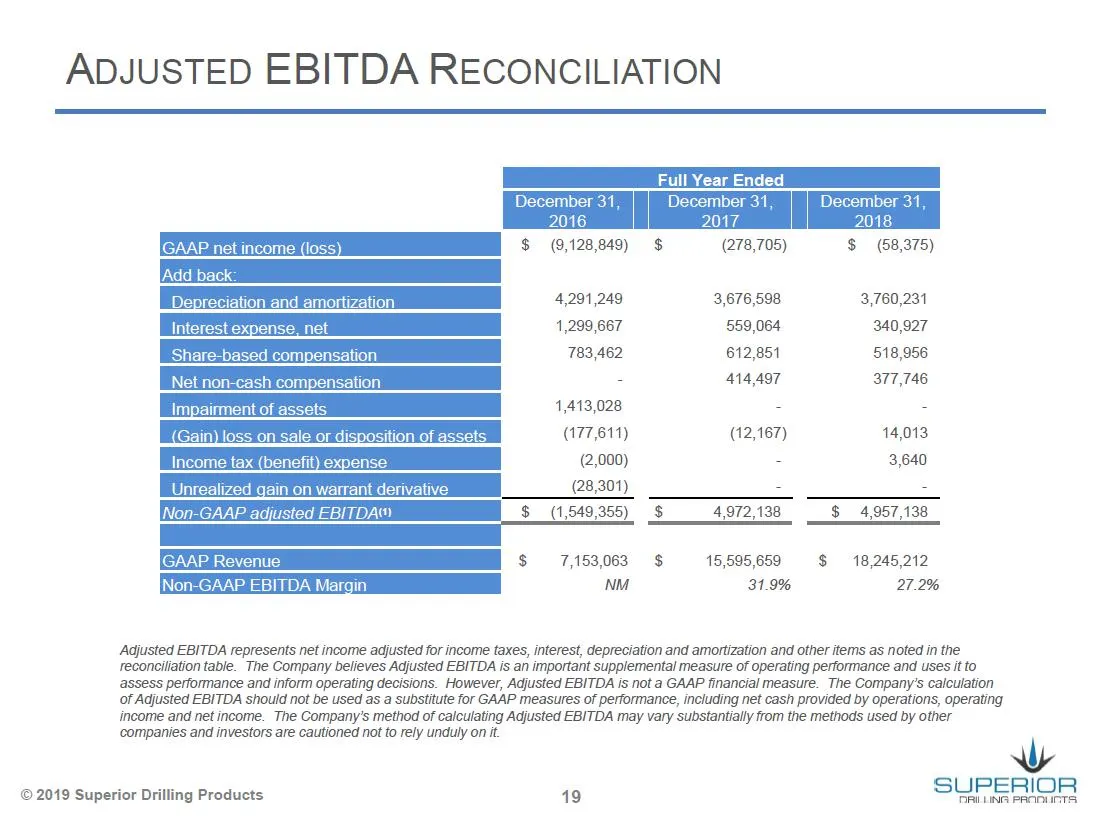
ADJUSTED EBITDA RECONCILIATION IGAAP net income (I $ (9,128,849) $ (278,705) $ (68,375) 4,291,249 3,676,598 3,760,231 1,299,667 559,064 340,927 783,462 612,851 518,956 @ 414,497 377,746 1,413,028 2 2 5 = (177,611) (12,167) 14,013, (2,000) - 3,640 (28,301) - - Non-GAAP adjusted EBITDAC $ (1,549,355)
Source: SEC EDGAR · 8-K filed Mar 7, 2019
More decks from Superior Drilling Products Inc
 Q3 2023 Earnings Presentation12 slides · Nov 9, 2023
 Q2 2023 Earnings Presentation12 slides · Aug 14, 2023
 Q1 2023 Earnings Presentation12 slides · May 15, 2023
 FY2022 Earnings Presentation13 slides · Mar 10, 2023
 Q3 2022 Earnings Presentation12 slides · Nov 14, 2022
 MicroCap Rodeo Windy City Roundup 202220 slides · Oct 12, 2022