M3, Inc. · TSE:2413
M3 — FY2022 Earnings Presentation
43 slides from M3's earnings presentation, Apr 28, 2023
Slide 1: M3, Inc. Presentation Material April 2023
M3, Inc. Presentation Material April 2023 Copyright © 2023 M3, Inc. All rights reserved. 0
Slide 2: Forward-looking statements disclaimer
The following presentation contains forecasts, future plans, management targets and other forward-looking projections relating to M3, Inc. and/or its group. These statements are drawn from assumptions of future events based on data currently available to us, and there exist possibilities that such a
Slide 3: FY2022 Consolidated Results
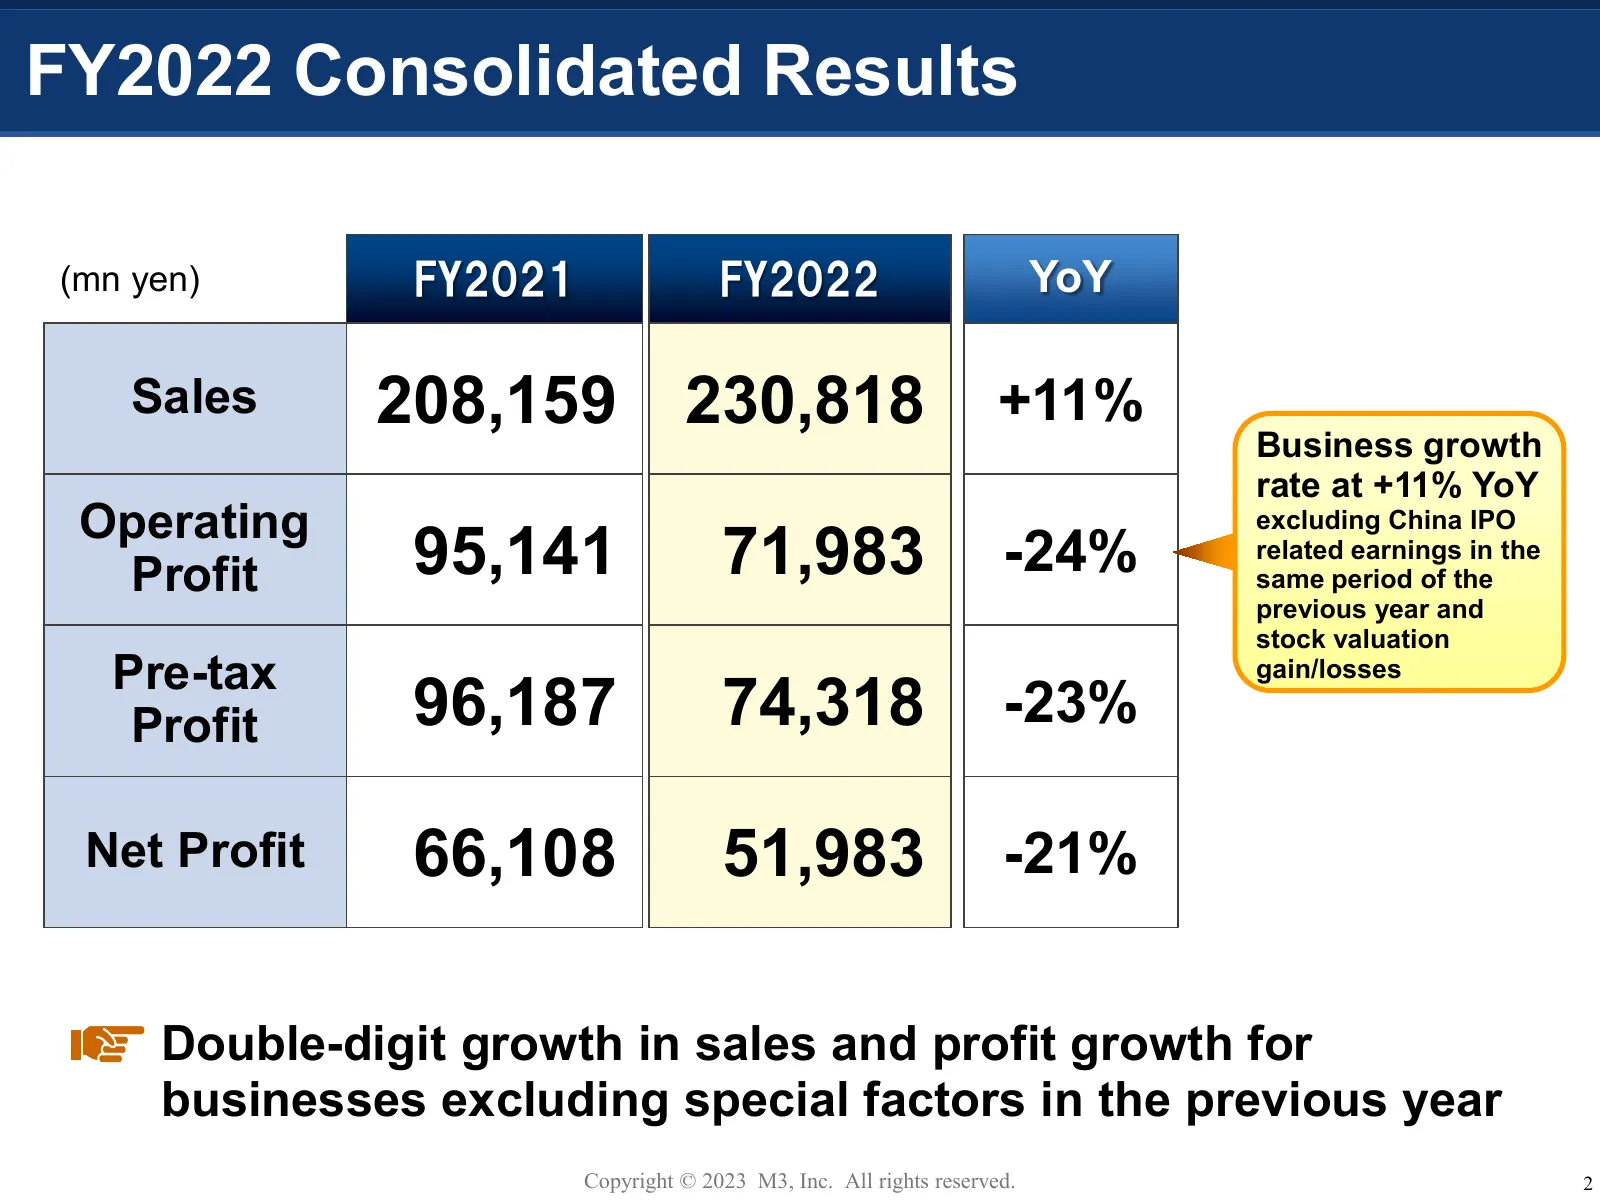
FY2022 Consolidated Results (mn yen) FY2021 FY2022 YoY Sales 208,159 230,818 +11% Business growth rate at +11% YoY Operating excluding China IPO Profit 95,141 71,983 -24% related earnings in the same period of the previous year and stock valuation Pre-tax gain/losses Profit 96,187 74,318 -23% Net Pr
Slide 4: FY2022 Consolidated Results by Segment
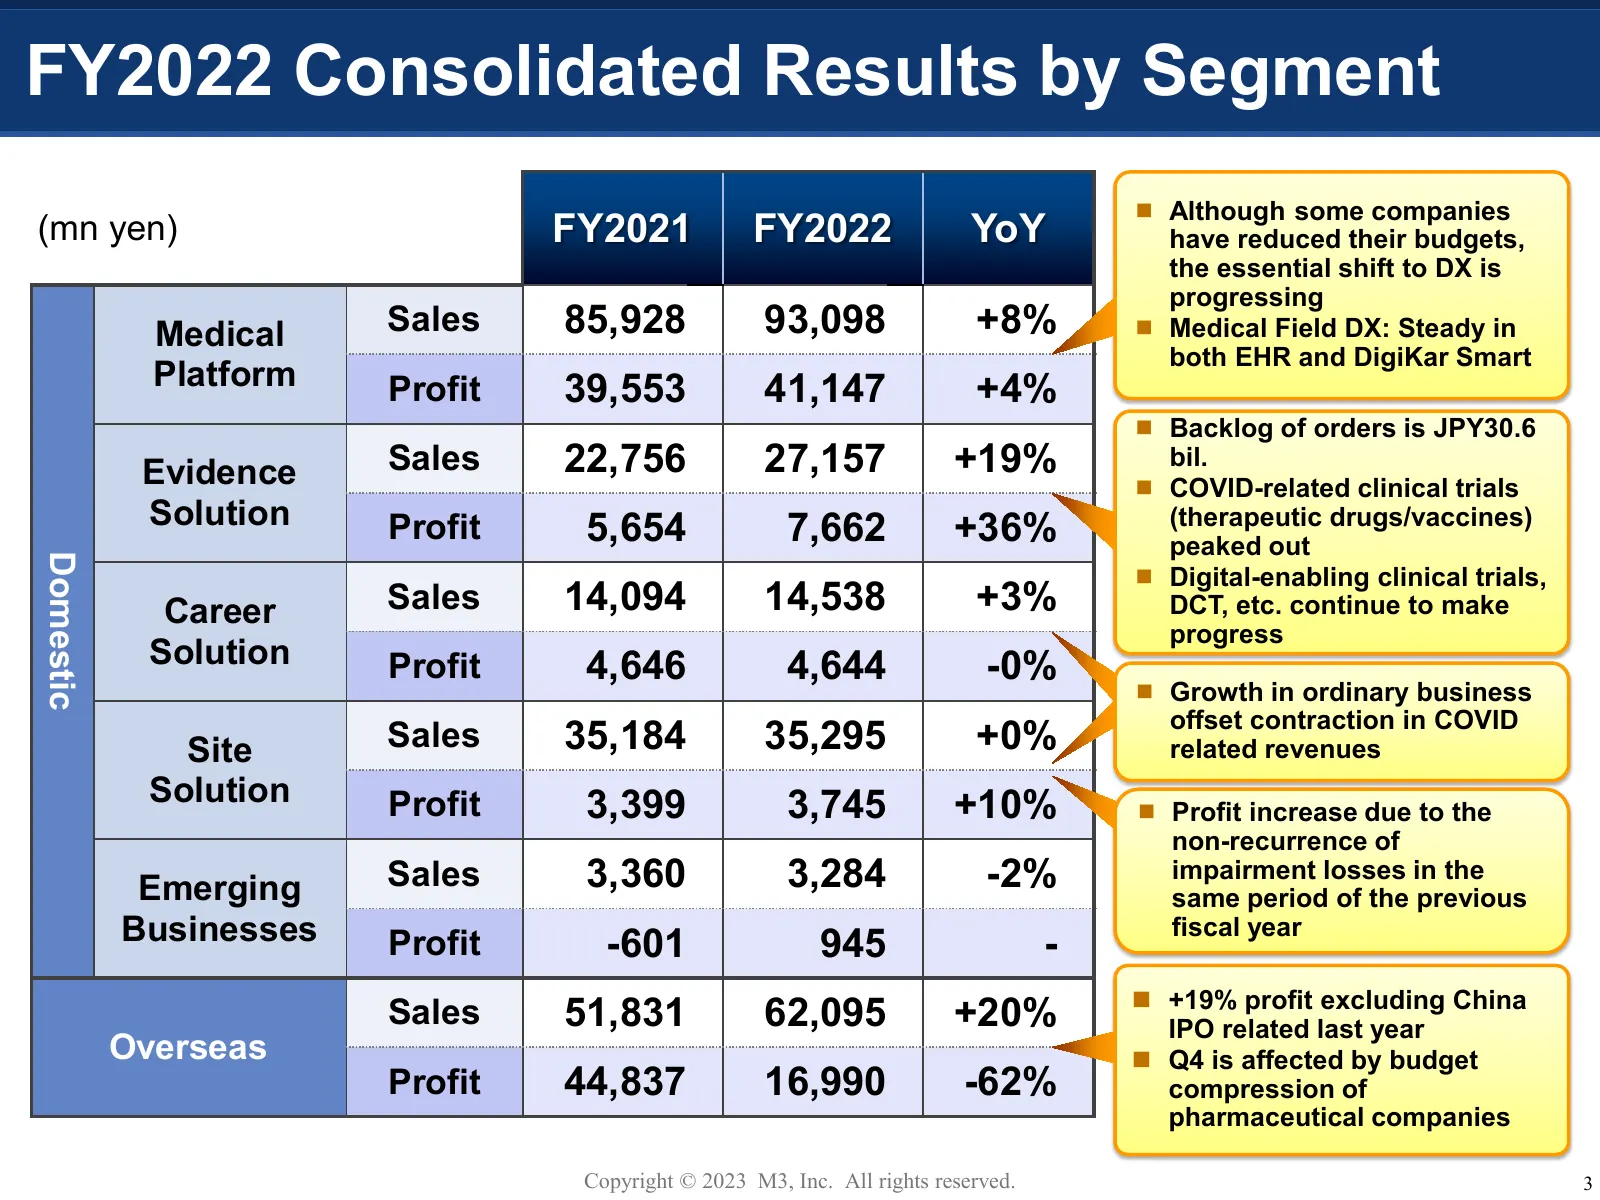
FY2022 Consolidated Results by Segment Although some companies (mn yen) FY2021 FY2022 YoY have reduced their budgets, the essential shift to DX is progressing Medical Sales 85,928 93,098 +8% Medical Field DX: Steady in both EHR and DigiKar Smart Platform Profit 39,553 41,147 +4% Backlog of ord
Slide 5: Consolidated Sales Trends and COVID Impact
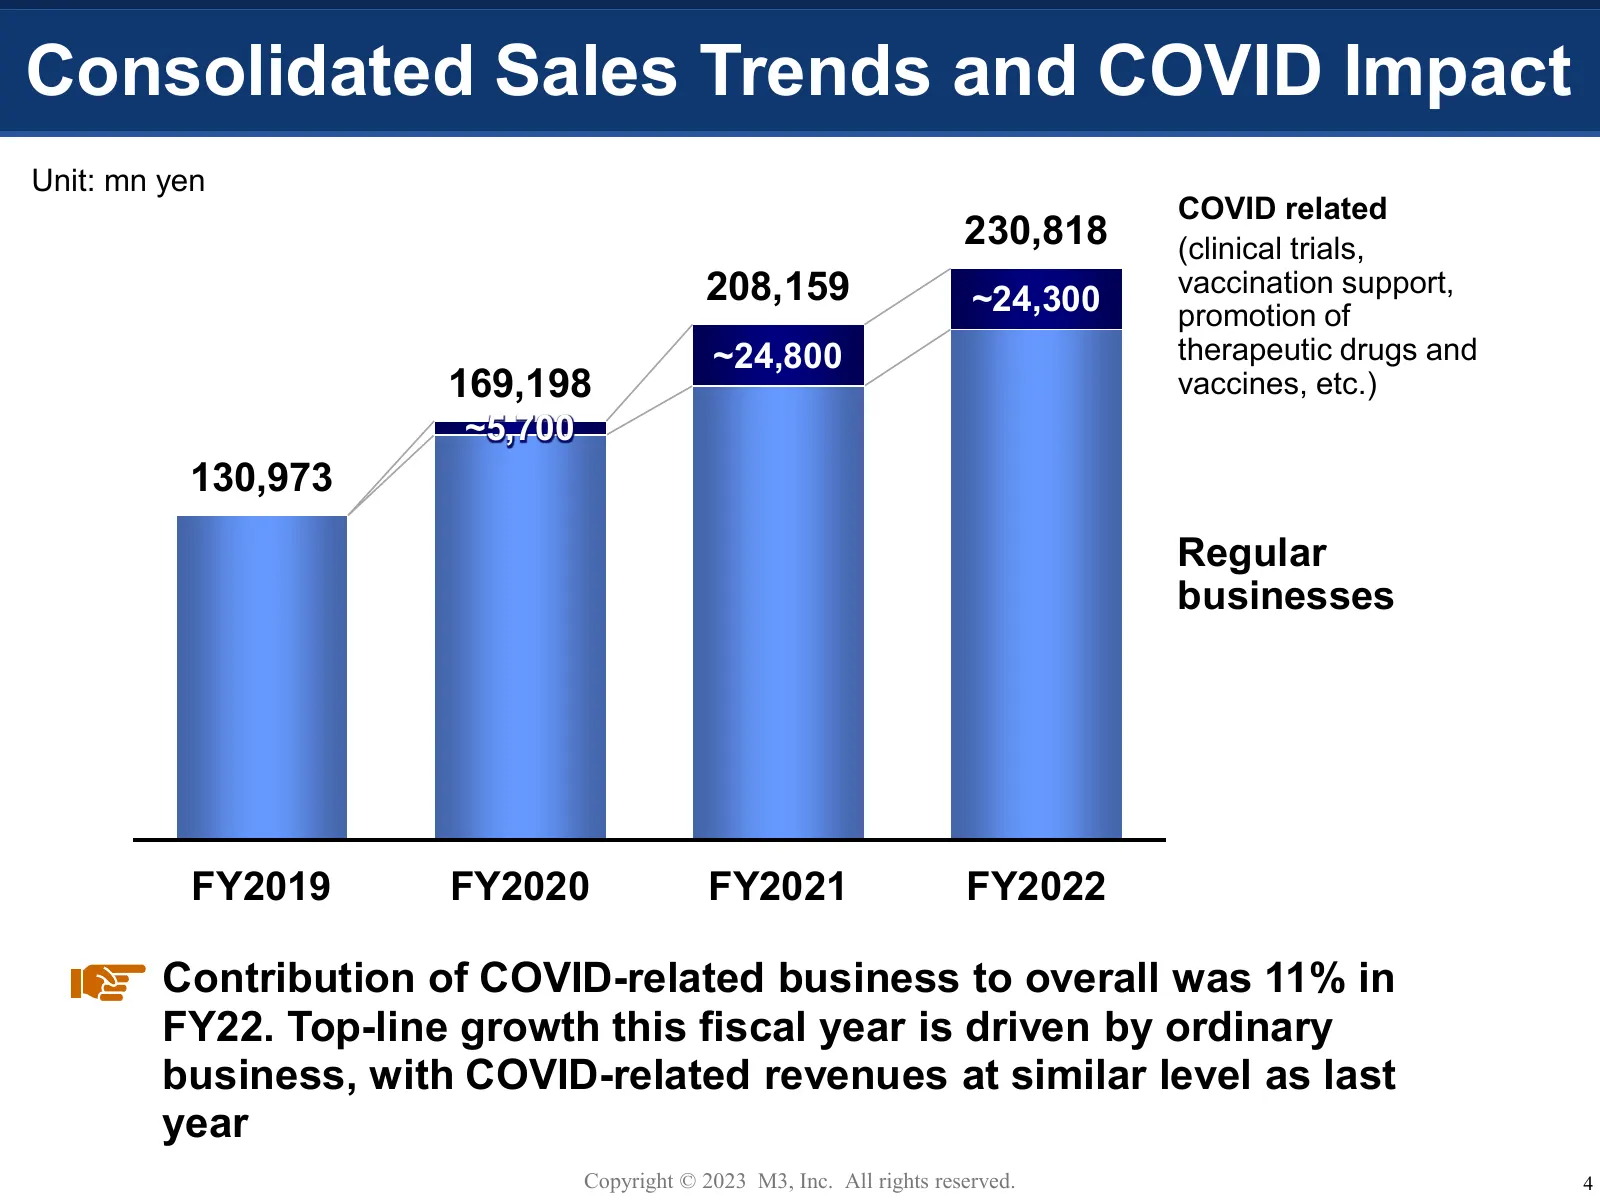
Consolidated Sales Trends and COVID Impact Unit: mn yen COVID related 230,818 (clinical trials, 208,159 ~24,300 vaccination support, promotion of ~24,800 therapeutic drugs and 169,198 vaccines, etc.) ~5,700 130,973 Regular businesses FY2019 FY2020 FY2021 FY2022 Contribution of COVID-related business
Slide 6: Sales Forecast for FY2023
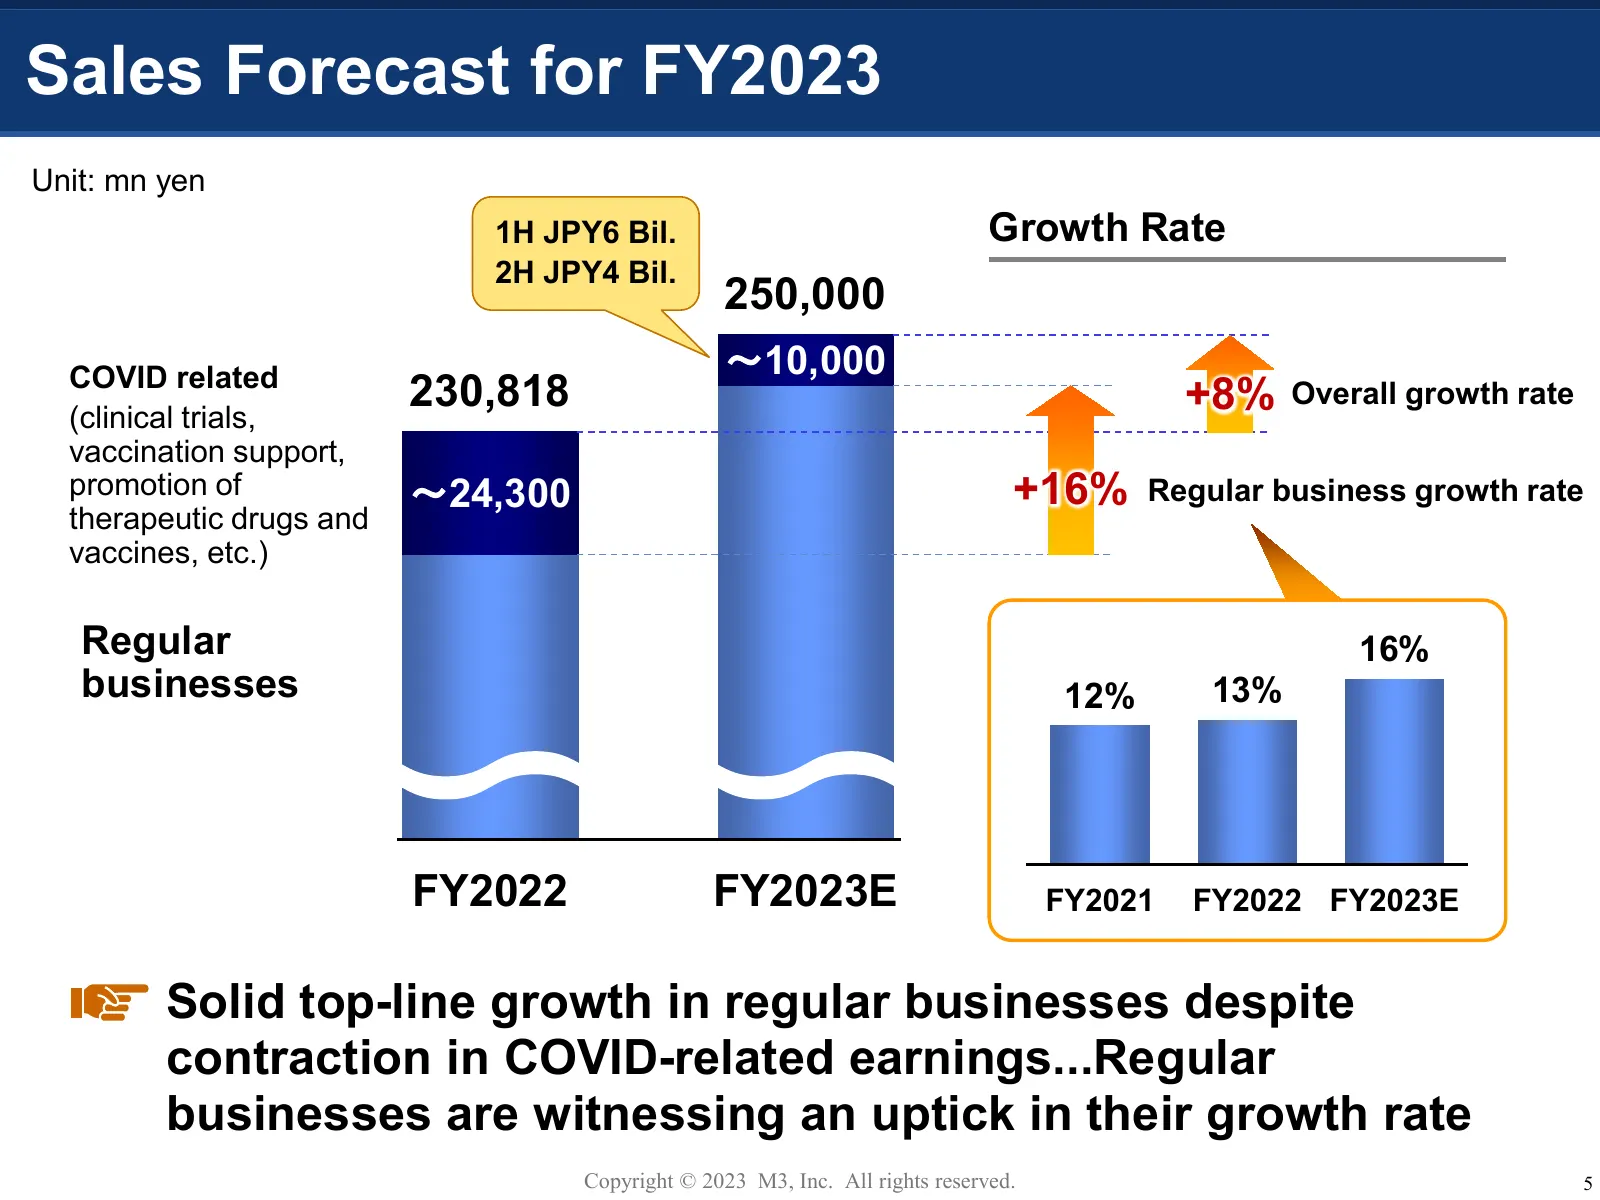
Sales Forecast for FY2023 Unit: mn yen 1H JPY6 Bil. Growth Rate 2H JPY4 Bil. 250,000 COVID related ~10,000 (clinical trials, 230,818 +8% Overall growth rate vaccination support, promotion of ~24,300 +16% Regular business growth rate therapeutic drugs and vaccines, etc.) Regular 16% businesses 12% 13
Slide 7: M3's Triple Growth Engine + CSV
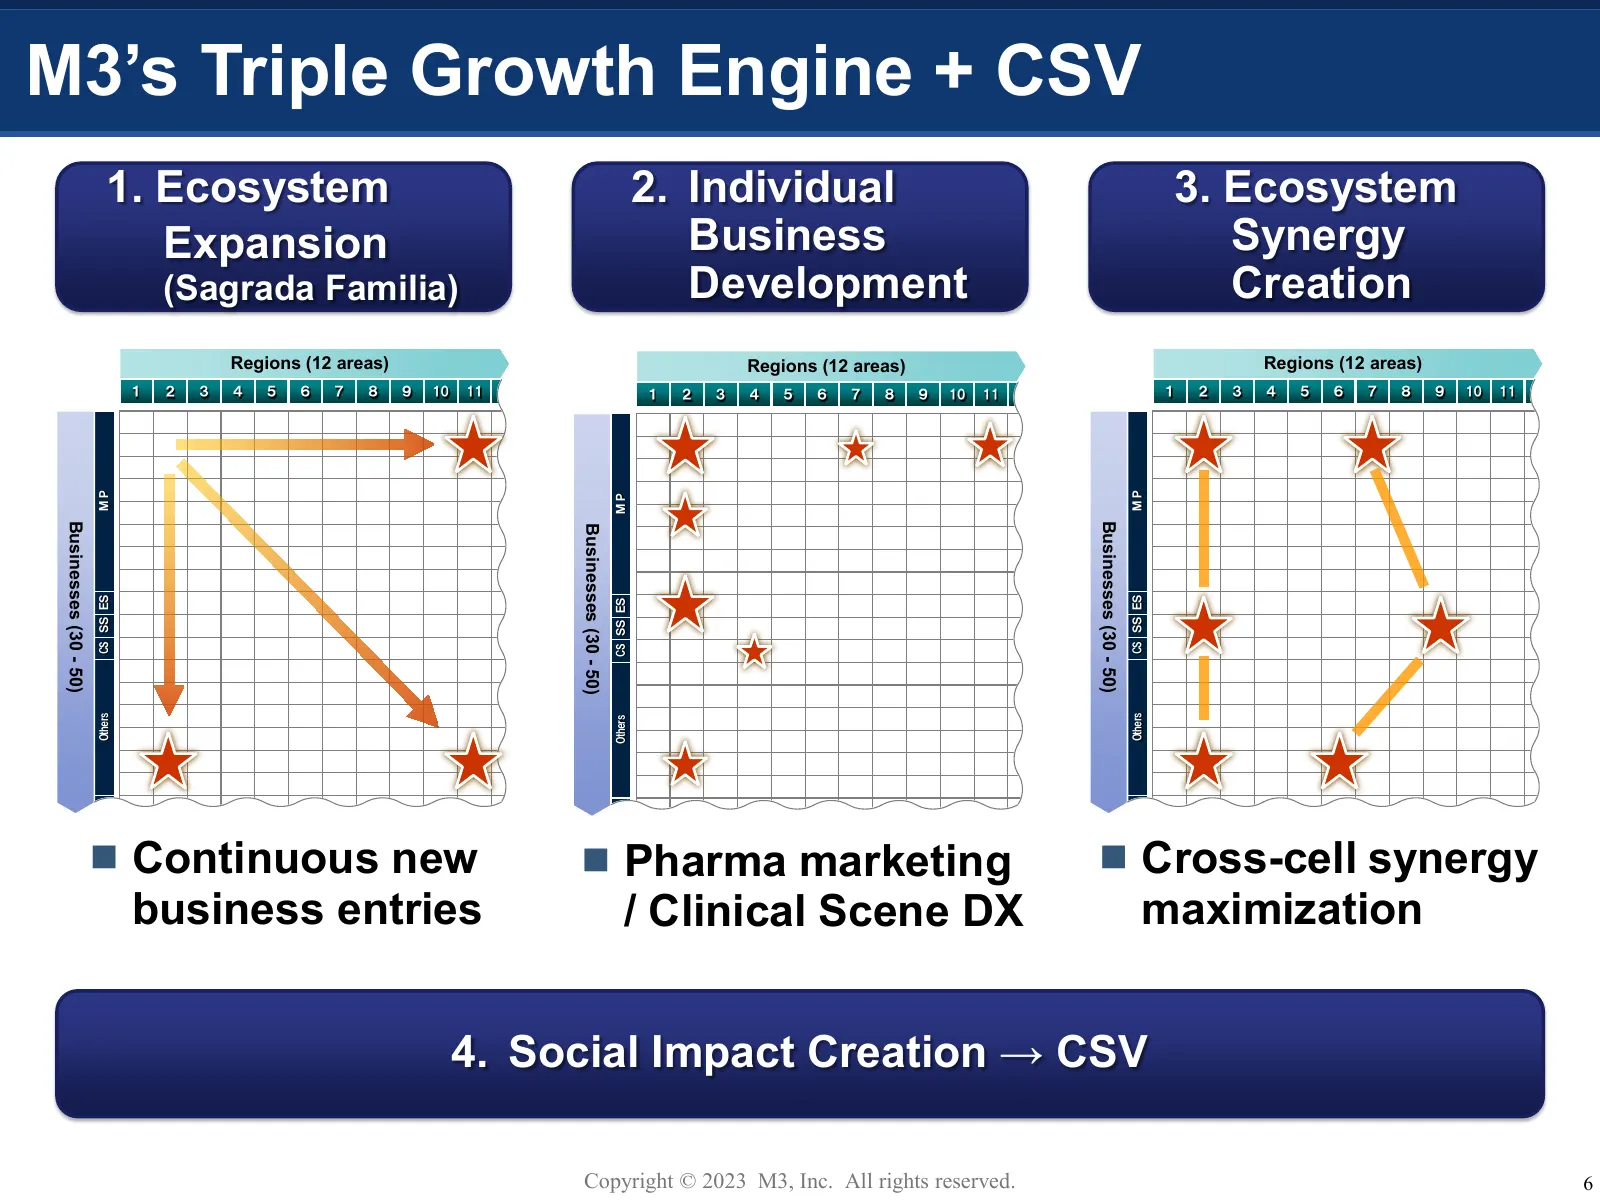
M3’s Triple Growth Engine + CSV 1. Ecosystem 2. Individual 3. Ecosystem Expansion Business Synergy (Sagrada Familia) Development Creation Regions (12 areas) Regions (12 areas) Regions (12 areas) 1 2 3 4 5 6 7 8 9 10 11 1 2 3 4 5 6 7 8 9 10 11 1 2 3 4 5 6 7 8 9 10 11 MP MP MP Businesses (30 - 50) Bus
Slide 8: Growth Engine 1: Ecosystem Expansion (Sagrada Familia)
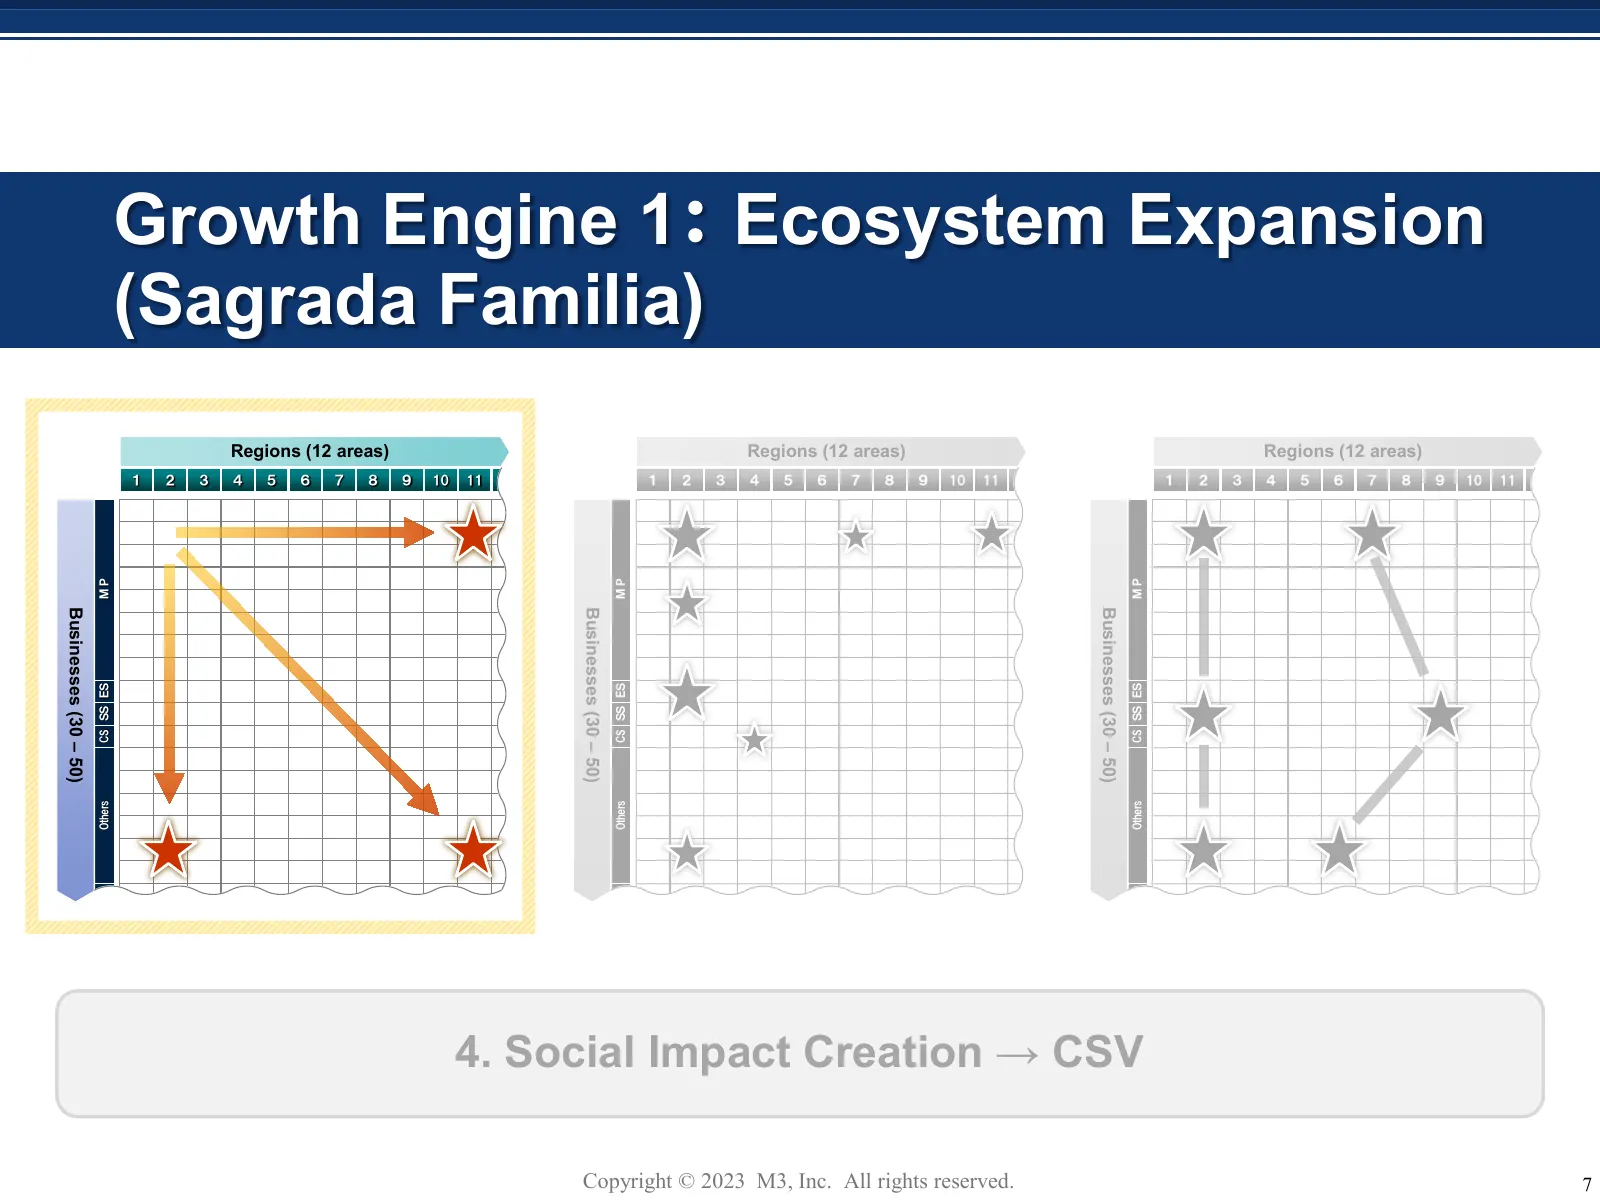
Growth Engine 1: Ecosystem Expansion (Sagrada Familia) Regions (12 areas) Regions (12 areas) Regions (12 areas) 1 2 3 4 5 6 7 8 9 10 11 1 2 3 4 5 6 7 8 9 10 11 1 2 3 4 5 6 7 8 9 10 11 MP MP MP Businesses (30 – 50) Businesses (30 – 50) Businesses (30 – 50) CS SS ES CS SS ES CS SS ES Others Others Oth
Slide 9: Leverage 3 Major Resources to Solve Healthcare Issues
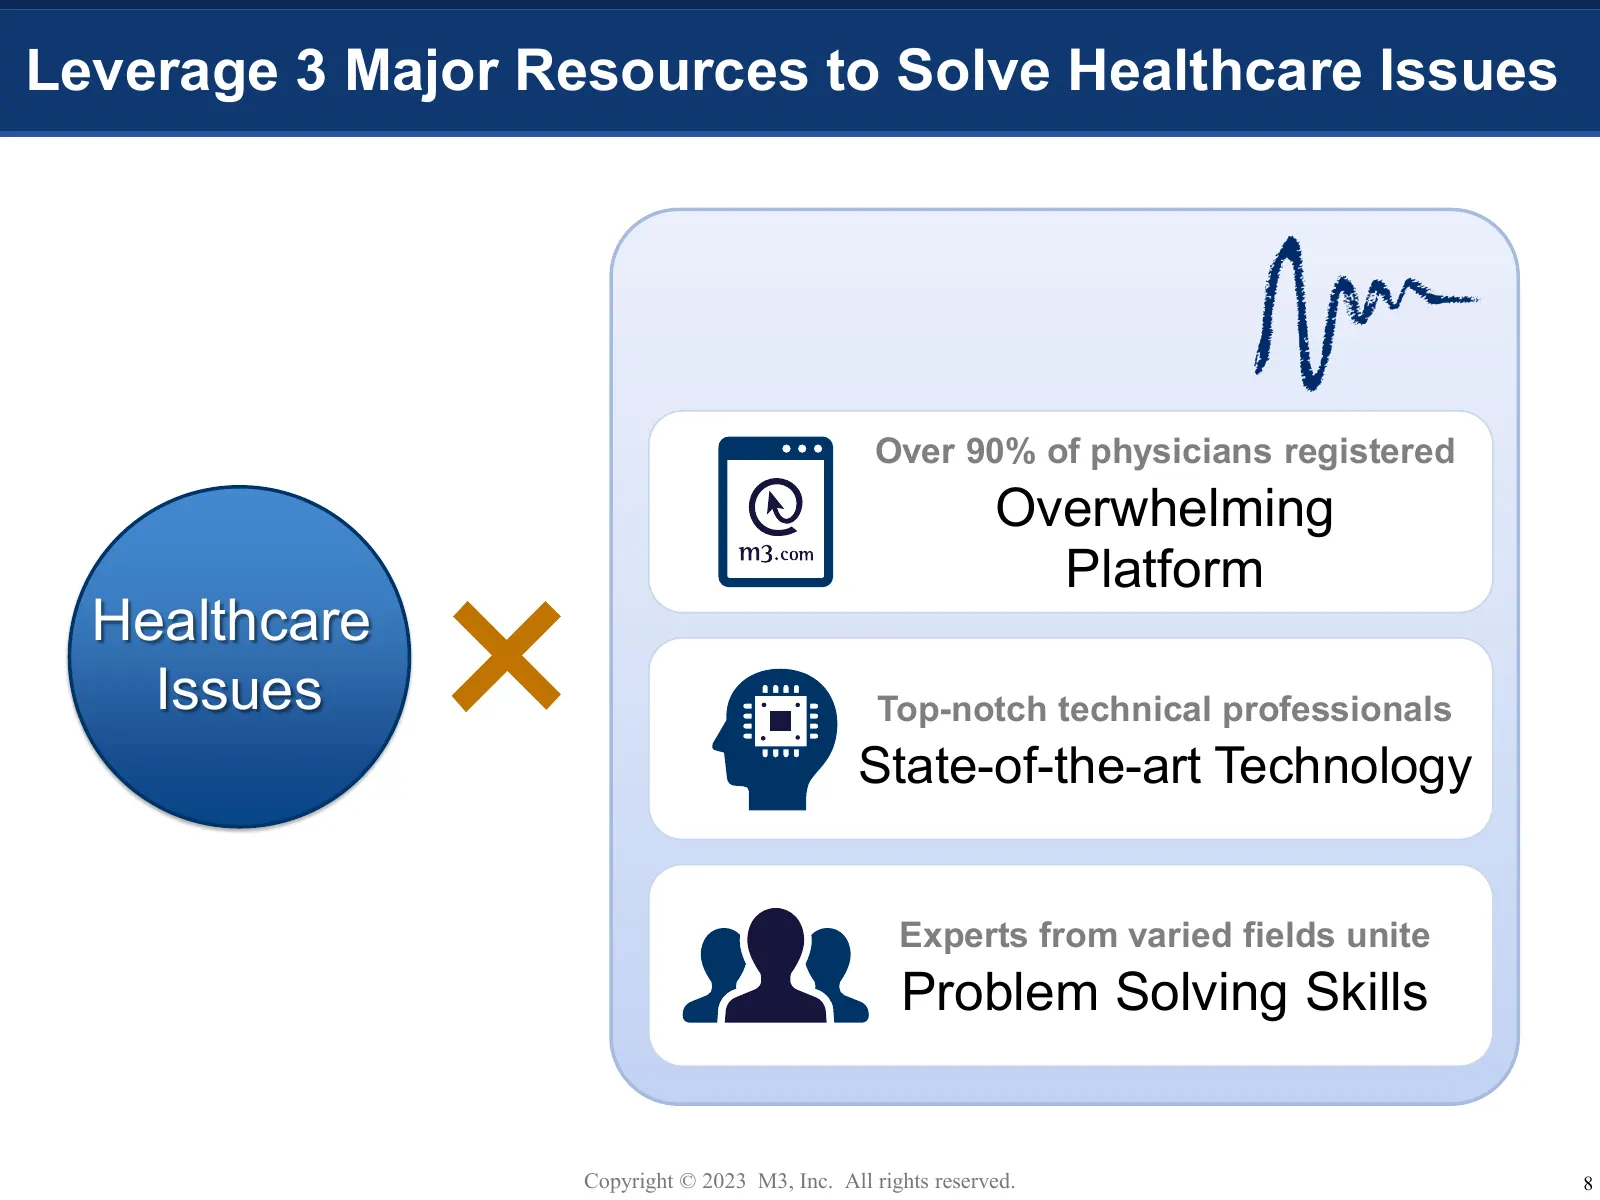
Leverage 3 Major Resources to Solve Healthcare Issues Over 90% of physicians registered Overwhelming Platform Healthcare Issues × Top-notch technical professionals State-of-the-art Technology Experts from varied fields unite Problem Solving Skills Copyright © 2023 M3, Inc. All rights reserved. 8
Slide 10: Business Scope Expansion and Growth Potential
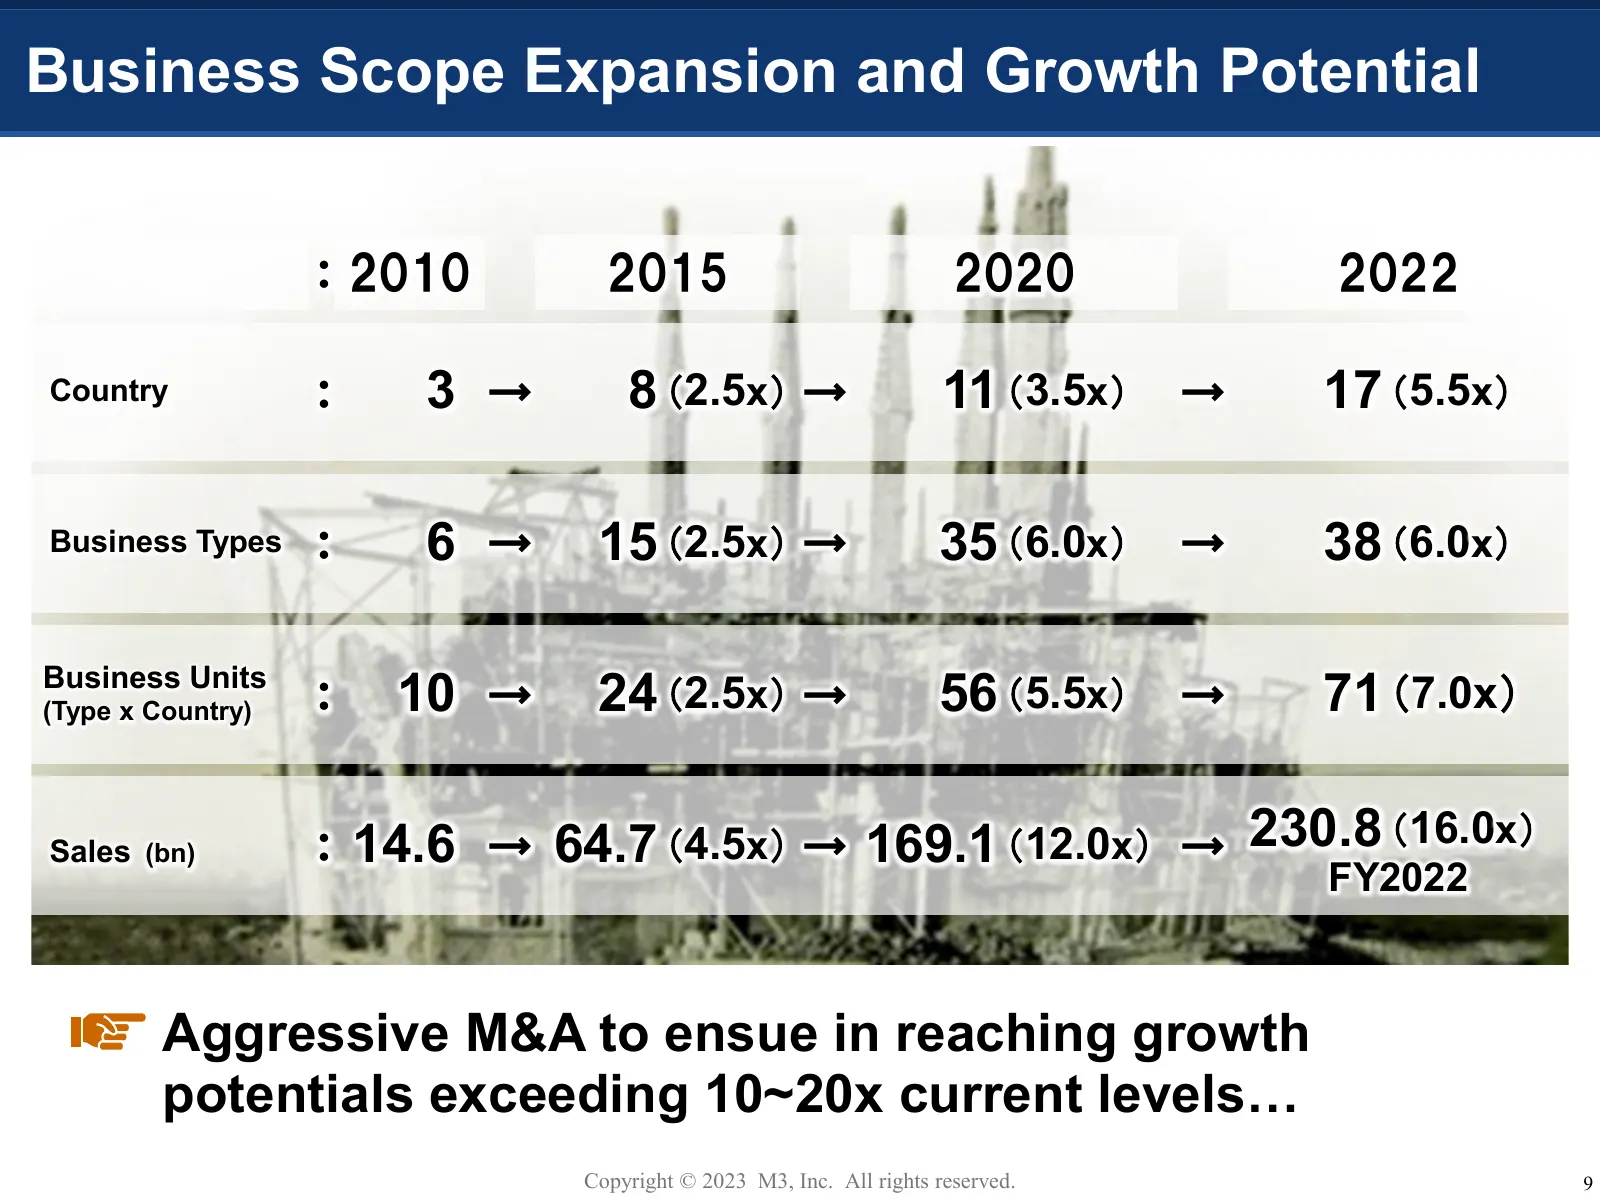
Business Scope Expansion and Growth Potential : 2010 2015 2020 2022 Country : 3 → 8 (2.5x) → 11 (3.5x) → 17 (5.5x) Business Types : 6 → 15 (2.5x) → 35 (6.0x) → 38 (6.0x) Business Units (Type x Country) : 10 → 24 (2.5x) → 56 (5.5x) → 71 (7.0x) Sales (bn) : 14.6 → 64.7 (4.5x) → 169.1 (12.0x) → 230.8 (
Slide 11: Growth Trend per Business Expansion Phases
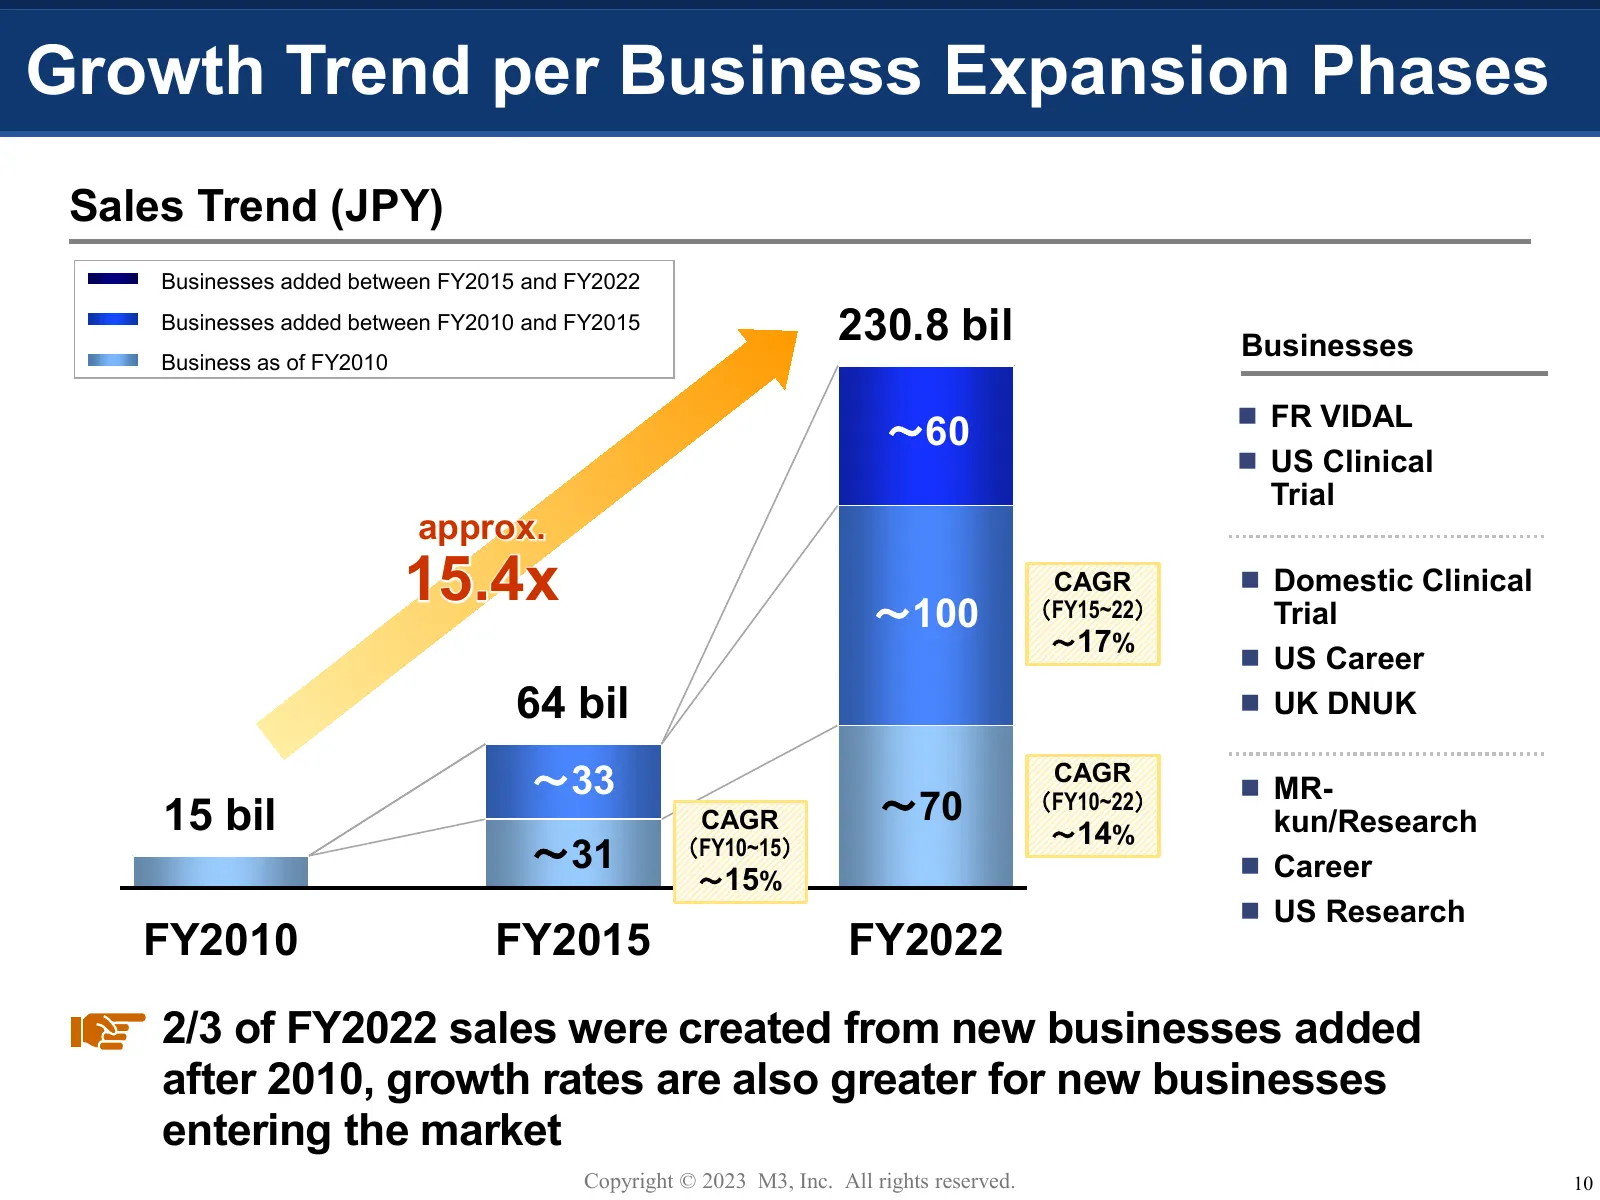
Growth Trend per Business Expansion Phases Sales Trend (JPY) Businesses added between FY2015 and FY2022 Businesses added between FY2010 and FY2015 230.8 bil Businesses Business as of FY2010 FR VIDAL ~60 US Clinical Trial approx. 15.4x ~100 CAGR (FY15~22) Domestic Clinical Trial ~17% US Caree
Slide 12: Growth Image per Business Expansion Phases
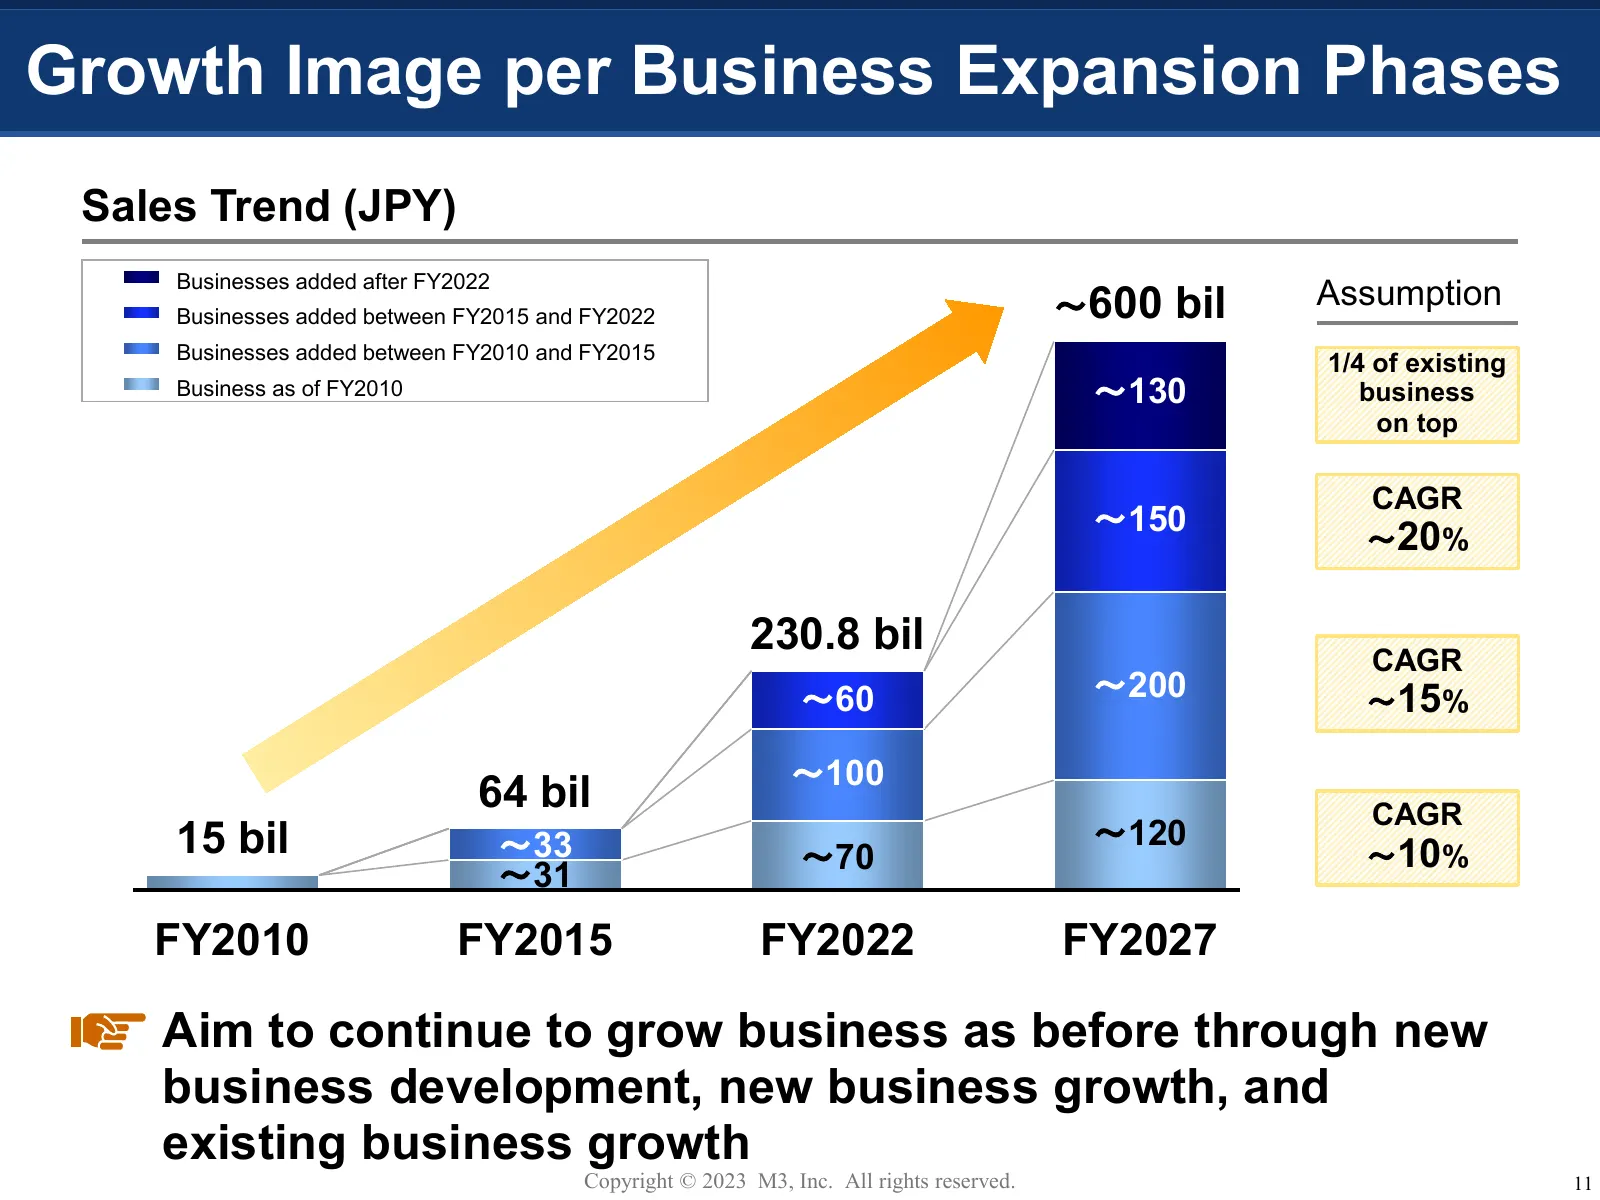
Growth Image per Business Expansion Phases Sales Trend (JPY) Businesses added after FY2022 ~600 bil Assumption Businesses added between FY2015 and FY2022 Businesses added between FY2010 and FY2015 1/4 of existing Business as of FY2010 ~130 business on top CAGR ~150 ~20% 230.8 bil CAGR ~60 ~200 ~15%
Slide 13: Sales Composition Ratio: Past and Future Image
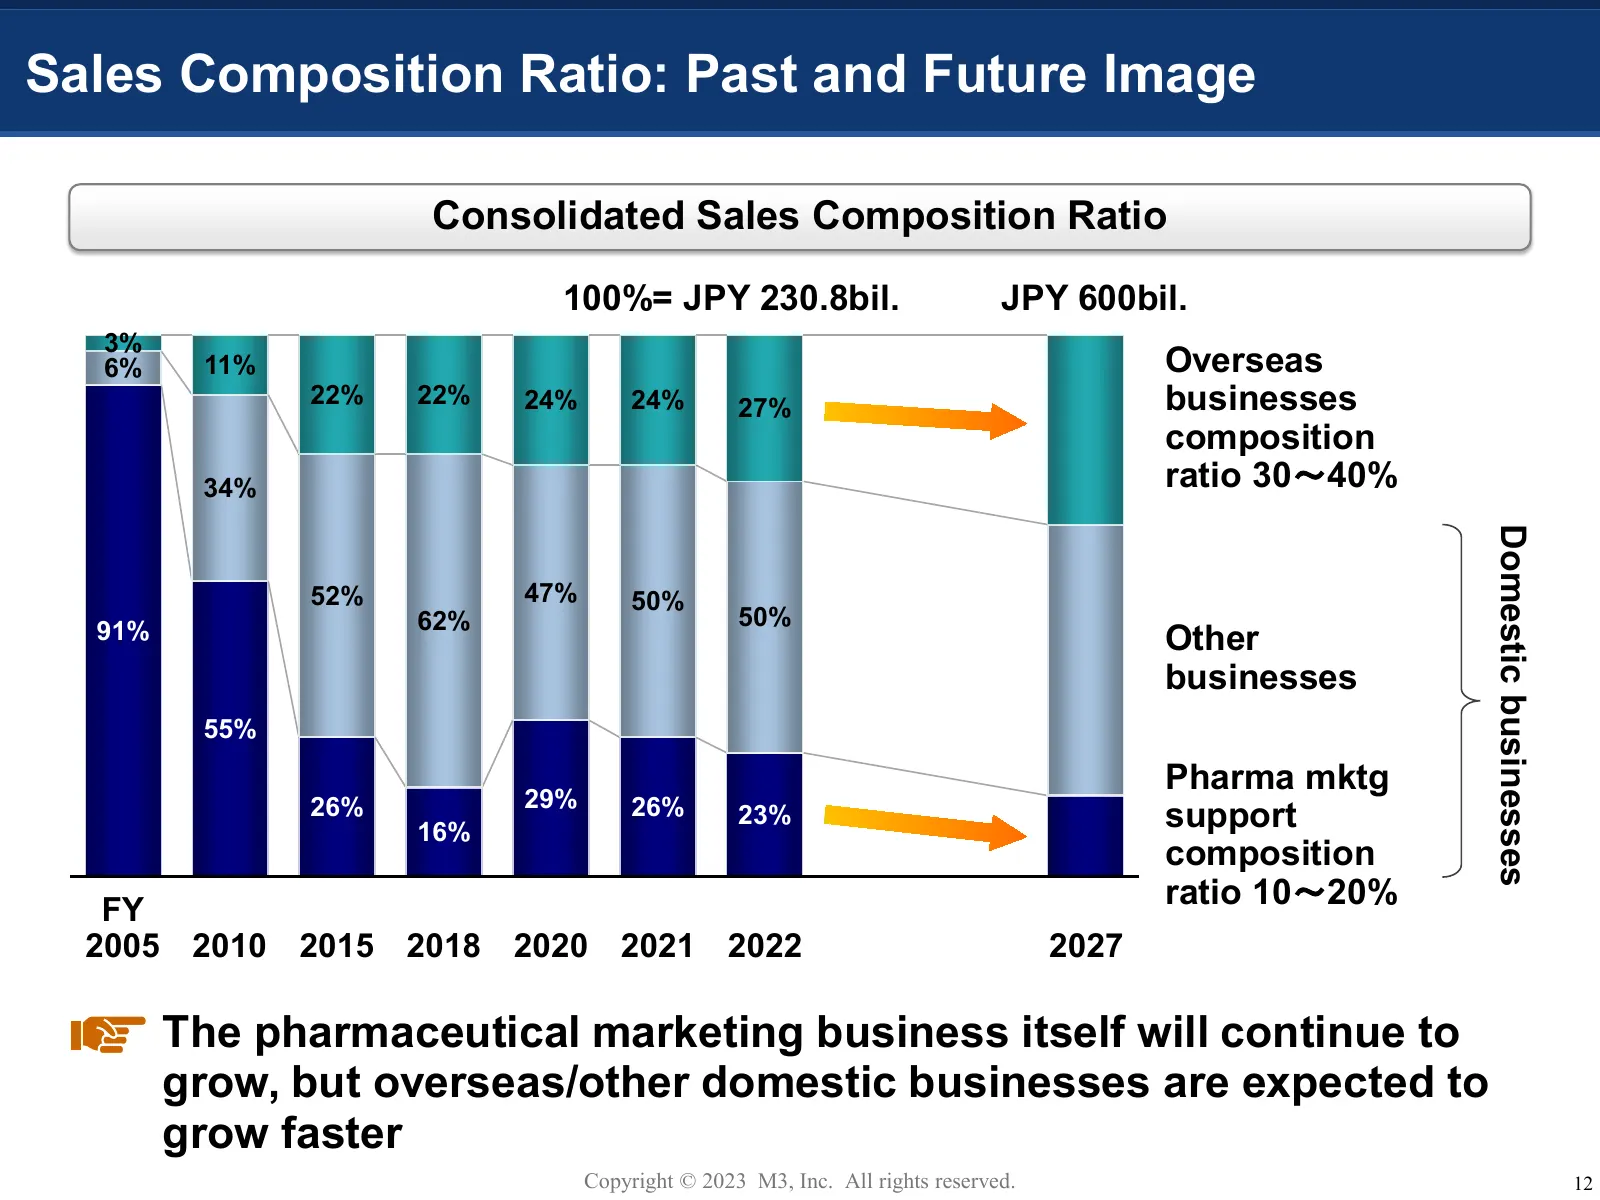
Sales Composition Ratio: Past and Future Image Consolidated Sales Composition Ratio 100%= JPY 230.8bil. JPY 600bil. 3% 6% 11% Overseas 22% 22% 24% 24% 27% businesses composition 34% ratio 30~40% Domestic businesses 52% 47% 50% 62% 50% 91% Other businesses 55% Pharma mktg 26% 29% 26% 16% 23% support
Slide 14: Trend in M&A Volume: Programmatic M&A Strategy
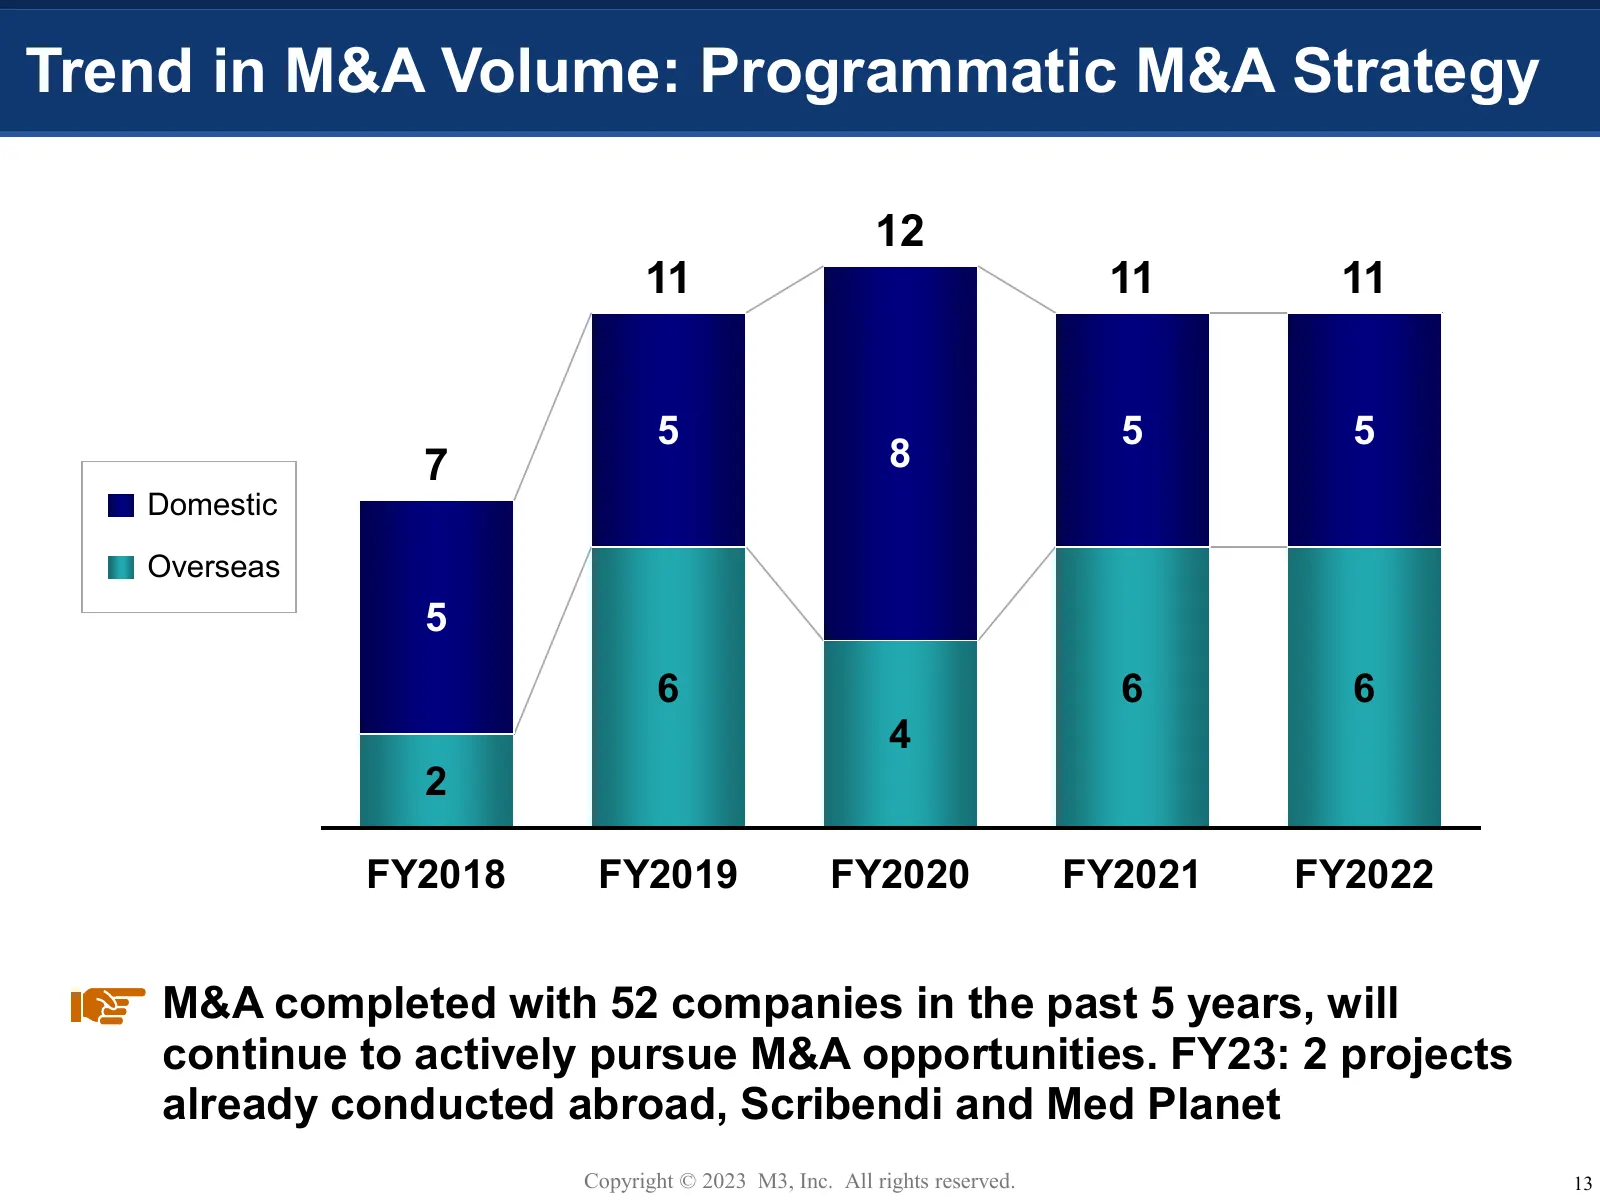
Trend in M&A Volume: Programmatic M&A Strategy 12 11 11 11 5 5 5 7 8 Domestic Overseas 5 6 6 6 4 2 FY2018 FY2019 FY2020 FY2021 FY2022 M&A completed with 52 companies in the past 5 years, will continue to actively pursue M&A opportunities. FY23: 2 projects already conducted abroad, Scribendi and Med
Slide 15: Business Expansion Creation Flow
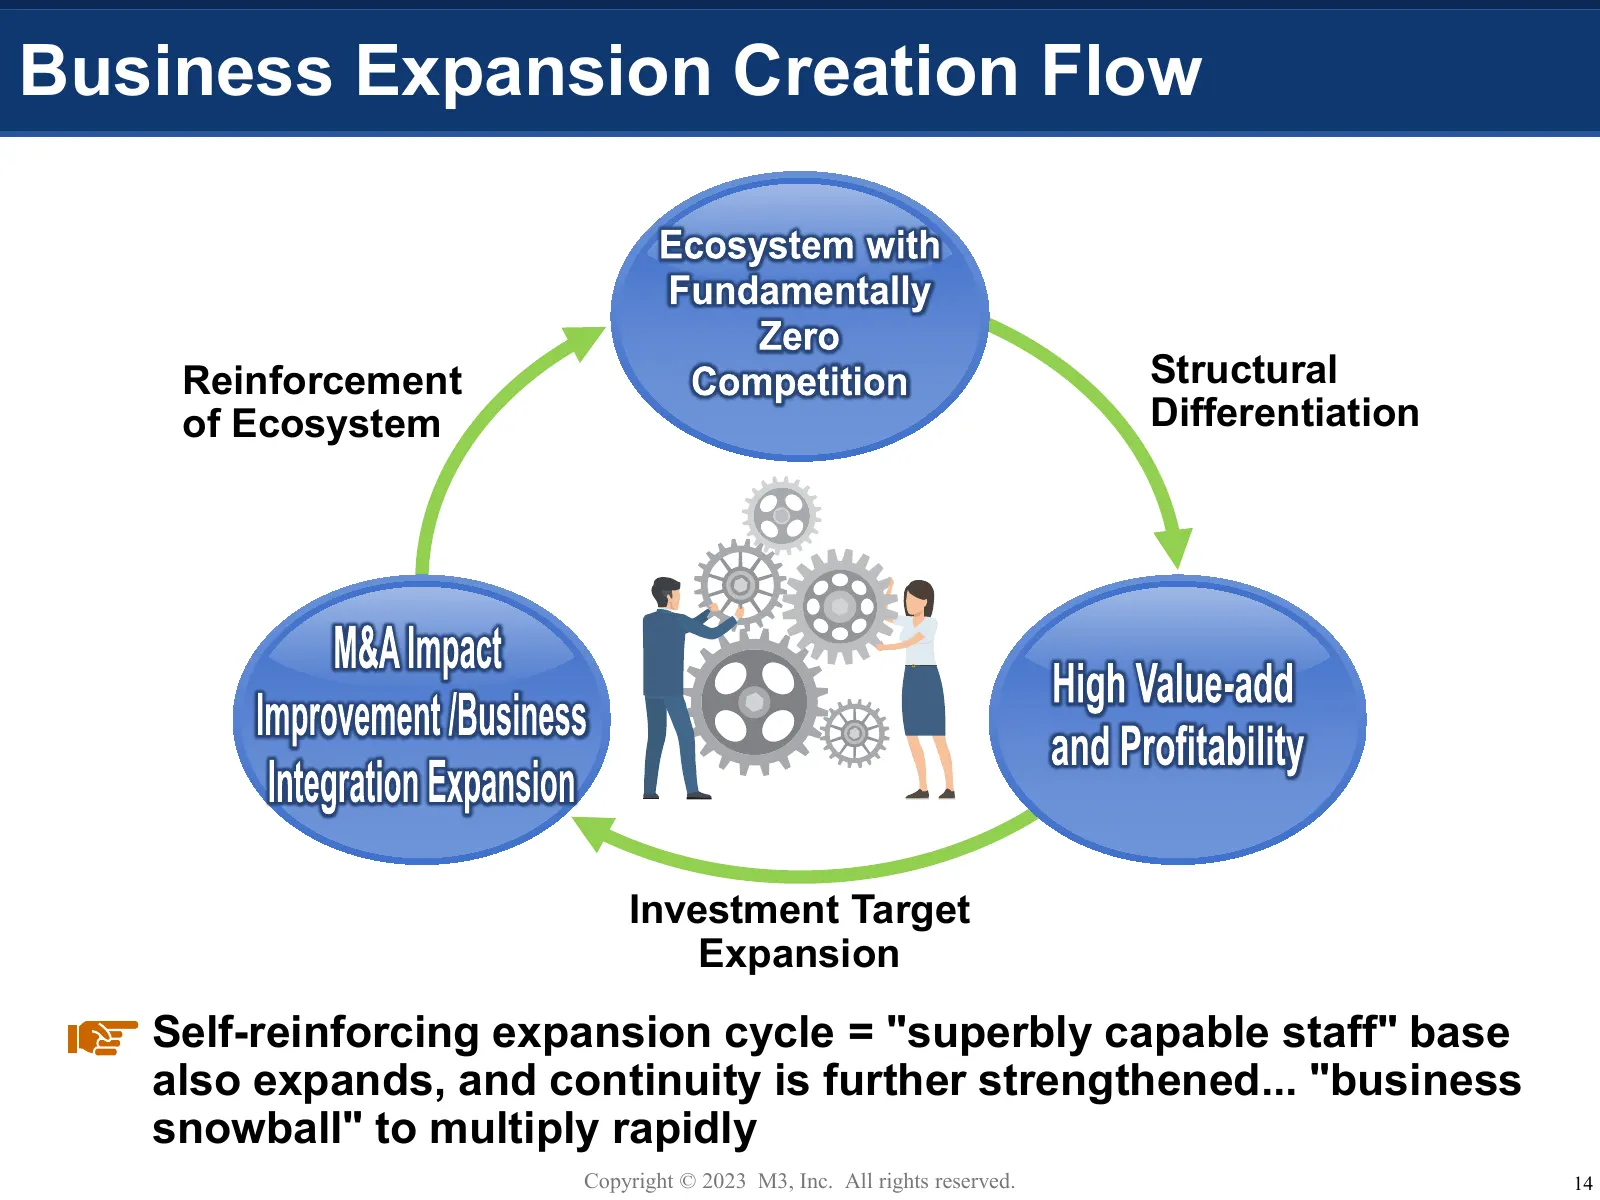
Business Expansion Creation Flow Reinforcement Structural of Ecosystem Differentiation Investment Target Expansion Self-reinforcing expansion cycle = "superbly capable staff" base also expands, and continuity is further strengthened... "business snowball" to multiply rapidly Copyright © 2023 M3, Inc
Slide 16: Growth Engine 2: Individual Business Development
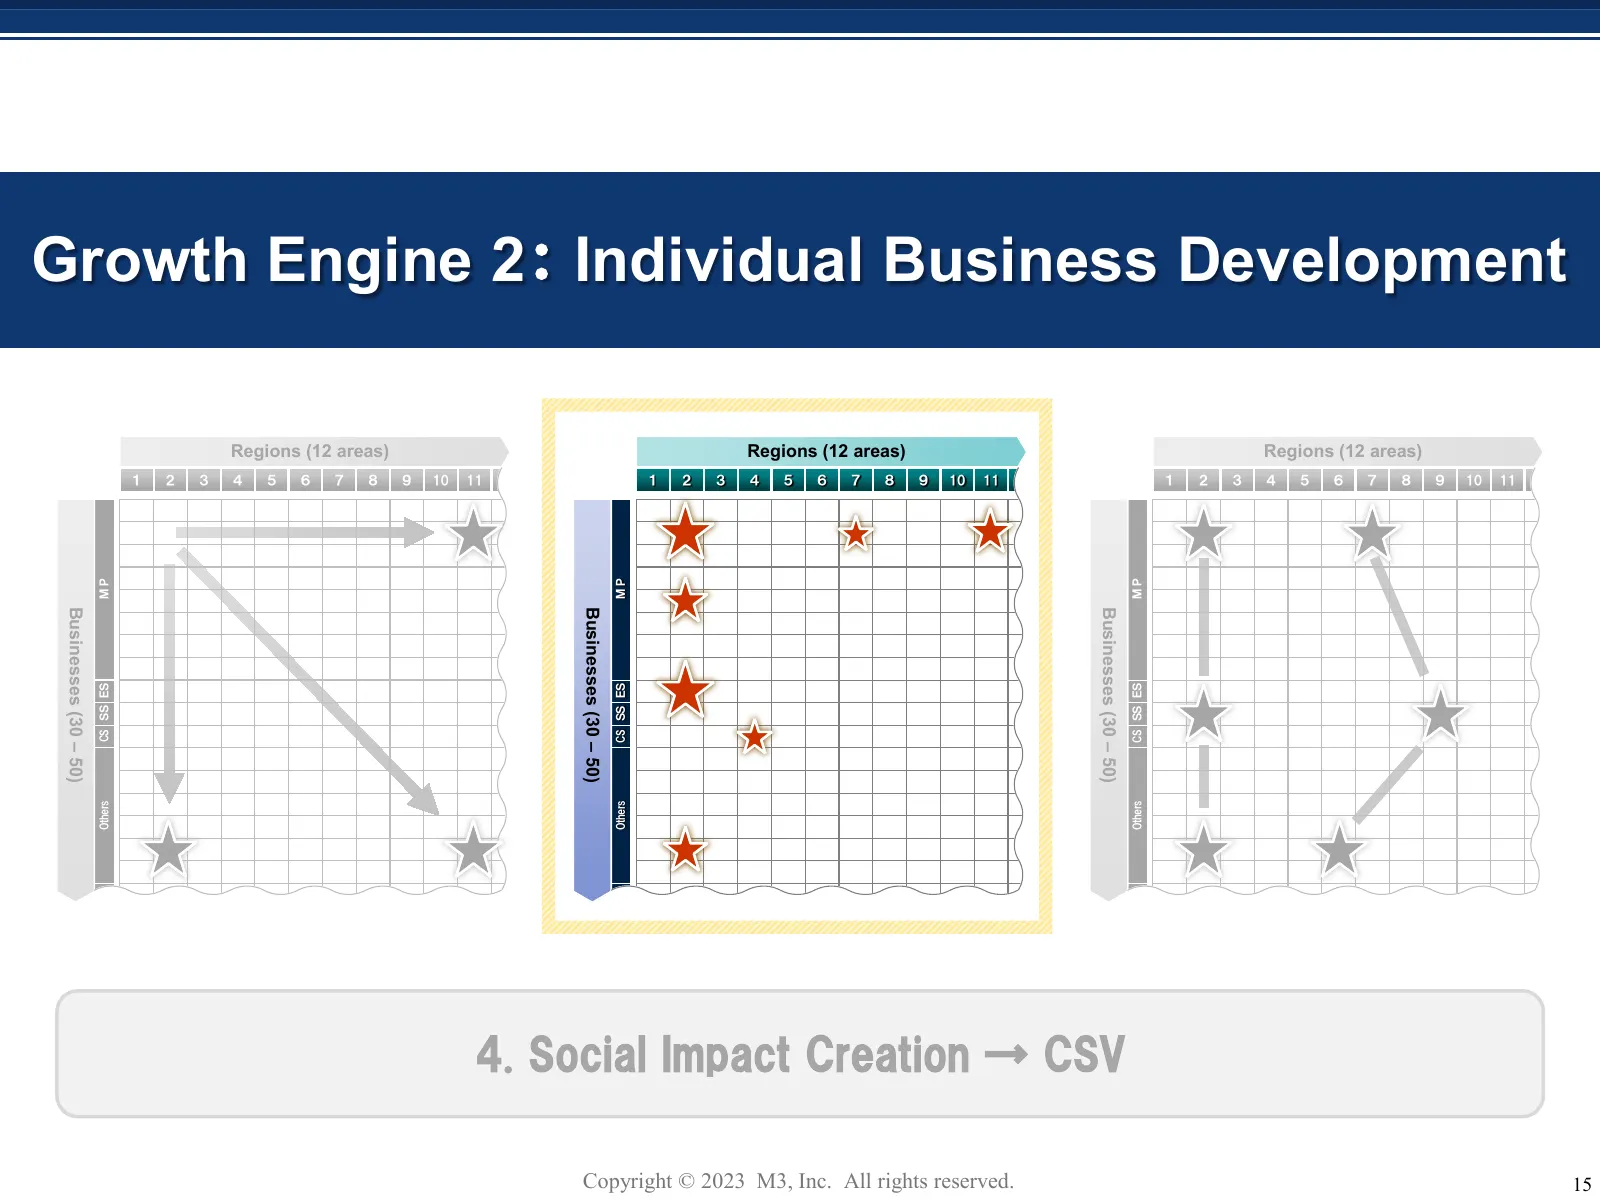
Growth Engine 2: Individual Business Development Regions (12 areas) Regions (12 areas) Regions (12 areas) 1 2 3 4 5 6 7 8 9 10 11 1 2 3 4 5 6 7 8 9 10 11 1 2 3 4 5 6 7 8 9 10 11 MP MP MP Businesses (30 – 50) Businesses (30 – 50) Businesses (30 – 50) CS SS ES CS SS ES CS SS ES Others Others Others 4.
Slide 17: Pharmaceutical Sales & Marketing DX
Pharmaceutical Sales & Marketing DX Copyright © 2023 M3, Inc. All rights reserved. 16
Slide 18: Pharma Marketing Cost and TAM for M3
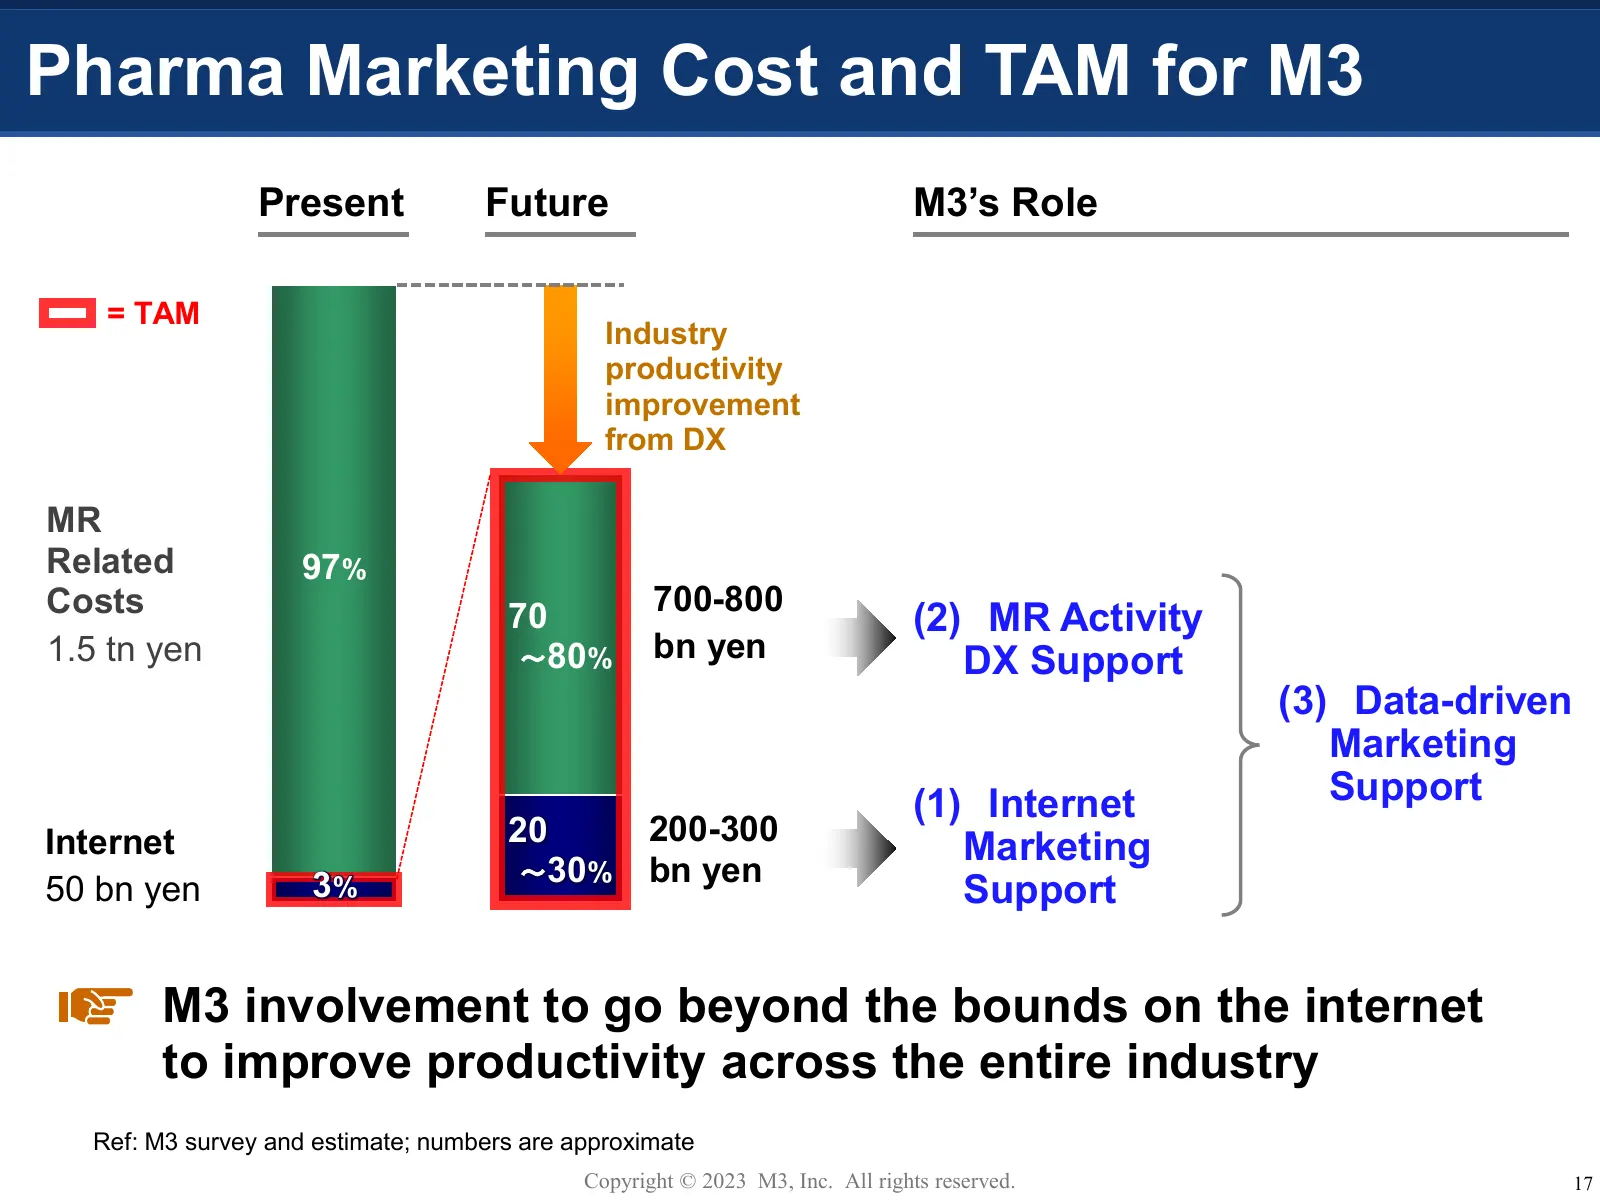
Pharma Marketing Cost and TAM for M3 Present Future M3’s Role = TAM Industry productivity improvement from DX MR Related 97% Costs 700-800 70 (2) MR Activity 1.5 tn yen ~80% bn yen DX Support (3) Data-driven Marketing (1) Internet Support Internet 20 200-300 Marketing 3% ~30% bn yen 50 bn yen Suppor
Slide 19: Professional Staff Fortification Plan
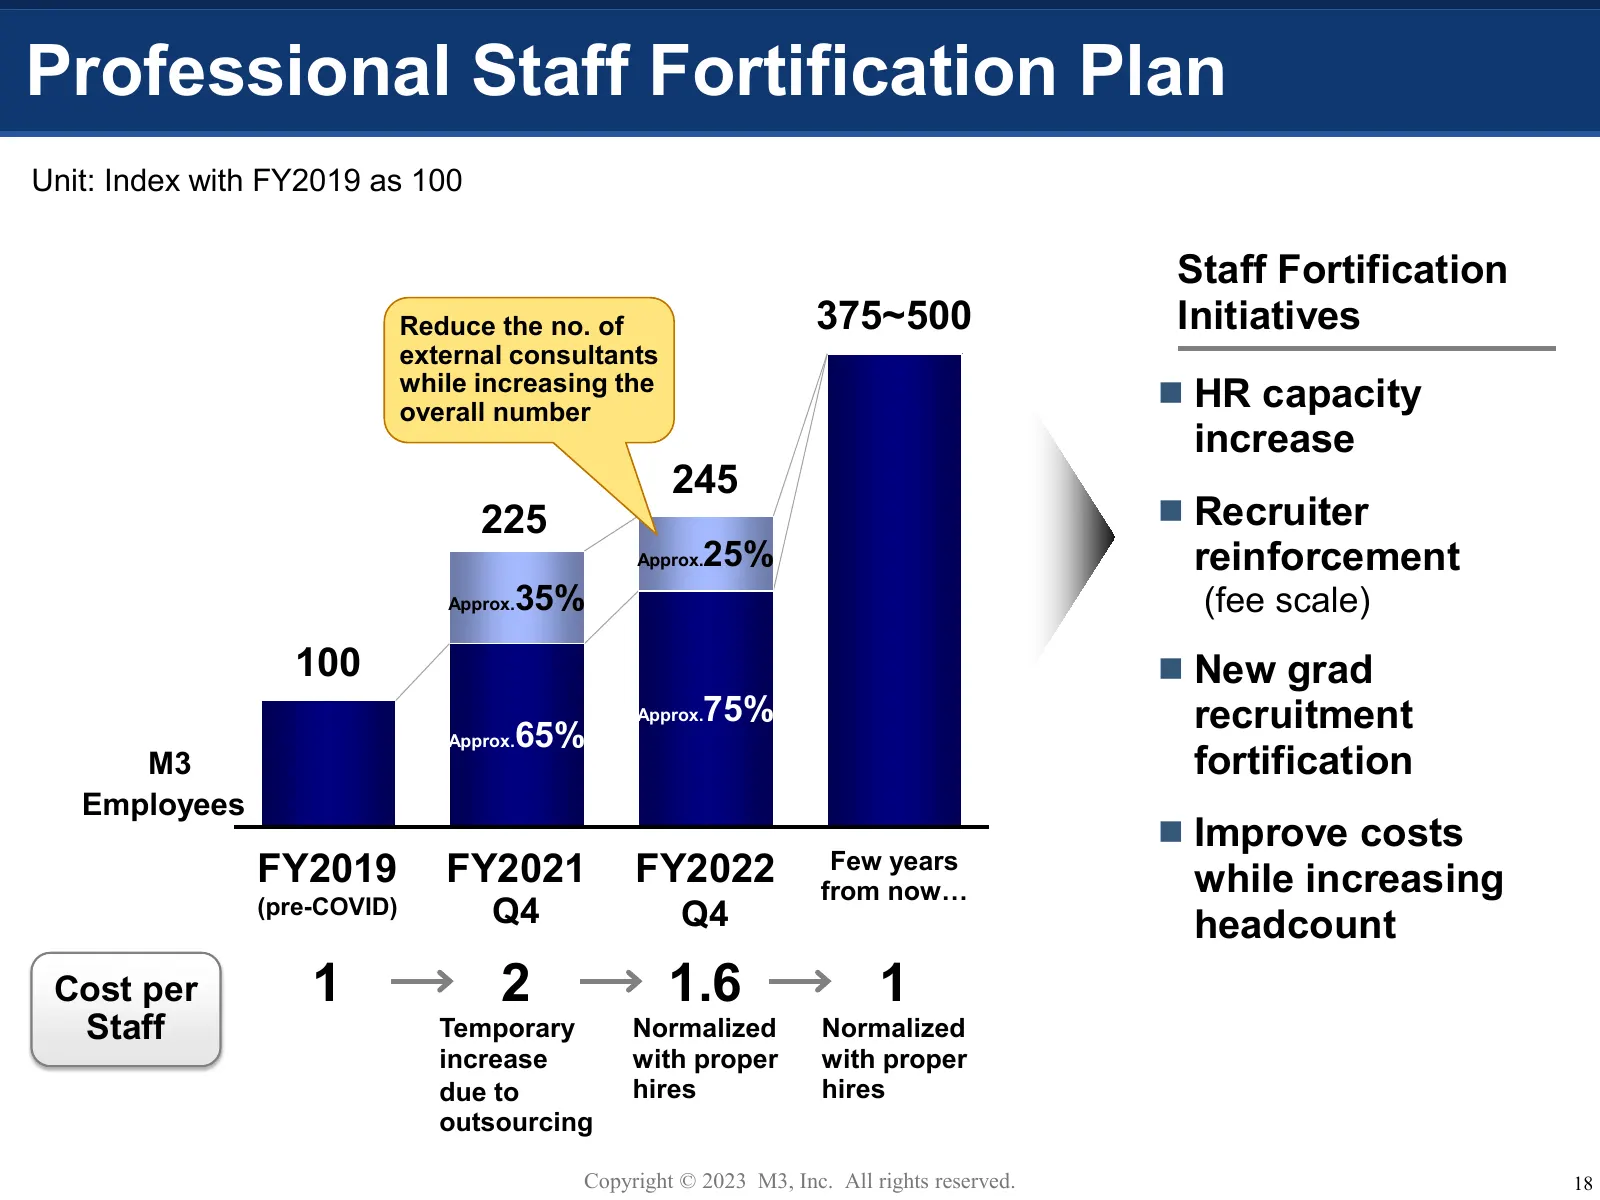
Professional Staff Fortification Plan Unit: Index with FY2019 as 100 Staff Fortification Reduce the no. of 375~500 Initiatives external consultants while increasing the overall number HR capacity increase 245 225 Recruiter Approx. 25% reinforcement Approx. 35% (fee scale) 100 New grad Approx.
Slide 20: DX of the Clinical Scene
DX of the Clinical Scene Copyright © 2023 M3, Inc. All rights reserved. 19
Slide 21: DX of Clinics: Creating a New Patient Experience
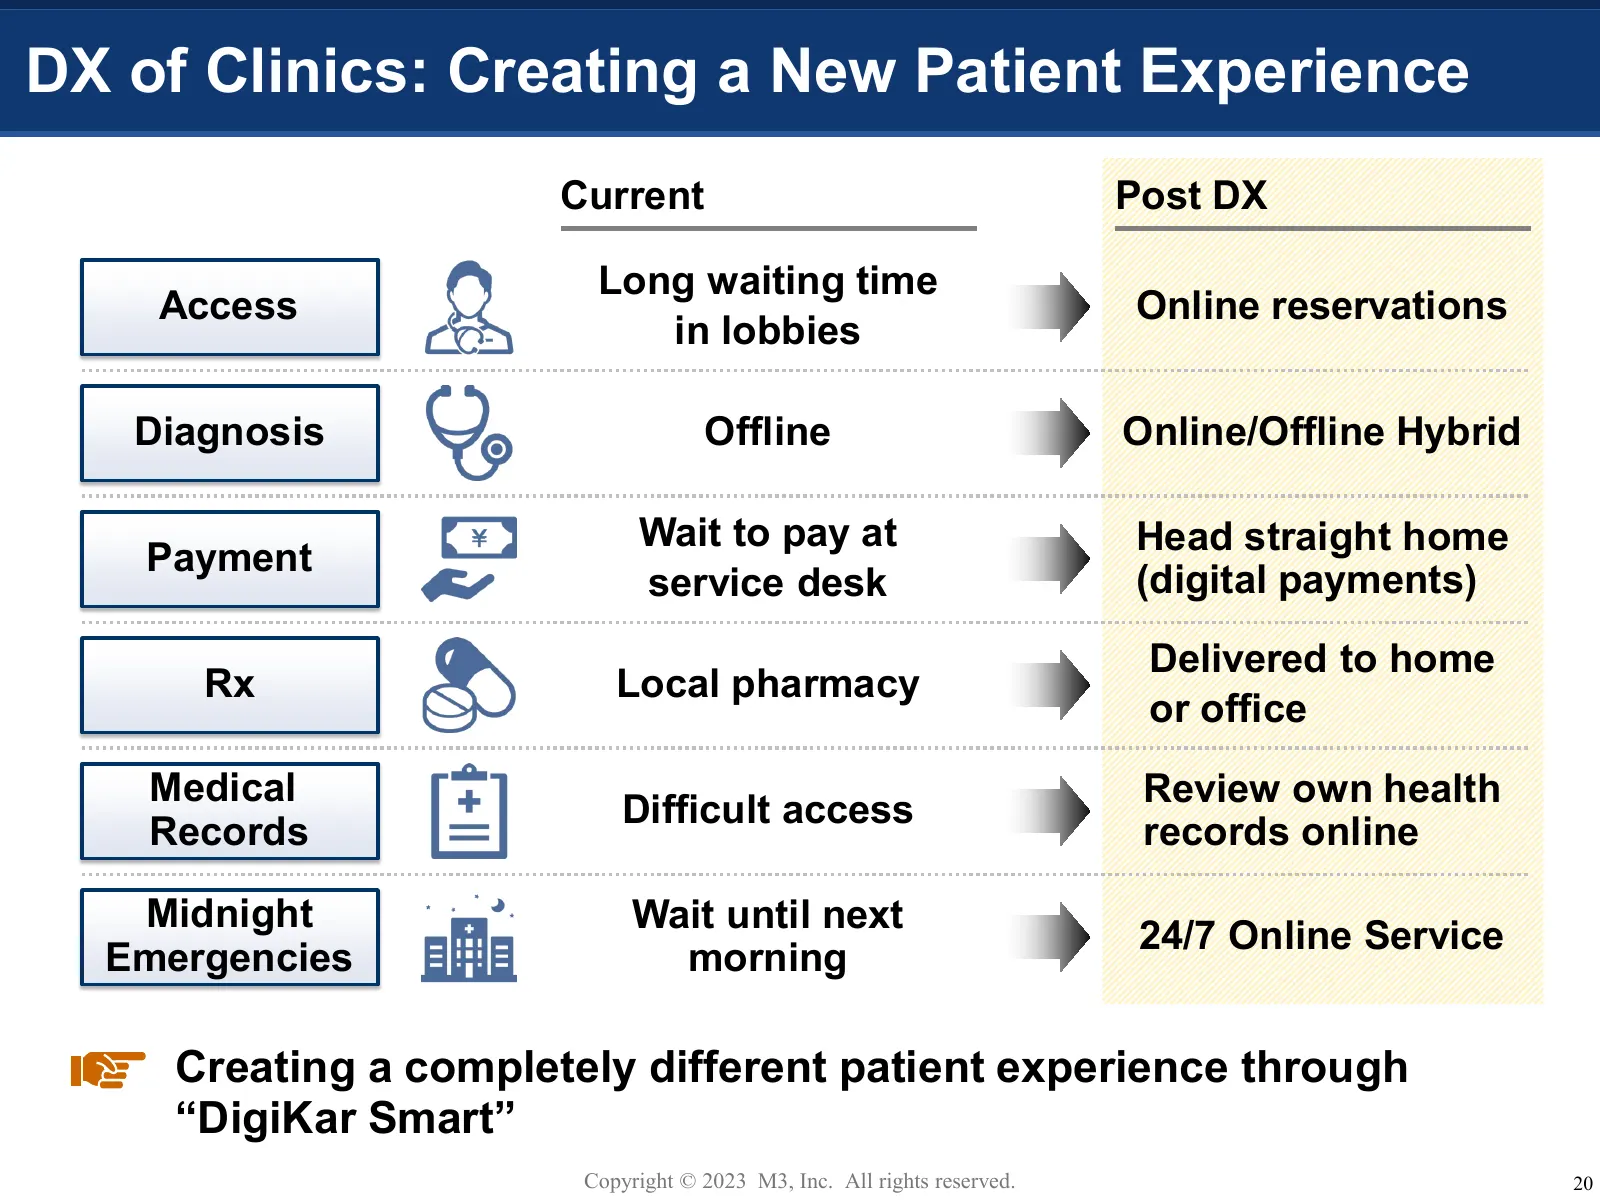
DX of Clinics: Creating a New Patient Experience Current Post DX Long waiting time Access Online reservations in lobbies Diagnosis Offline Online/Offline Hybrid Wait to pay at Head straight home Payment service desk (digital payments) Delivered to home Rx Local pharmacy or office Medical Review own
Slide 22: M3 DigiKar EHR Growth
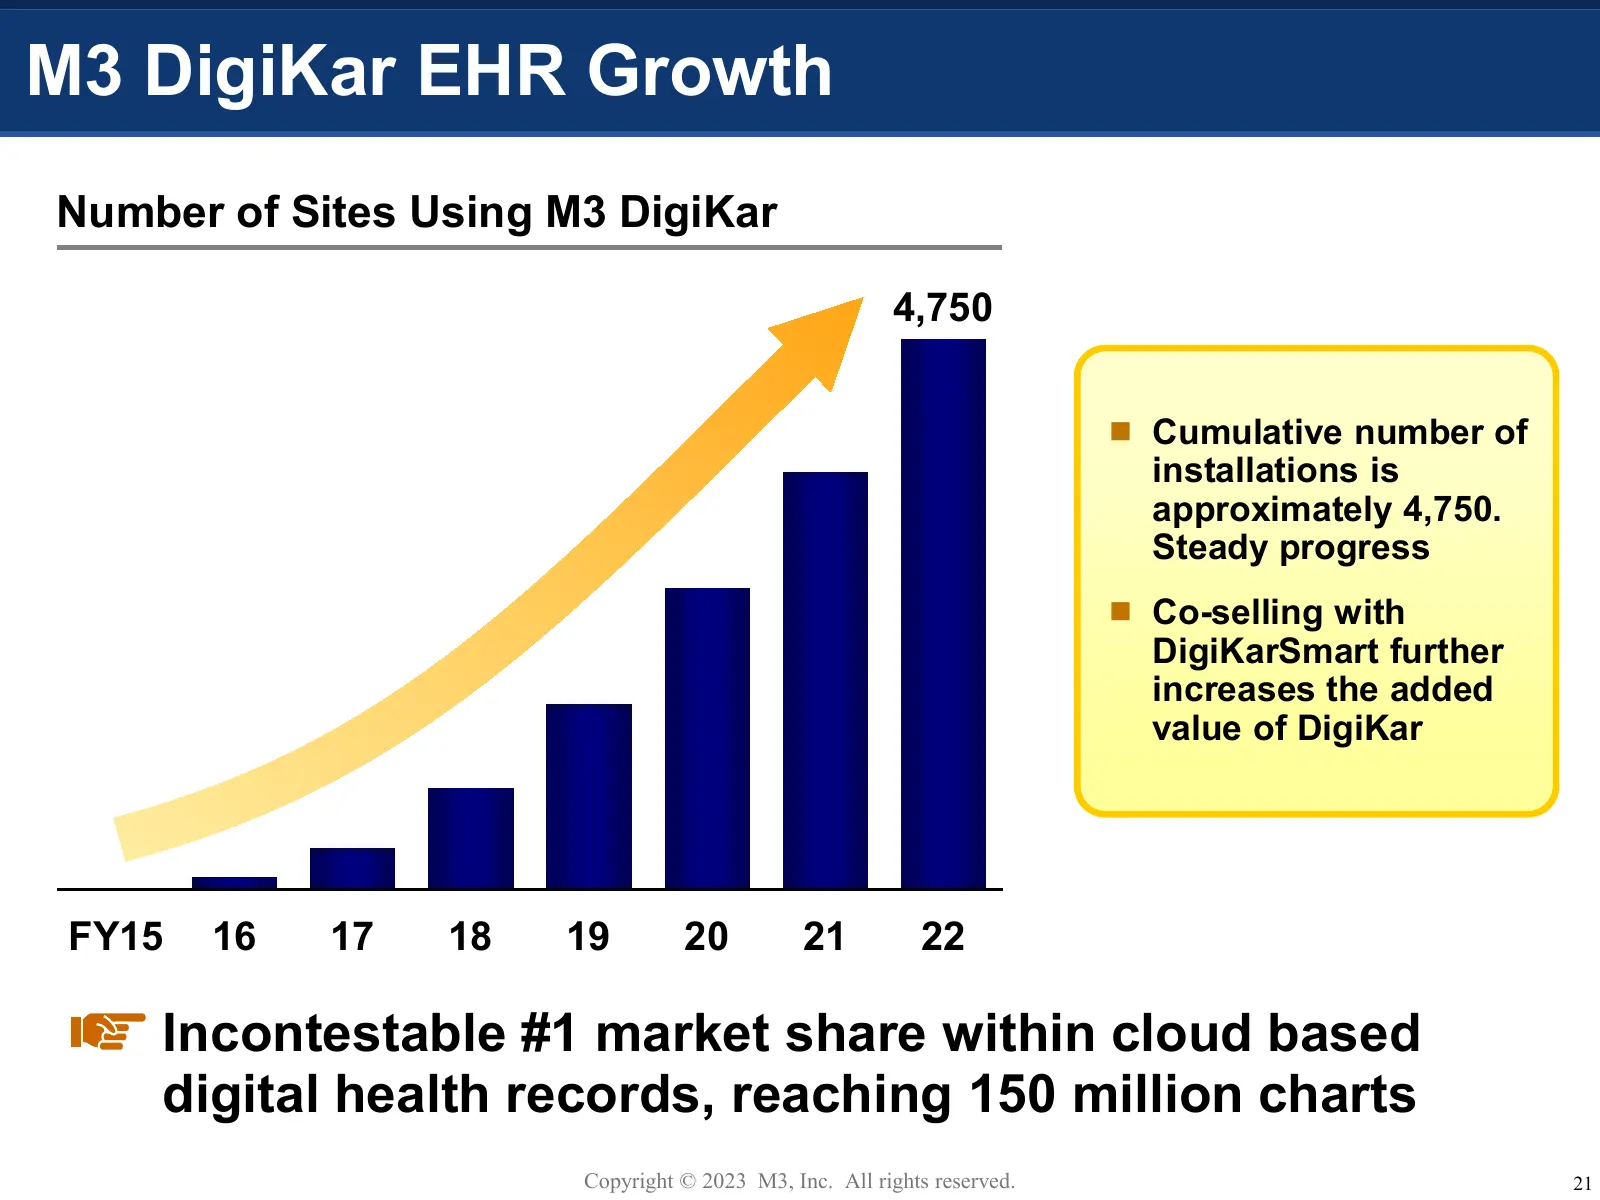
M3 DigiKar EHR Growth Number of Sites Using M3 DigiKar 4,750 Cumulative number of installations is approximately 4,750. Steady progress Co-selling with DigiKarSmart further increases the added value of DigiKar FY15 16 17 18 19 20 21 22 Incontestable #1 market share within cloud based digital hea
Slide 23: DX of Clinics: DigiKar Smart
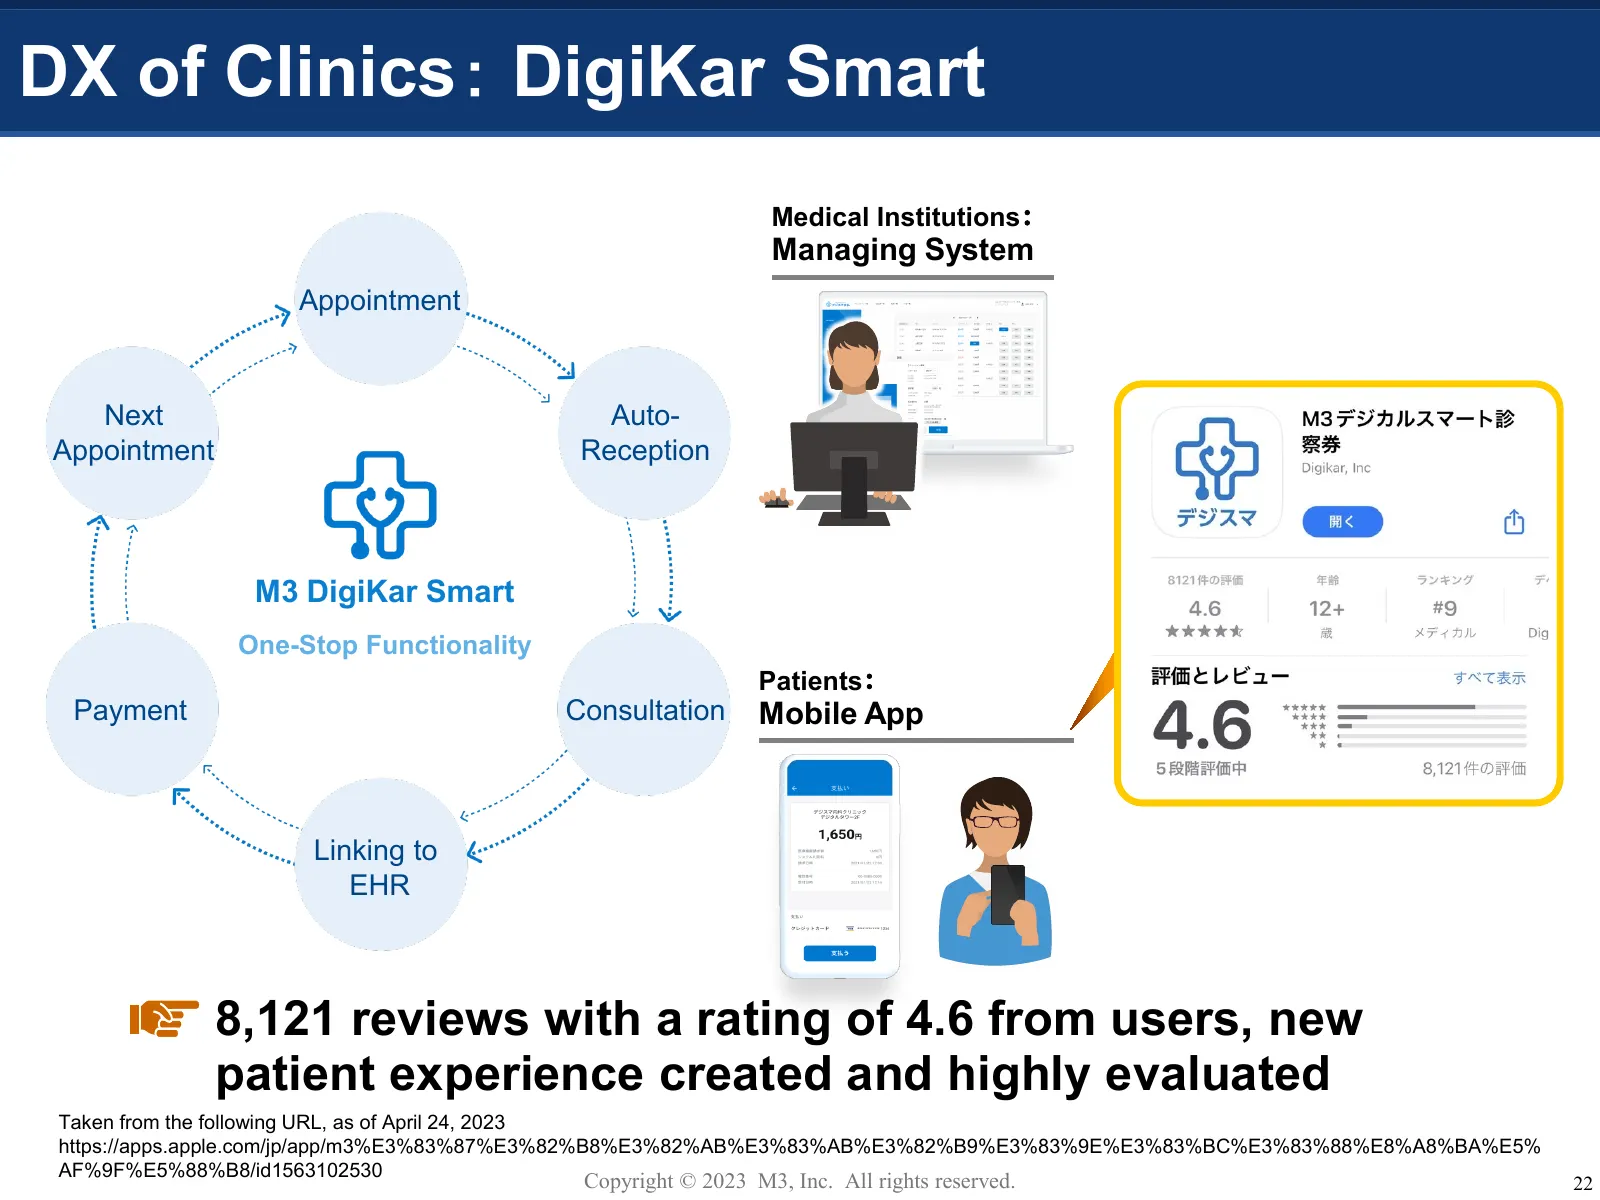
DX of Clinics: DigiKar Smart Medical Institutions: Managing System Appointment Next Auto- Appointment Reception M3 DigiKar Smart One-Stop Functionality Patients: Payment Consultation Mobile App Linking to EHR 8,121 reviews with a rating of 4.6 from users, new patient experience created and highly ev
Slide 24: No. of DigiKar Smart Users
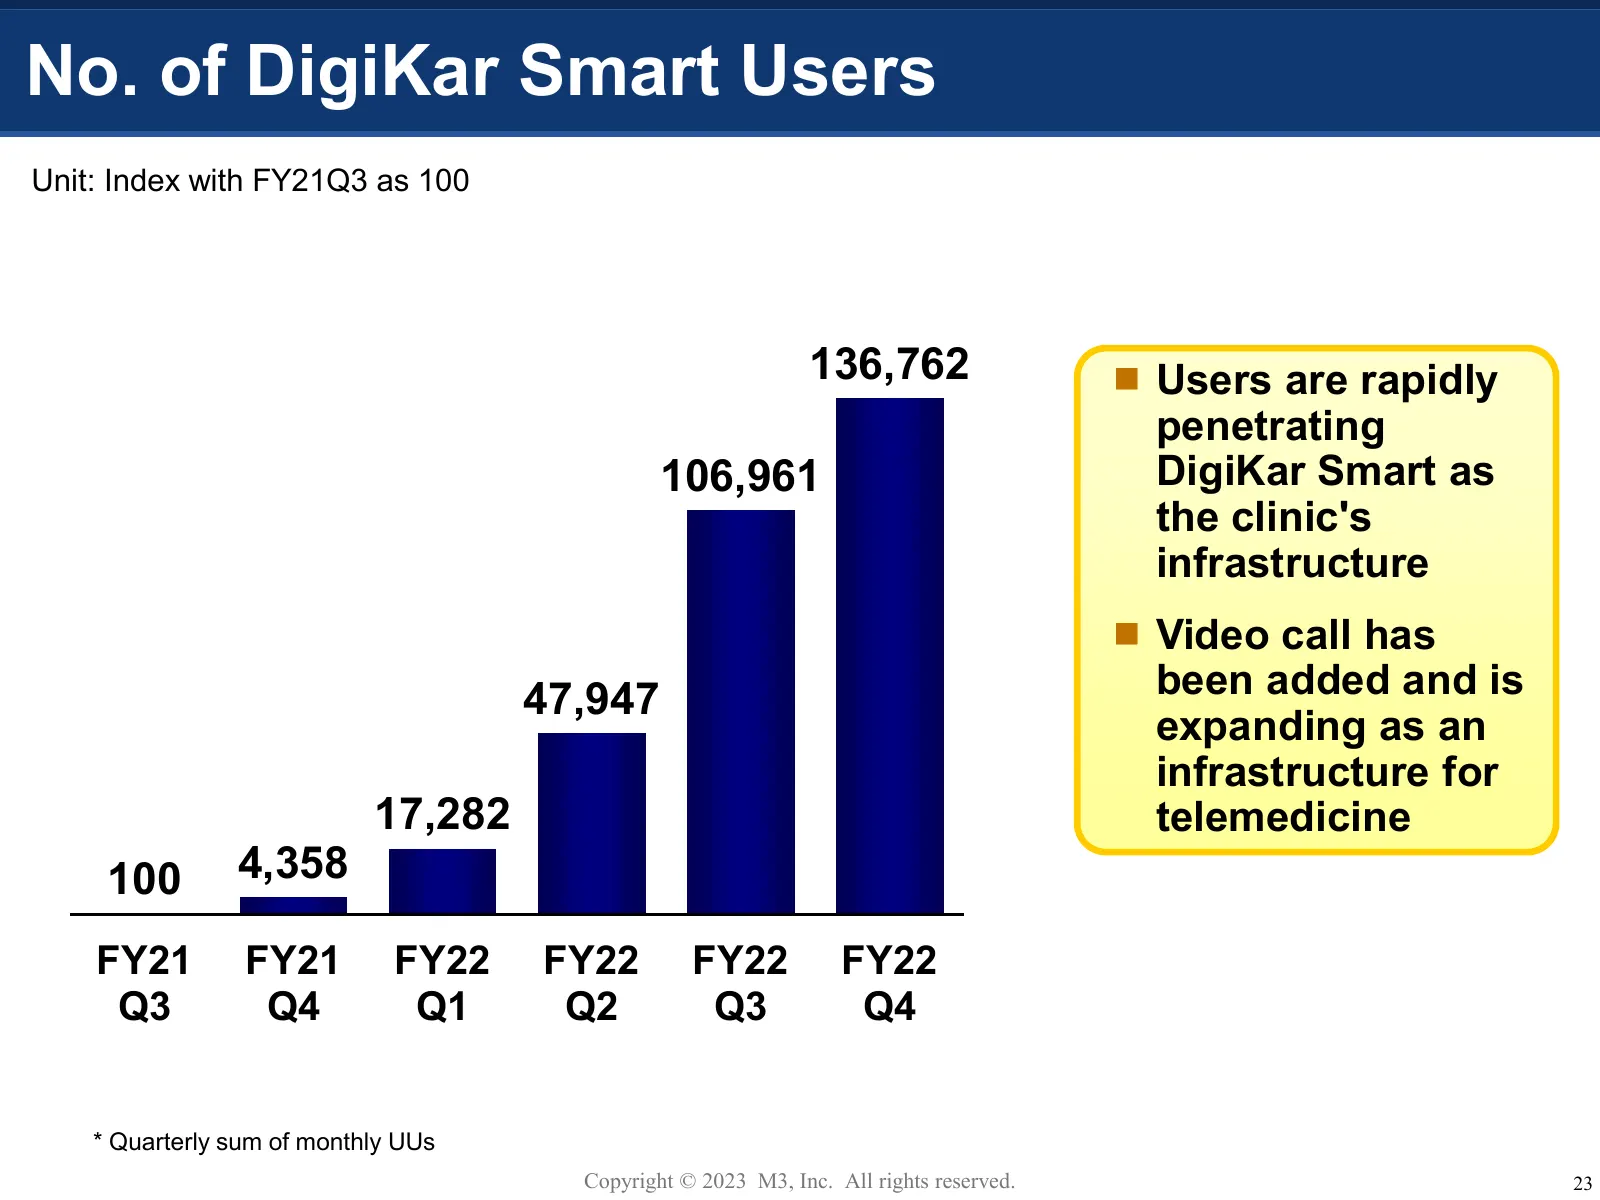
No. of DigiKar Smart Users Unit: Index with FY21Q3 as 100 136,762 Users are rapidly penetrating 106,961 DigiKar Smart as the clinic's infrastructure Video call has 47,947 been added and is expanding as an infrastructure for 17,282 telemedicine 100 4,358 FY21 FY21 FY22 FY22 FY22 FY22 Q3 Q4 Q1 Q2
Slide 25: Ecosystem Synergy: Medical Data Business
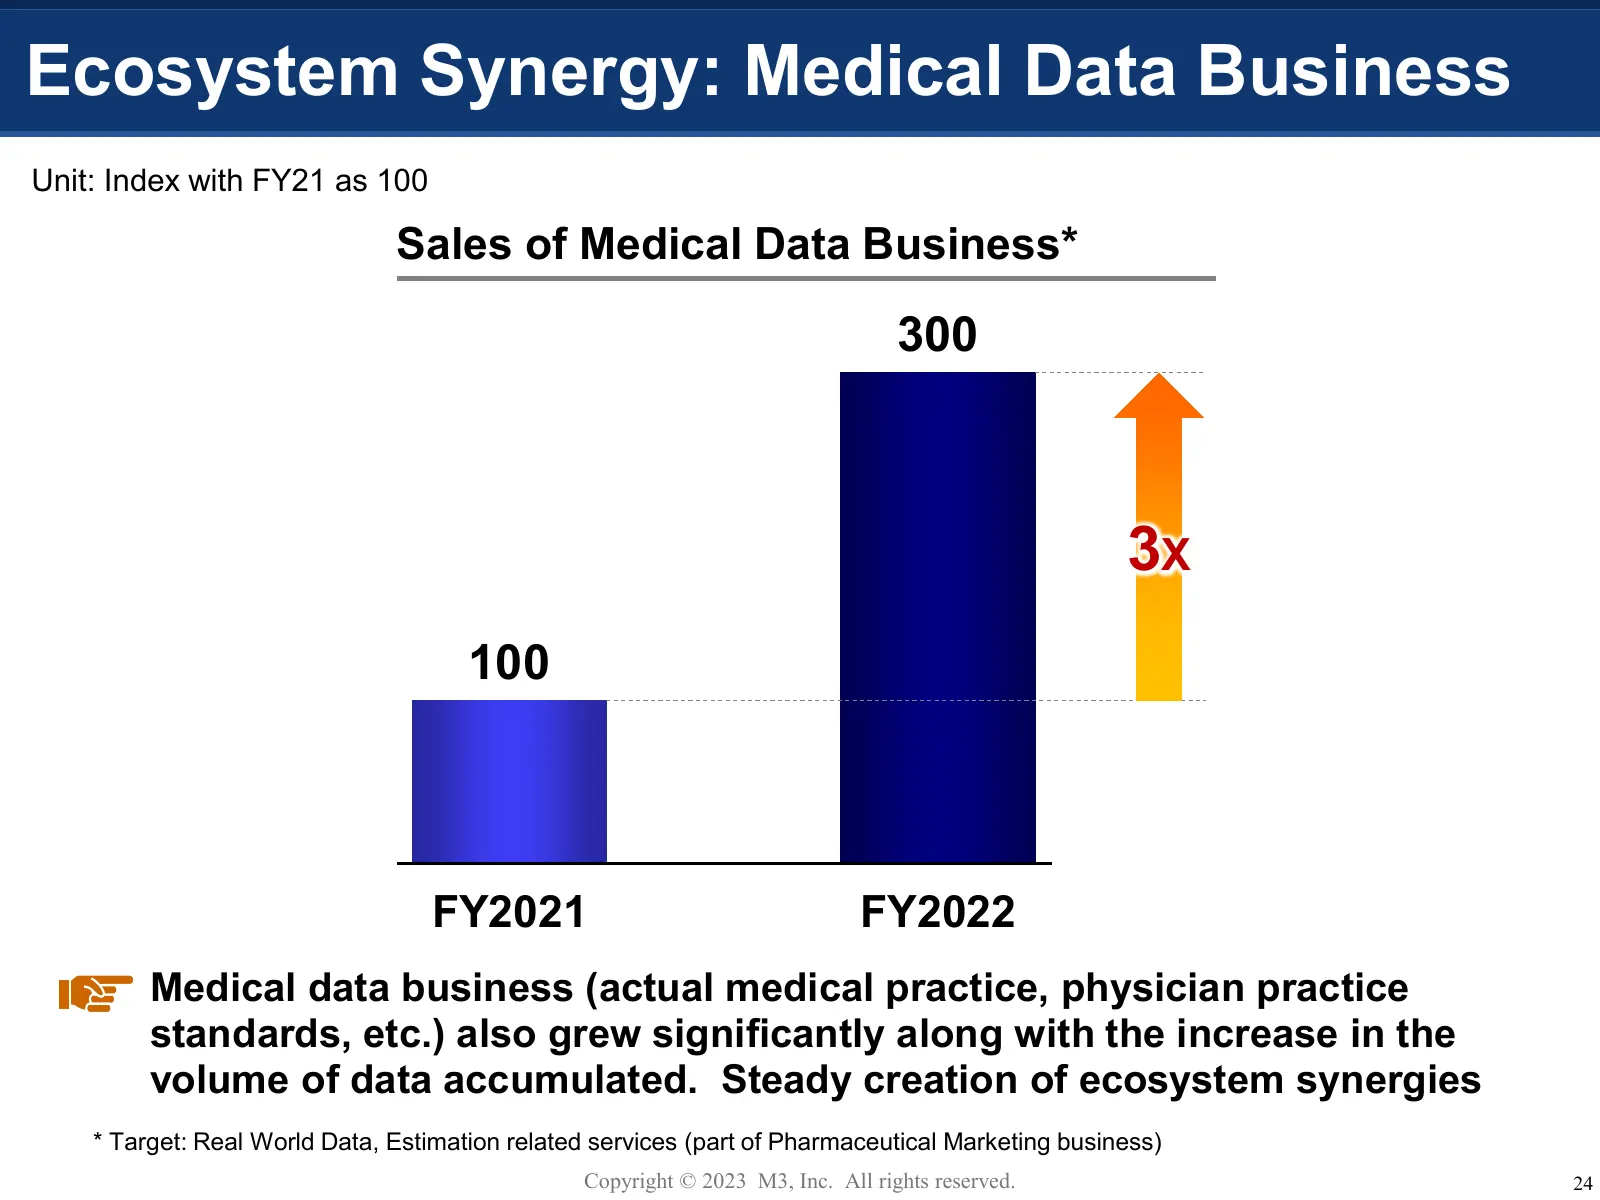
Ecosystem Synergy: Medical Data Business Unit: Index with FY21 as 100 Sales of Medical Data Business* 300 3X 100 FY2021 FY2022 Medical data business (actual medical practice, physician practice standards, etc.) also grew significantly along with the increase in the volume of data accumulated. Steady
Slide 26: Number of Clinics Covered by M3 Group
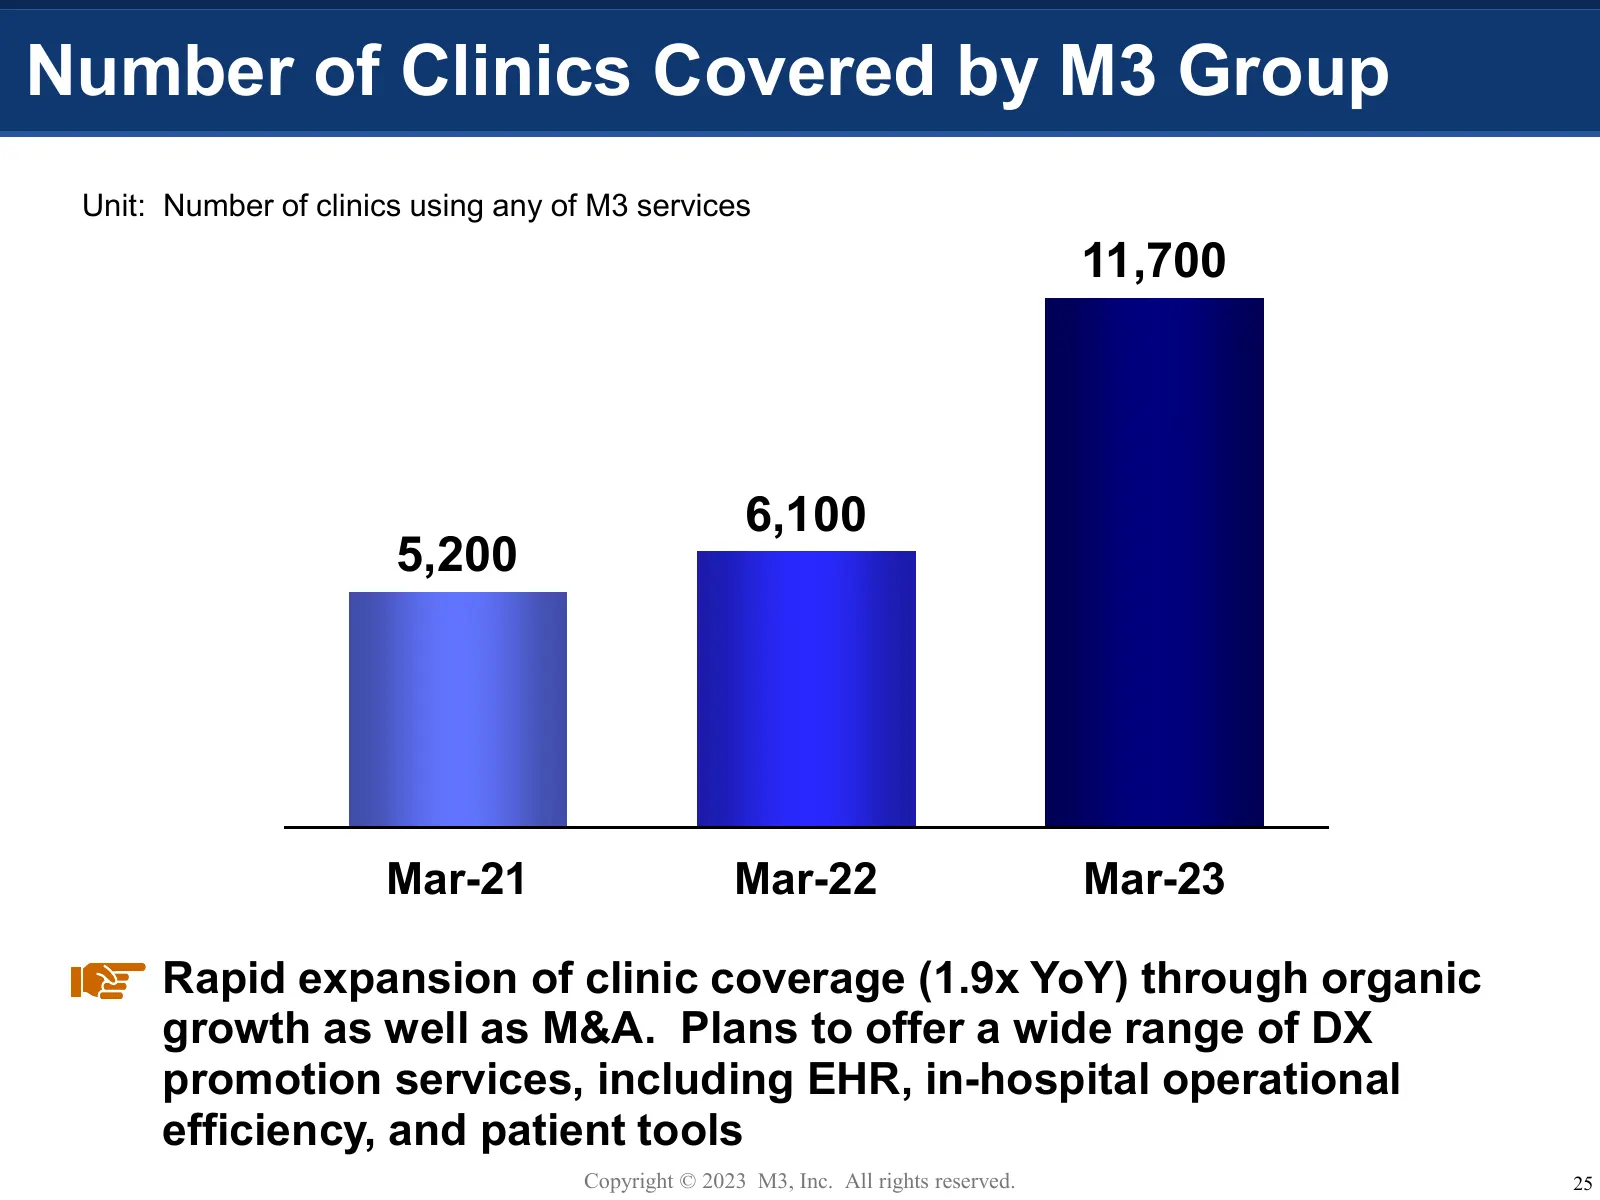
Number of Clinics Covered by M3 Group Unit: Number of clinics using any of M3 services 11,700 6,100 5,200 Mar-21 Mar-22 Mar-23 Rapid expansion of clinic coverage (1.9x YoY) through organic growth as well as M&A. Plans to offer a wide range of DX promotion services, including EHR, in-hospital operati
Slide 27: Overseas
Overseas Copyright © 2023 M3, Inc. All rights reserved. 26
Slide 28: Number of Doctor Members and Panelists (Global)
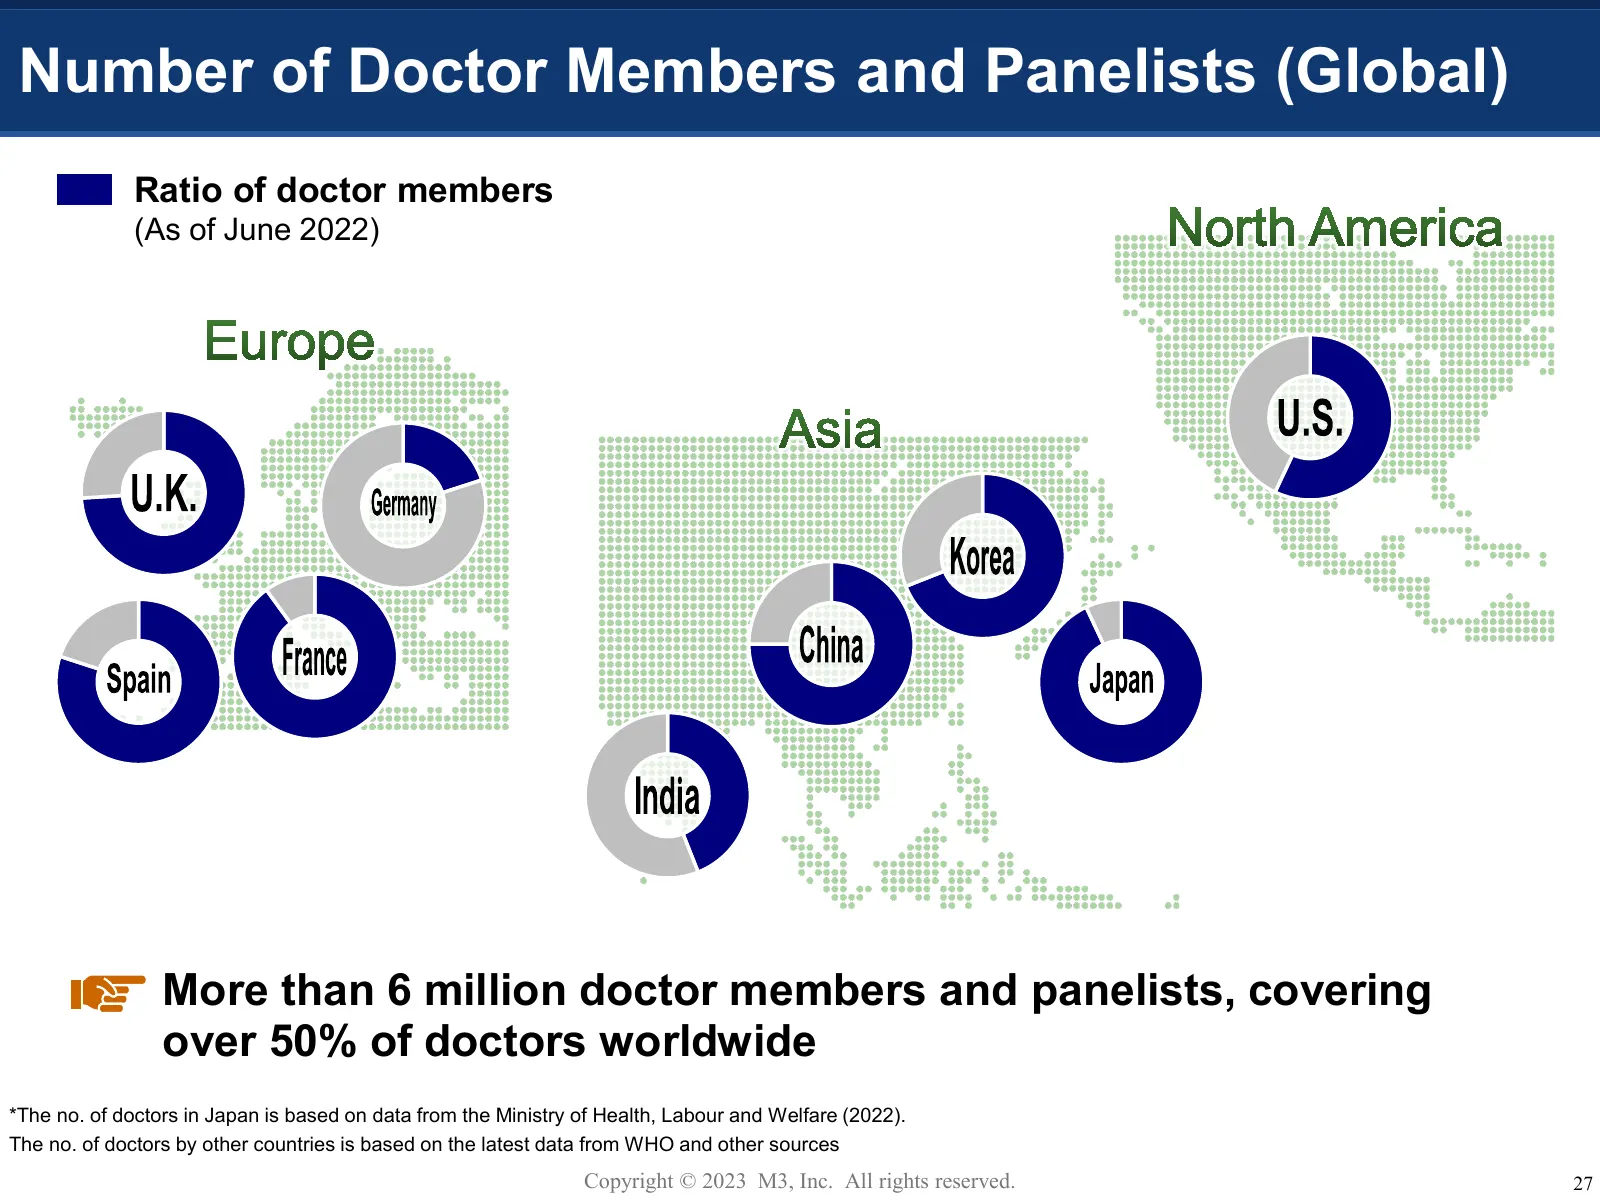
Number of Doctor Members and Panelists (Global) Ratio of doctor members (As of June 2022) More than 6 million doctor members and panelists, covering over 50% of doctors worldwide *The no. of doctors in Japan is based on data from the Ministry of Health, Labour and Welfare (2022). The no. of doctors
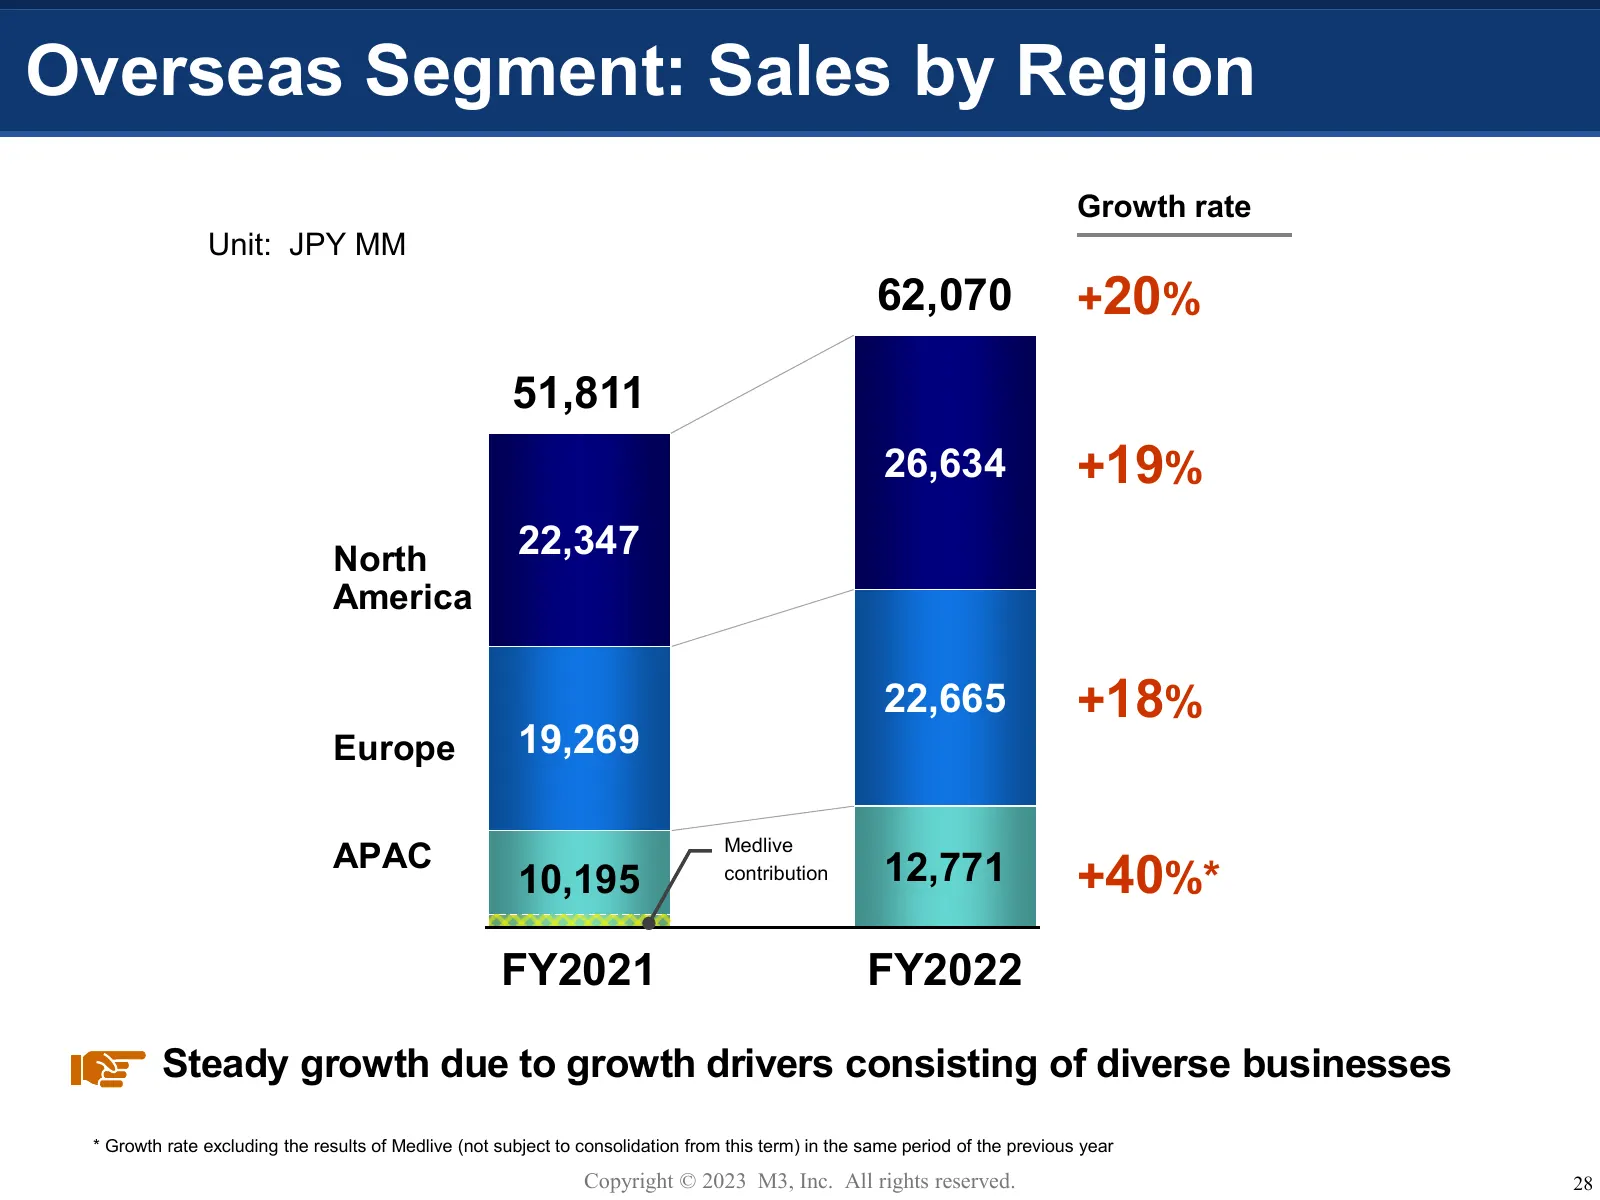
Slide 29: Overseas Segment: Sales by Region
Overseas Segment: Sales by Region Growth rate Unit: JPY MM 62,070 +20% 51,811 26,634 +19% North 22,347 America 22,665 +18% Europe 19,269 APAC Medlive 10,195 contribution 12,771 +40%* FY2021 FY2022 Steady growth due to growth drivers consisting of diverse businesses * Growth rate excluding the result
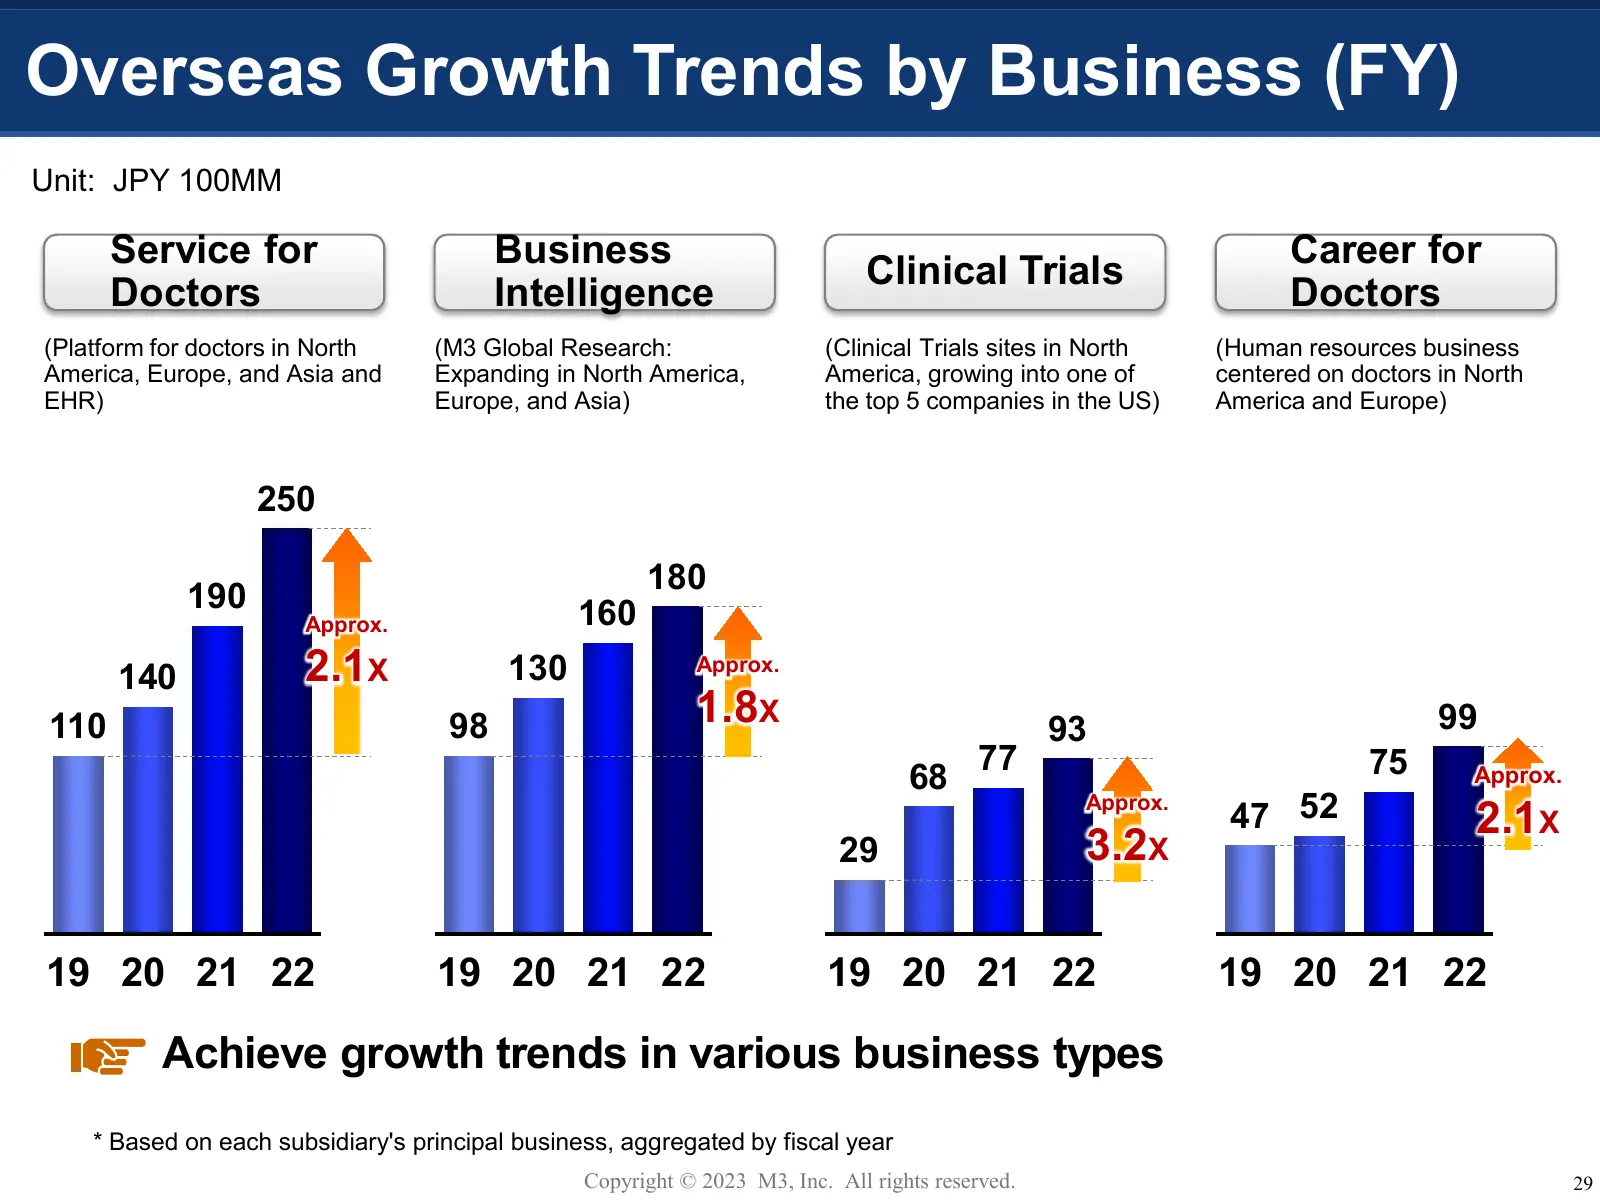
Slide 30: Overseas Growth Trends by Business
Overseas Growth Trends by Business (FY) Unit: JPY 100MM Service for Business Career for Clinical Trials Doctors Intelligence Doctors (Platform for doctors in North (M3 Global Research: (Clinical Trials sites in North (Human resources business America, Europe, and Asia and Expanding in North America,

Slide 31: Acquisition of Scribendi in Canada
Acquisition of Scribendi in Canada Support the preparation of Editing and proofreading platform manuscripts, clinical research and trial papers, etc. Utilize approximately 400 active freelancers Utilize crowdsourcing with approximately 500 scientific and Provides services to 28,000 clients
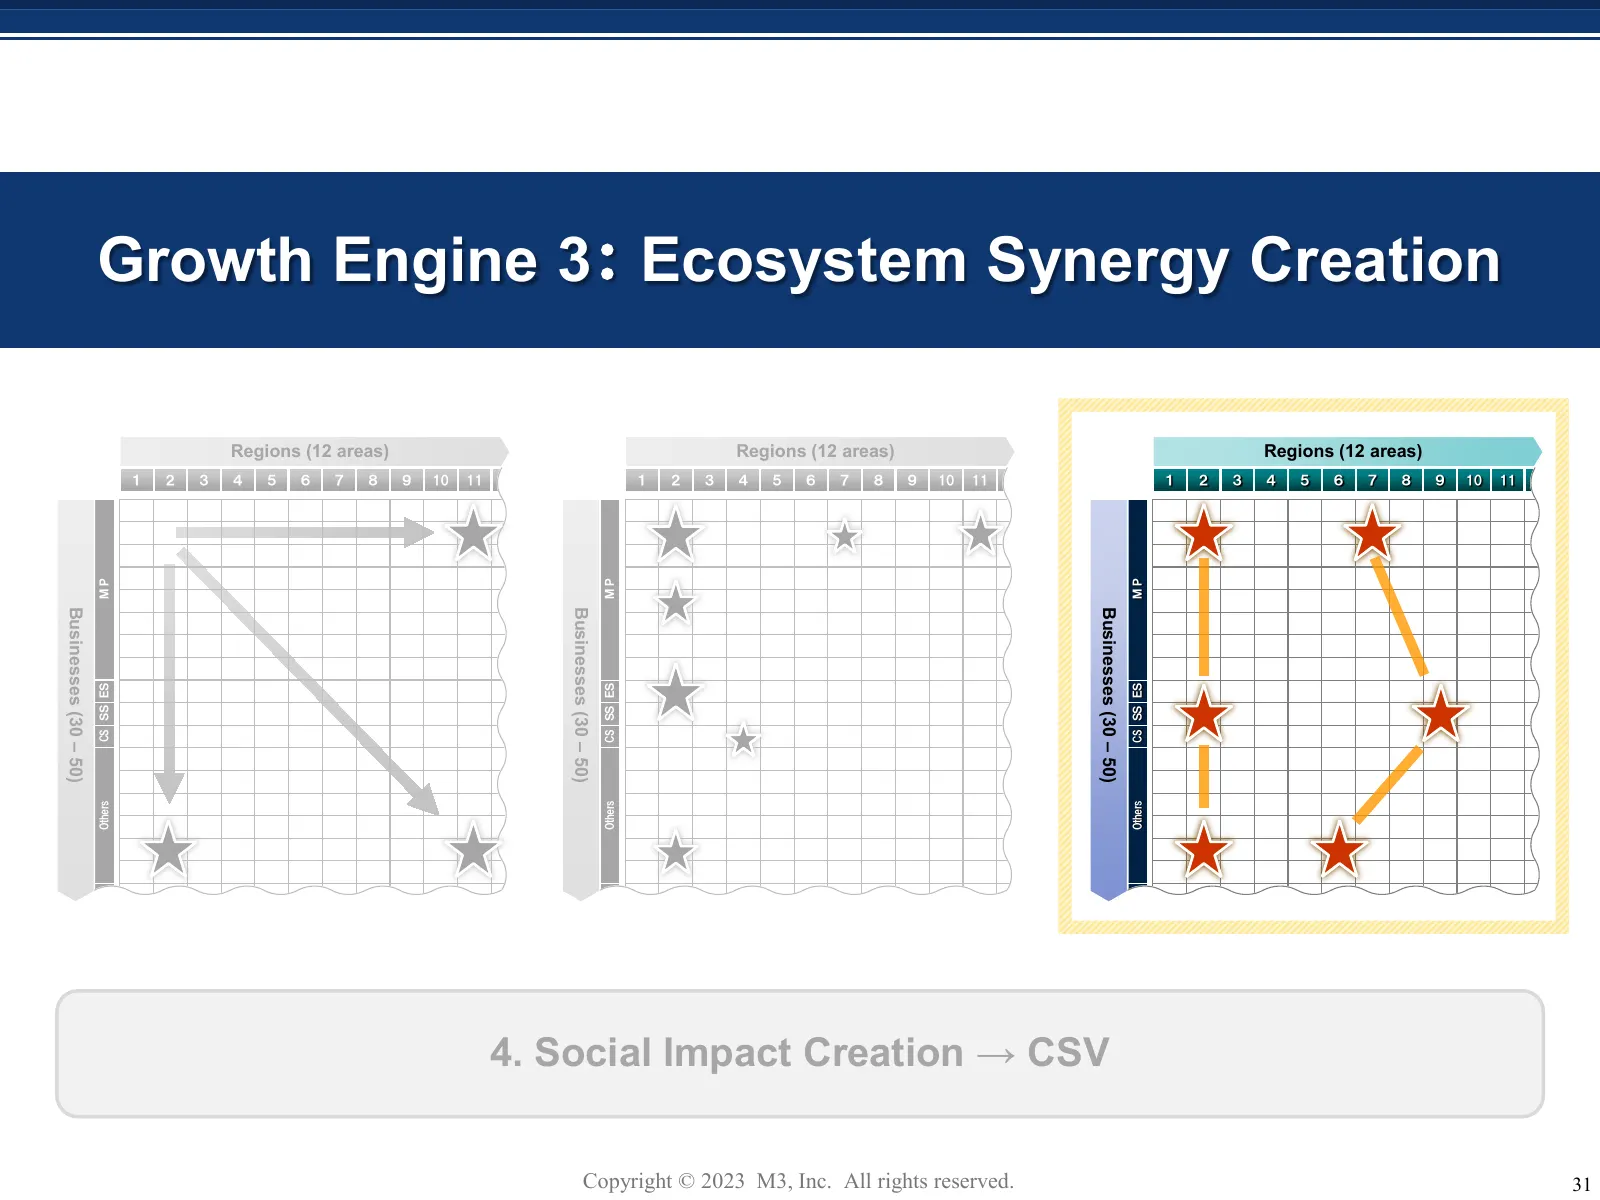
Slide 32: Growth Engine 3: Ecosystem Synergy Creation
Growth Engine 3: Ecosystem Synergy Creation Regions (12 areas) Regions areas) Regions (12 areas) Regions (12 areas) 1 2 3 4 5 6 7 8 9 10 11 1 2 3 4 5 6 7 8 9 10 11 1 2 3 4 5 6 7 8 9 10 11 MP MP MP Businesses (30 Businesses Businesses (30 – 50) Businesses (30 CS SS ES CS SS ES CS SS ES (30 –– 50) ( –
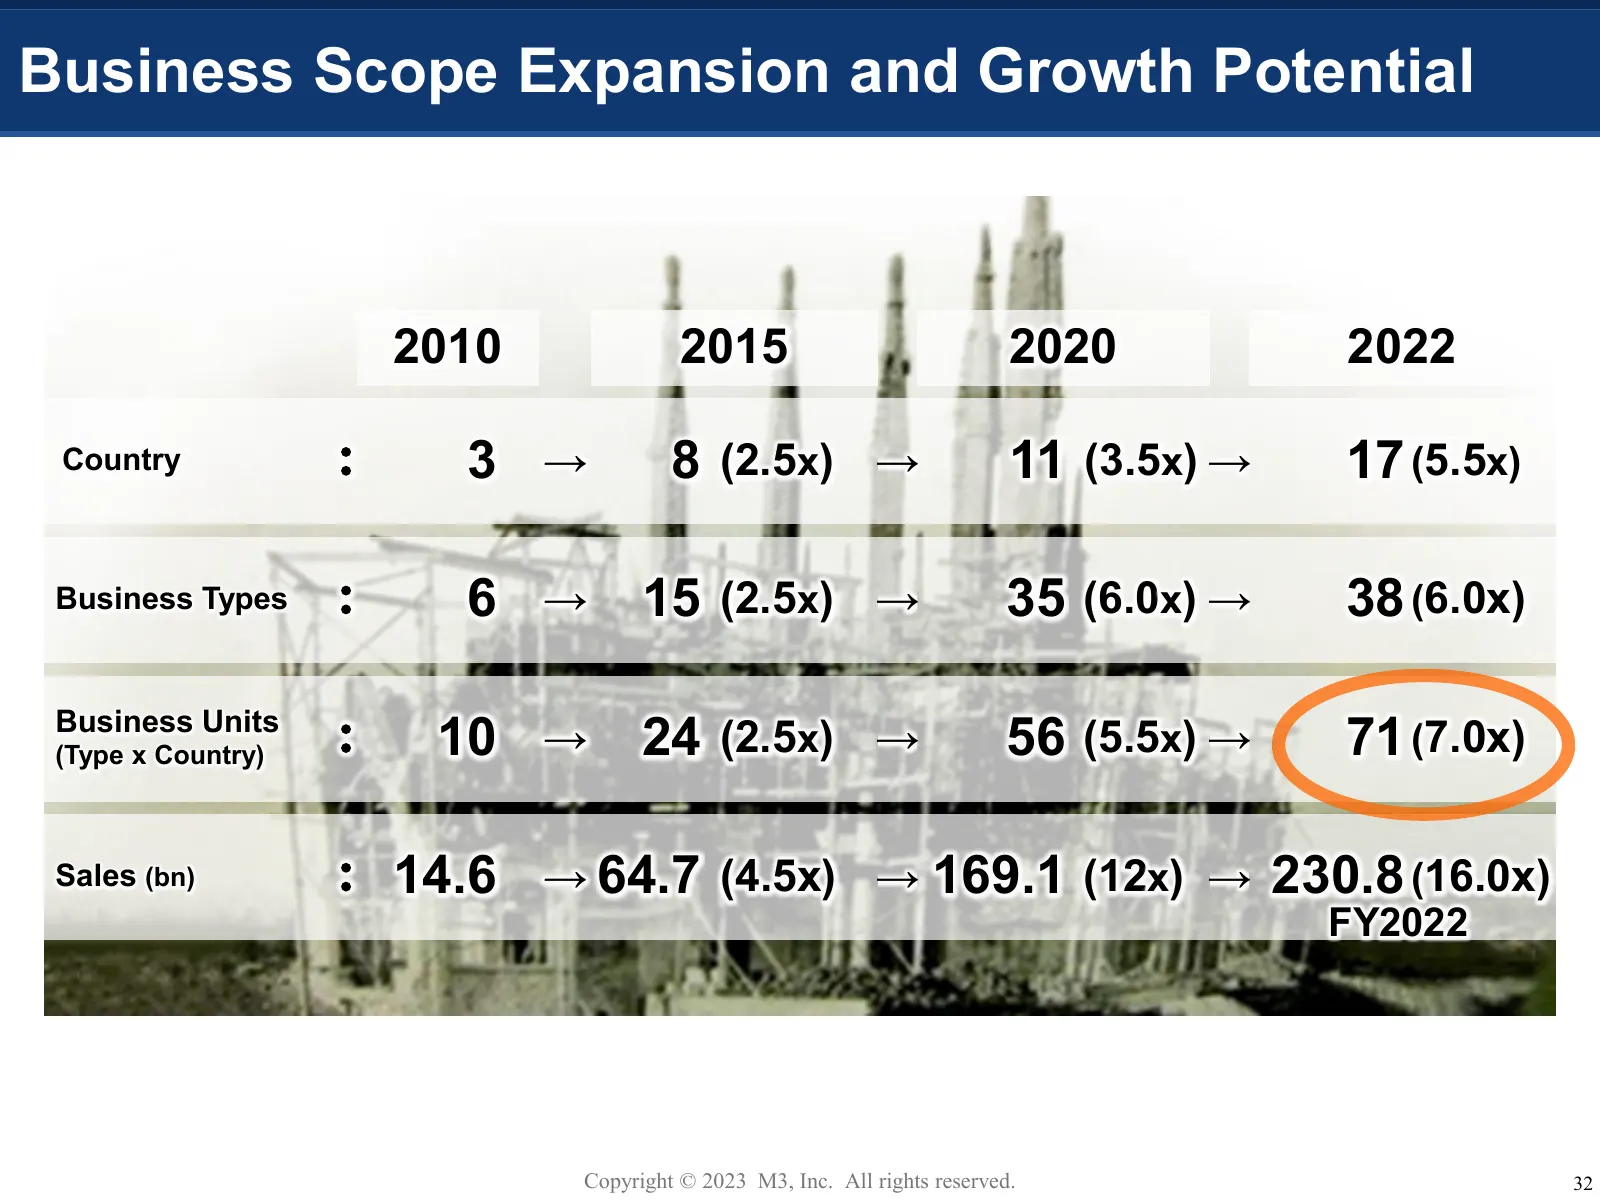
Slide 33: Business Scope Expansion and Growth Potential
Business Scope Expansion and Growth Potential 2010 2015 2020 2022 Country : 3 → 8 (2.5x) → 11 (3.5x) → 17 (5.5x) Business Types : 6 → 15 (2.5x) → 35 (6.0x) → 38 (6.0x) Business Units (Type x Country) : 10 → 24 (2.5x) → 56 (5.5x) → 71 (7.0x) Sales (bn) : 14.6 → 64.7 (4.5x) → 169.1 (12x) → 230.8 (16.0
Slide 34: Cross-Business Synergy Creation Potential
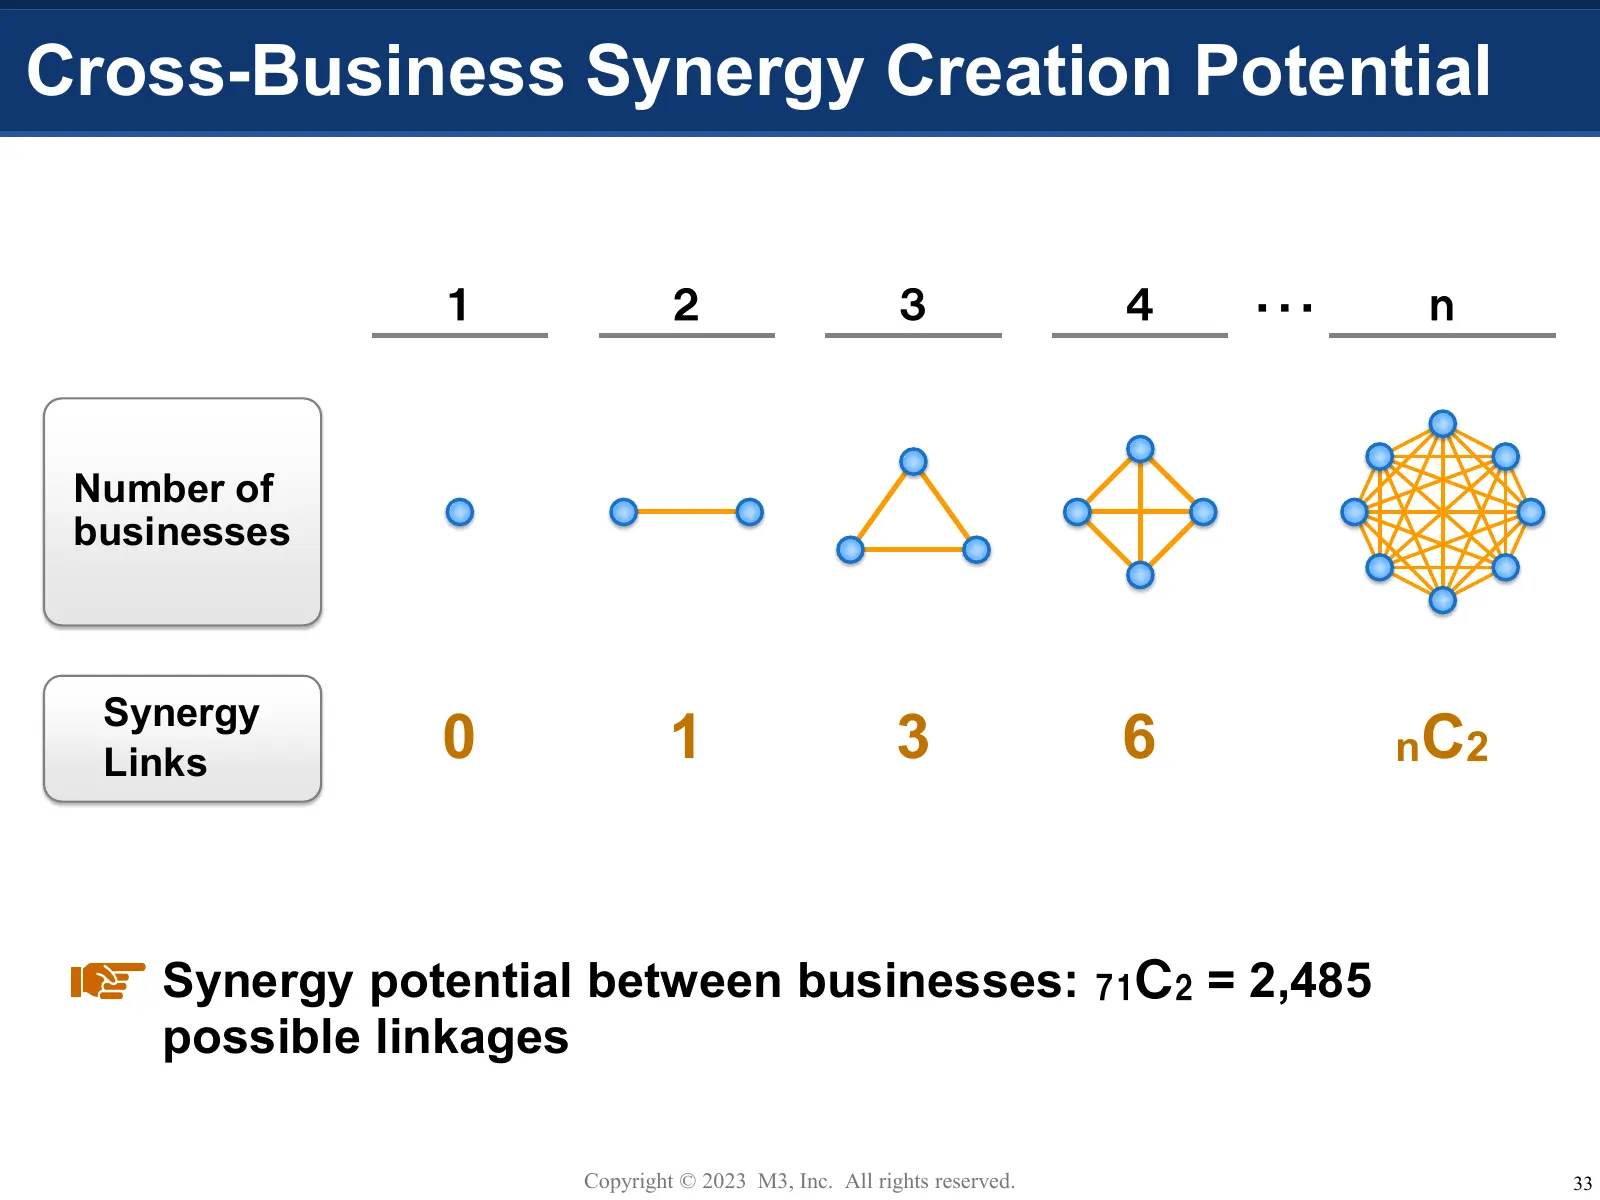
Cross-Business Synergy Creation Potential 1 2 3 4 ・・・ n Number of businesses Synergy Links 0 1 3 6 nC2 Synergy potential between businesses: 71C2 = 2,485 possible linkages Copyright © 2023 M3, Inc. All rights reserved. 33
Slide 35: The White Jack Project
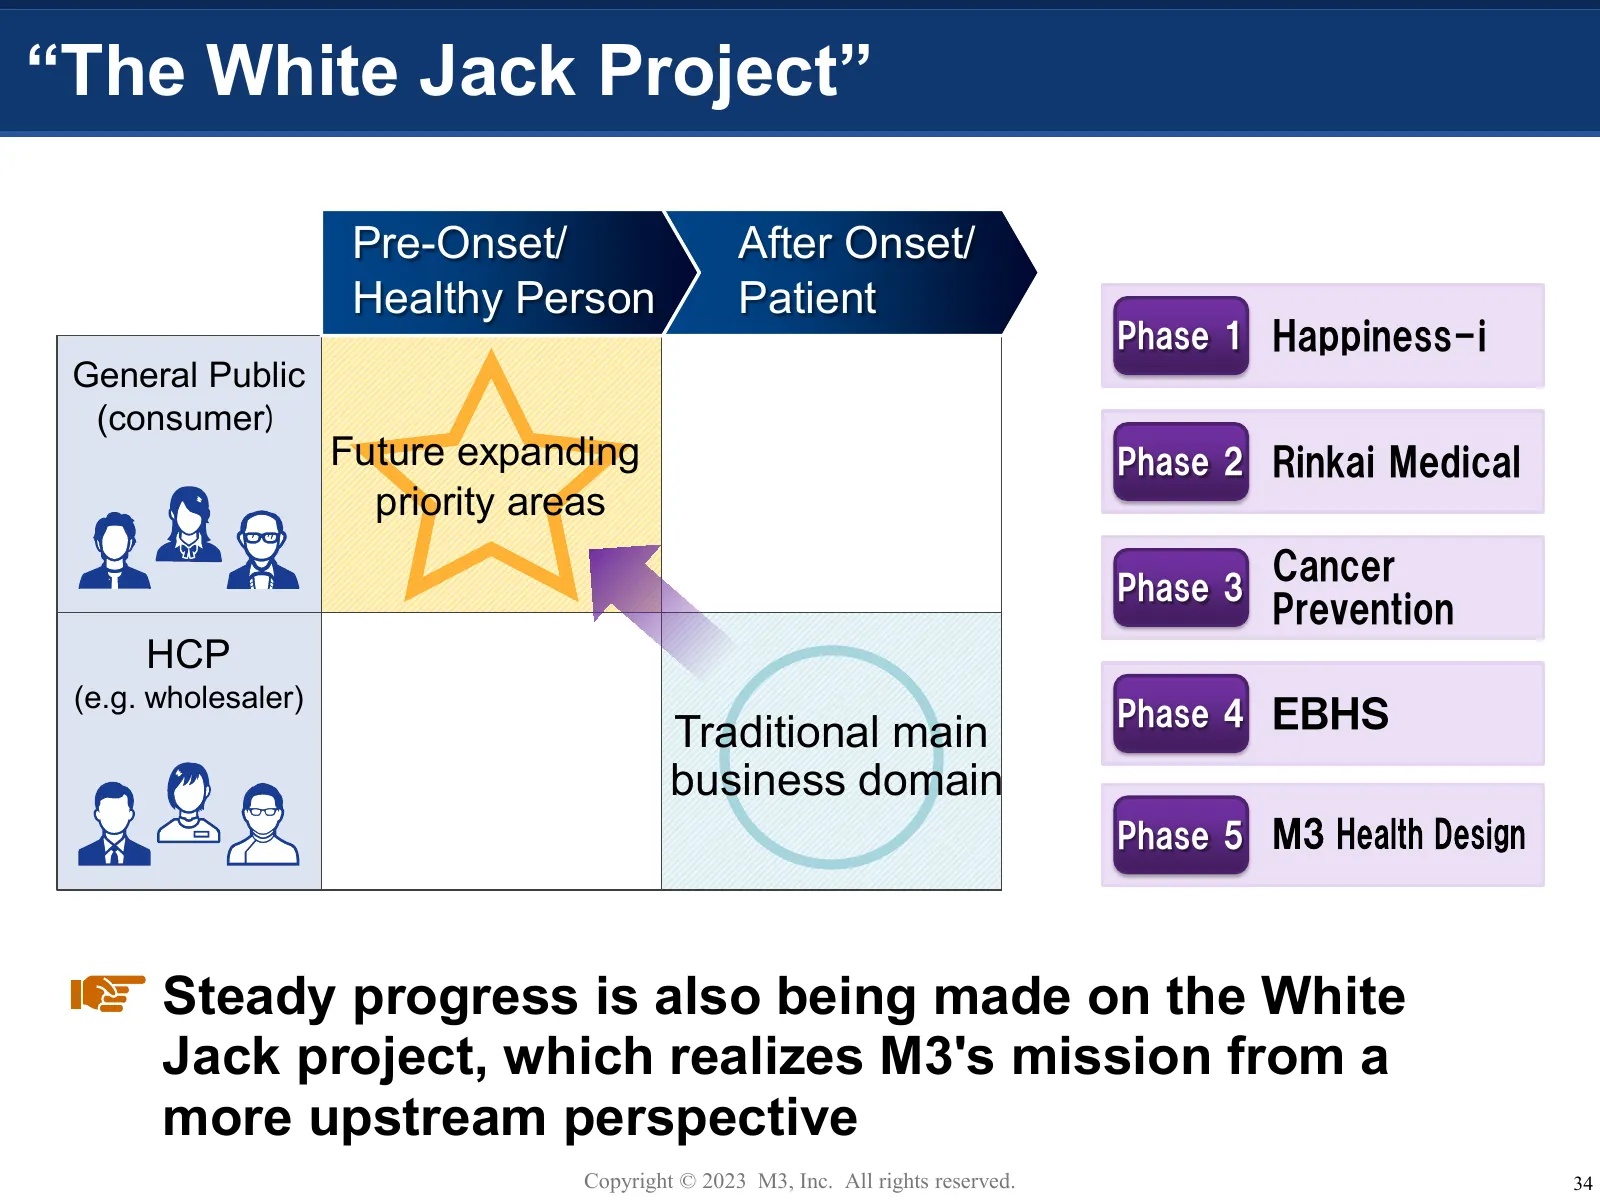
“The White Jack Project” Pre-Onset/ After Onset/ Healthy Person Patient Phase 1 Happiness-i General Public (consumer) Future expanding Phase 2 Rinkai Medical priority areas Cancer Phase 3 Prevention HCP (e.g. wholesaler) Phase 4 EBHS Traditional main business domain Phase 5 Steady progress is also b
Slide 36: Expand Coverage of Enterprise Services
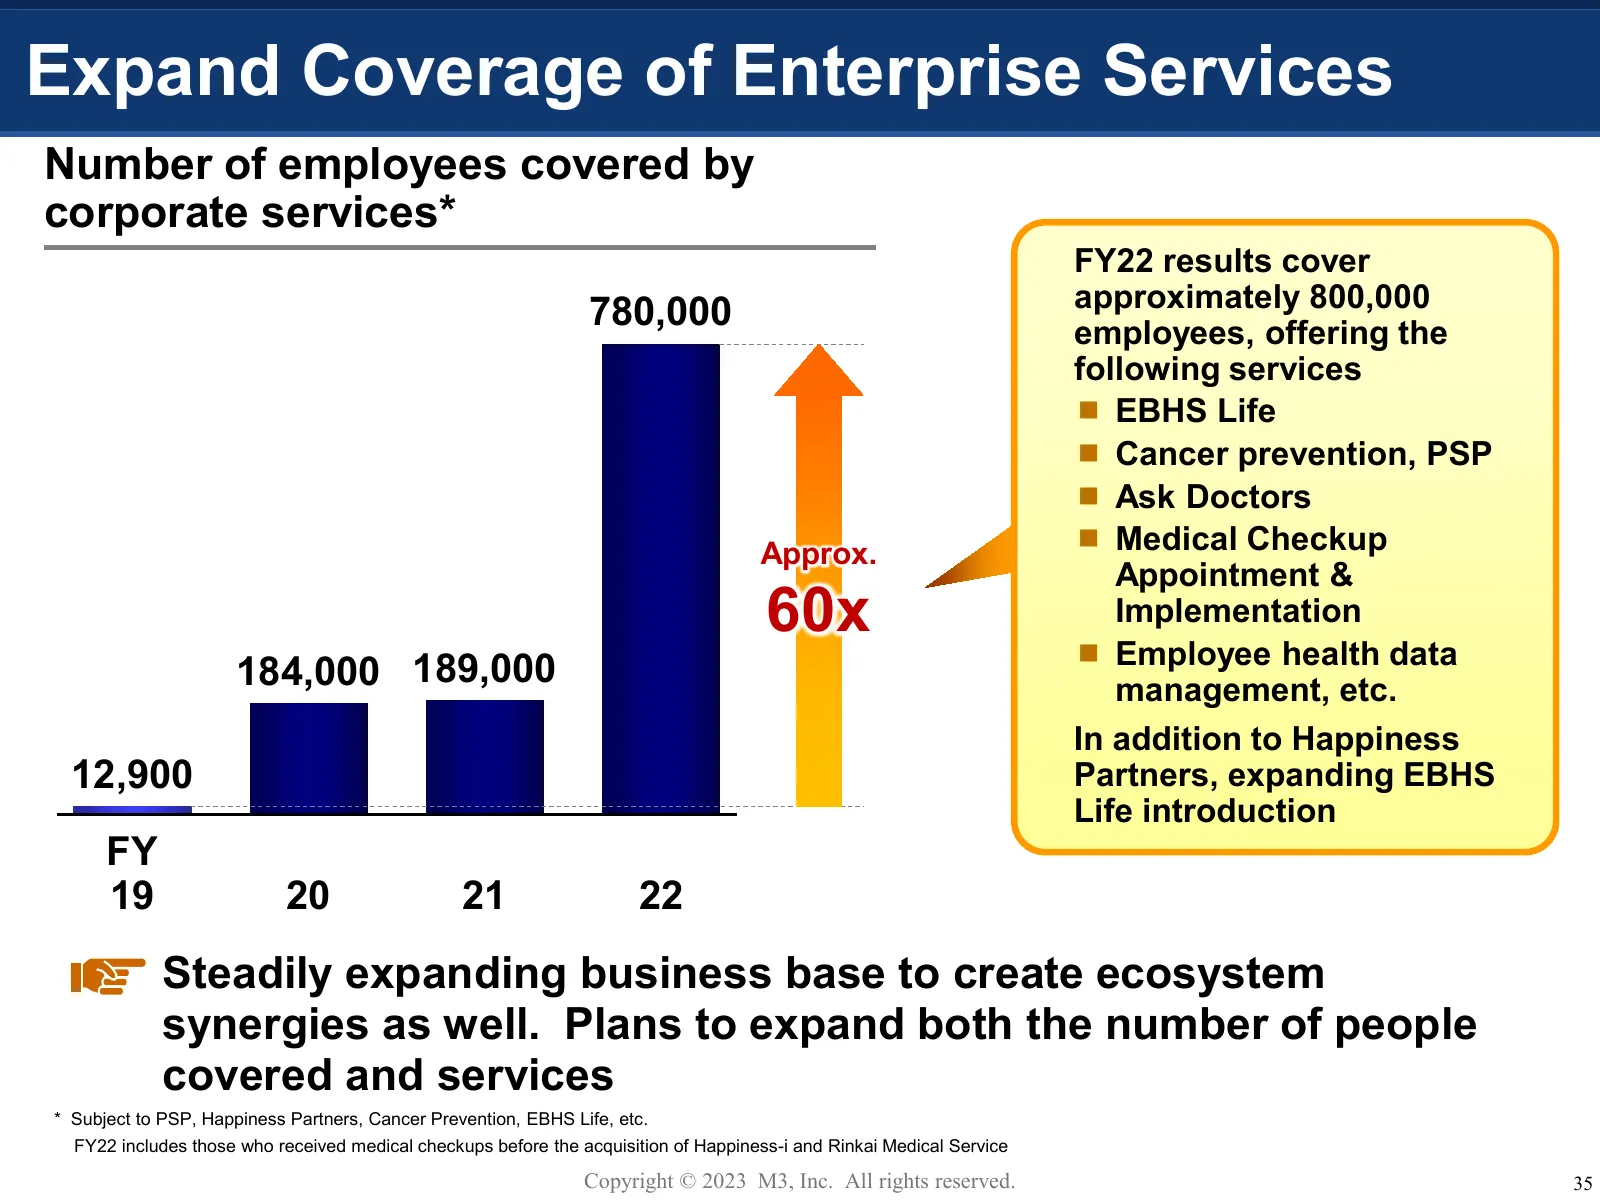
Expand Coverage of Enterprise Services Number of employees covered by corporate services* FY22 results cover approximately 800,000 780,000 employees, offering the following services EBHS Life Cancer prevention, PSP Ask Doctors Approx. Medical Checkup Appointment & 60x Implementation Employ
Slide 37: Social Impact Creation
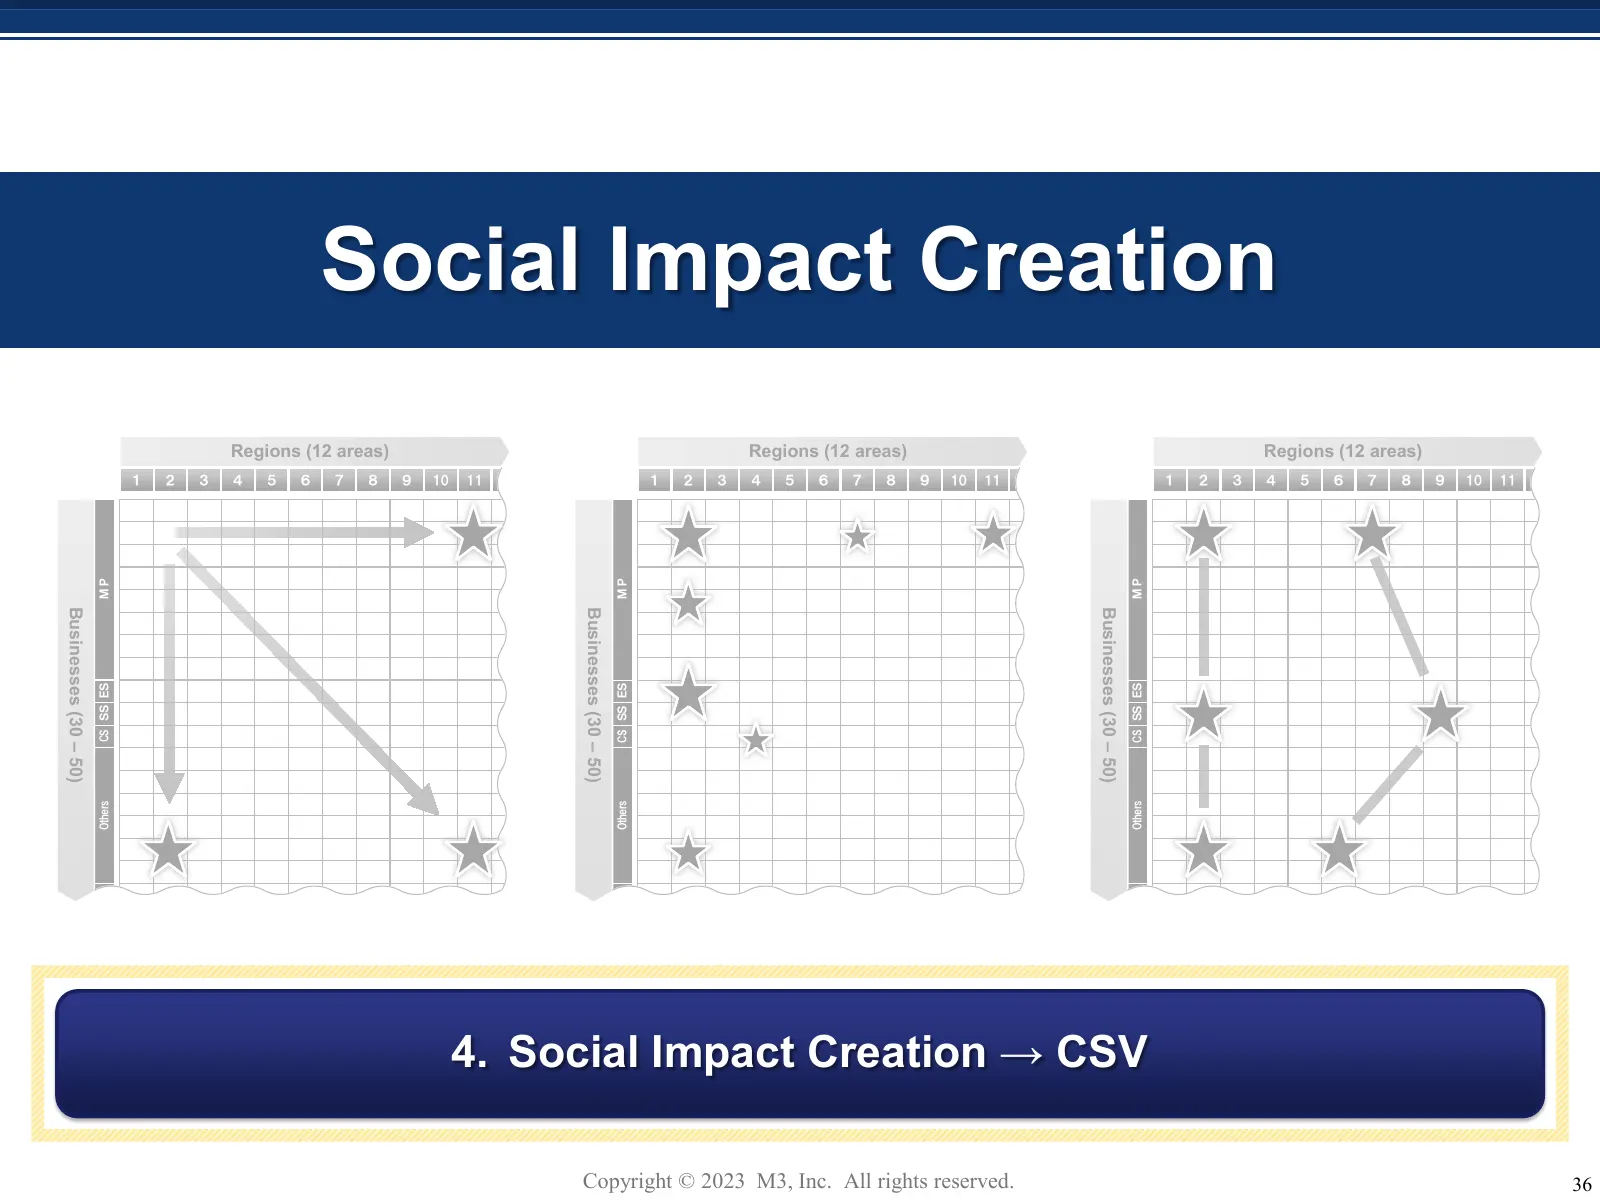
Social Impact Creation Regions (12 areas) Regions areas) Regions (12 areas) Regions (12 areas) 1 2 3 4 5 6 7 8 9 10 11 1 2 3 4 5 6 7 8 9 10 11 1 2 3 4 5 6 7 8 9 10 11 MP MP MP Businesses (30 Businesses Businesses (30 – 50) Businesses (30 CS SS ES CS SS ES CS SS ES (30 –– 50) ( – 50)) 30 50 50) Other
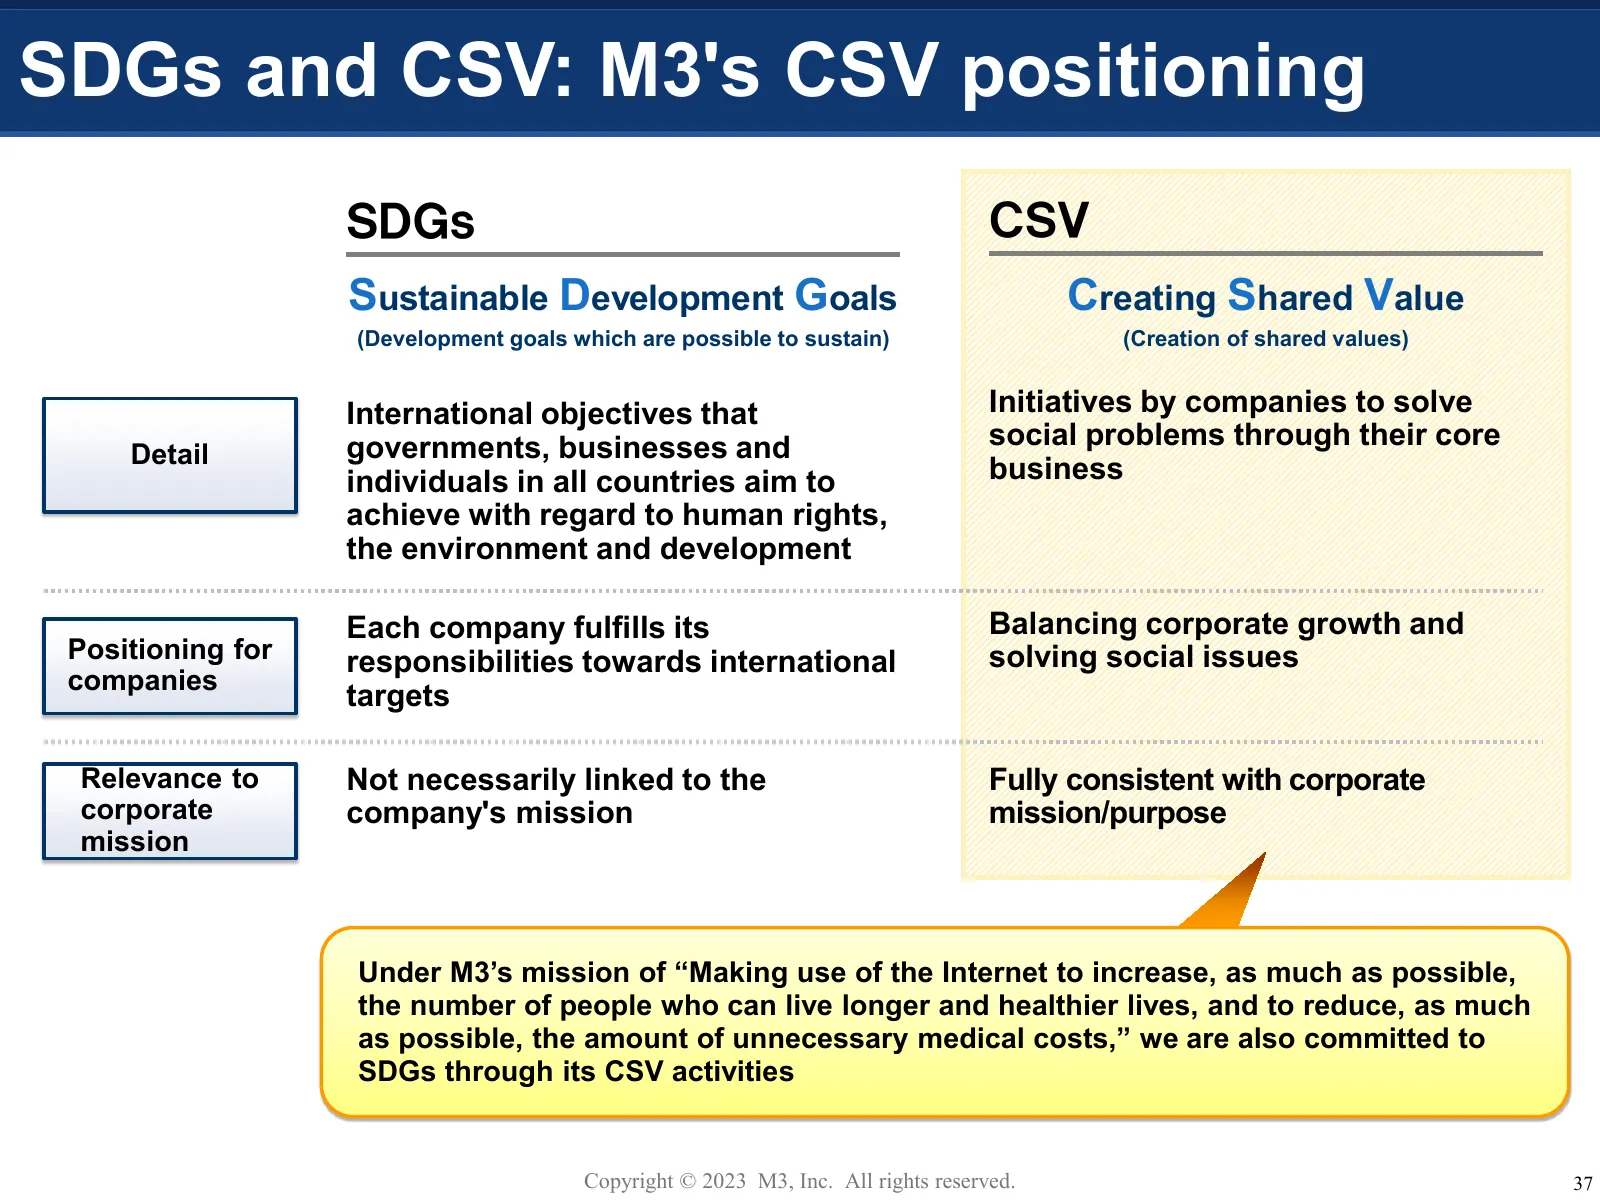
Slide 38: SDGs and CSV: M3's CSV positioning
SDGs and CSV: M3's CSV positioning SDGs CSV Sustainable Development Goals Creating Shared Value (Development goals which are possible to sustain) (Creation of shared values) International objectives that Initiatives by companies to solve governments, businesses and social problems through their core
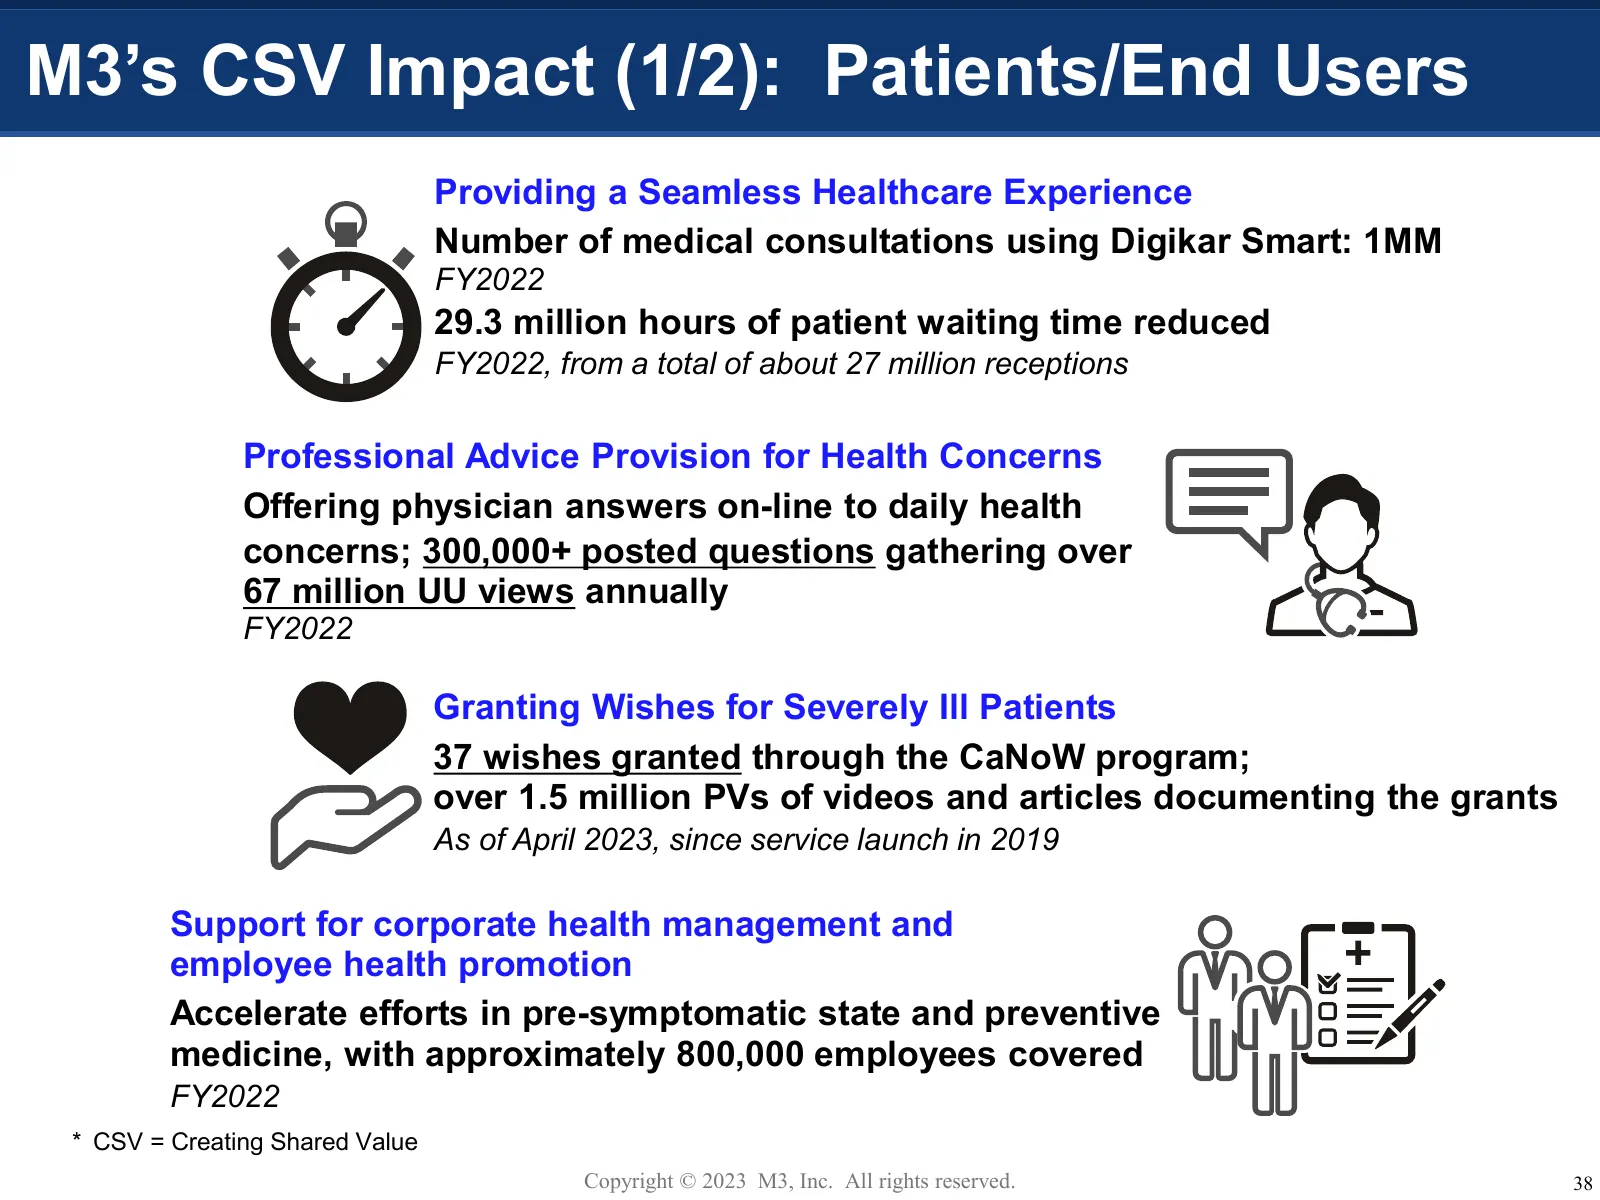
Slide 39: M3's CSV Impact (1/2): Patients/End Users
M3’s CSV Impact (1/2): Patients/End Users Providing a Seamless Healthcare Experience Number of medical consultations using Digikar Smart: 1MM FY2022 29.3 million hours of patient waiting time reduced FY2022, from a total of about 27 million receptions Professional Advice Provision for Health Concern
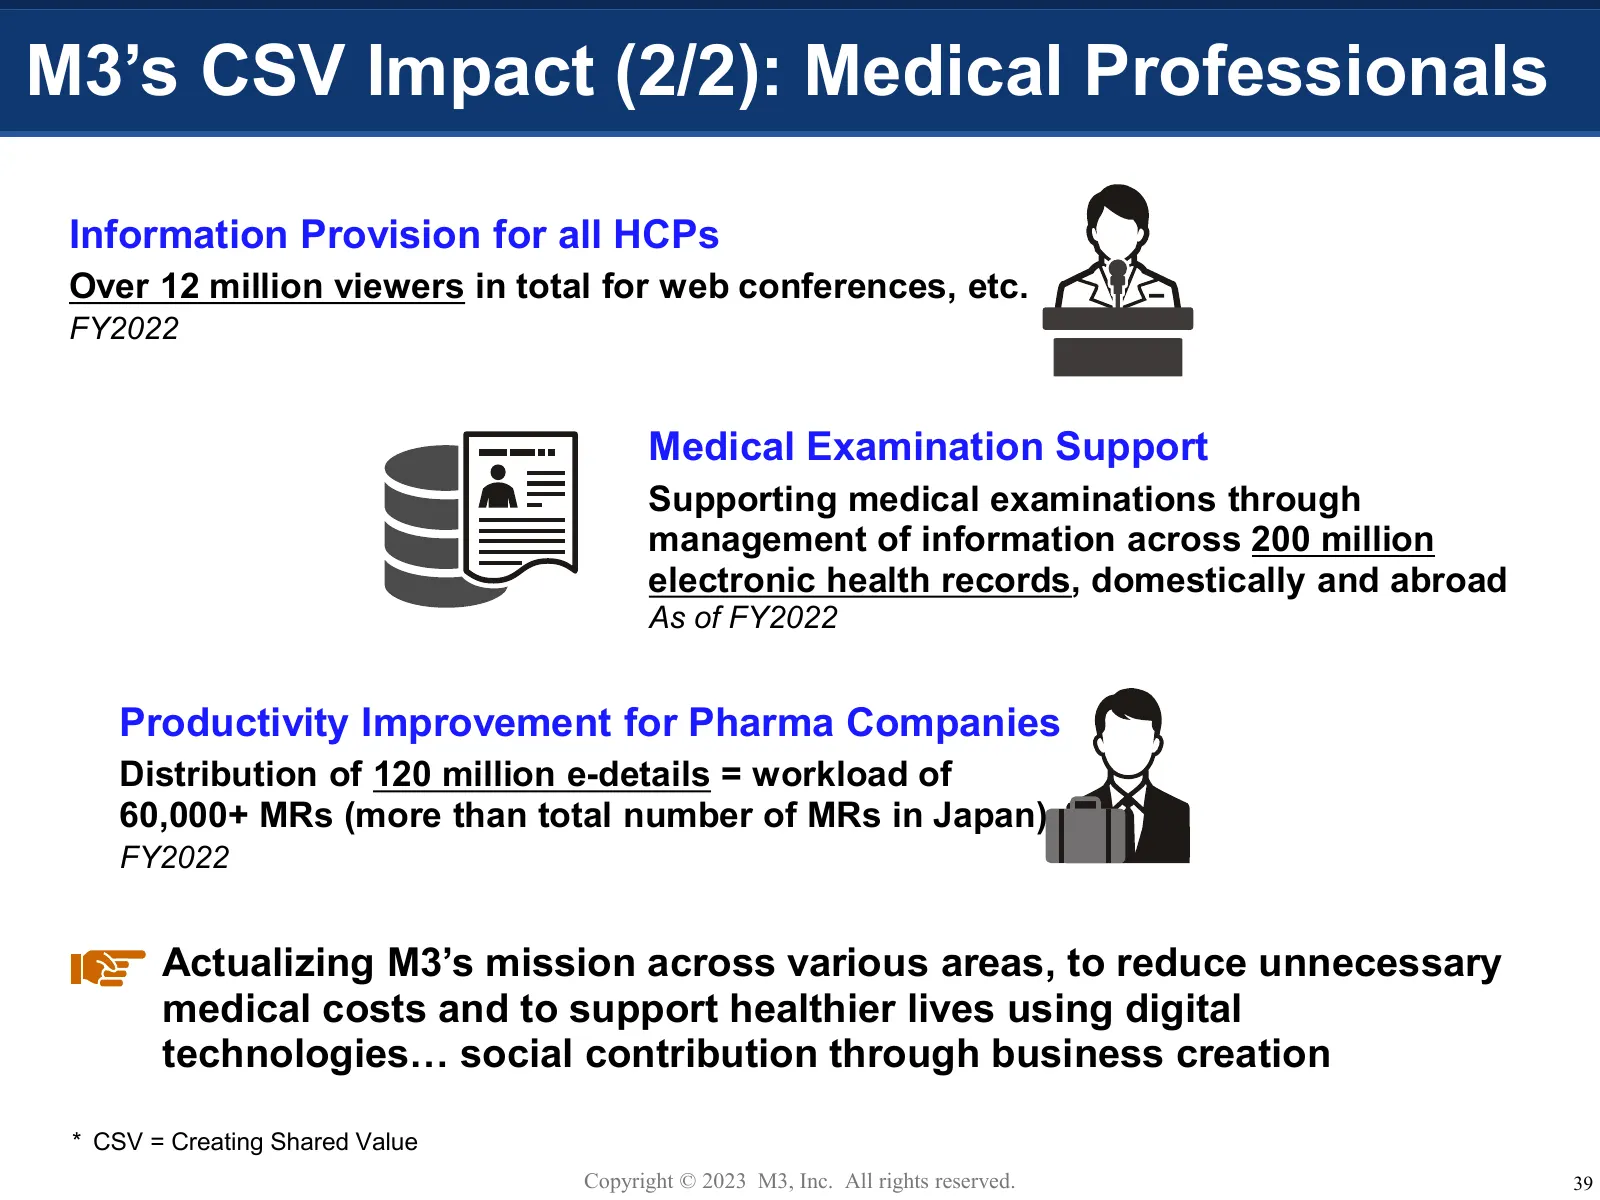
Slide 40: M3's CSV Impact (2/2): Medical Professionals
M3’s CSV Impact (2/2): Medical Professionals Information Provision for all HCPs Over 12 million viewers in total for web conferences, etc. FY2022 Medical Examination Support Supporting medical examinations through management of information across 200 million electronic health records, domestically a
Slide 41: FY2023 Outlook
FY2023 Outlook Copyright © 2023 M3, Inc. All rights reserved. 40
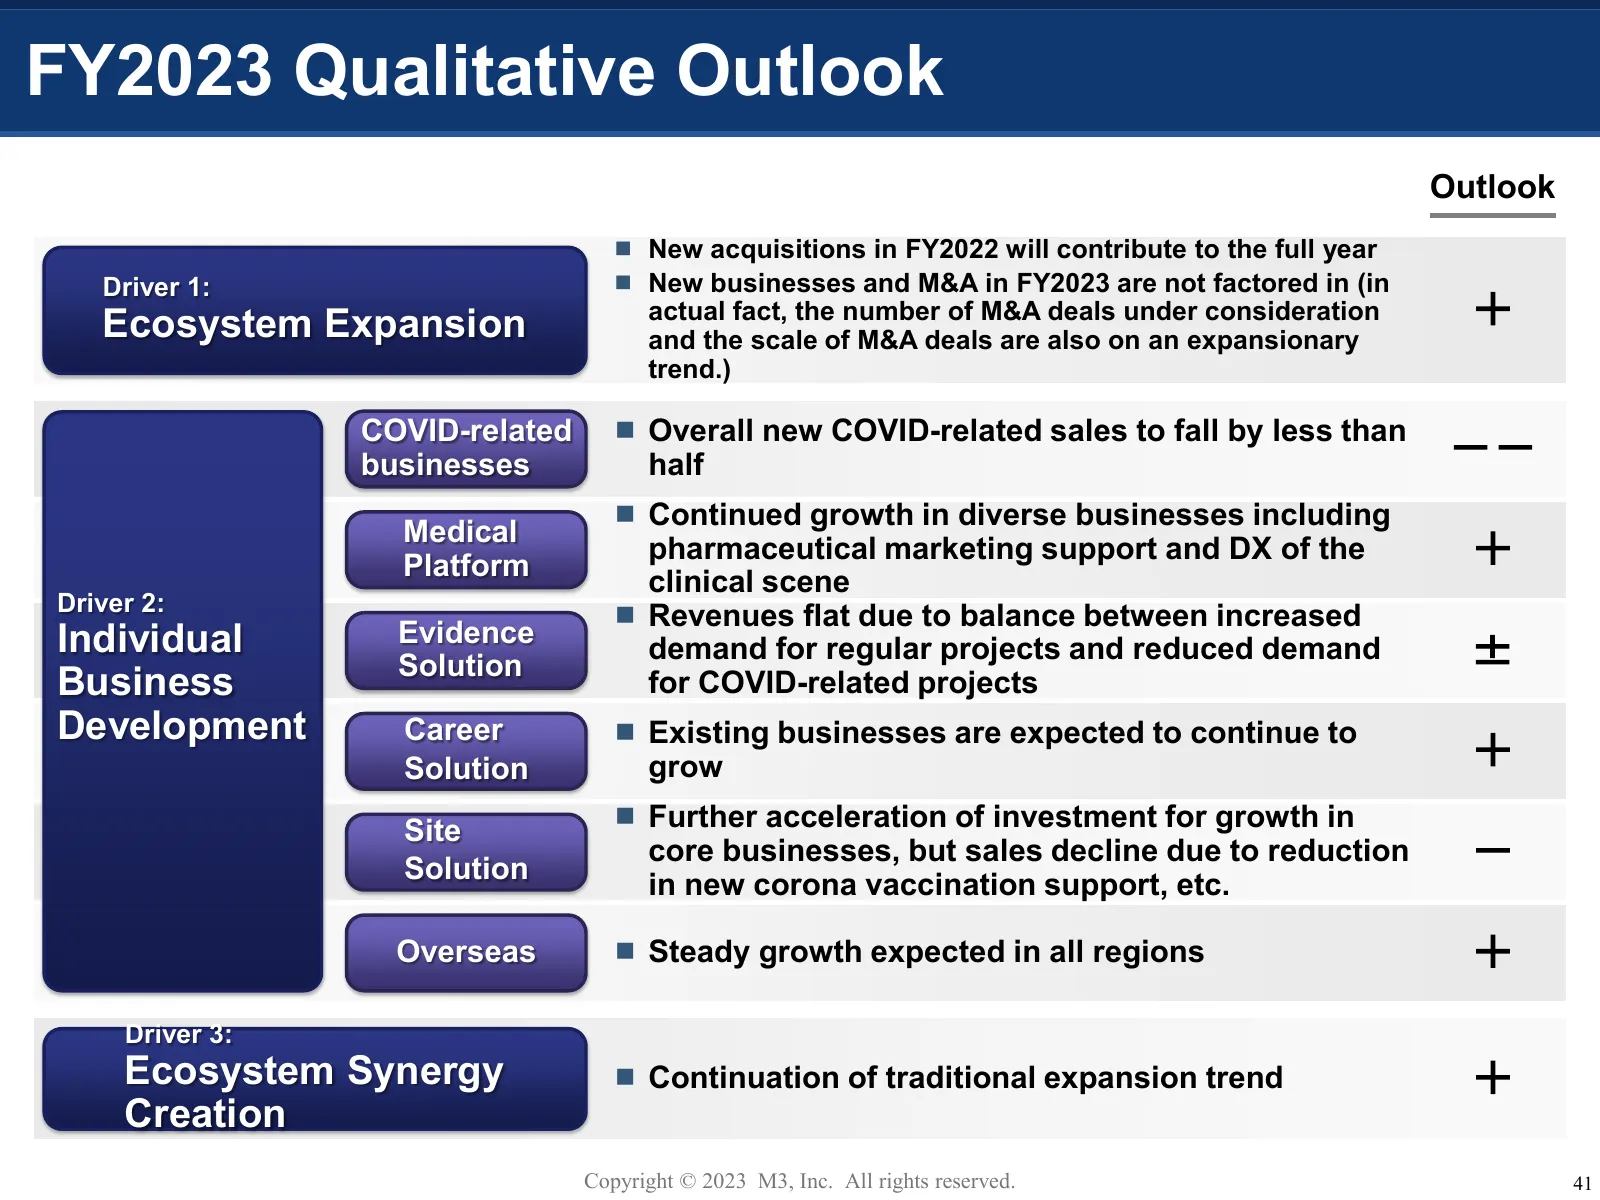
Slide 42: FY2023 Qualitative Outlook
FY2023 Qualitative Outlook Outlook New acquisitions in FY2022 will contribute to the full year Driver 1: New businesses and M&A in FY2023 are not factored in (in Ecosystem Expansion actual fact, the number of M&A deals under consideration + and the scale of M&A deals are also on an expansionary
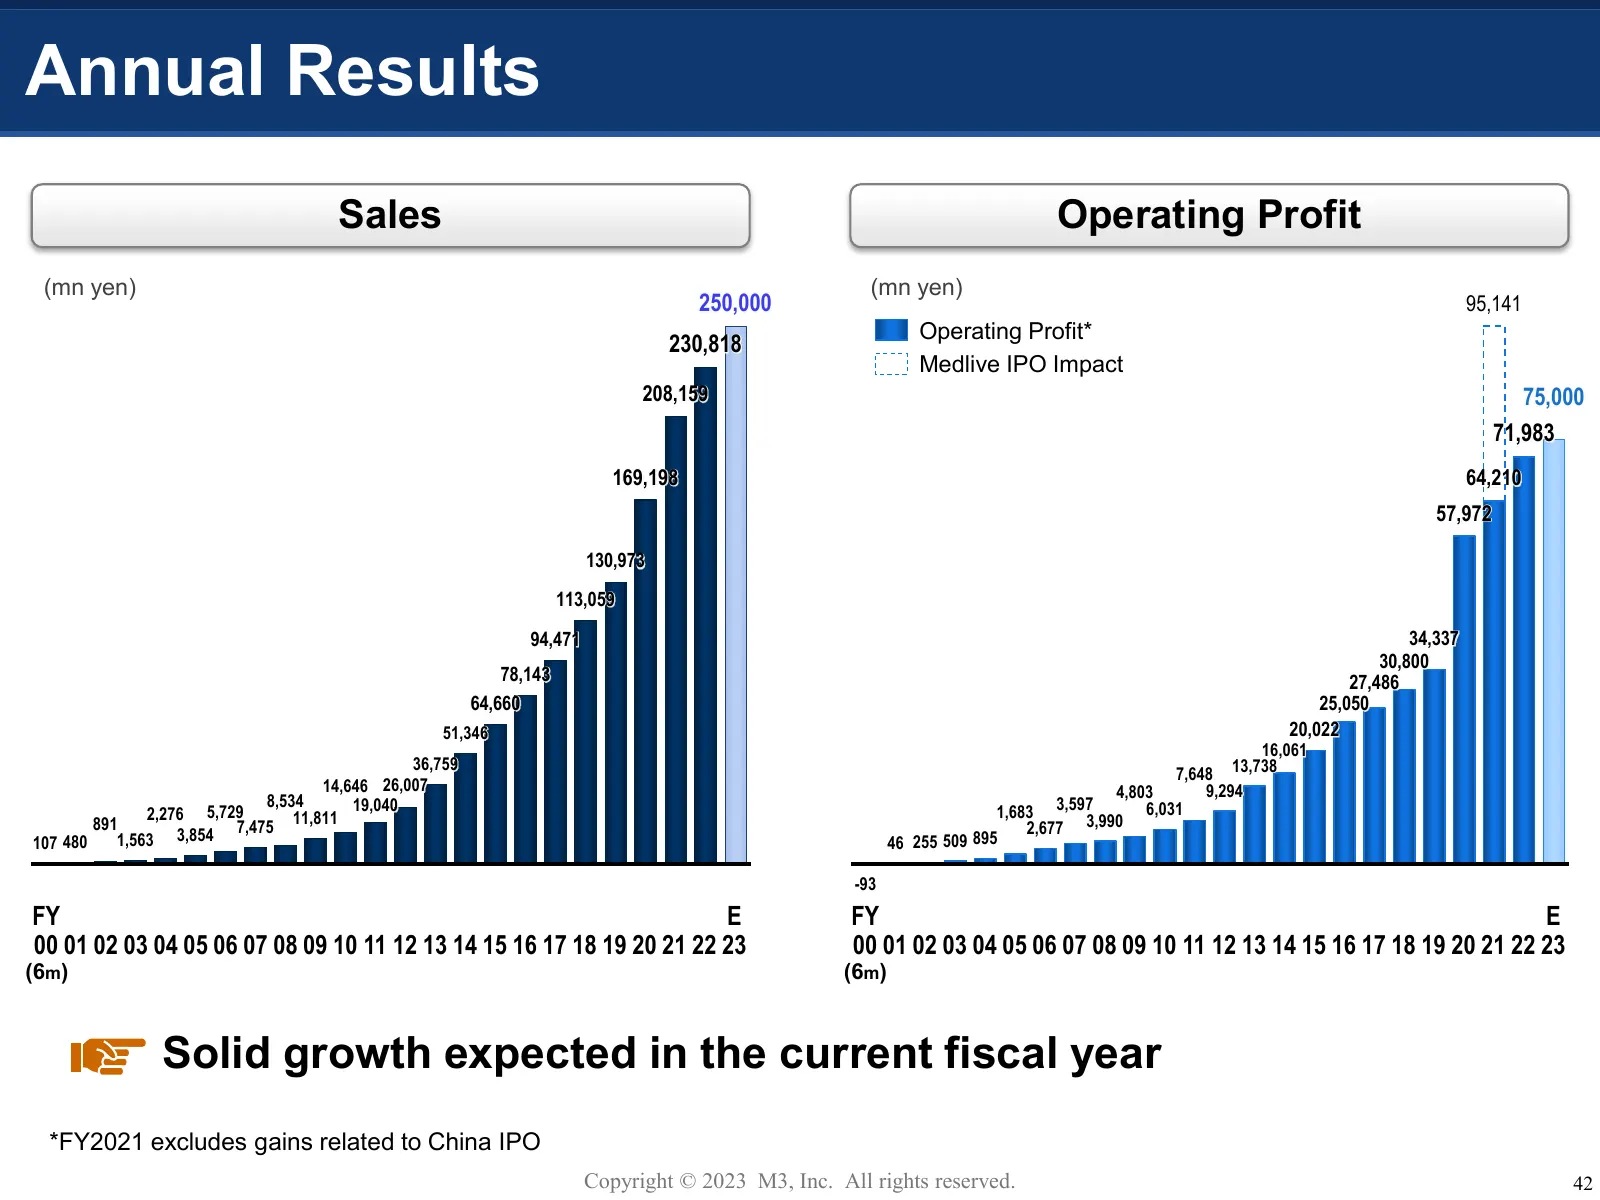
Slide 43: Annual Results
Annual Results Sales Operating Profit (mn yen) (mn yen) 250,000 95,141 Operating Profit* 230,818 Medlive IPO Impact 208,159 75,000 71,983 169,198 64,210 57,972 130,973 113,059 94,471 34,337 30,800 78,143 27,486 64,660 25,050 51,346 20,022 16,061 36,759 7,648 13,738 14,646 26,007 4,803 9,294 8,534 2,
Source: Internet Archive copy of corporate.m3.com
More decks from M3, Inc.
 Investor Presentation (November 2026)8 slides · Nov 20, 2026
 H1 FY2026 Earnings Presentation44 slides · Nov 4, 2026
 Q2 FY2026 Earnings Presentation44 slides · Nov 4, 2026
 Q1 FY2026 Earnings Presentation42 slides · Aug 6, 2026
 Merger or Acquisition (June 2026)14 slides · Jun 5, 2026
 FY2025 Earnings Presentation54 slides · May 1, 2026