Superior Drilling Products Inc
Superior Drilling Products — Q4 2020 Earnings Presentation
16 slides from Superior Drilling Products's earnings presentation, Mar 11, 2021
Slide 1: Fourth Quarter 2020 Financial Results Conference Call
Wy SUPERIOR DRILLING PRODUCTS FOURTH QUARTER 2020 FINANCIAL RESULTS CONFERENCE CALL MARCH 11, 2021 NYSE American: SDPI www.sdpi.com
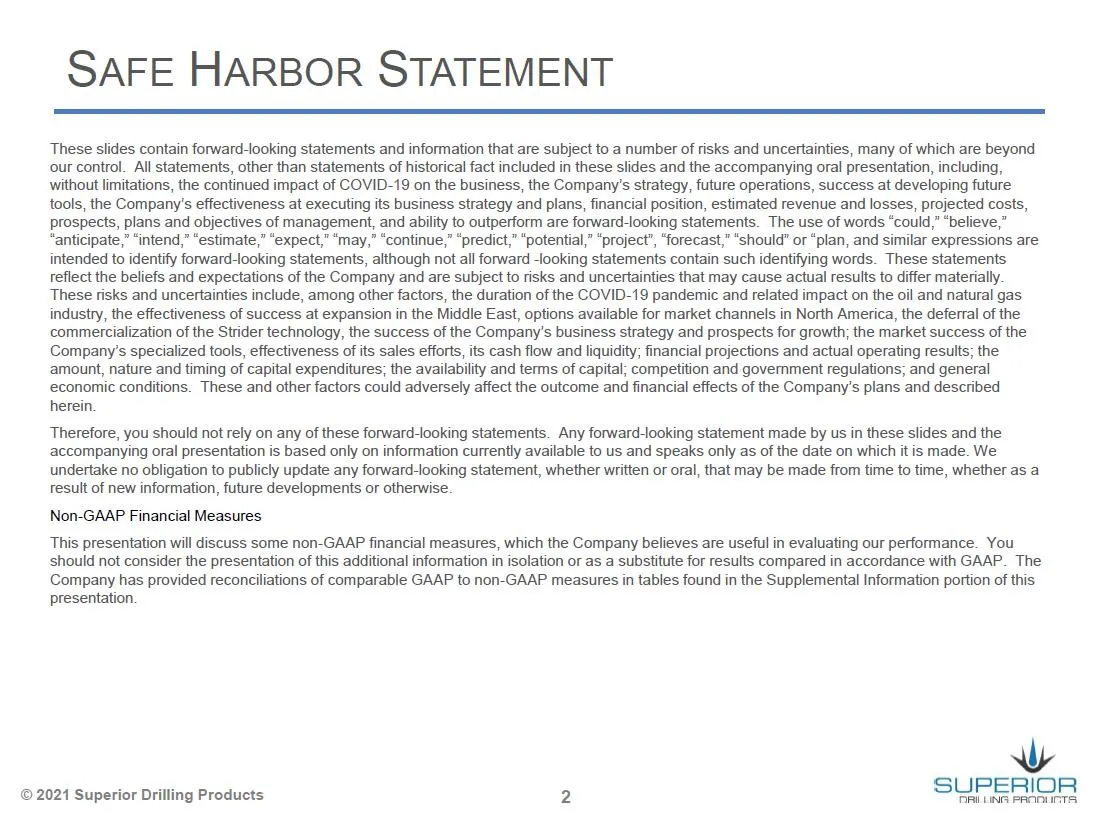
Slide 2: Safe Harbor Statement
SAFE HARBOR STATEMENT These slides contain forward-looking statements and information that are subject to a number of risks and uncertainties, many of which are beyond our control. All statements, other than statements of historical fact included in these slides and the accompanying oral presentatio
Slide 3: Troy Meier, Chairman and Chief Executive Officer
Wy SUPERIOR DRILLING PRODUCTS TROY MEIER CHAIRMAN AND CHIEF EXECUTIVE OFFICER ©2021 Superior Drilling Products
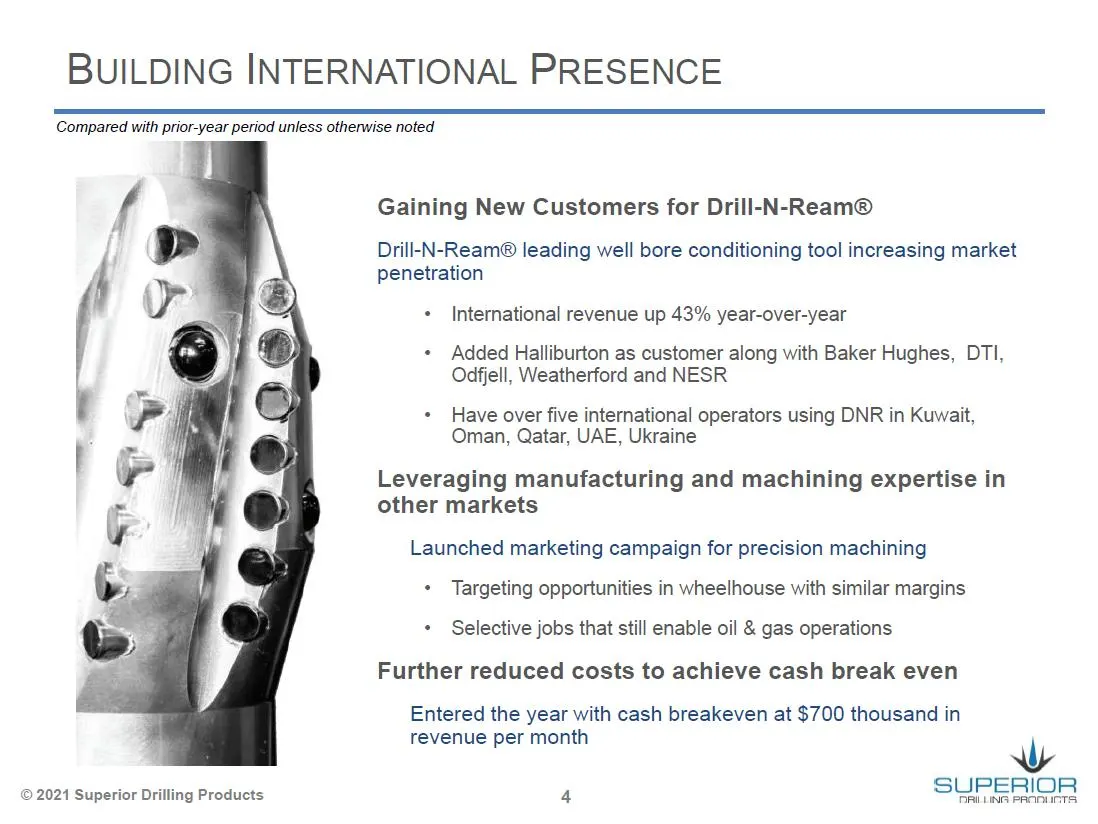
Slide 4: Building International Presence
BUILDING INTERNATIONAL PRESENCE Compared with prior-year period unless otherwise noted Gaining New Customers for Drill-N-Ream® Drill-N-Ream® leading well bore conditioning tool increasing market penetration + International revenue up 43% year-over-year + Added Halliburton as customer along with Bake
Slide 5: Christopher Cashion, Chief Financial Officer
Wy SUPERIOR DRILLING PRODUCTS CHRISTOPHER CASHION CHIEF FINANCIAL OFFICER
Slide 6: Revenue Expected to Improve from Q3 2020
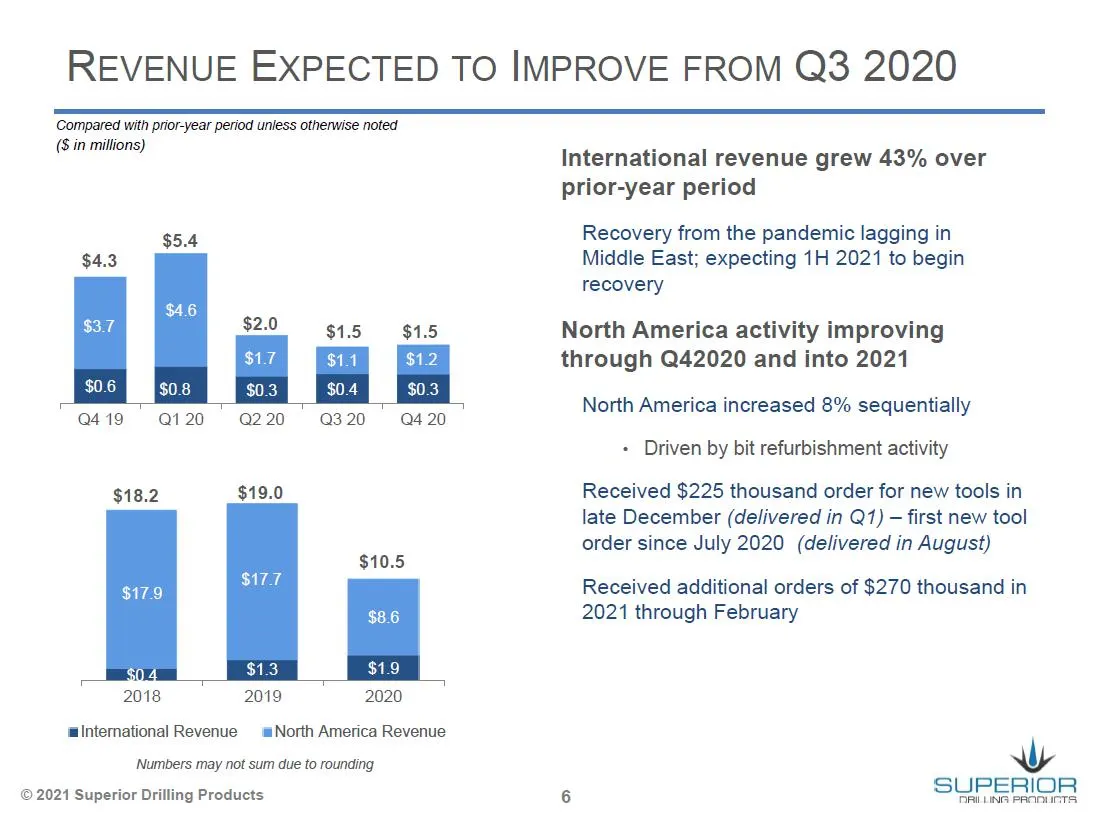
REVENUE EXPECTED TO IMPROVE FROM Q3 2020 Compared with prior-year period unless otherwise noted ($ in millions) $5.4 $1.5 $1.5 Q419 Q120 Q2 20 Q3 20 Q4 20 $18.2 $19.0 $10.5 S177 $8.6 5 $1.3 $1.9 2018 2019 2020 ‘alntemational Revenue i North America Revenue Numbers may not sum due to rounding © 2021
Slide 7: Tool and Contract Services Revenue
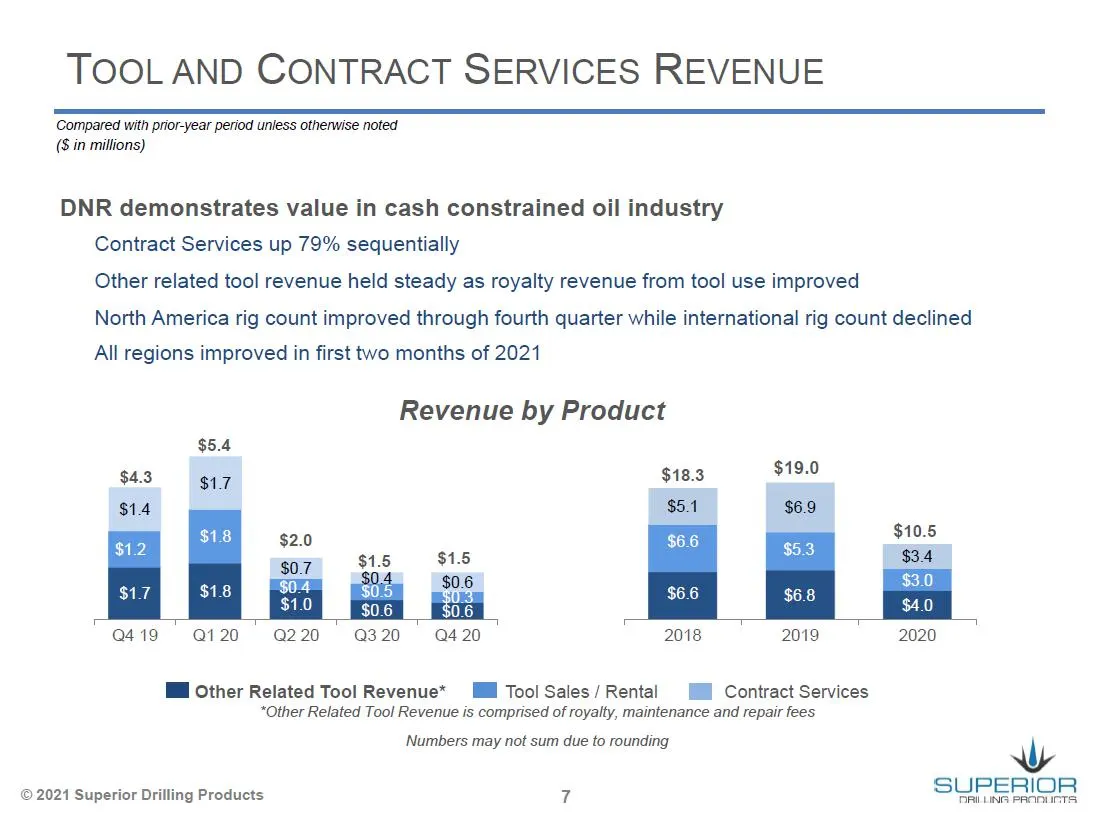
TOOL AND CONTRACT SERVICES REVENUE Compared with prior-year period unless otherwise noted ($ in millions) DNR demonstrates value in cash constrained oil industry Contract Services up 79% sequentially Other related tool revenue held steady as royalty revenue from tool use improved North America rig c
Slide 8: Reduced Cost and Operational Structure
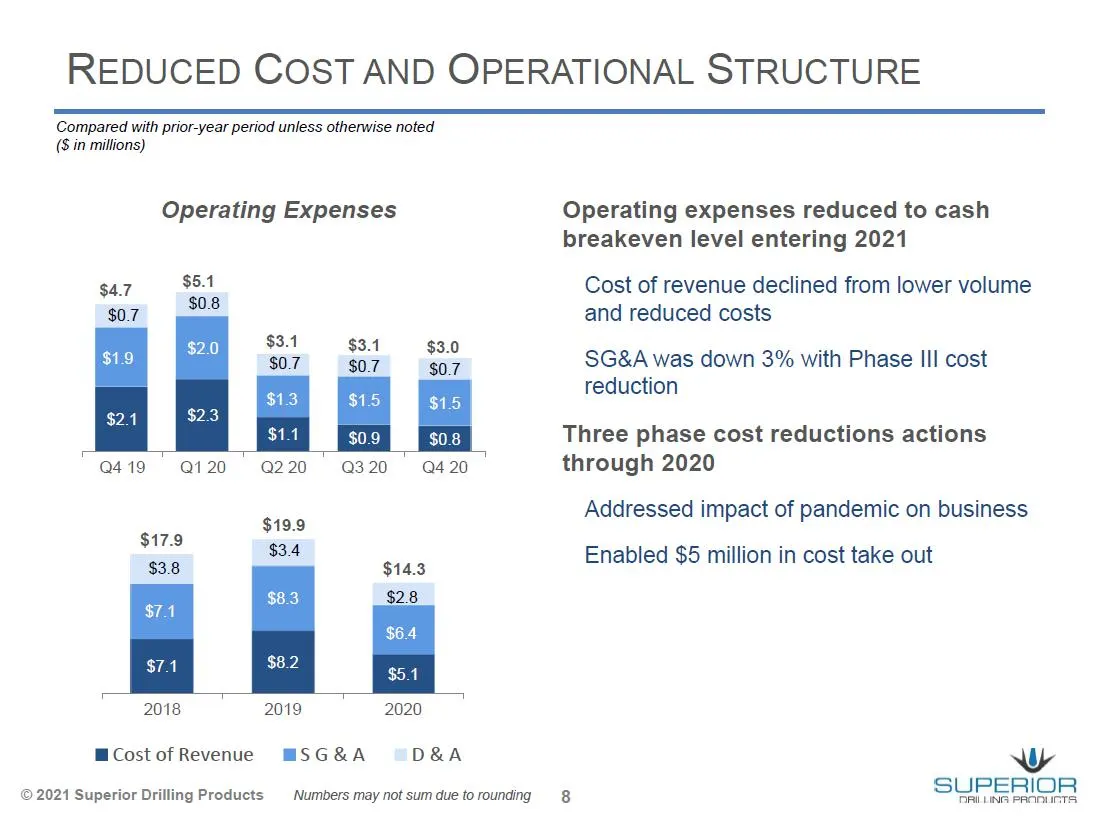
REDUCED COST AND OPERATIONAL STRUCTURE Compared with prior-year period unless otherwise noted ($ in millions) Operating Expenses Operating expenses reduced to cash breakeven level entering 2021 $4.7 $5.1 Cost of revenue declined from lower volume $0.7 $0.8 and reduced costs SG&A was down 3% with Pha
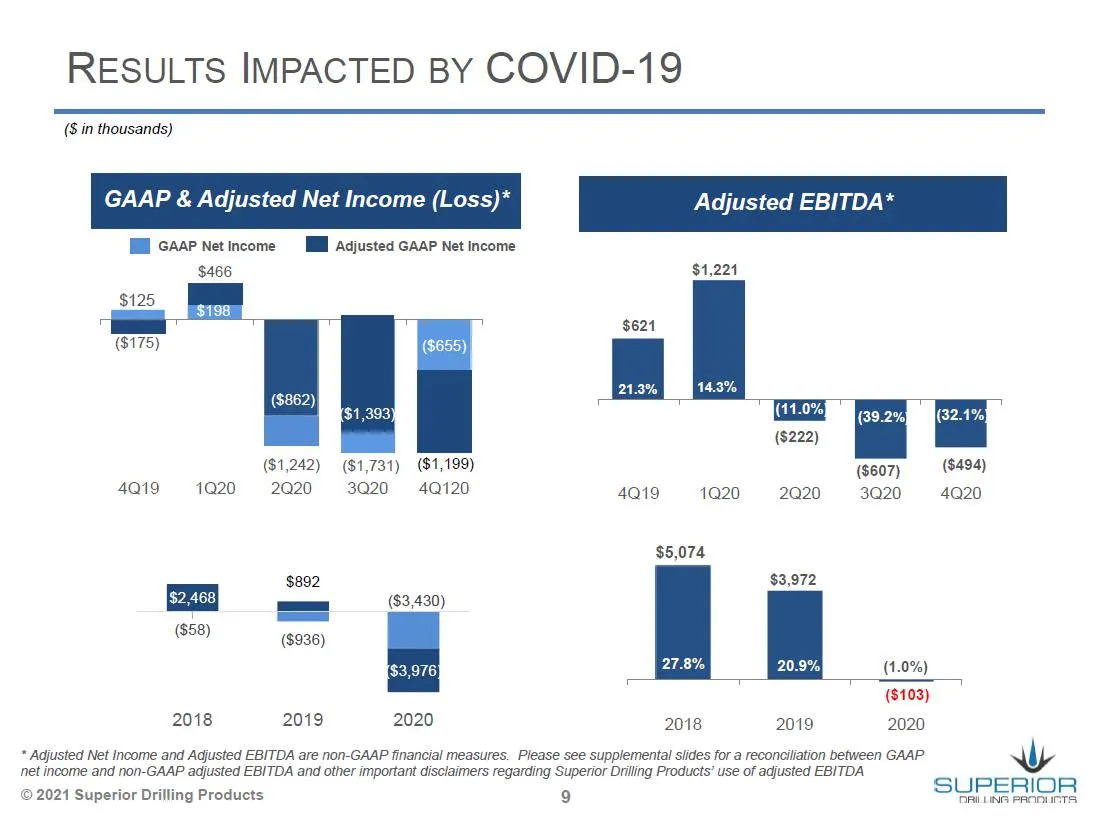
Slide 9: Results Impacted by COVID-19
RESULTS IMPACTED BY COVID-19 (8 in thousands) GAAP & Adjusted Net Income (Loss)* Adjusted EBITDA* I GAAP Net income Il Adjusted GAAP Net Income $466 $1,221 ($175) ($222) ($1,242) ($1,731) ($1,199) (607) (8494) 4a19 1020 2020 3020 40120 4Q19 1020 2020 3020 4020 $5,074 $892 $3,972 = ($3,430) u — ($58)
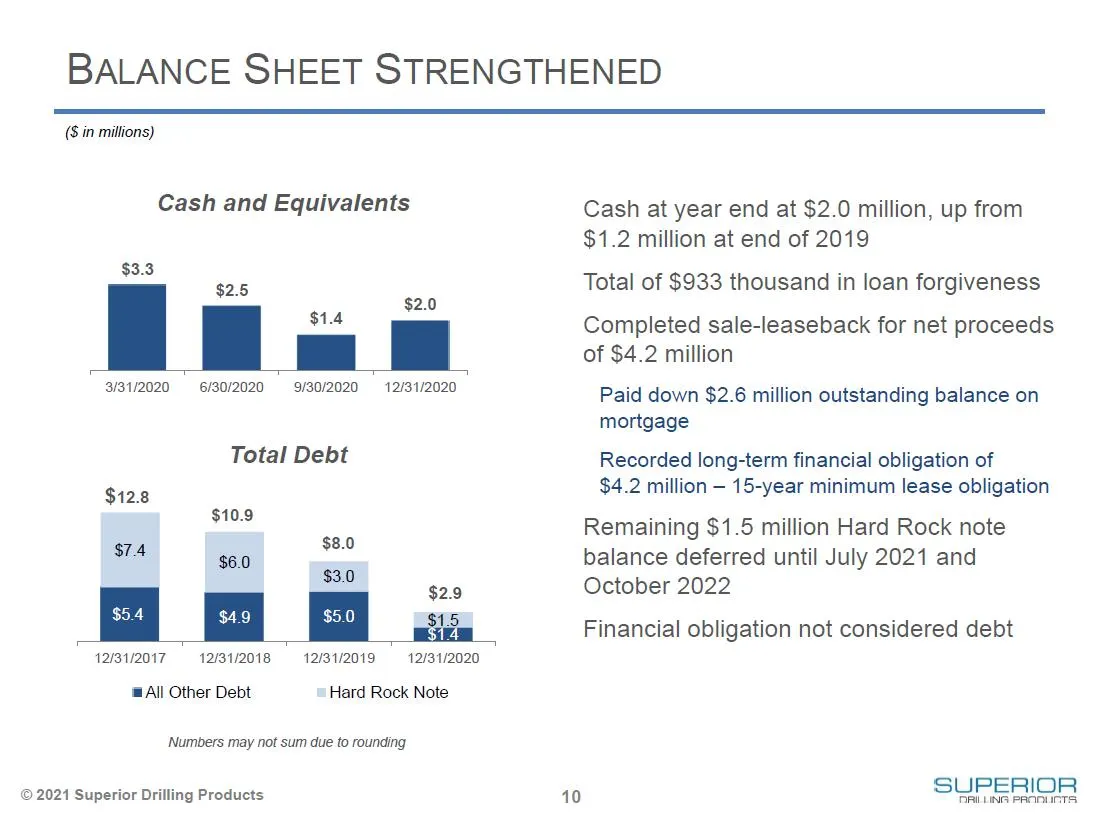
Slide 10: Balance Sheet Strengthened
BALANCE SHEET STRENGTHENED (8 in millions) Cash and Equivalents Cash at year end at $2.0 million, up from $1.2 million at end of 2019 $35 $2.5 Total of $933 thousand in loan forgiveness $2.0 S18 Completed sale-leaseback for net proceeds of $4.2 million vee Peace “here leer ys Paid down $2.6 million
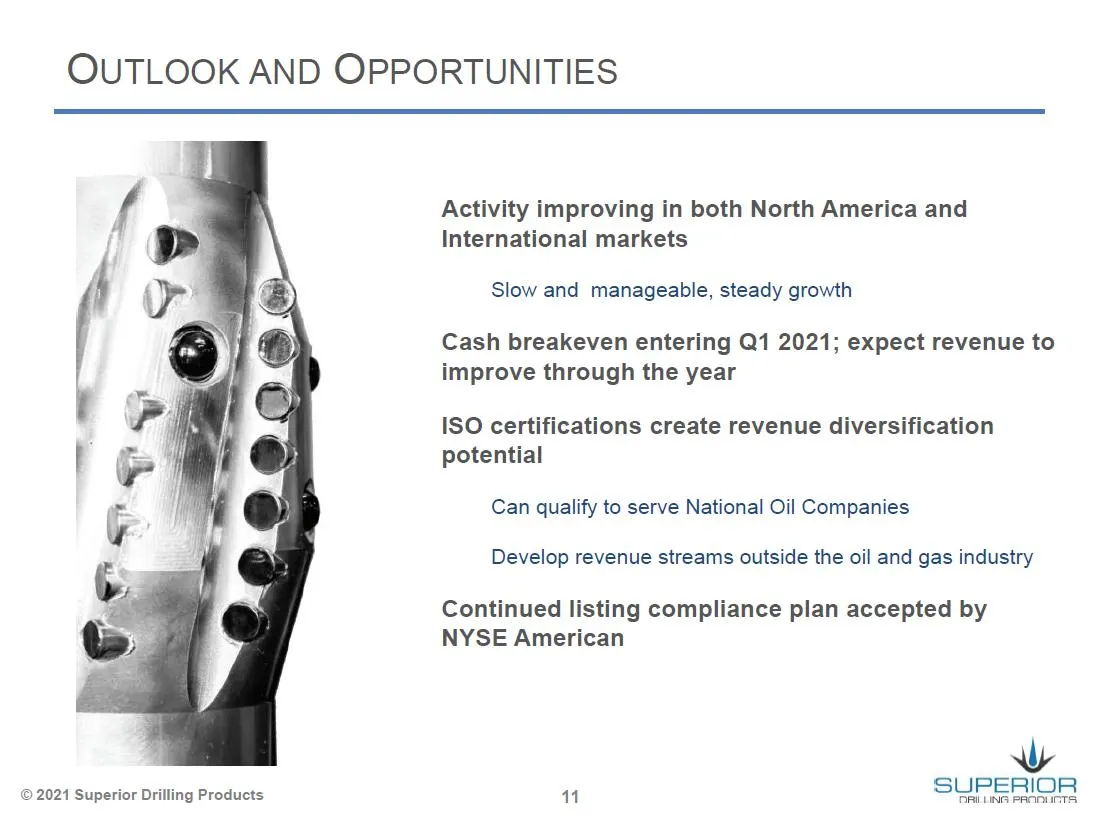
Slide 11: Outlook and Opportunities
OUTLOOK AND OPPORTUNITIES © 2021 Superior Drilling Products Activity improving in both North America and International markets Slow and manageable, steady growth Cash breakeven entering Q1 2021; expect revenue to improve through the year ISO certifications create revenue diversification potential Ca
Slide 12: Supplemental Information
Wy SUPERIOR DRILLING PRODUCTS SUPPLEMENTAL INFORMATION
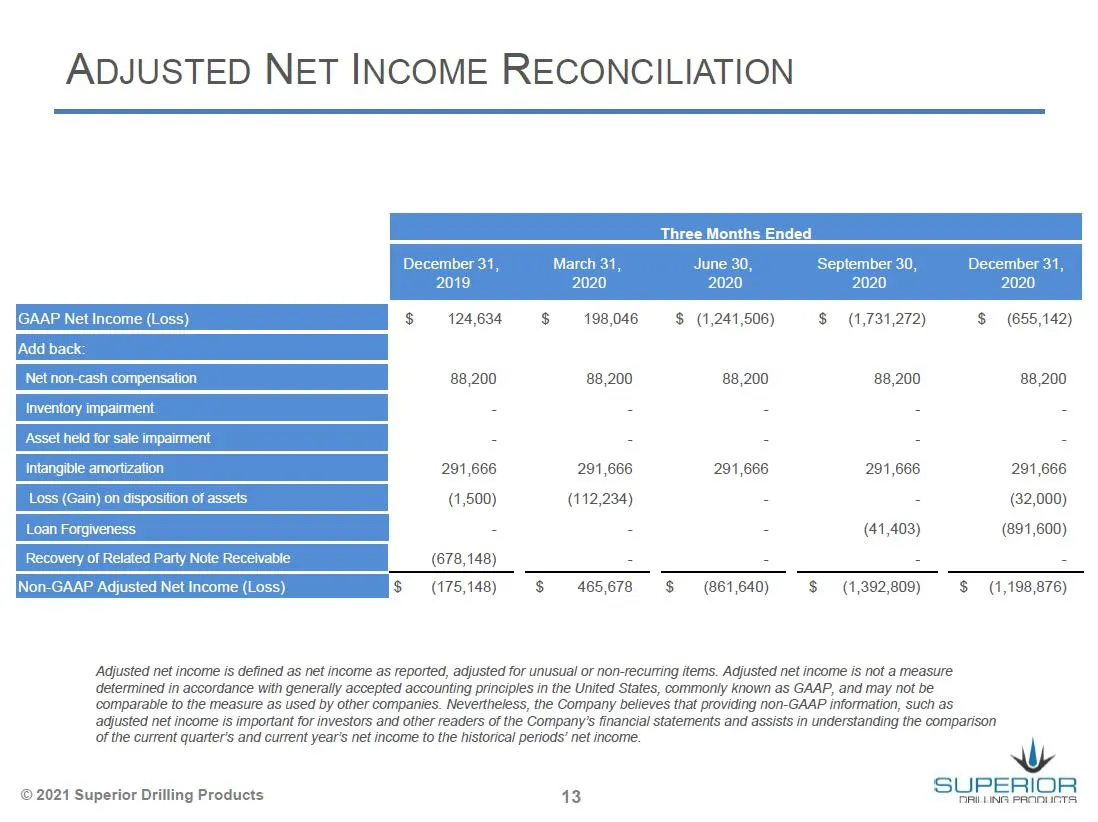
Slide 13: Adjusted Net Income Reconciliation
ADJUSTED NET INCOME RECONCILIATION GAAP Net Income (Loss) $ 124634 $ 198,046 $ (1,241,506) $1,731,272) $ (655,142) |Add back: tion 88,200 88,200 88,200 88,200 88,200 Inventory impairmer m fe fe . - Net non com Asset held for sale impairmer - - - - - (soy 2209 - 2000 ; a ers) 7040 : Non-GAAP Adjusted
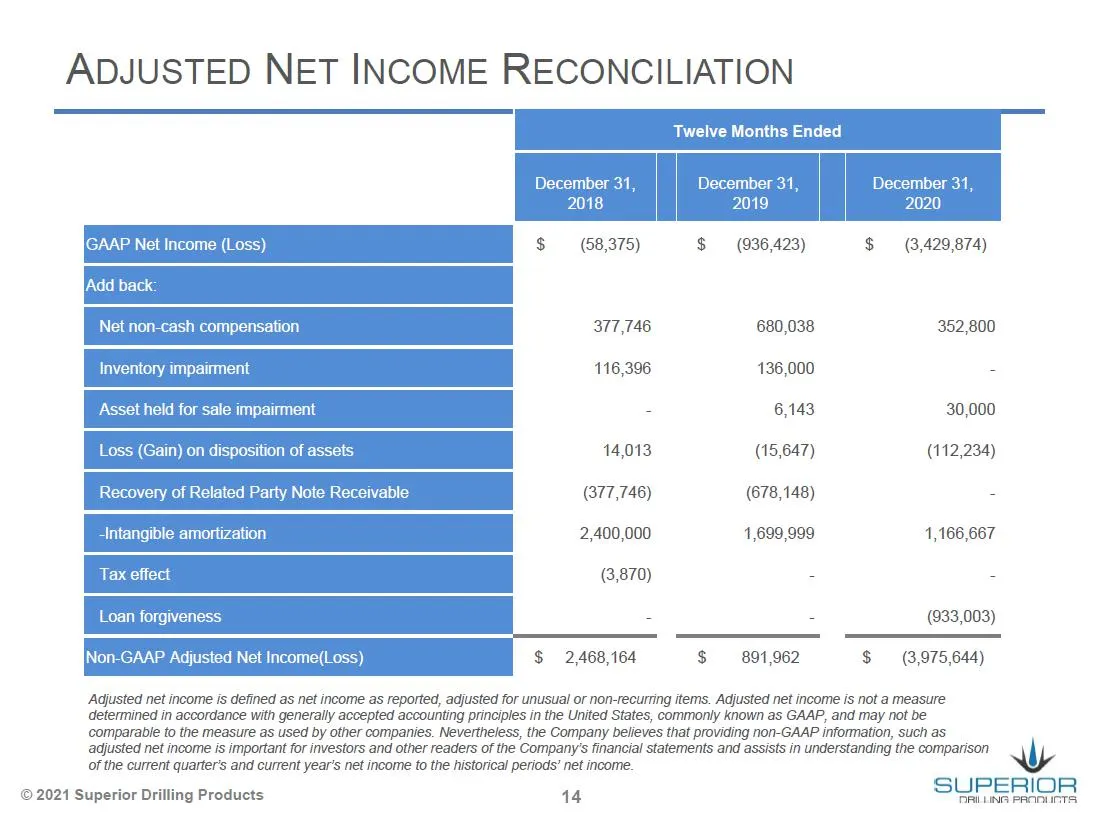
Slide 14: Adjusted Net Income Reconciliation
ADJUSTED NET INCOME RECONCILIATION Twelve Months Ended December 31, December 31, 2018 2019 2020 $ (8,375) $ (936,423) $ (3,429,874) 2,400,000 1,699,999 1,166,667 Loan forgiveness - (933,003) Non-GAAP Adjusted Net Income(Loss) $ 2,468,164 $ 891,962 $ (3,975,644) December 31, Adjusted net income is de
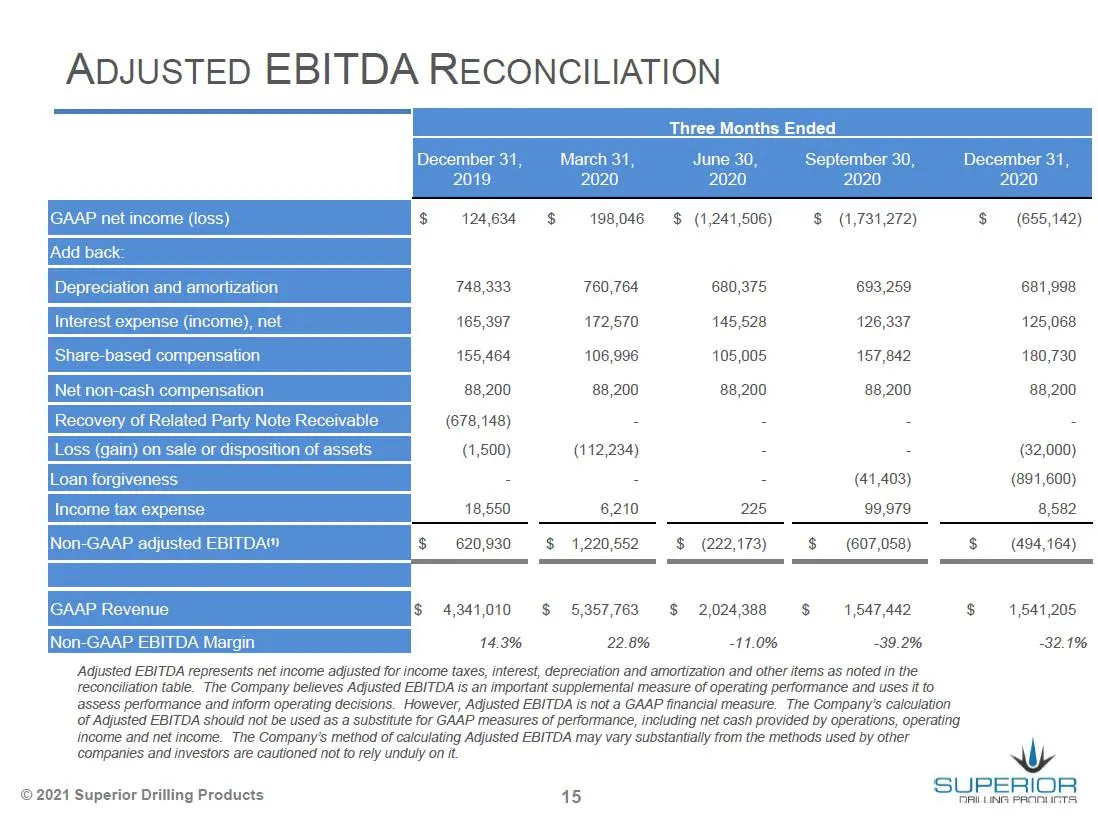
Slide 15: Adjusted EBITDA Reconciliation
ADJUSTED EBITDA RECONCILIATION 2020 GAAP net 124,634 $ 198,046 $ (1,241,506) $$ _ (1,731,272) $ (655,142) 748,333 760,764 680,375 693,259 681,998 165,397 172,570 145,528 126,337 125,068 155,464 106,996 105,005 157,842 180,730 88,200 88,200 88,200 88,200 88,200 (678,148) = - - = (1,500) (112,234) - -
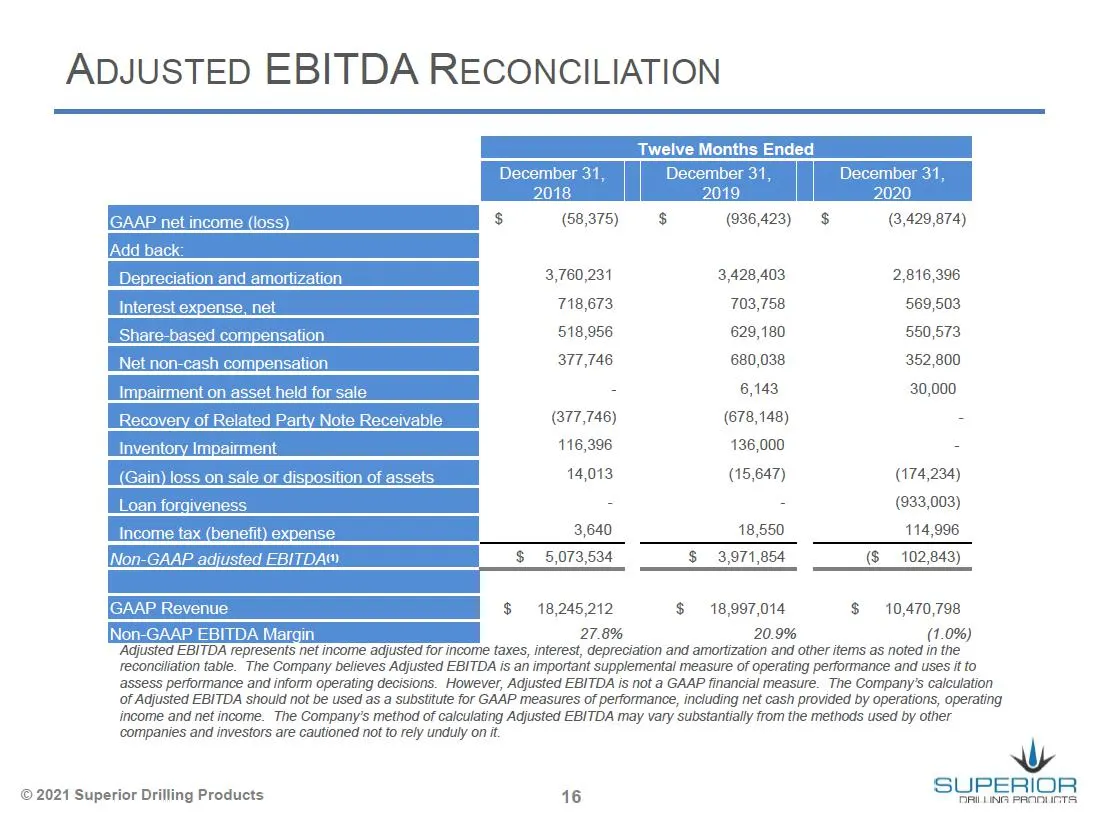
Slide 16: Adjusted EBITDA Reconciliation 2020
ADJUSTED EBITDA RECONCILIATION 2 2020 S (68.375) $ (936,423) $3,429,874) 3,760,231 3,428,403 2,816,396 718,673 703,758 569,503 518,956 629,180 550,573 377,746 680,038, 352,800 6,143 30,000 (377,746) (678,148) - 116,396 136,000 14,013 (15,647) (174,234) E = (933,003) 3,640 18,550 114,996 Non-GAAP adj
Source: SEC EDGAR · 8-K filed Mar 11, 2021
More decks from Superior Drilling Products Inc
 Q3 2023 Earnings Presentation12 slides · Nov 9, 2023
 Q2 2023 Earnings Presentation12 slides · Aug 14, 2023
 Q1 2023 Earnings Presentation12 slides · May 15, 2023
 FY2022 Earnings Presentation13 slides · Mar 10, 2023
 Q3 2022 Earnings Presentation12 slides · Nov 14, 2022
 MicroCap Rodeo Windy City Roundup 202220 slides · Oct 12, 2022