Hellenic Telecommunications Organization SA · ATHEX:HTO
Hellenic Telecommunications Organization SA — Cosmote — Q1 2007 Earnings Presentation
21 slides from Hellenic Telecommunications Organization SA's earnings presentation, June 2007
Slide 1: COSMOTE Q1 2007 Reaping the benefits of expansion
COSMOTE Q1 2007 Reaping the benefits of expansion June 2007 Visit our website: www.cosmote.com
Slide 2: Group Performance
Group Performance COSMOTE
Slide 3: The trends of the quarter
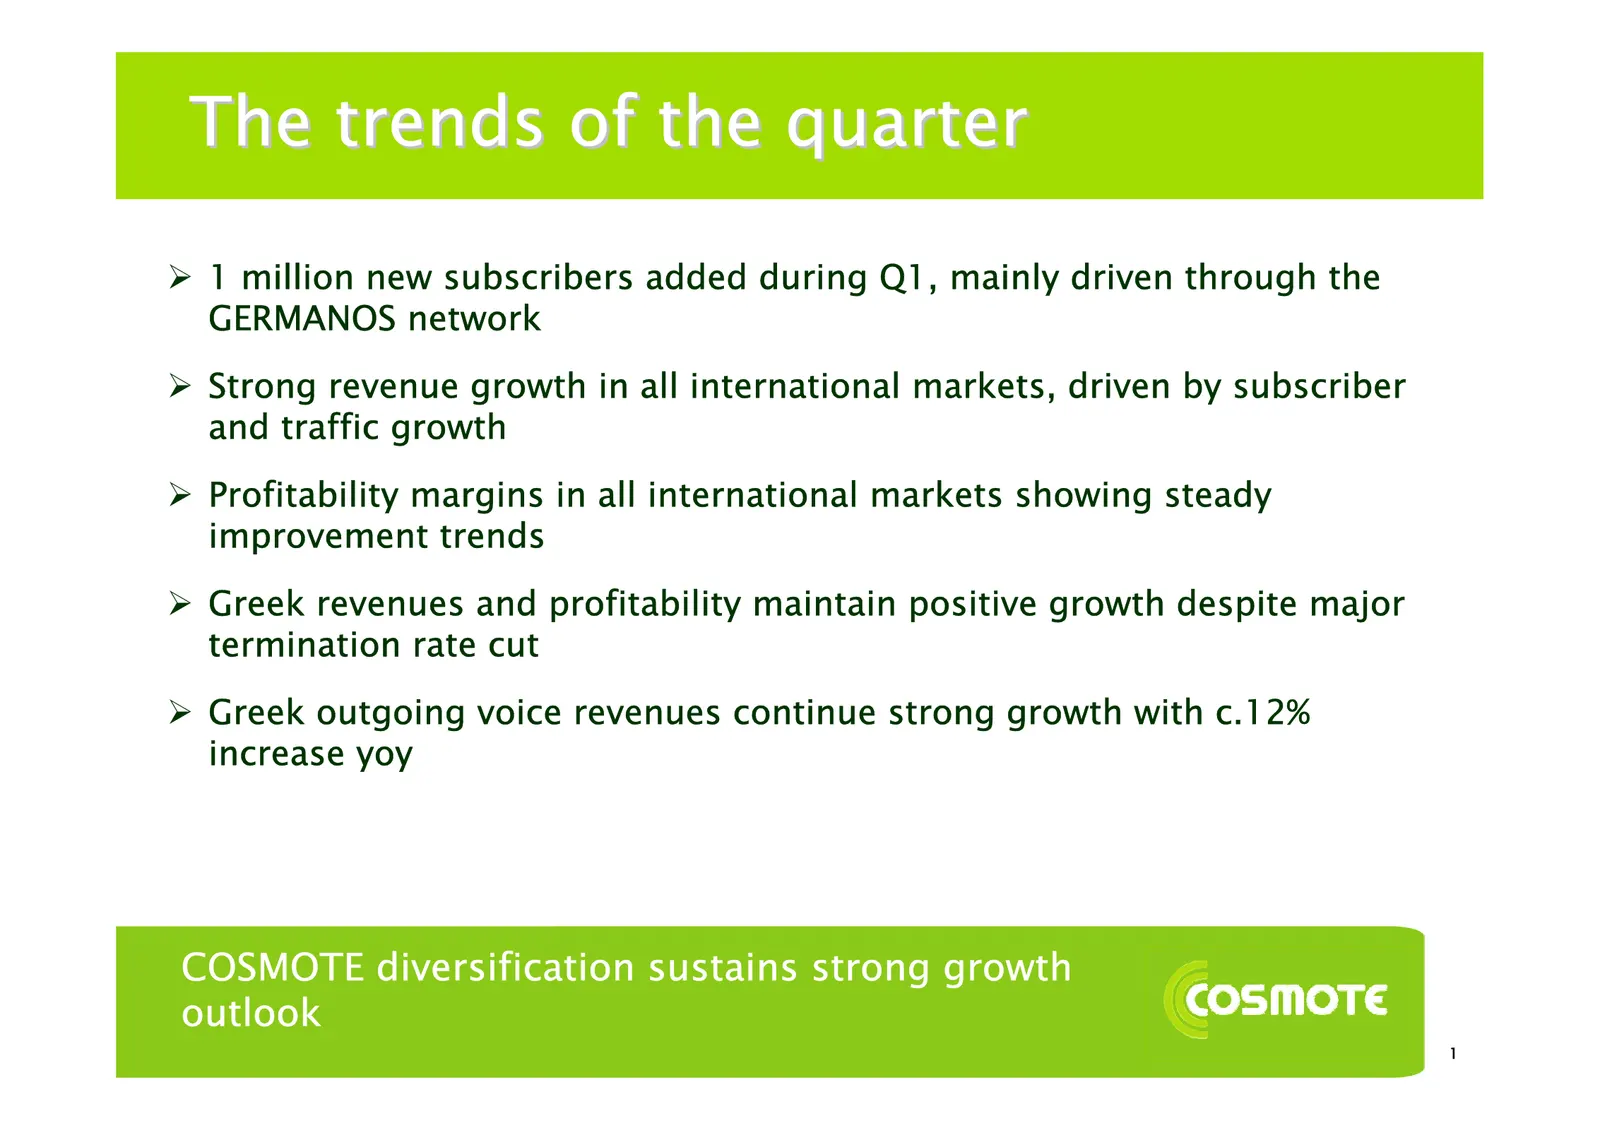
The trends of the quarter ¾ 1 million new subscribers added during Q1, mainly driven through the GERMANOS network ¾ Strong revenue growth in all international markets, driven by subscriber and traffic growth ¾ Profitability margins in all international markets showing steady improvement trends ¾ Gre
Slide 4: Q1 2007 Financial Highlights
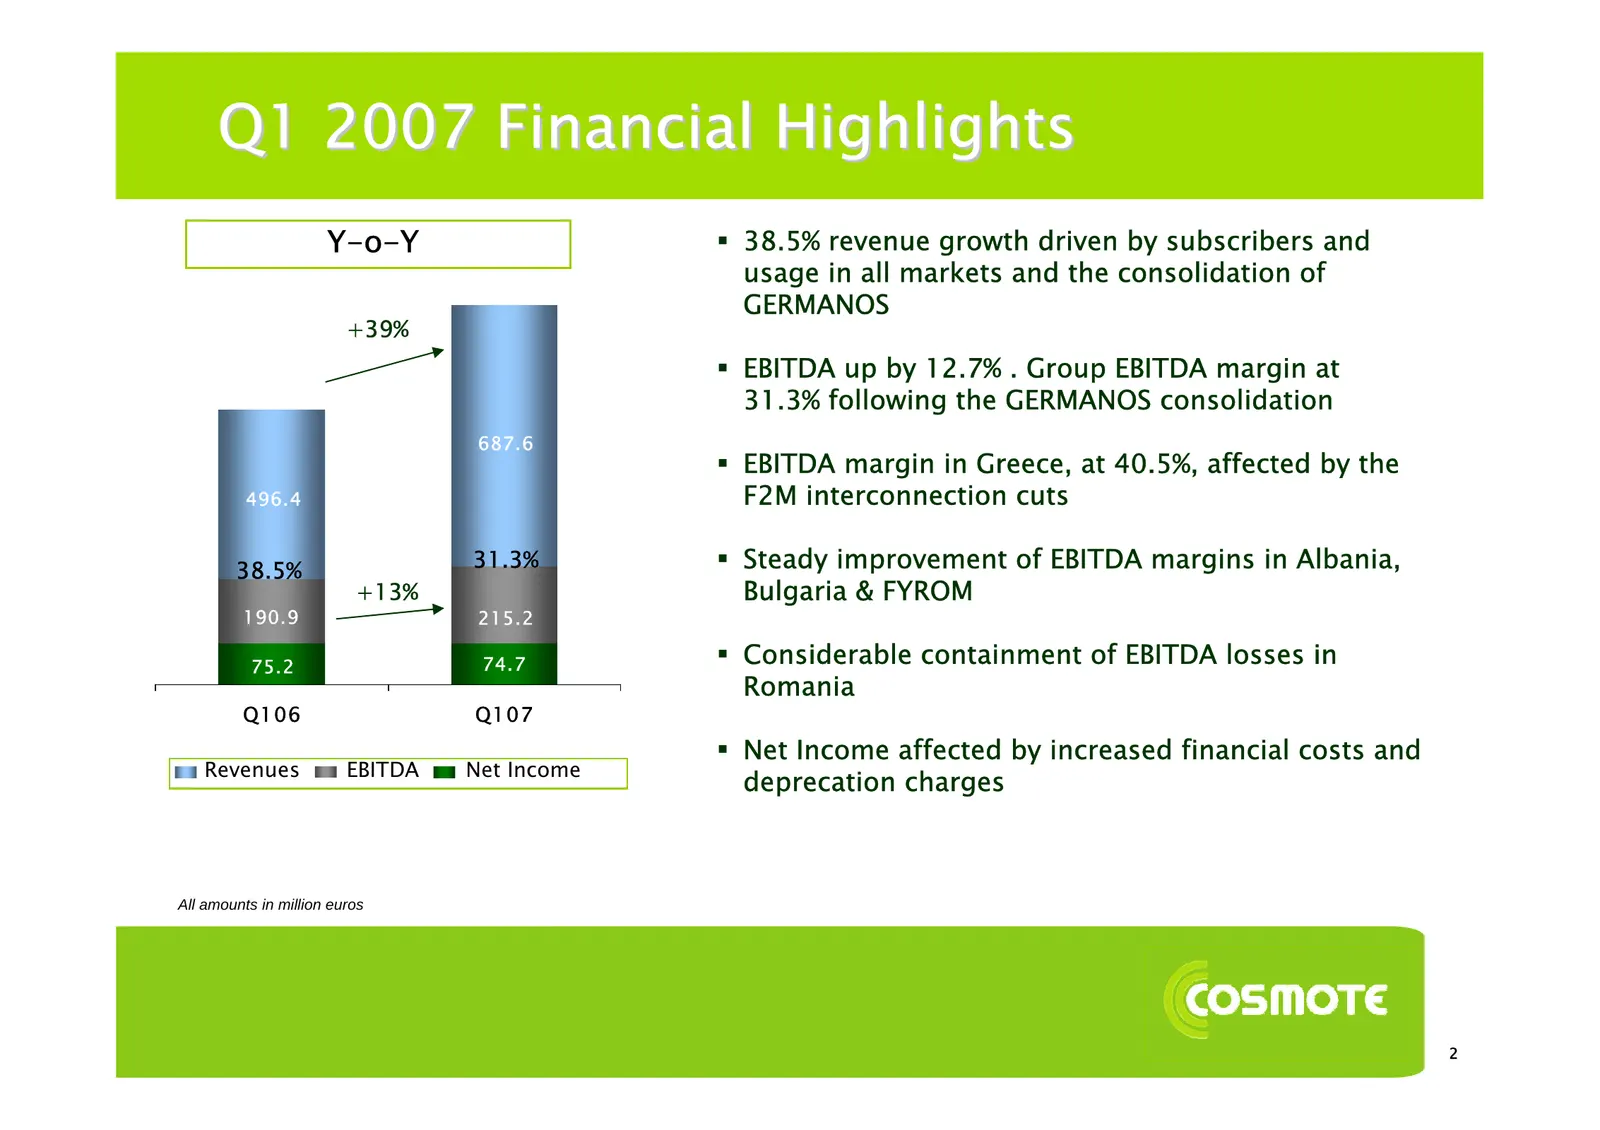
Q1 2007 Financial Highlights Y-o-Y 38.5% revenue growth driven by subscribers and usage in all markets and the consolidation of GERMANOS +39% EBITDA up by 12.7% . Group EBITDA margin at 31.3% following the GERMANOS consolidation 687.6 EBITDA margin in Greece, at 40.5%, affected by the 496.4 F2
Slide 5: Q1 2007 Operational Highlights
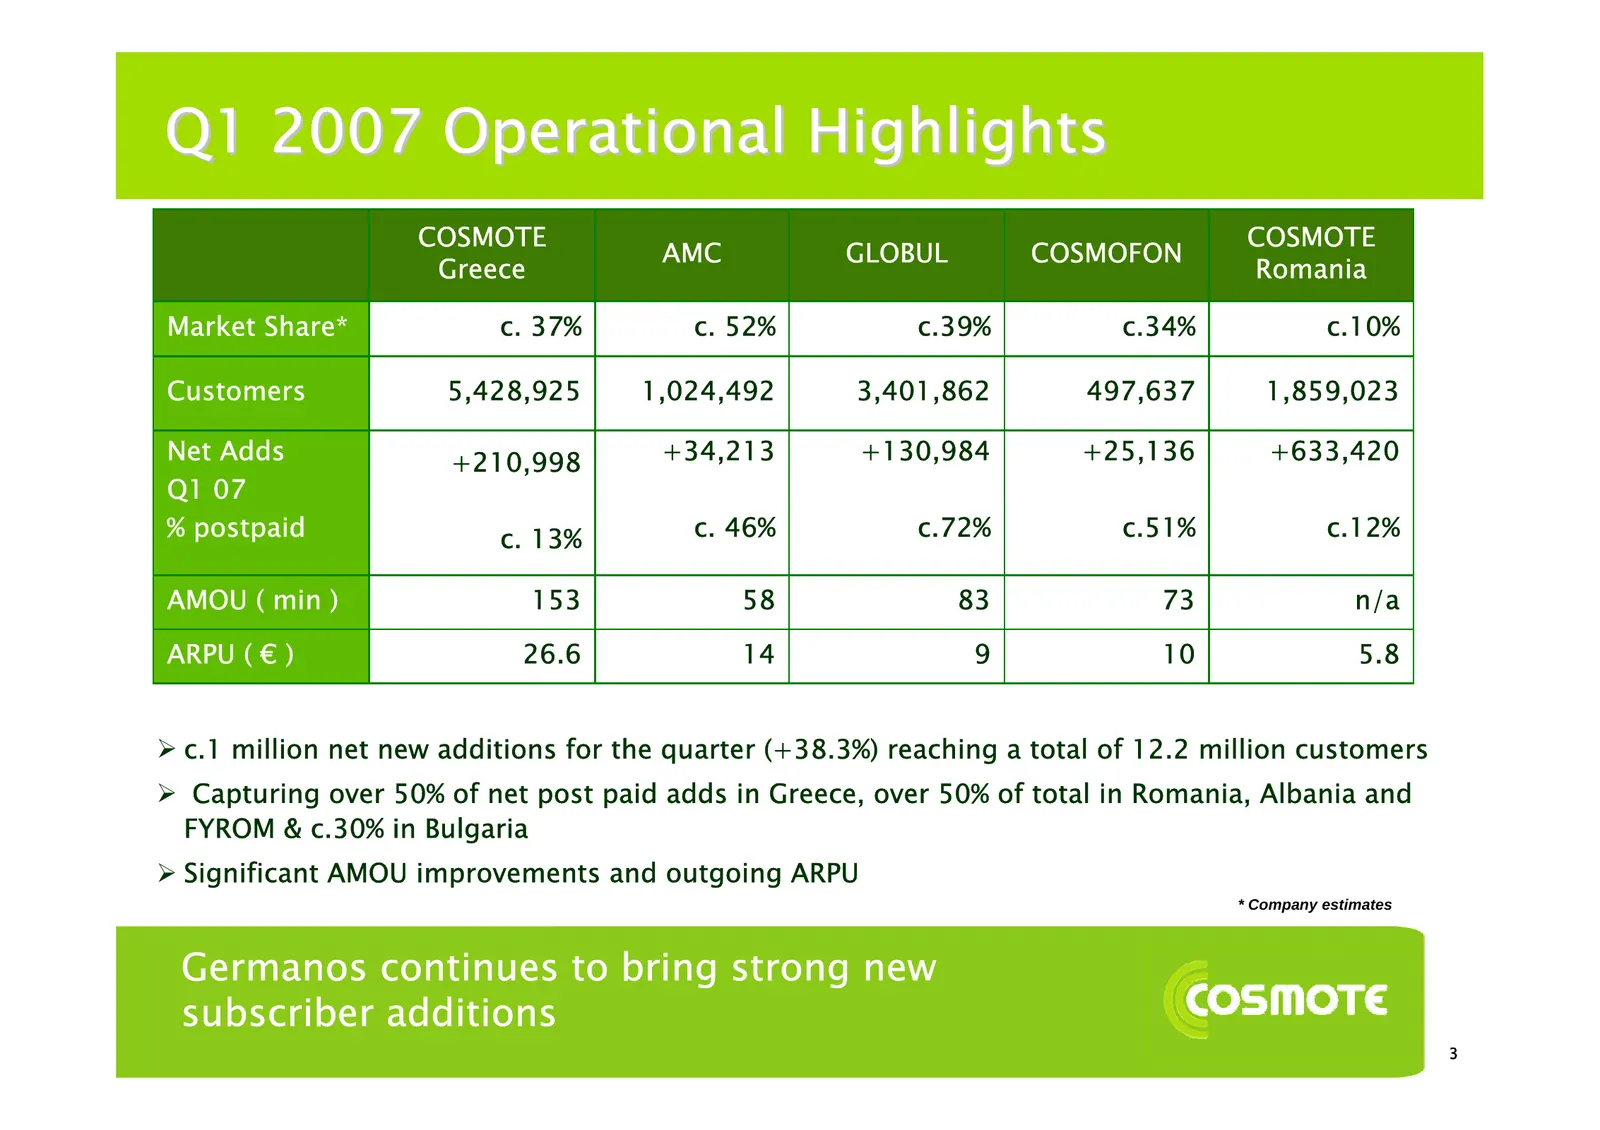
Q1 2007 Operational Highlights COSMOTE COSMOTE AMC GLOBUL COSMOFON Greece Romania Market Share* c. 37% c. 52% c.39% c.34% c.10% Customers 5,428,925 1,024,492 3,401,862 497,637 1,859,023 Net Adds +210,998 +34,213 +130,984 +25,136 +633,420 Q1 07 % postpaid c. 13% c. 46% c.72% c.51% c.12% AMOU ( min )
Slide 6: Operational & Financial Review
Operational & Financial Review
Slide 7: COSMOTE Greece
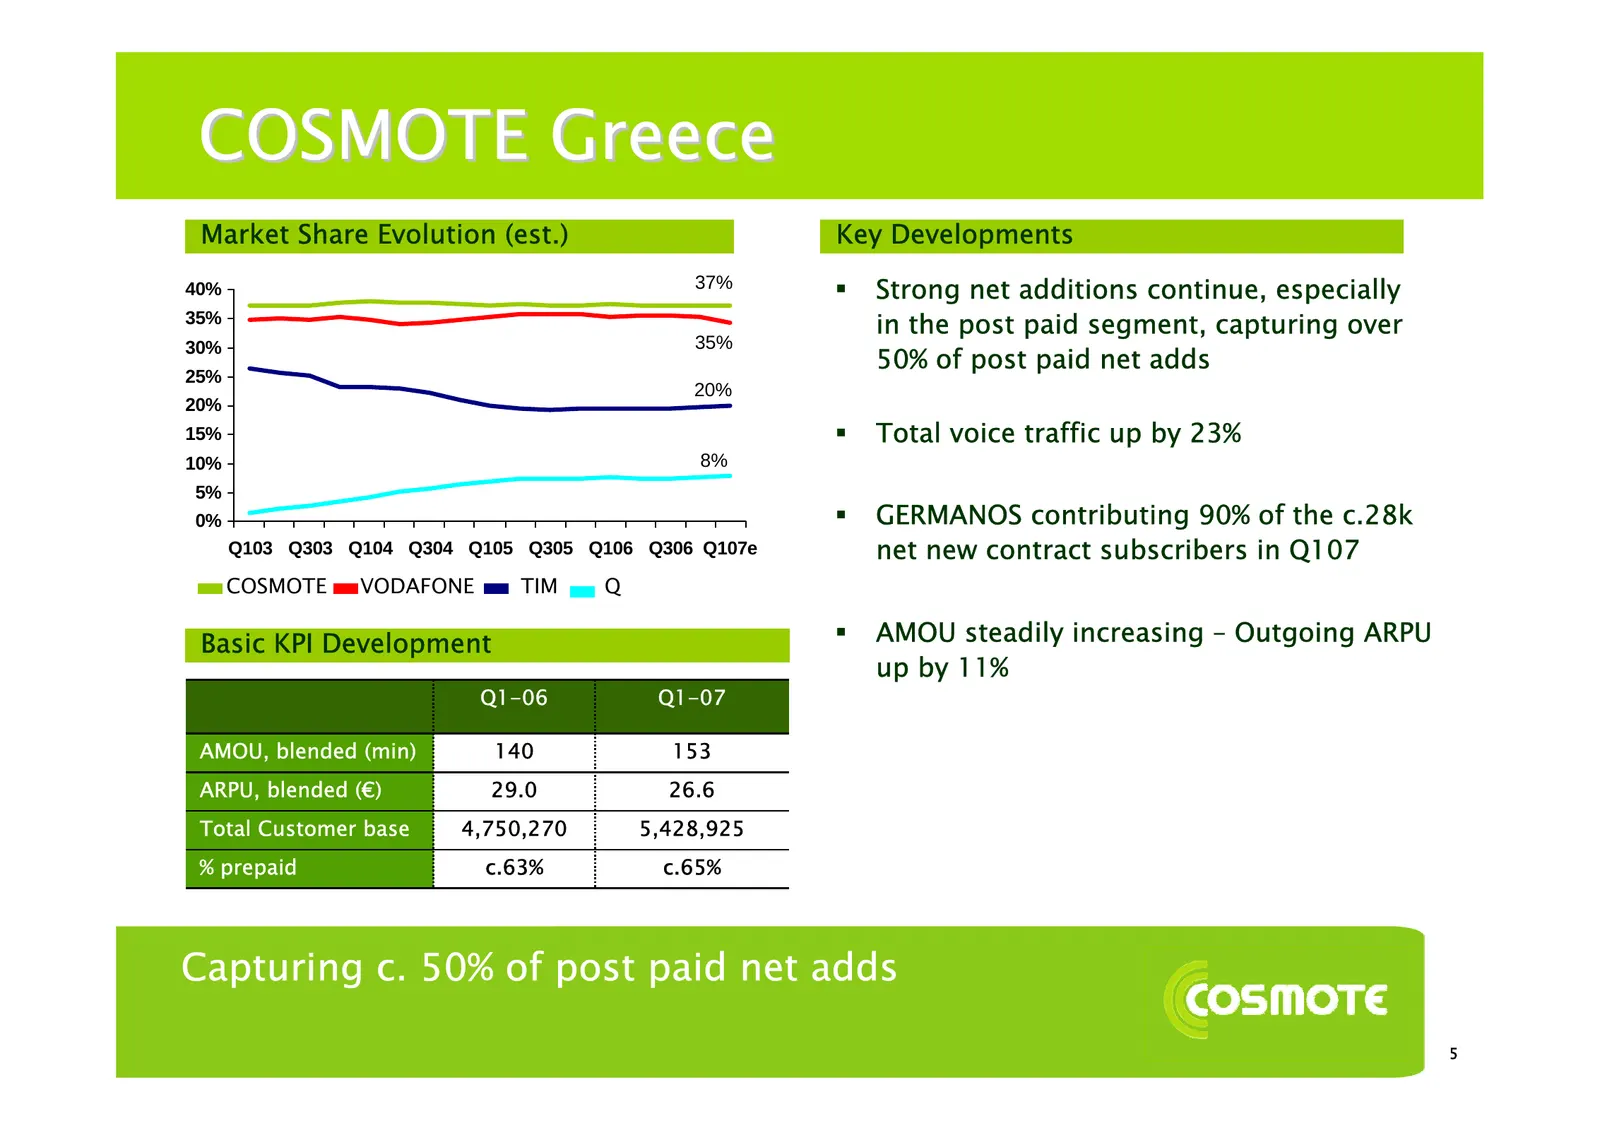
COSMOTE Greece Market Share Evolution (est.) Key Developments 40% 37% Strong net additions continue, especially 35% in the post paid segment, capturing over 35% 50% of post paid net adds 30% 25% 20% 20% 15% Total voice traffic up by 23% 10% 8% 5% 0% GERMANOS contributing 90% of the c.28k Q103
Slide 8: COSMOTE Greece
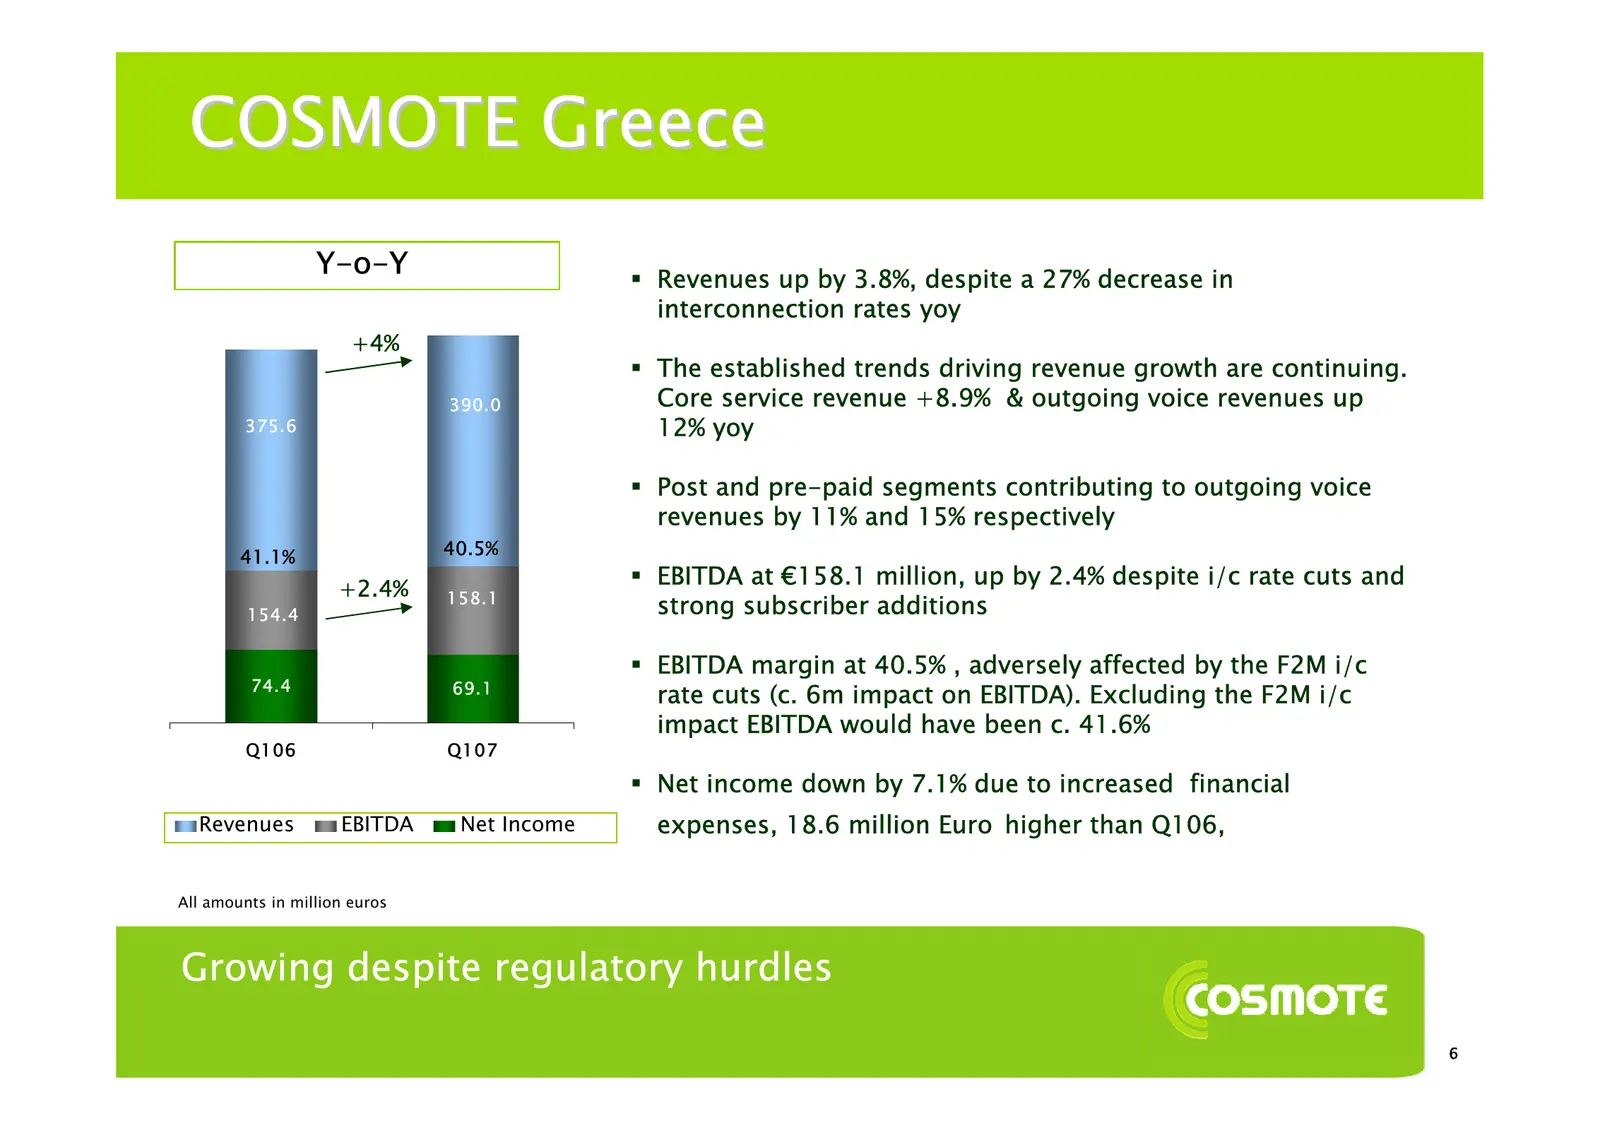
COSMOTE Greece Y-o-Y Revenues up by 3.8%, despite a 27% decrease in interconnection rates yoy +4% The established trends driving revenue growth are continuing. 390.0 Core service revenue +8.9% & outgoing voice revenues up 375.6 12% yoy Post and pre-paid segments contributing to outgoing voice
Slide 9: COSMOTE Greece: Regulatory impact
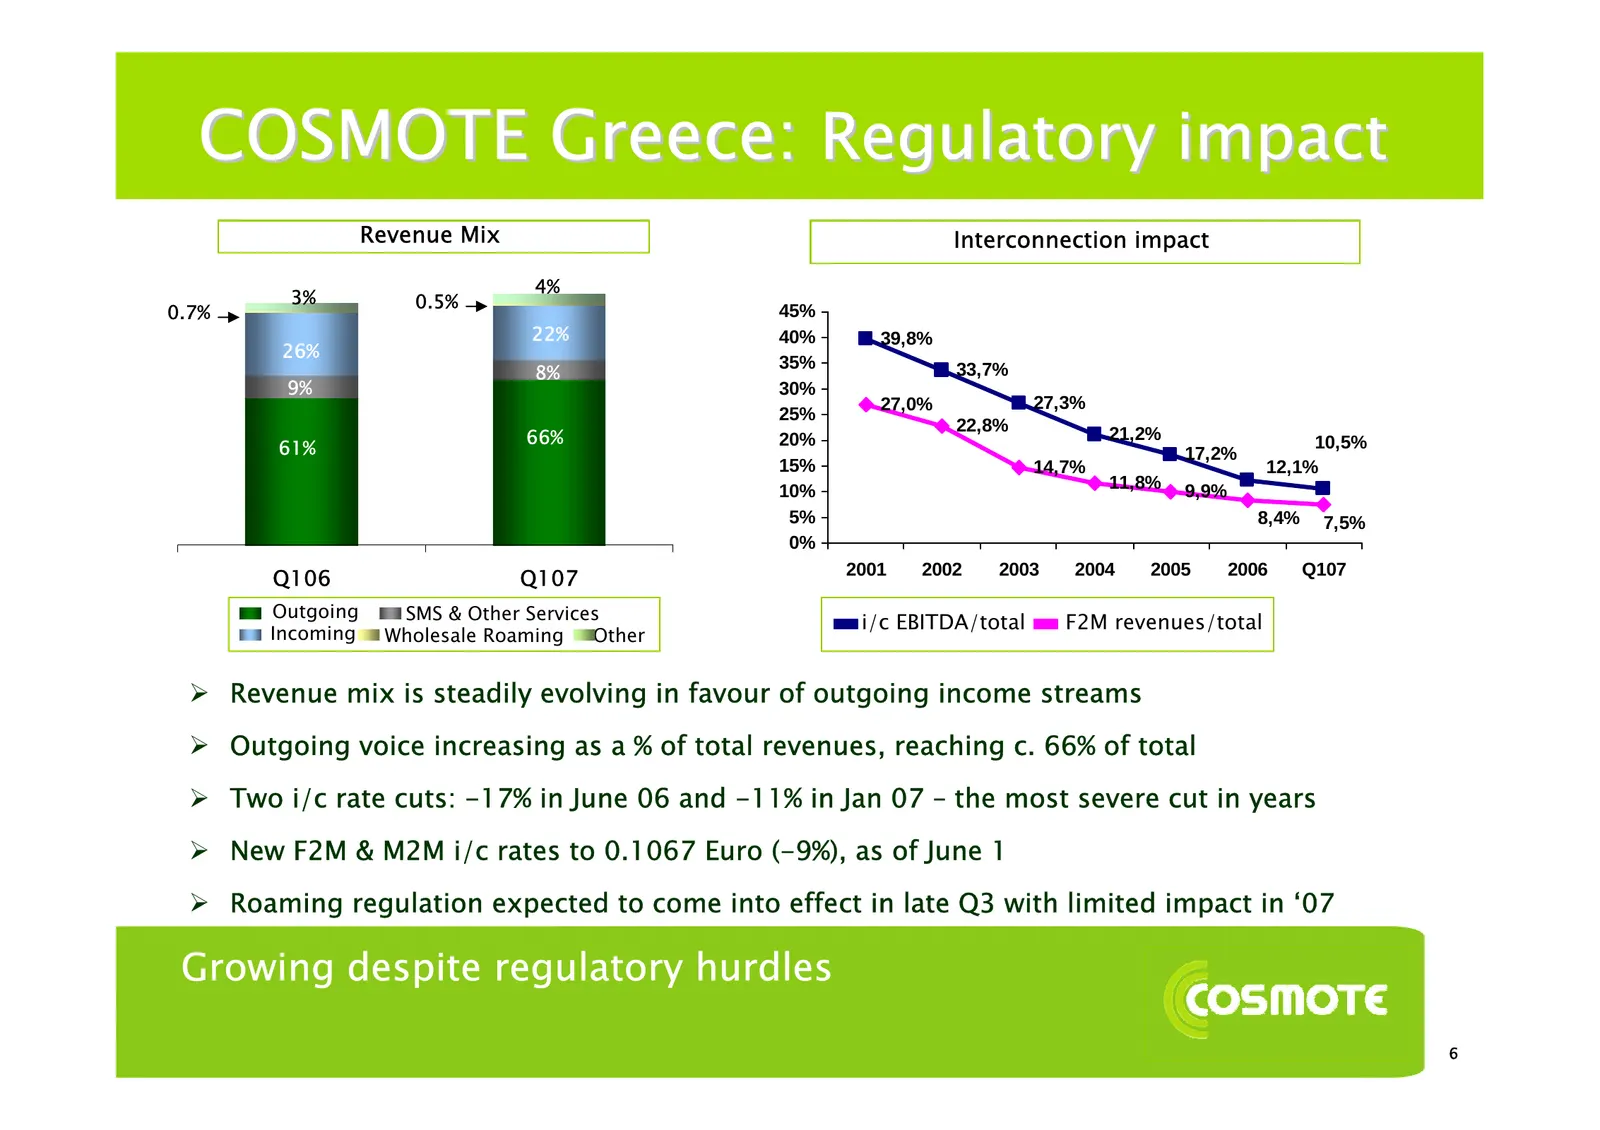
COSMOTE Greece: Regulatory impact Revenue Mix Interconnection impact 4% 3% 0.5% 0.7% 45% 22% 40% 39,8% 26% 35% 8% 33,7% 9% 30% 27,0% 27,3% 25% 22,8% 66% 20% 21,2% 61% 17,2% 10,5% 15% 14,7% 12,1% 10% 11,8% 9,9% 5% 8,4% 7,5% 0% Q106 Q107 2001 2002 2003 2004 2005 2006 Q107 Outgoing SMS & Other Services
Slide 10: AMC (Albania)
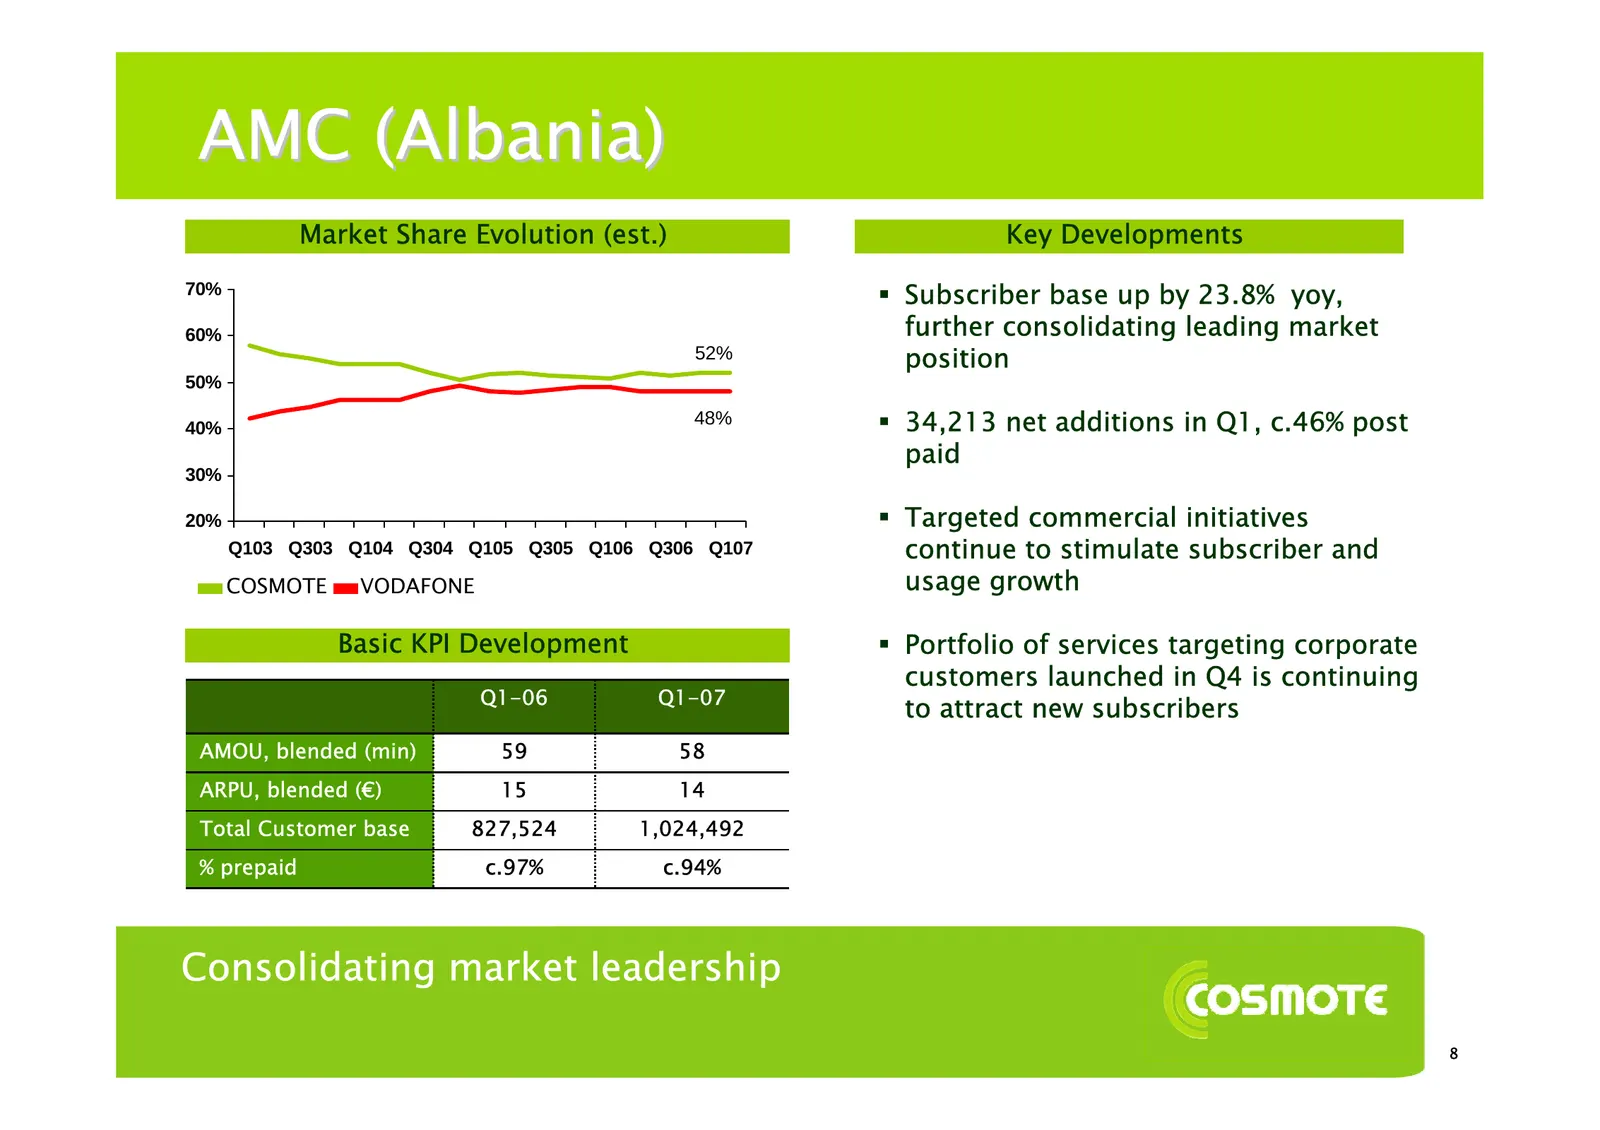
AMC (Albania) Market Share Evolution (est.) Key Developments 70% Subscriber base up by 23.8% yoy, 60% further consolidating leading market 52% position 50% 40% 48% 34,213 net additions in Q1, c.46% post paid 30% 20% Targeted commercial initiatives Q103 Q303 Q104 Q304 Q105 Q305 Q106 Q306 Q107 c
Slide 11: AMC
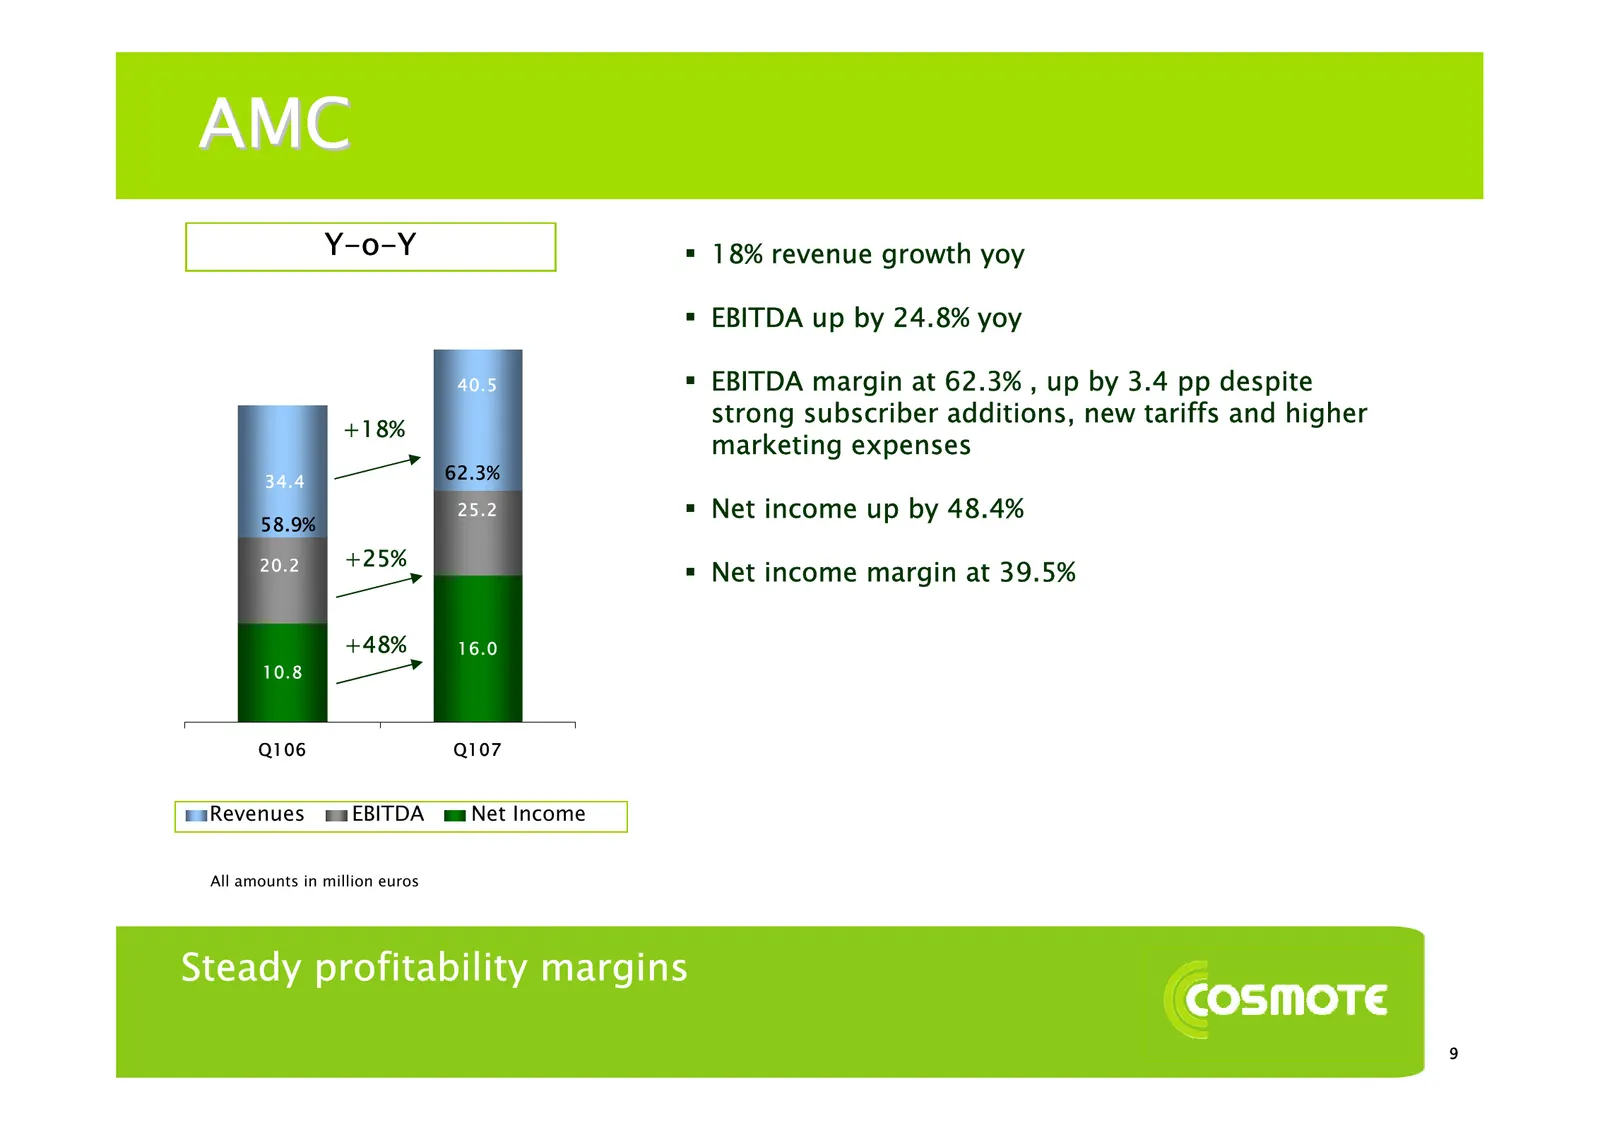
AMC Y-o-Y 18% revenue growth yoy EBITDA up by 24.8% yoy 40.5 EBITDA margin at 62.3% , up by 3.4 pp despite strong subscriber additions, new tariffs and higher +18% marketing expenses 34.4 62.3% 25.2 Net income up by 48.4% 58.9% +25% 20.2 Net income margin at 39.5% +48% 16.0 10.8 Q106 Q107
Slide 12: GLOBUL (Bulgaria)
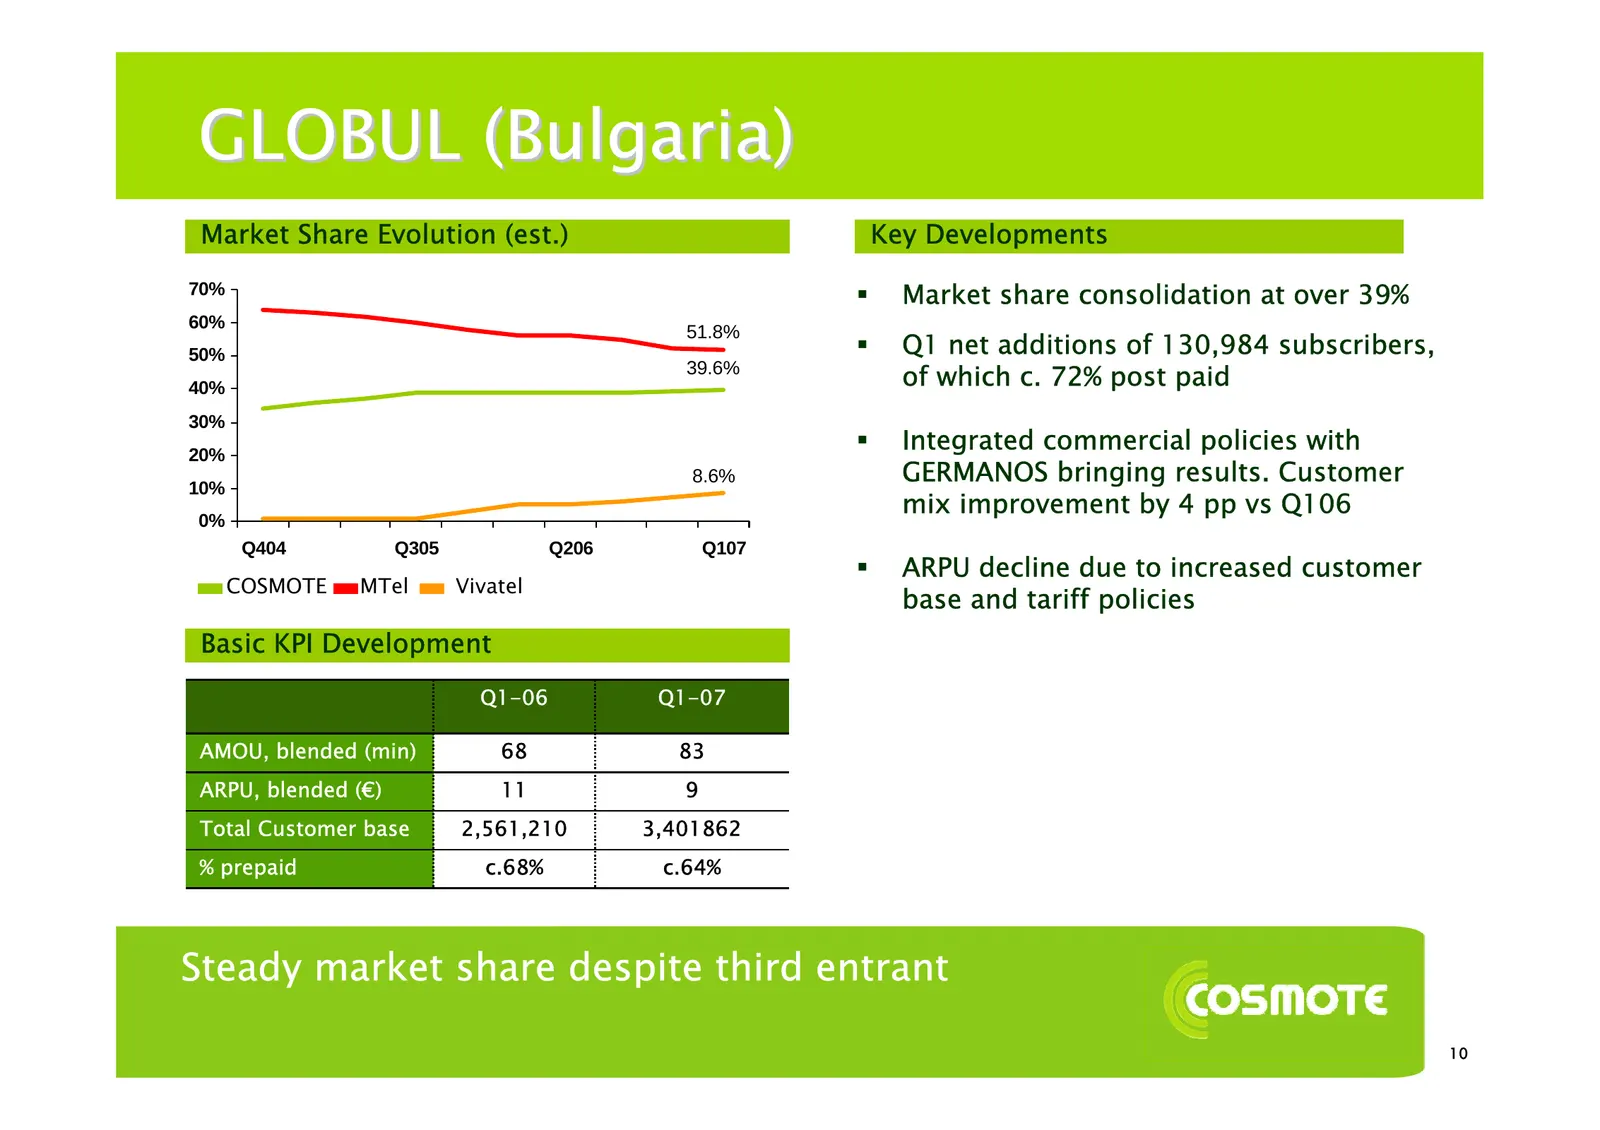
GLOBUL (Bulgaria) Market Share Evolution (est.) Key Developments 70% Market share consolidation at over 39% 60% 51.8% 50% Q1 net additions of 130,984 subscribers, 40% 39.6% of which c. 72% post paid 30% 20% Integrated commercial policies with 10% 8.6% GERMANOS bringing results. Customer mix im
Slide 13: GLOBUL
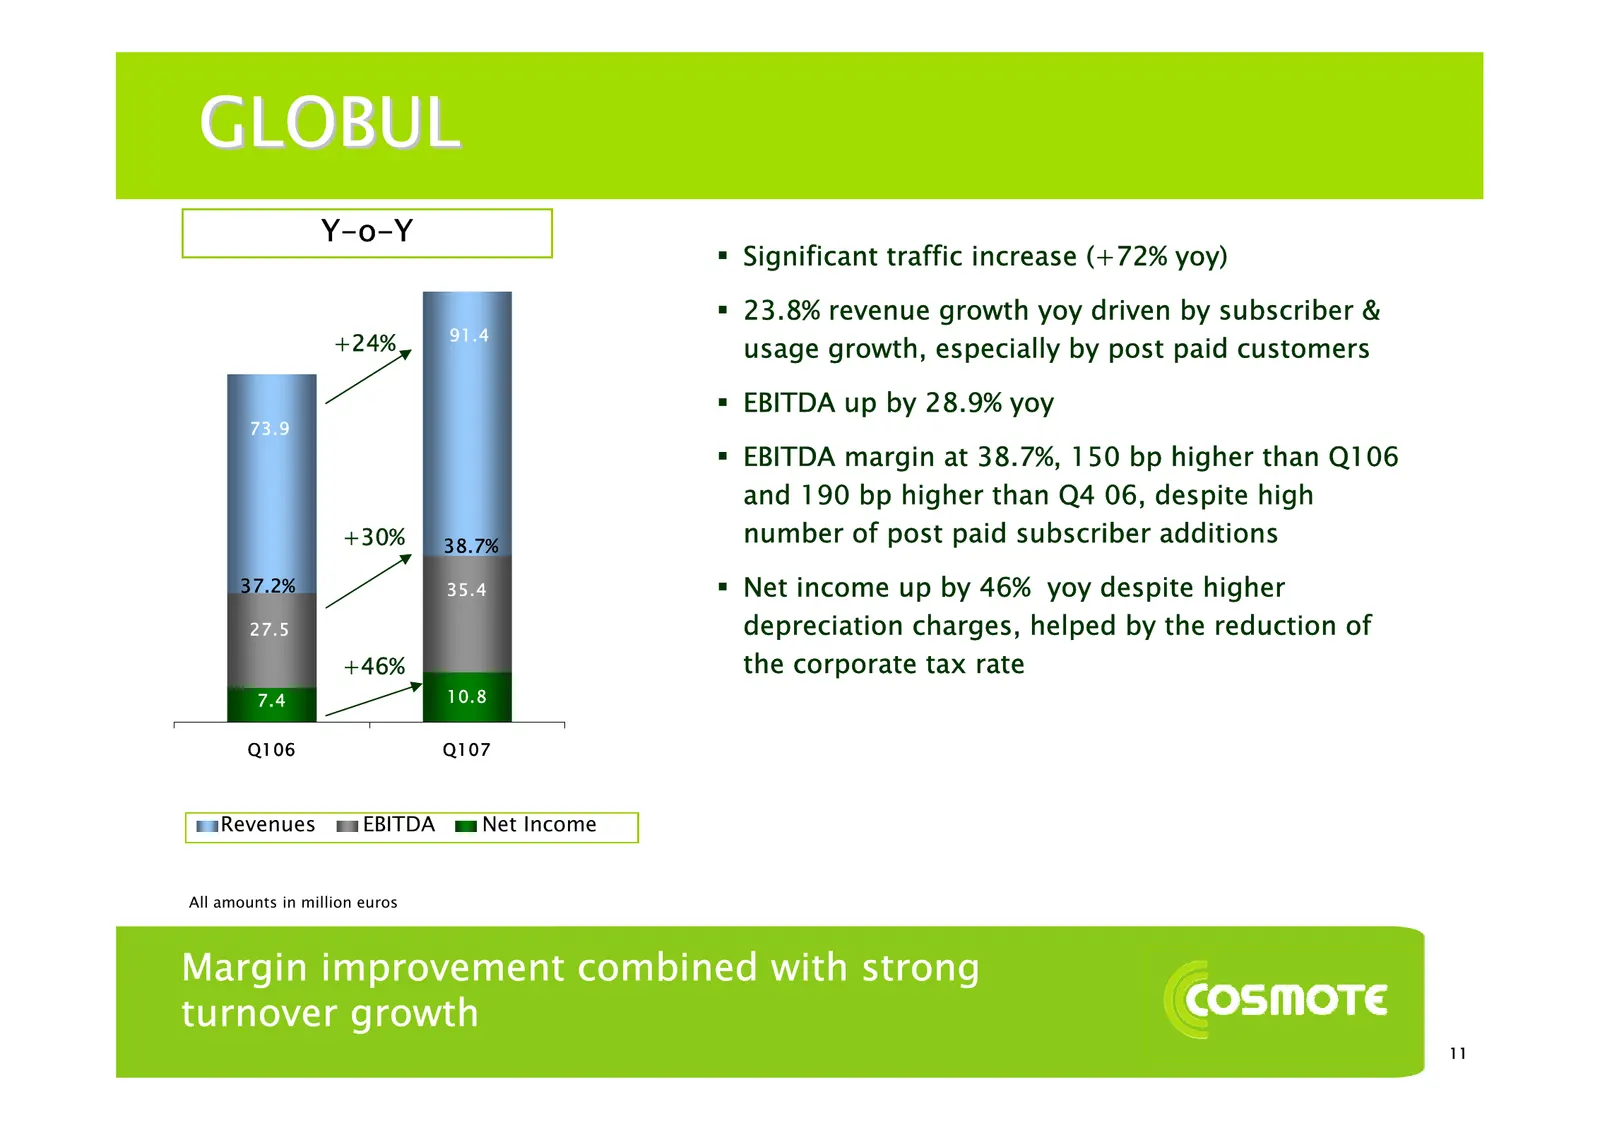
GLOBUL Y-o-Y Significant traffic increase (+72% yoy) 23.8% revenue growth yoy driven by subscriber & 91.4 +24% usage growth, especially by post paid customers EBITDA up by 28.9% yoy 73.9 EBITDA margin at 38.7%, 150 bp higher than Q106 and 190 bp higher than Q4 06, despite high +30% 38.7% num
Slide 14: COSMOFON (FYROM)
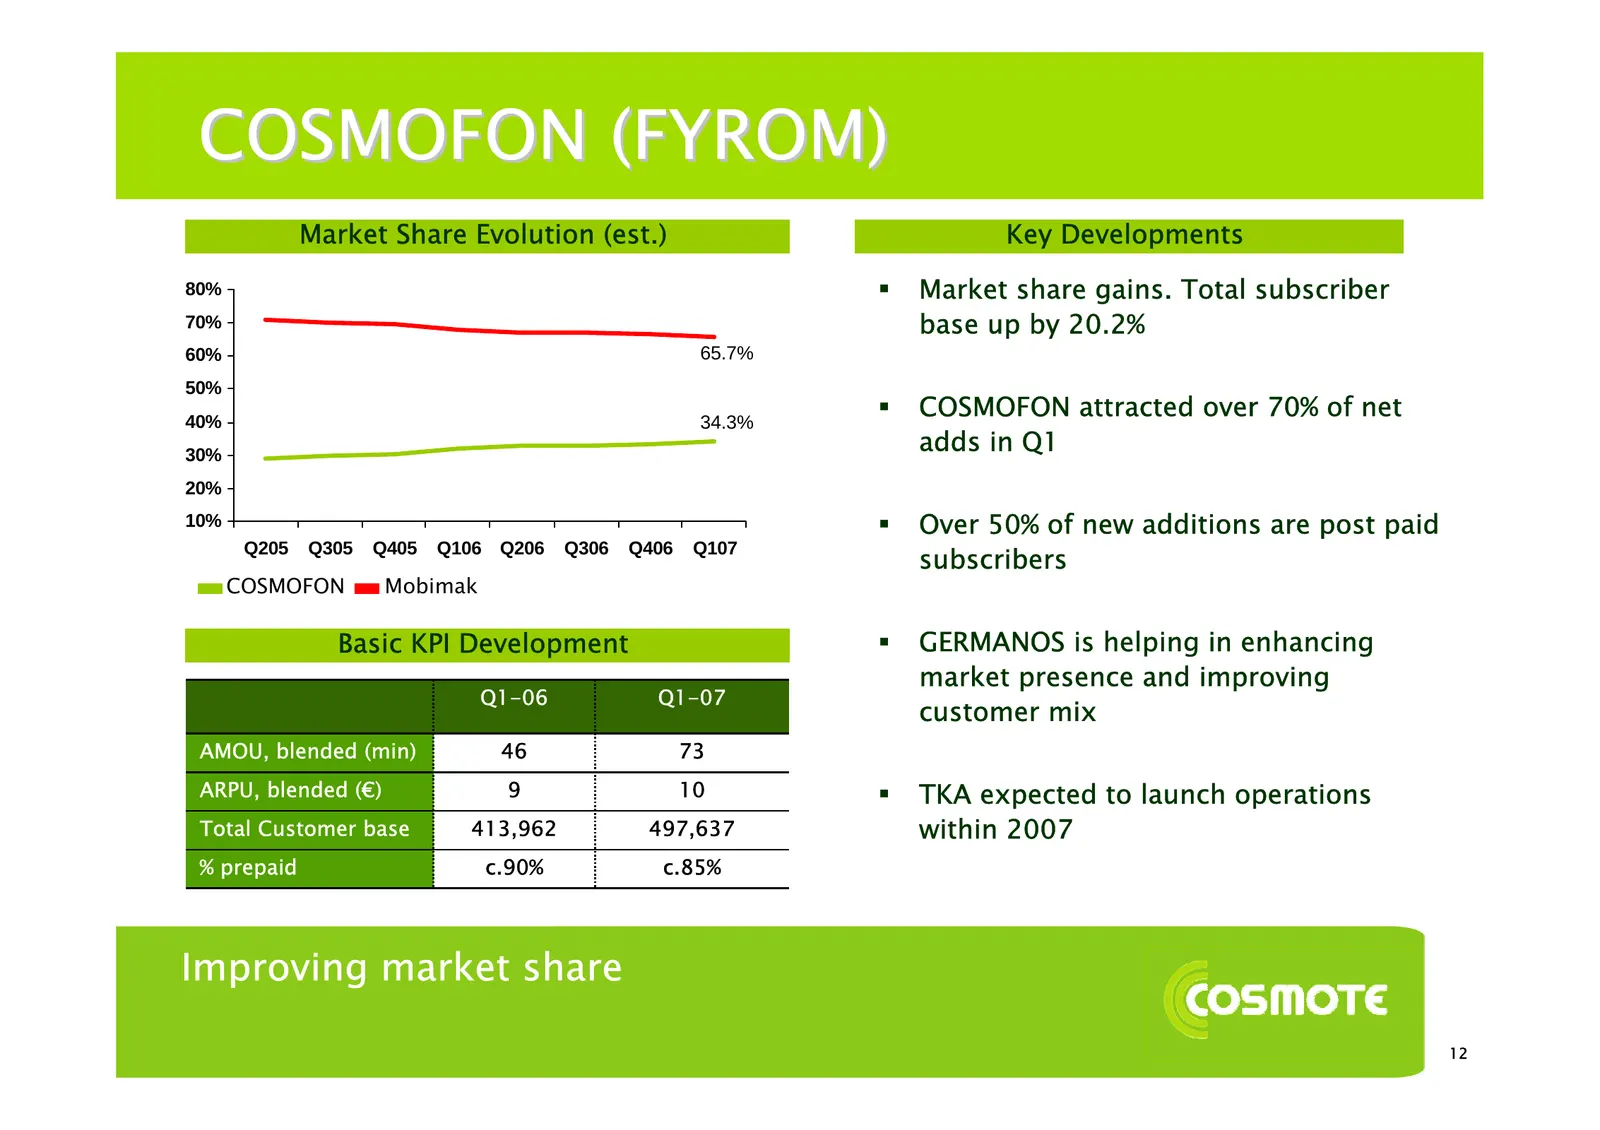
COSMOFON (FYROM) Market Share Evolution (est.) Key Developments 80% Market share gains. Total subscriber 70% base up by 20.2% 60% 65.7% 50% 40% 34.3% COSMOFON attracted over 70% of net 30% adds in Q1 20% 10% Over 50% of new additions are post paid subscribers Q205 Q305 Q405 Q106 Q206 Q306 Q406
Slide 15: COSMOFON
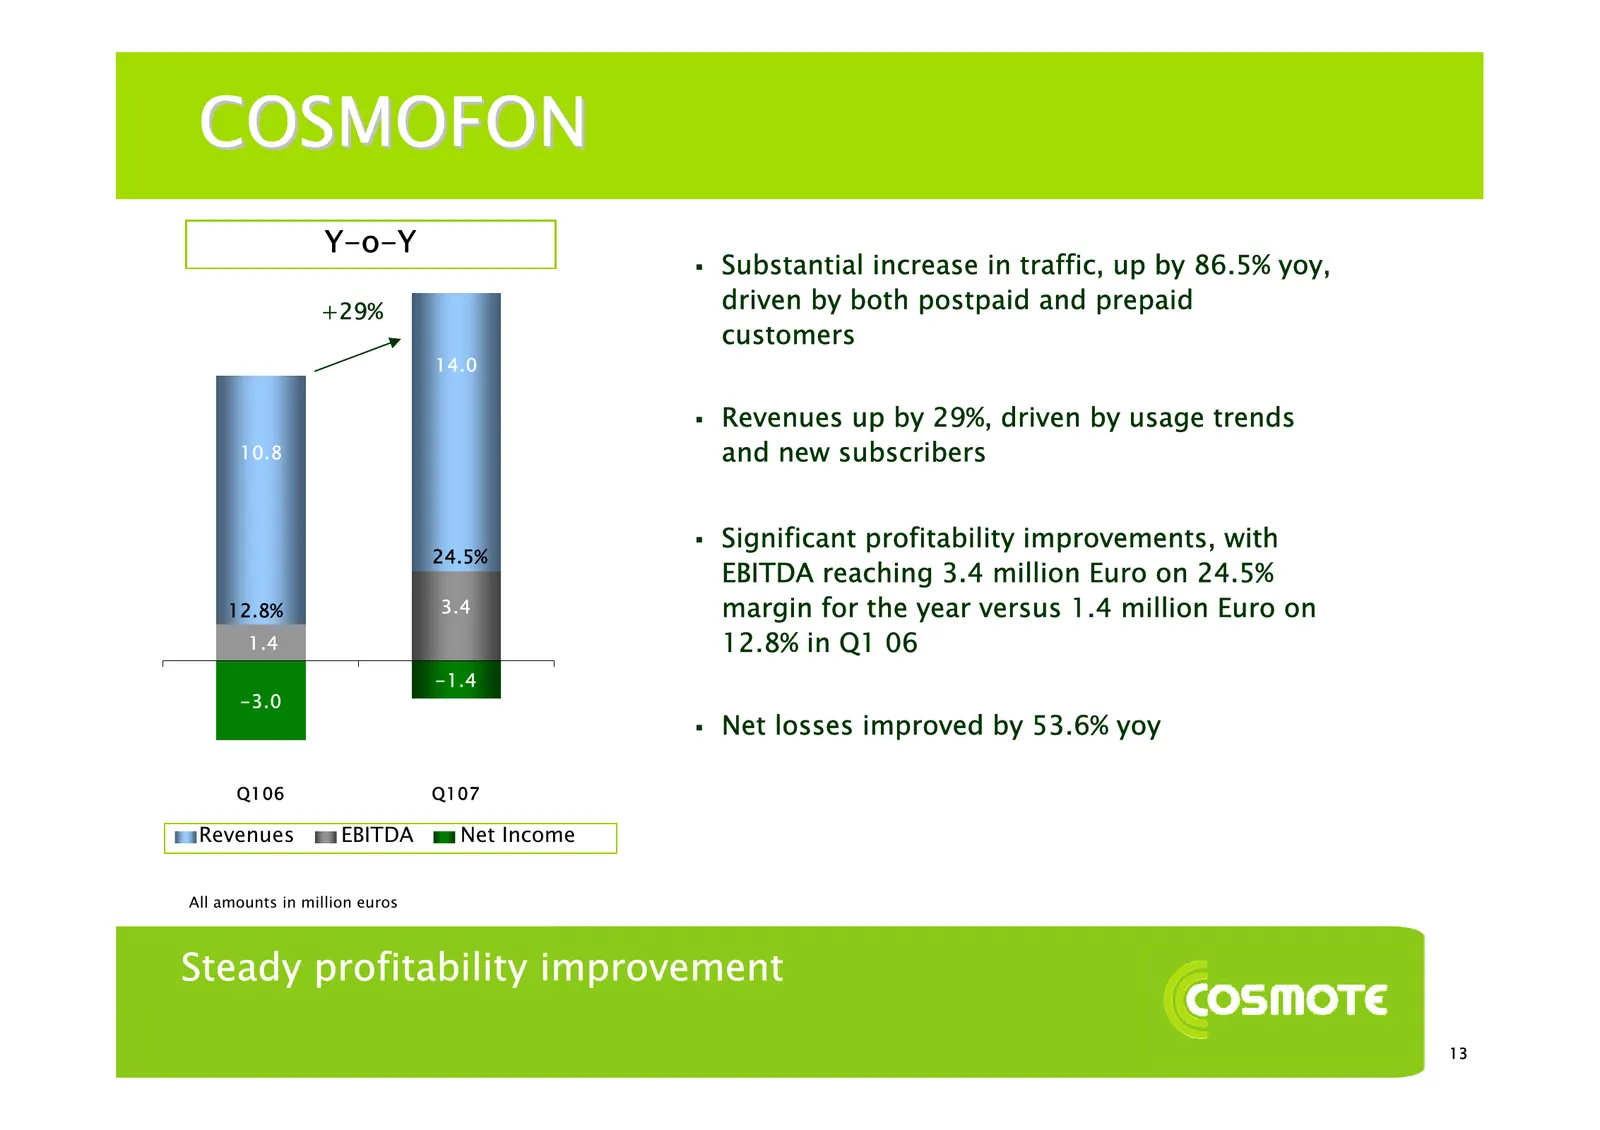
COSMOFON Y-o-Y Substantial increase in traffic, up by 86.5% yoy, +29% driven by both postpaid and prepaid customers 14.0 Revenues up by 29%, driven by usage trends 10.8 and new subscribers Significant profitability improvements, with 24.5% EBITDA reaching 3.4 million Euro on 24.5% 12.8% 3.4 ma
Slide 16: COSMOTE Romania
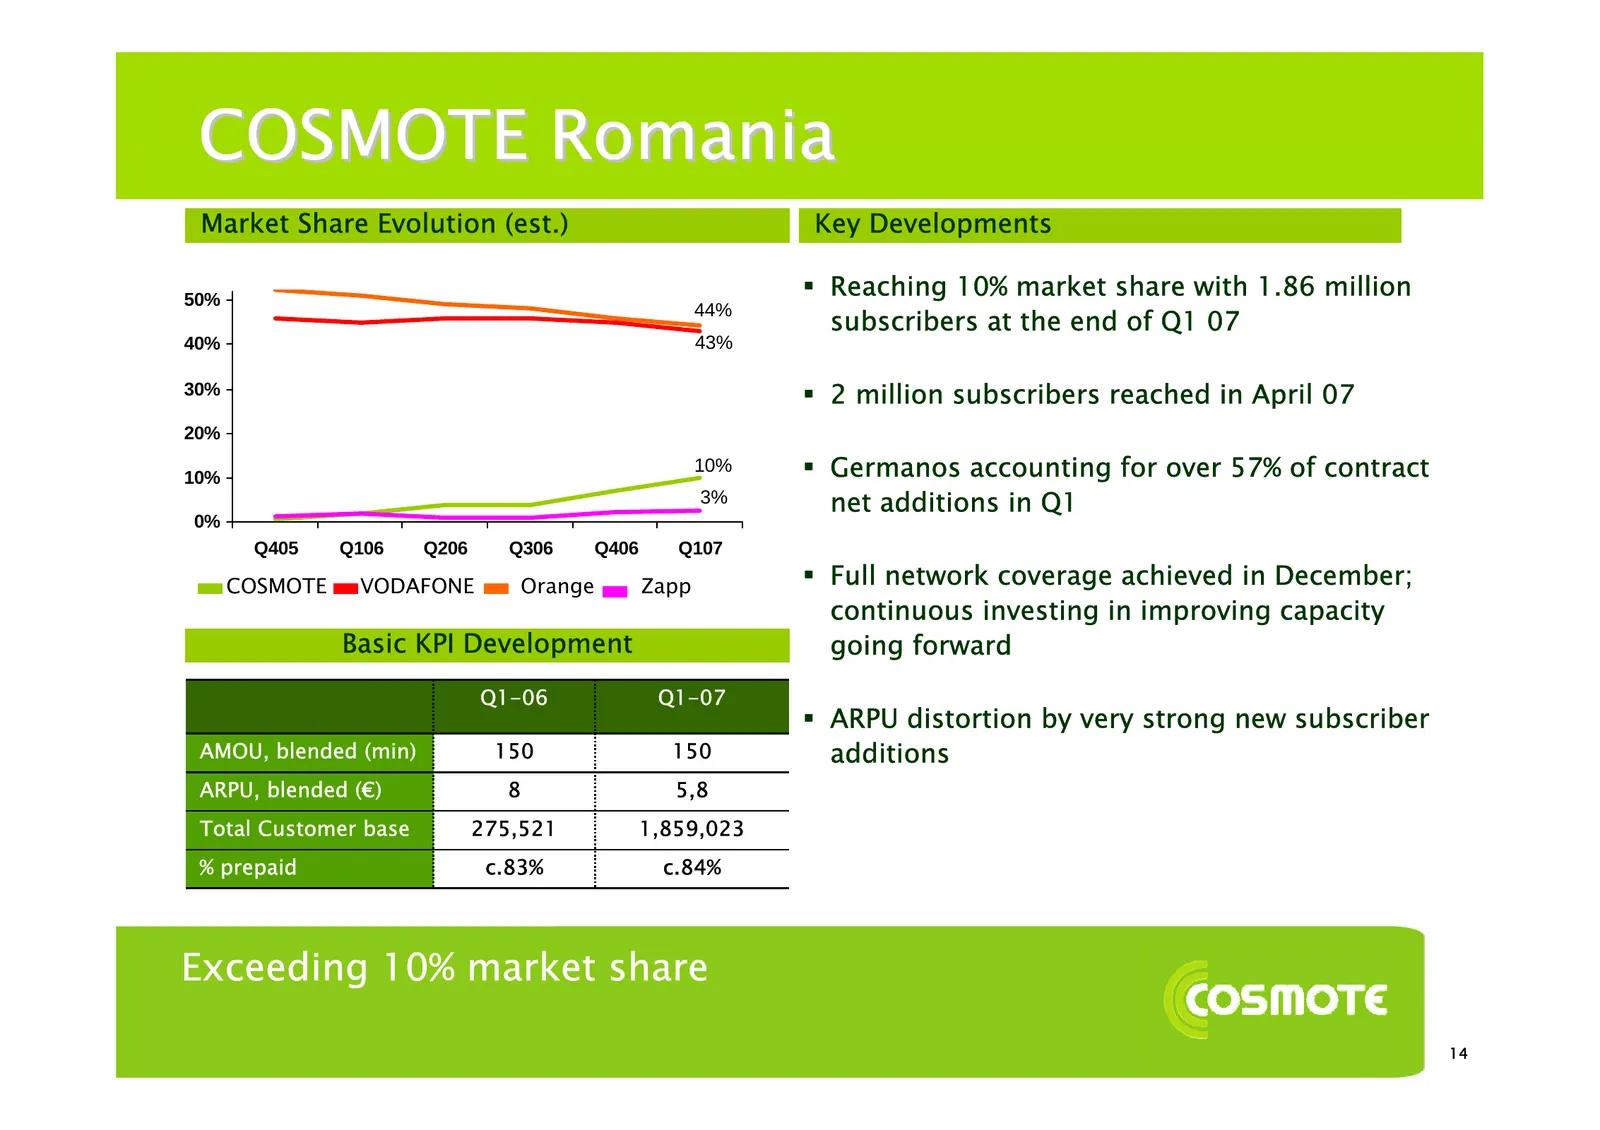
COSMOTE Romania Market Share Evolution (est.) Key Developments 50% Reaching 10% market share with 1.86 million subscribers at the end of Q1 07 44% 40% 43% 30% 2 million subscribers reached in April 07 20% 10% 10% Germanos accounting for over 57% of contract 3% net additions in Q1 0% Q405 Q106
Slide 17: COSMOTE Romania
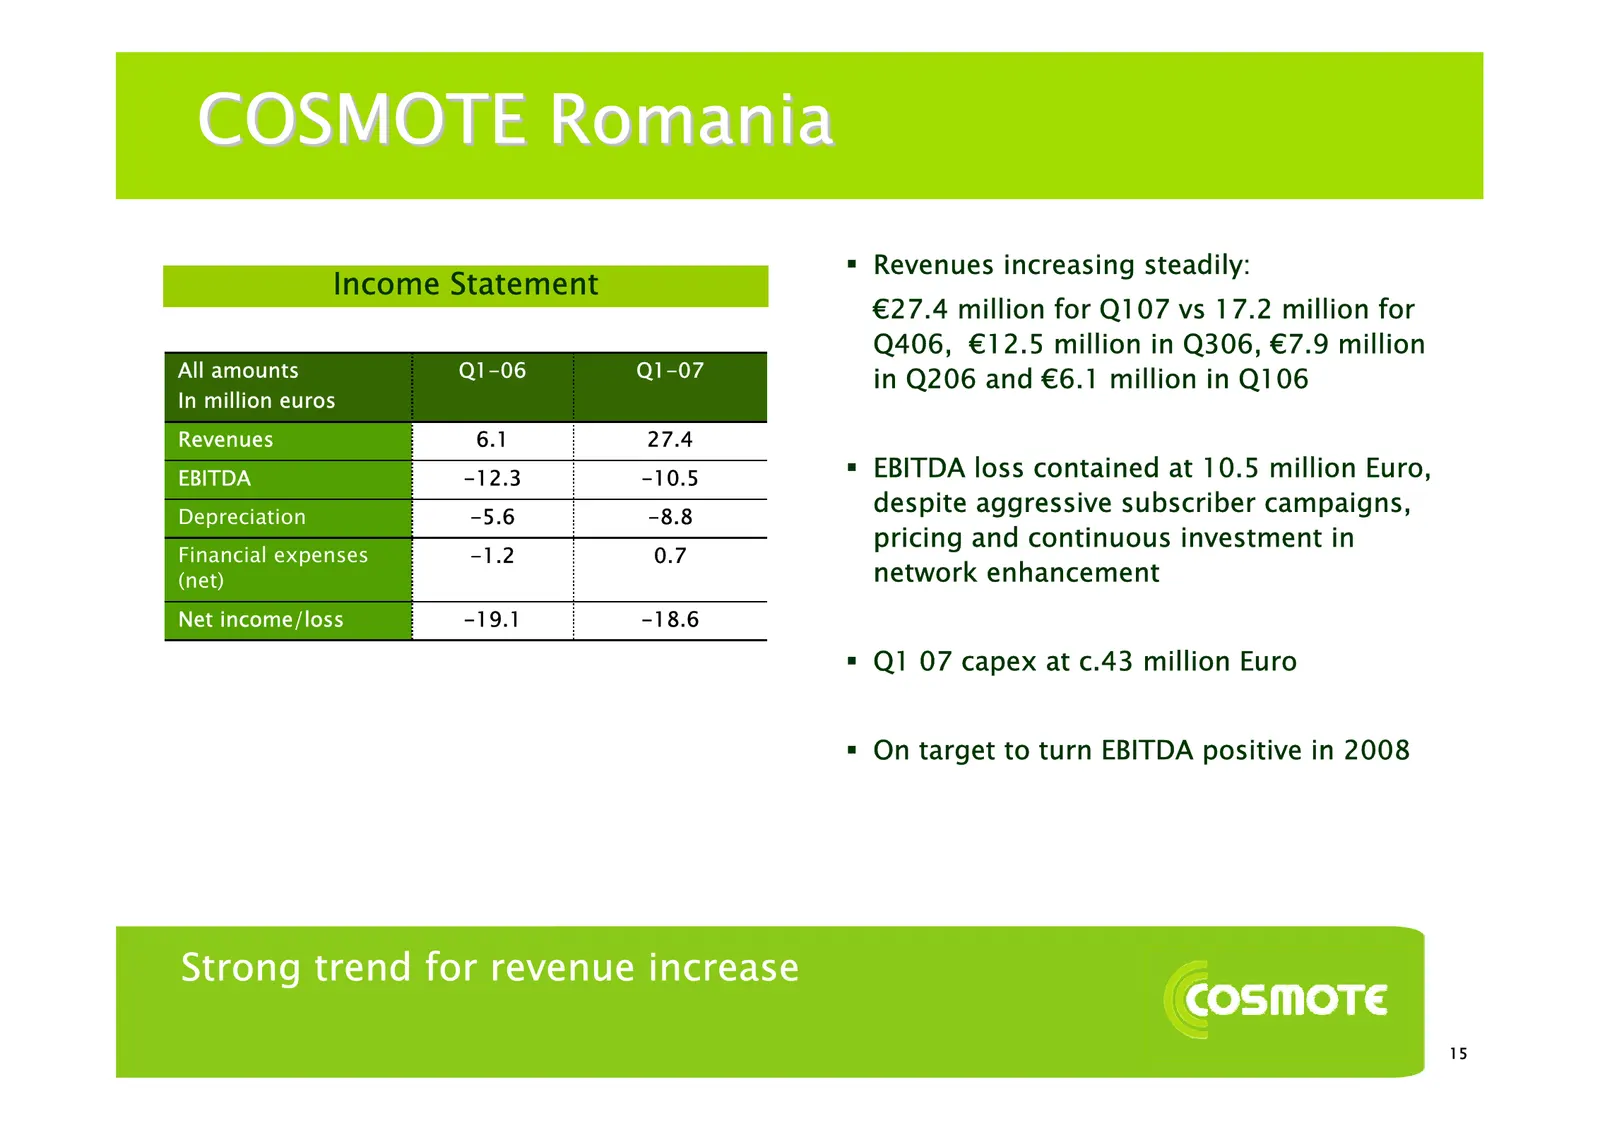
COSMOTE Romania Revenues increasing steadily: Income Statement €27.4 million for Q107 vs 17.2 million for Q406, €12.5 million in Q306, €7.9 million All amounts Q1-06 Q1-07 in Q206 and €6.1 million in Q106 In million euros Revenues 6.1 27.4 EBITDA -12.3 -10.5 EBITDA loss contained at 10.5 million
Slide 18: GERMANOS
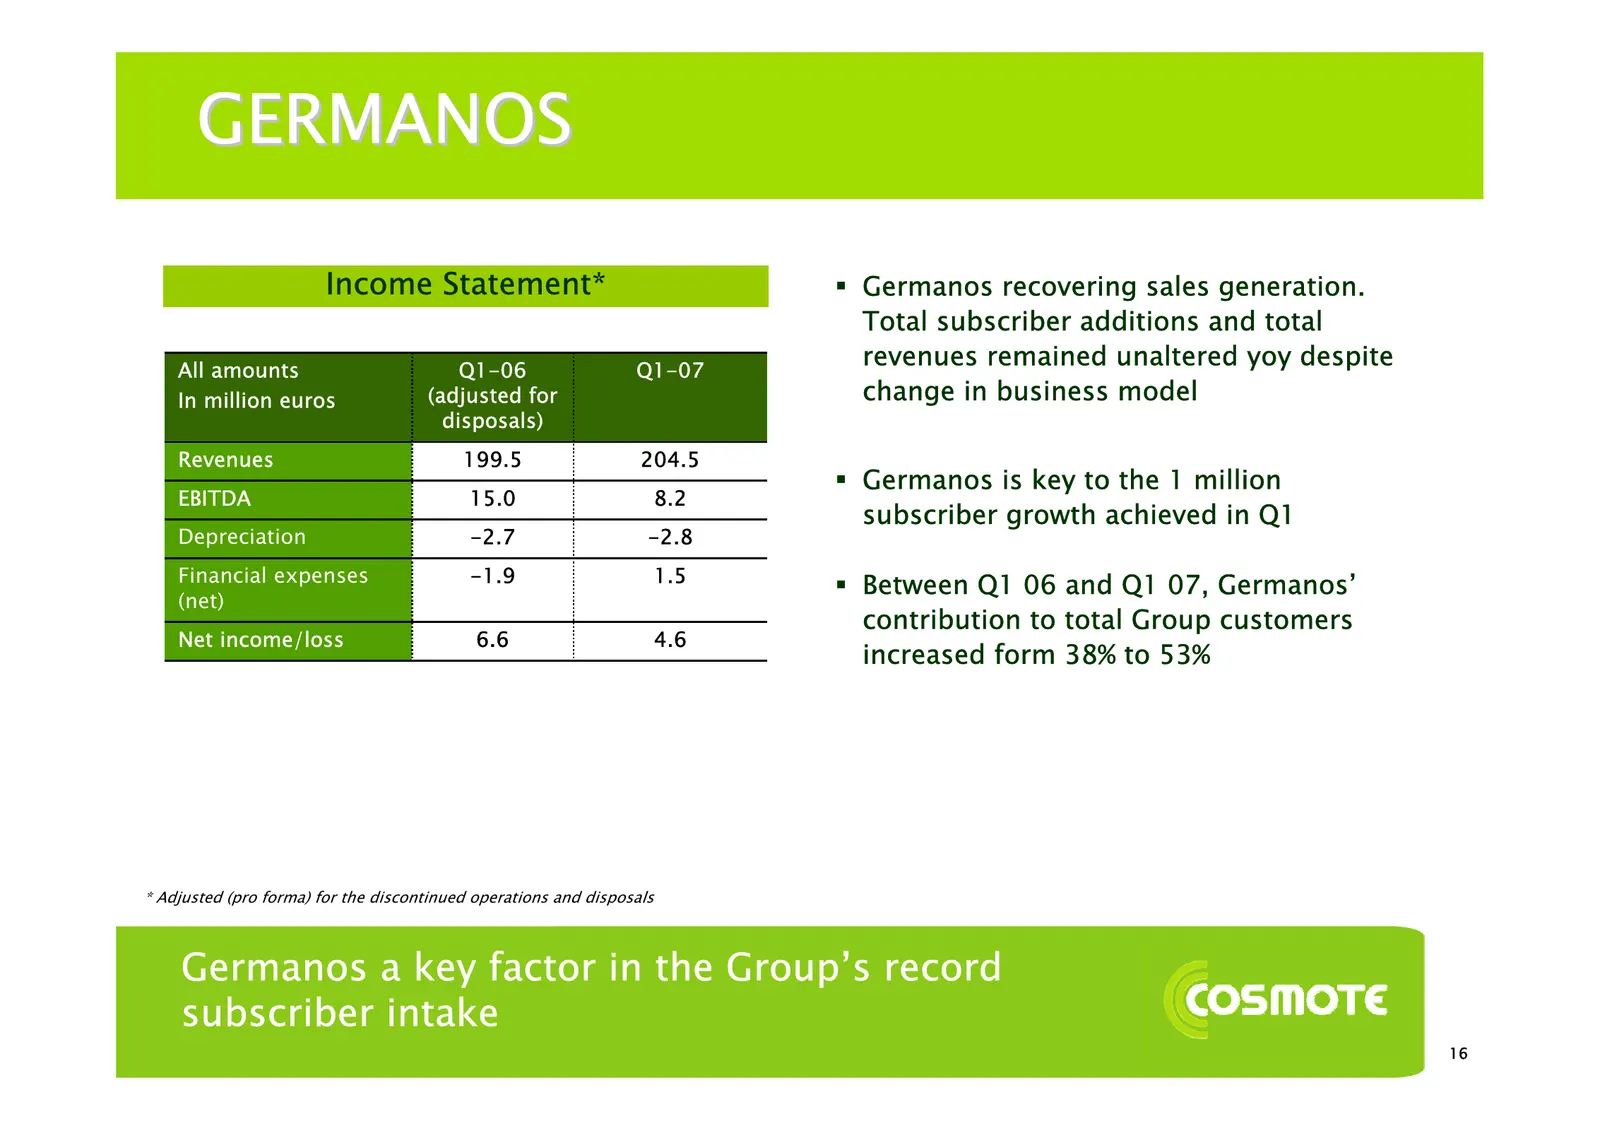
GERMANOS Income Statement* Germanos recovering sales generation. Total subscriber additions and total All amounts Q1-06 Q1-07 revenues remained unaltered yoy despite In million euros (adjusted for change in business model disposals) Revenues 199.5 204.5 Germanos is key to the 1 million EBITDA 15
Slide 19: Group Outlook
Group Outlook COSMOTE
Slide 20: Group Outlook
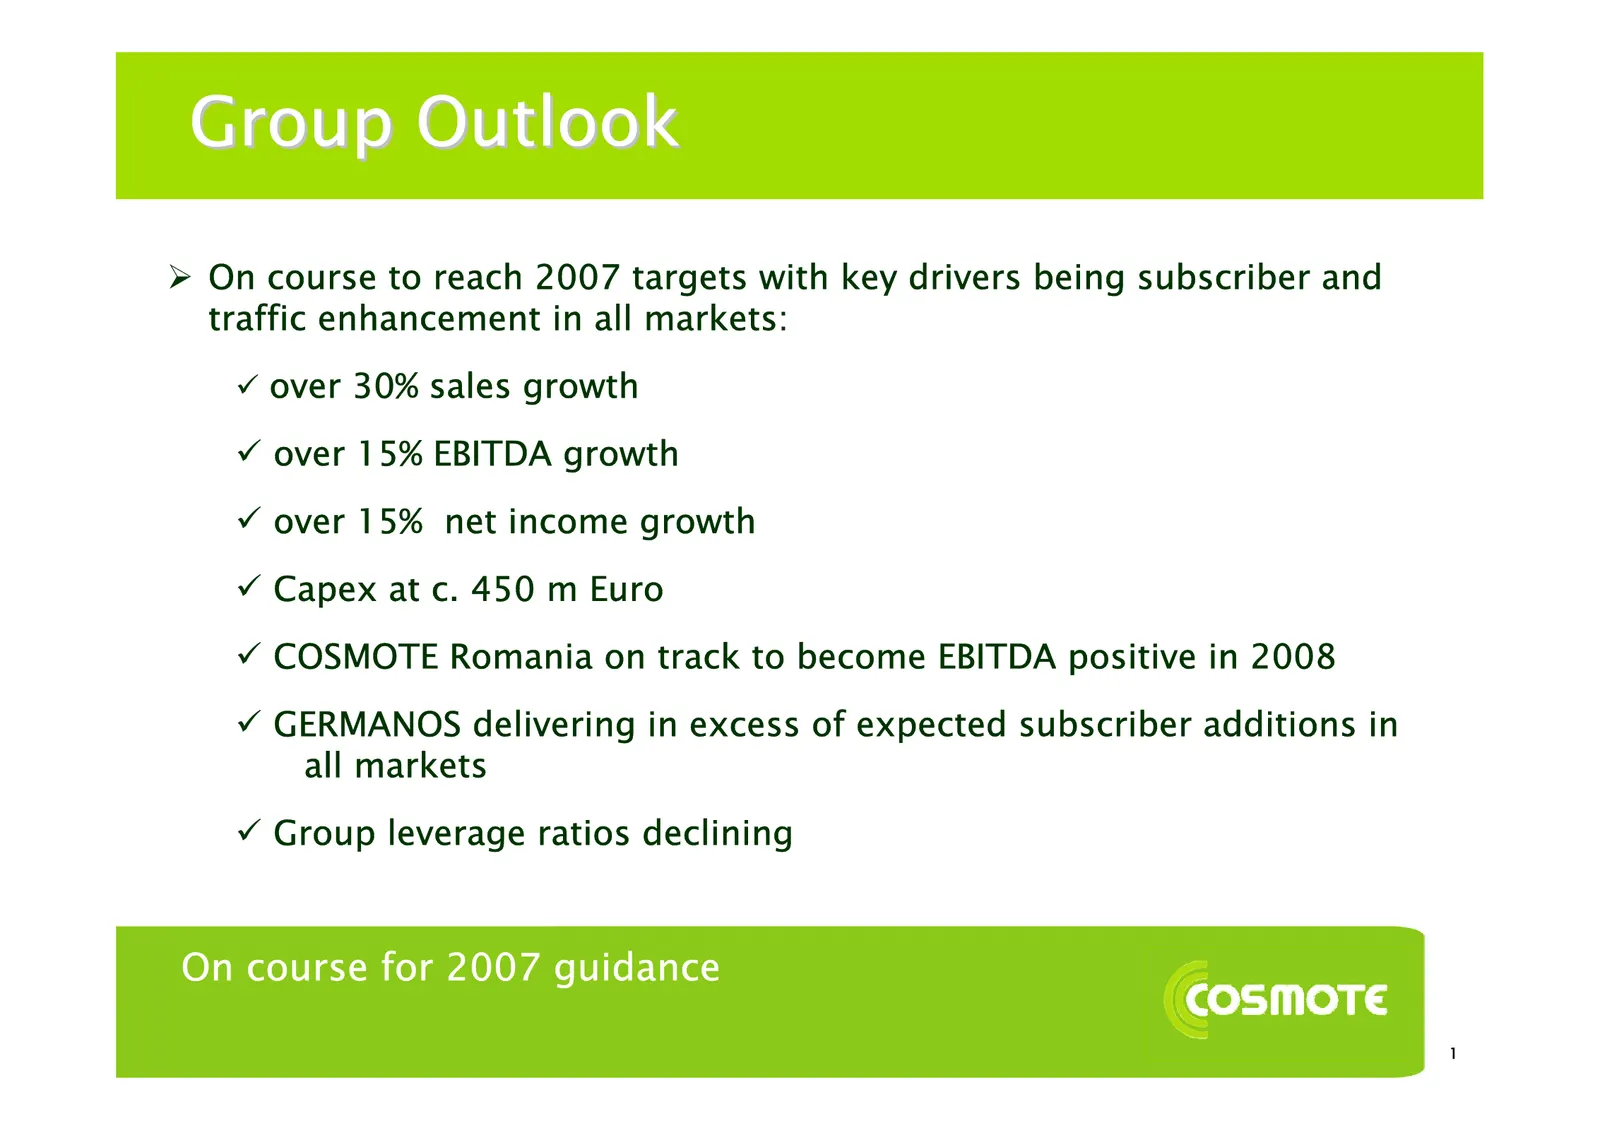
Group Outlook ¾ On course to reach 2007 targets with key drivers being subscriber and traffic enhancement in all markets: 9 over 30% sales growth 9 over 15% EBITDA growth 9 over 15% net income growth 9 Capex at c. 450 m Euro 9 COSMOTE Romania on track to become EBITDA positive in 2008 9 GERMANOS del
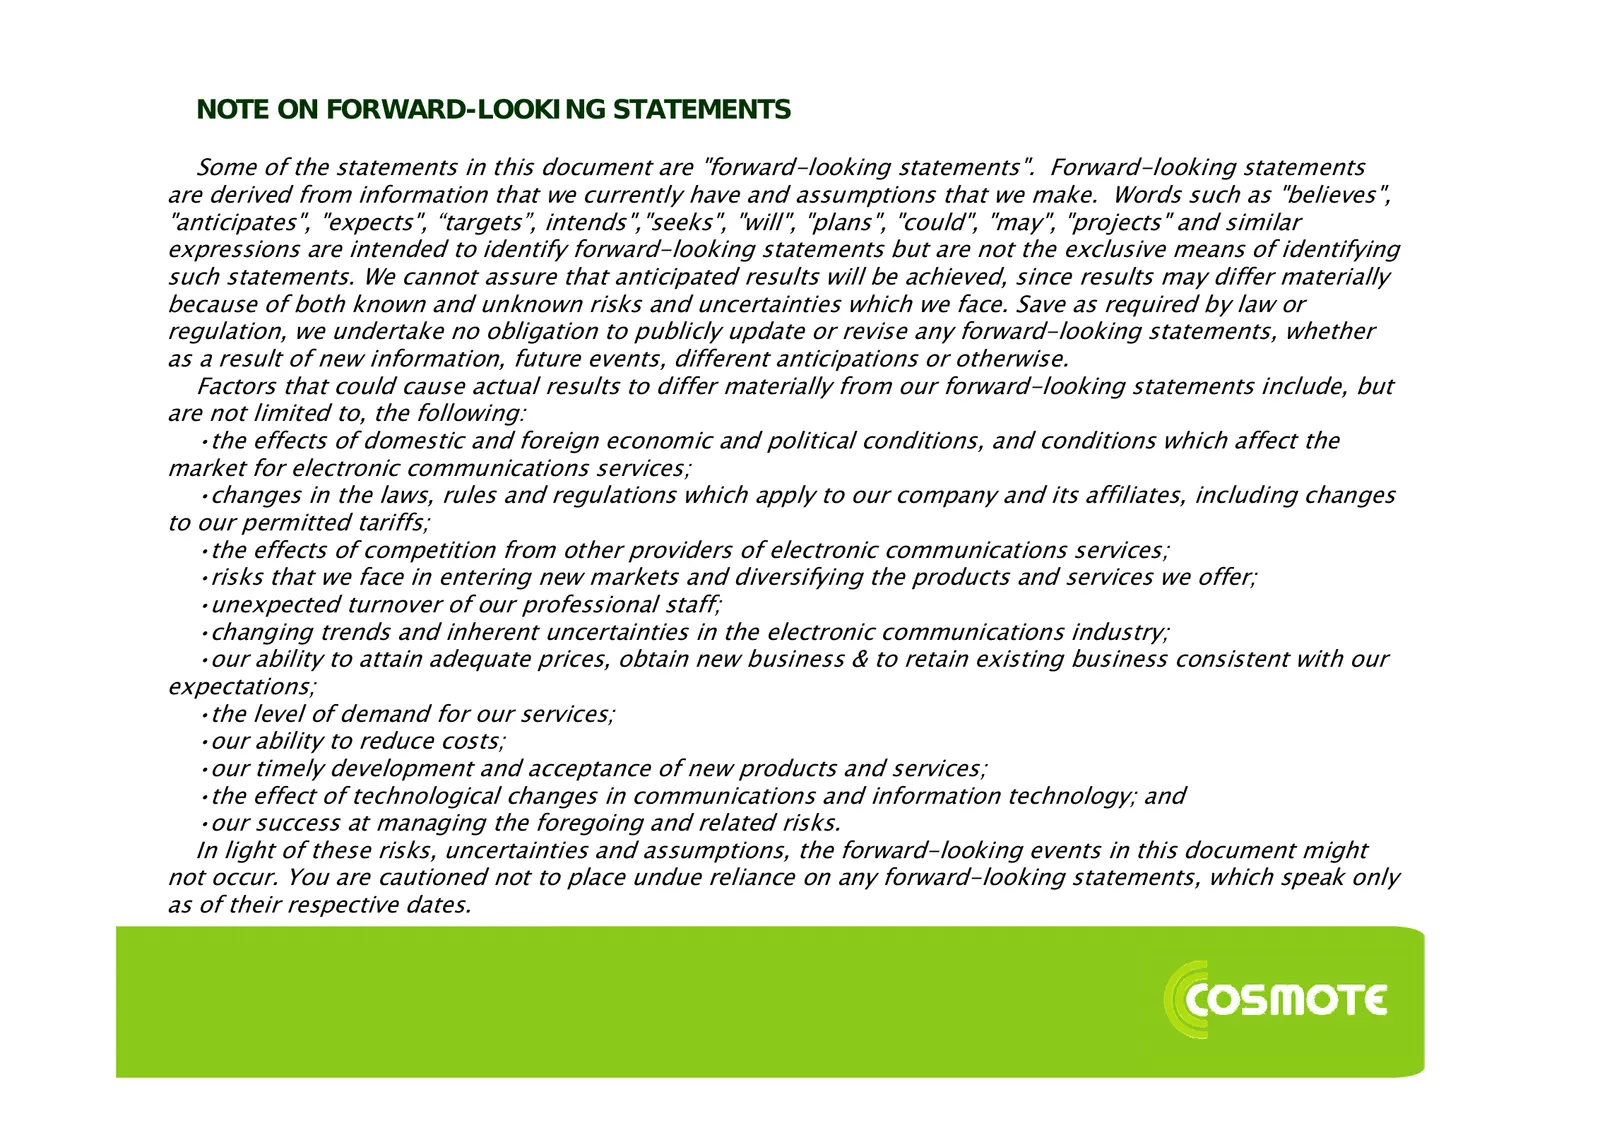
Slide 21: Note on Forward-Looking Statements
NOTE ON FORWARD-LOOKING STATEMENTS Some of the statements in this document are "forward-looking statements". Forward-looking statements are derived from information that we currently have and assumptions that we make. Words such as "believes", "anticipates", "expects", “targets”, intends","seeks", "
Source: Internet Archive copy of cosmote.gr
More decks from Hellenic Telecommunications Organization SA
 OTE Group — Q2 2026 Earnings Presentation25 slides · July 2026
 OTE Group — Q1 2026 Earnings Presentation25 slides · May 2026
 Q4 2025 Earnings Presentation23 slides · Feb 26, 2026
 Q3 2025 Earnings Presentation23 slides · Nov 14, 2025
 Q2 2025 Earnings Presentation31 slides · Aug 6, 2025
 OTE Group — Q1 2025 Earnings Presentation31 slides · May 2025