PetroQuest Energy — Investor Presentation (December 2008)
42 slides from PetroQuest Energy's investor presentation, Dec 15, 2008
Slide 1: PetroQuest Energy, Inc.
\) PetroQuest Energy, Inc. December 2008 pe LNERGY:
Slide 2: Company Information
Company Information 400 East Kaliste Saloom Road, Suite 6000 Lafayette, Louisiana 70508 Phone: (337) 232-7028 Fax: (337) 232-0044 www.petroquest.com NYSE: PQ Corporate Contact: Matt Quantz - mquantz@petroquest.com This presentation contains "forward-looking statements" within the meaning of Section
Slide 3: Corporate Characteristics
Corporate Characteristics Historically, the Company has been successful in growing through the drill bit and strategic acquisitions 9-year(1) historical drilling success rate - 89% 9-year(1) F&D and Reserve Replacement - $3.18/Mcfe and 208% In 2003 began diversifying asset base into resource plays:
Slide 4: Proven Track Record of Drilling with Cash Flow
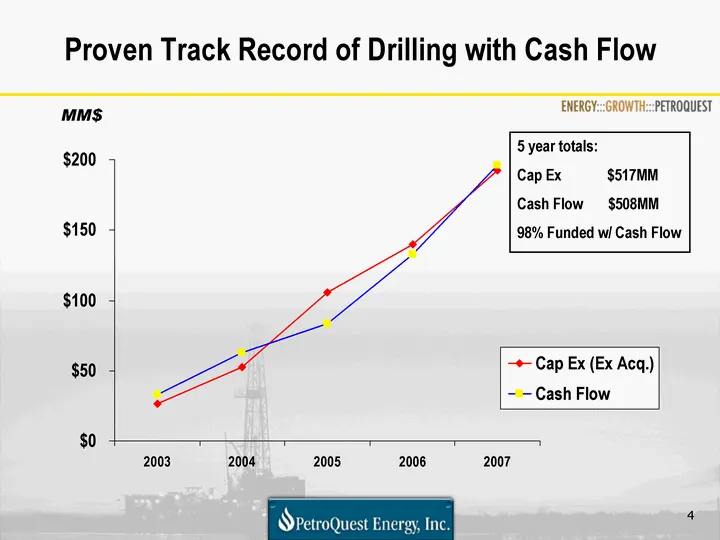
Proven Track Record of Drilling with Cash Flow 2003 2004 2005 2006 2007 Cap Ex (Ex Acq.) 26.8 52.5 105.8 139.6 192.5 Cash Flow 32.9 62.9 83.2 132.8 196.2 North MM$ 5 year totals: Cap Ex $517MM Cash Flow $508MM 98% Funded w/ Cash Flow
Slide 5: Nine Years of Growth
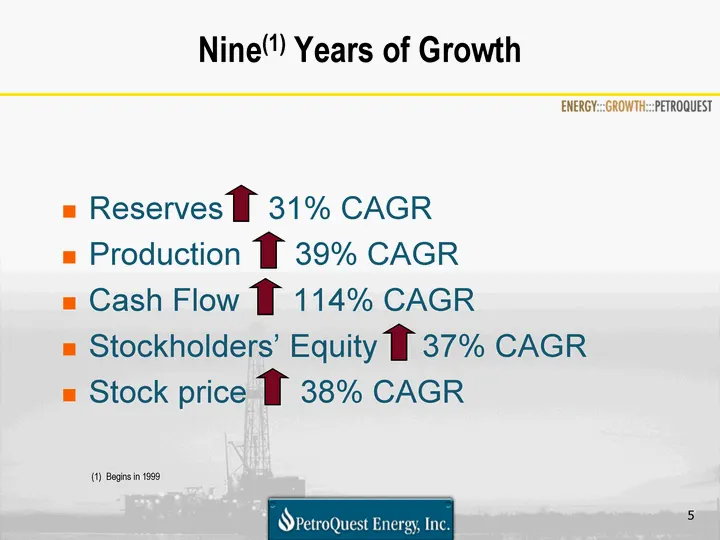
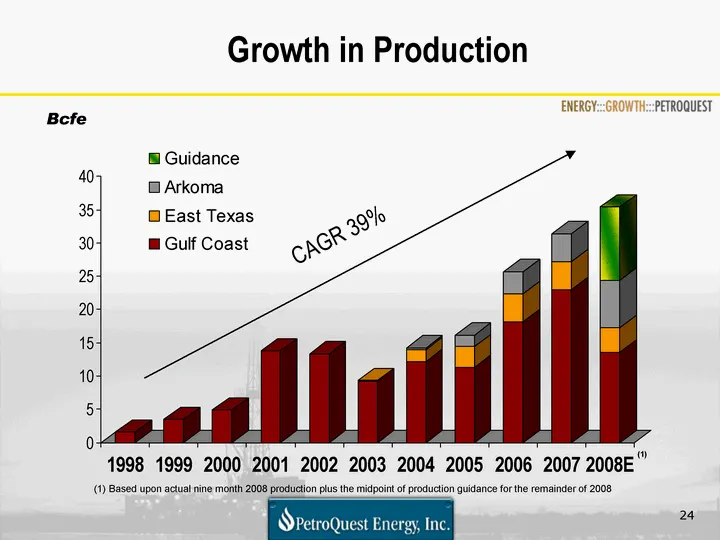
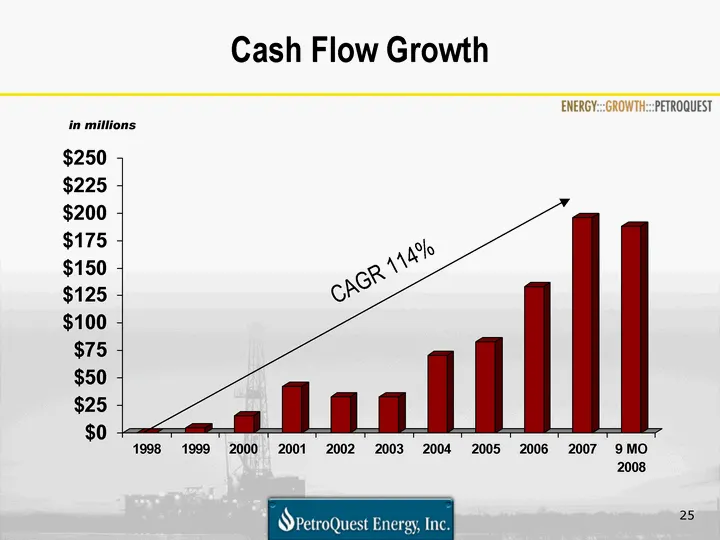
Nine(1) Years of Growth Reserves 31% CAGR Production 39% CAGR Cash Flow 114% CAGR Stockholders' Equity 37% CAGR Stock price 38% CAGR (1) Begins in 1999
Slide 6: Navigating the Current Environment
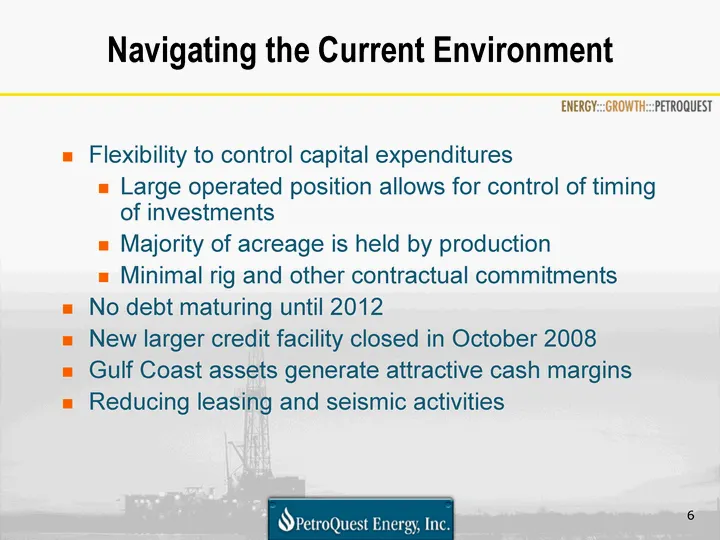
Navigating the Current Environment Flexibility to control capital expenditures Large operated position allows for control of timing of investments Majority of acreage is held by production Minimal rig and other contractual commitments No debt maturing until 2012 New larger credit facility closed in
Slide 7: Our Properties
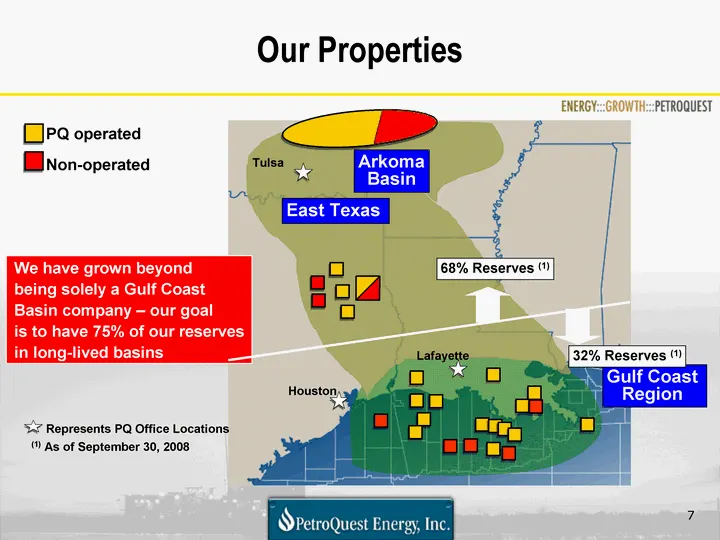
Our Properties PQ operated (1) As of September 30, 2008 Gulf Coast Region Represents PQ Office Locations Arkoma Basin Tulsa East Texas Lafayette Houston We have grown beyond being solely a Gulf Coast Basin company - our goal is to have 75% of our reserves in long-lived basins 68% Reserves (1) 32% Re
Slide 8: Our Portfolio
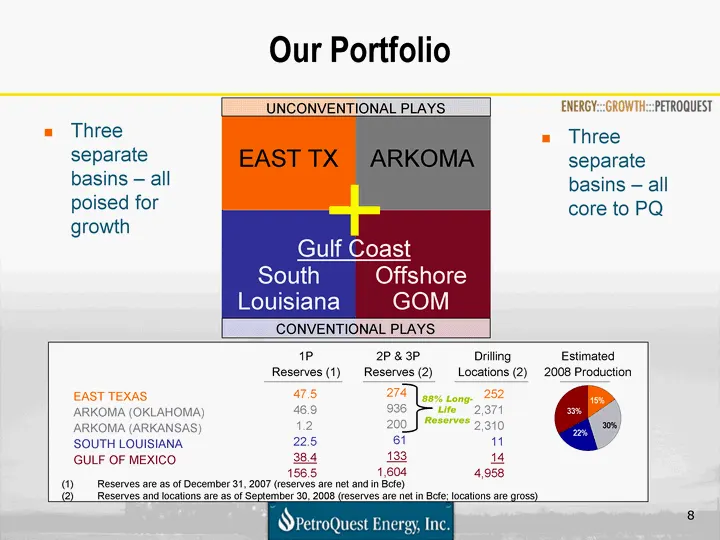
EAST TX ARKOMA South Louisiana Offshore GOM UNCONVENTIONAL PLAYS 1P Reserves (1) Drilling Locations (2) Estimated 2008 Production EAST TEXAS ARKOMA (OKLAHOMA) ARKOMA (ARKANSAS) SOUTH LOUISIANA GULF OF MEXICO Our Portfolio Three separate basins - all poised for growth Three separate basins - all core
Slide 9: Arkoma Basin
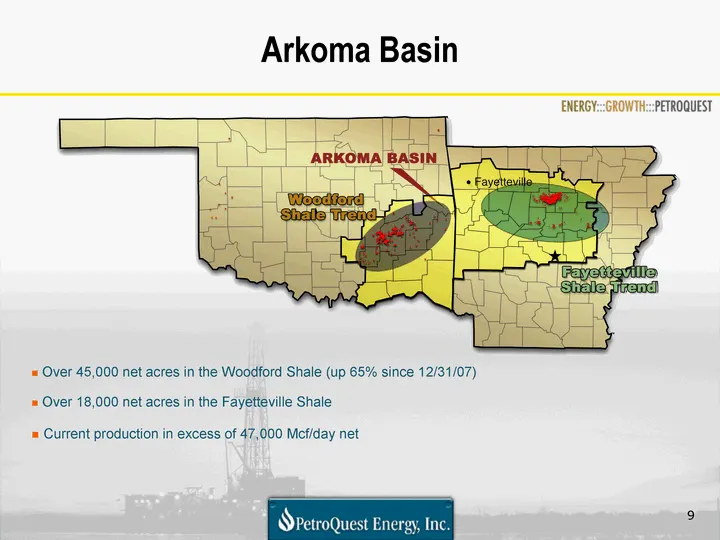
Arkoma Basin Over 45,000 net acres in the Woodford Shale (up 65% since 12/31/07) Over 18,000 net acres in the Fayetteville Shale Current production in excess of 47,000 Mcf/day net
Slide 10: Woodford Shale Recent Activity
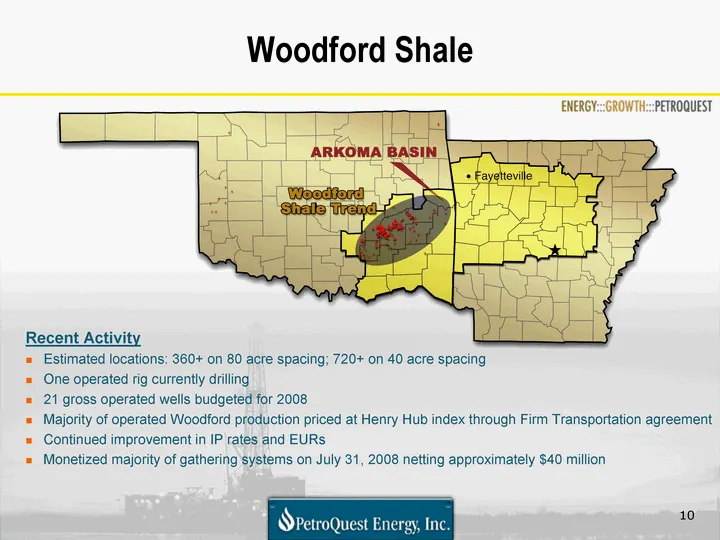
Woodford Shale Recent Activity Estimated locations: 360+ on 80 acre spacing; 720+ on 40 acre spacing One operated rig currently drilling 21 gross operated wells budgeted for 2008 Majority of operated Woodford production priced at Henry Hub index through Firm Transportation agreement Continued improv
Slide 11: Gross Woodford Production (PQ Operated)
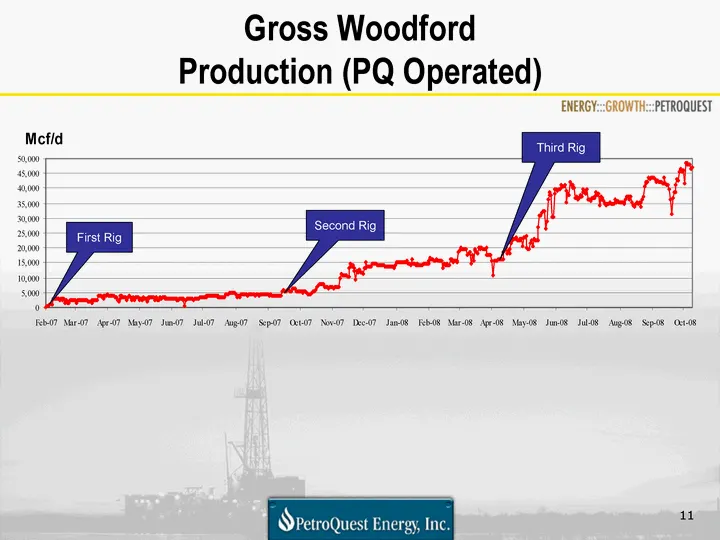
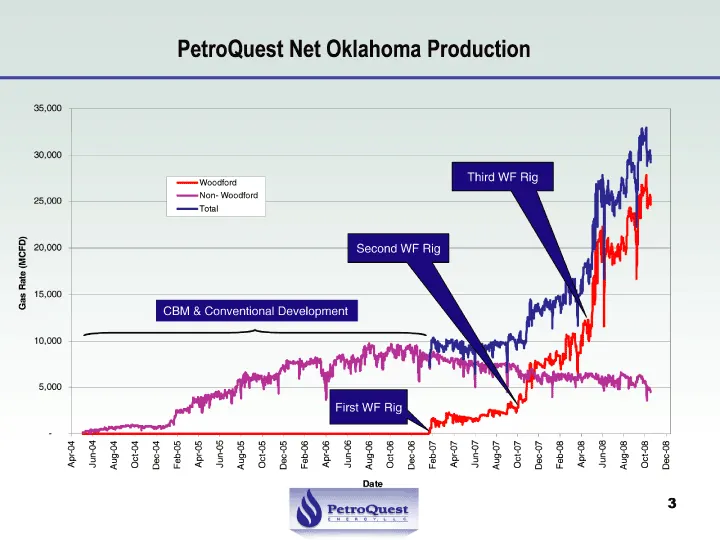
Gross Woodford Production (PQ Operated) First Rig Second Rig Third Rig
Slide 12: Woodford Shale Wells
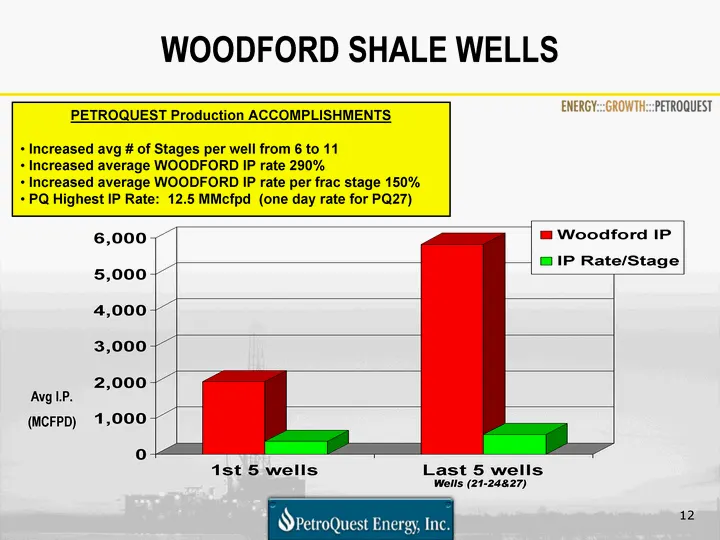
WOODFORD SHALE WELLS 1st 5 wells Last 5 wells Days 44.2 33.6 Cost (mm$) 5.6 5.2 Rate (Mscfpd/stage) 286 377 Completion Cost (mm$) 2.545 2.544 Stages 6 11 COST (M$) 5600 5200 Lateral length 3069 3651 Woodford Length (ft) 2658 3556 Woodford Efficiency 86 97 Woodford IP 2014 5828 IP Rate/Stage 359 549
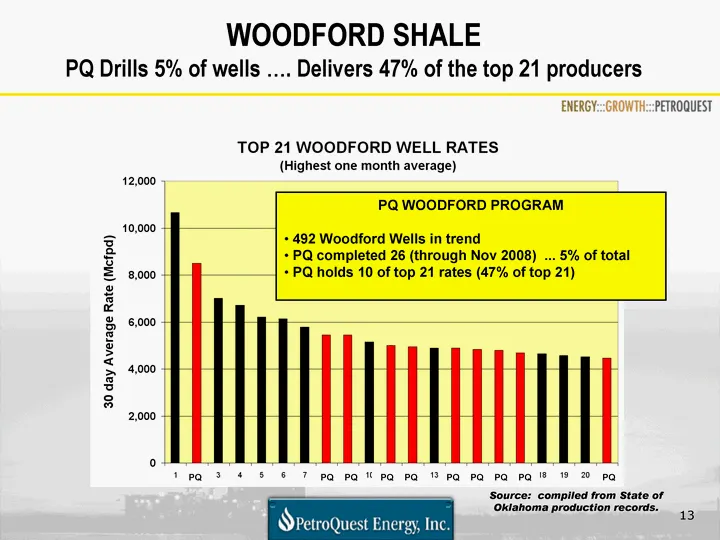
Slide 13: Woodford Shale: PQ Drills 5% of Wells, Delivers 47% of Top 21
WOODFORD SHALE PQ Drills 5% of wells .... Delivers 47% of the top 21 producers Source: compiled from State of Oklahoma production records. PQ PQ PQ PQ PQ PQ PQ PQ PQ PQ WOODFORD PROGRAM 492 Woodford Wells in trend PQ completed 26 (through Nov 2008) ... 5% of total PQ holds 10 of top 21 rates (47% of
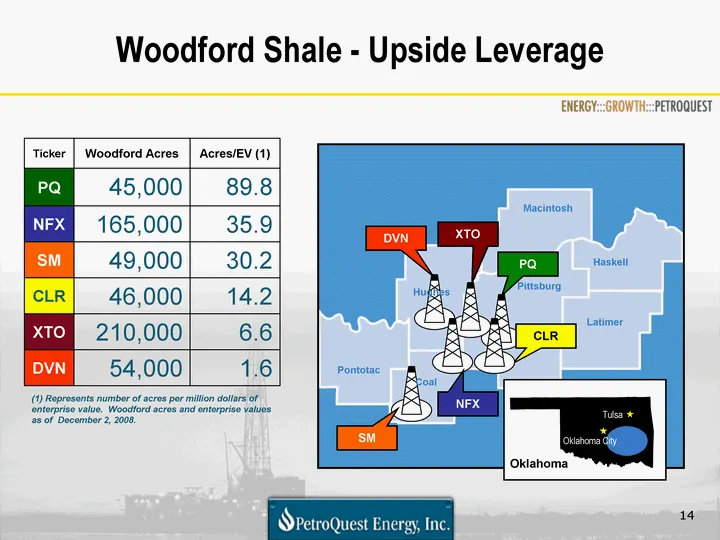
Slide 14: Woodford Shale - Upside Leverage
Woodford Shale - Upside Leverage Ticker Woodford Acres Acres/EV (1) PQ 45,000 89.8 NFX 165,000 35.9 SM 49,000 30.2 CLR 46,000 14.2 XTO 210,000 6.6 DVN 54,000 1.6 (1) Represents number of acres per million dollars of enterprise value. Woodford acres and enterprise values as of December 2, 2008. (1) R
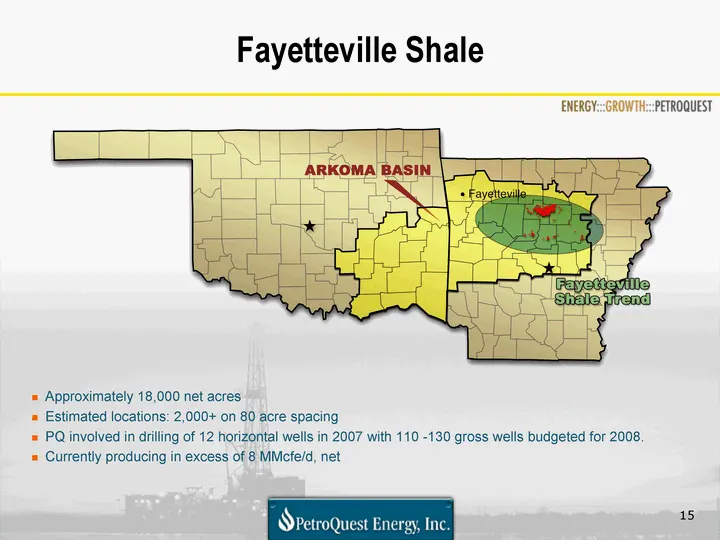
Slide 15: Fayetteville Shale
Fayetteville Shale Approximately 18,000 net acres Estimated locations: 2,000+ on 80 acre spacing PQ involved in drilling of 12 horizontal wells in 2007 with 110 -130 gross wells budgeted for 2008. Currently producing in excess of 8 MMcfe/d, net
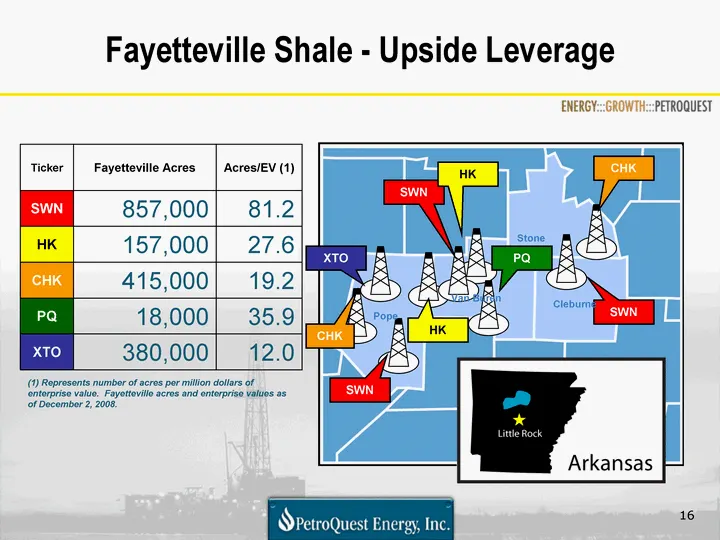
Slide 16: Fayetteville Shale - Upside Leverage
Fayetteville Shale - Upside Leverage Ticker Fayetteville Acres Acres/EV (1) SWN 857,000 81.2 HK 157,000 27.6 CHK 415,000 19.2 PQ 18,000 35.9 XTO 380,000 12.0 (1) Represents number of acres per million dollars of enterprise value. Fayetteville acres and enterprise values as of December 2, 2008. (1) R
Slide 17: East Texas Basin
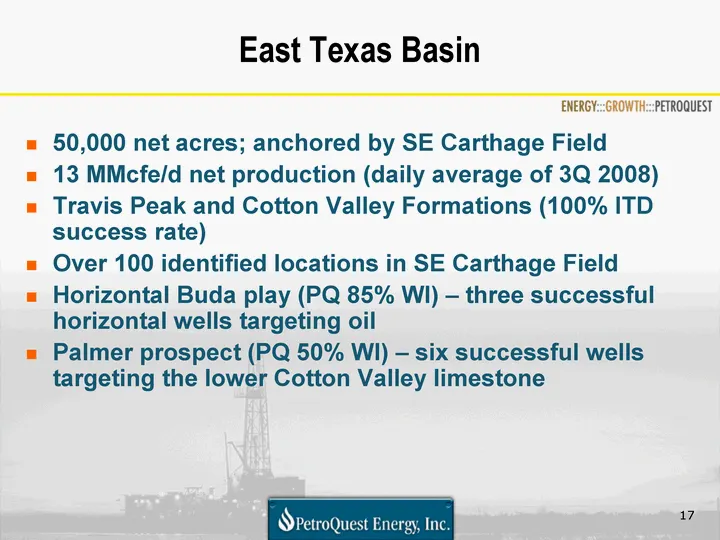
East Texas Basin 50,000 net acres; anchored by SE Carthage Field 13 MMcfe/d net production (daily average of 3Q 2008) Travis Peak and Cotton Valley Formations (100% ITD success rate) Over 100 identified locations in SE Carthage Field Horizontal Buda play (PQ 85% WI) - three successful horizontal wel
Slide 18: East Texas Basin Prospects
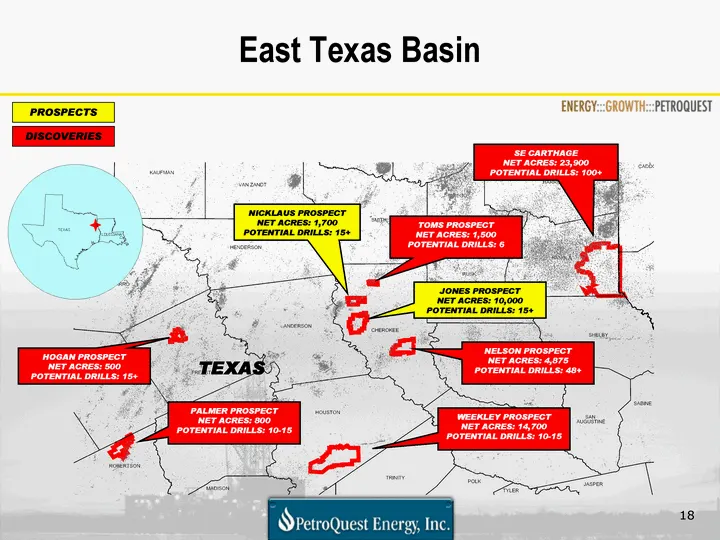
East Texas Basin SE CARTHAGE NET ACRES: 23,900 POTENTIAL DRILLS: 100+ NICKLAUS PROSPECT NET ACRES: 1,700 POTENTIAL DRILLS: 15+ JONES PROSPECT NET ACRES: 10,000 POTENTIAL DRILLS: 15+ HOGAN PROSPECT NET ACRES: 500 POTENTIAL DRILLS: 15+ PALMER PROSPECT NET ACRES: 800 POTENTIAL DRILLS: 10-15 PROSPECTS D
Slide 19: Resource Players Cash Flow Comparison
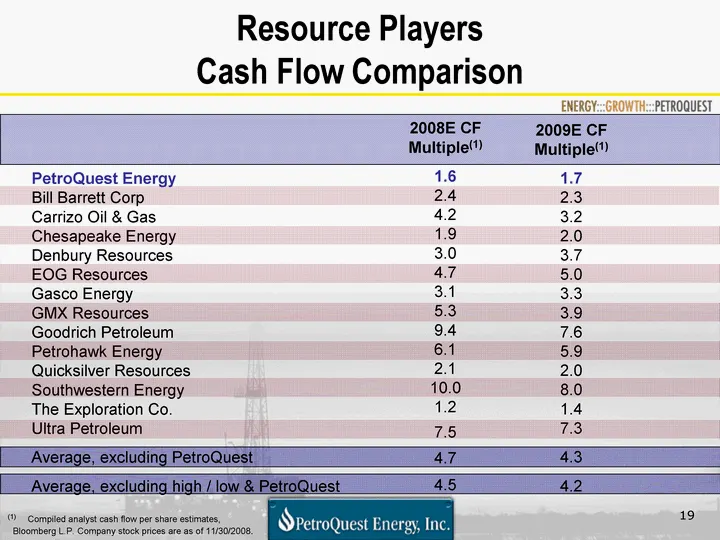
Resource Players Cash Flow Comparison PetroQuest Energy Bill Barrett Corp Carrizo Oil & Gas Chesapeake Energy Denbury Resources EOG Resources Gasco Energy GMX Resources Goodrich Petroleum Petrohawk Energy Quicksilver Resources Southwestern Energy The Exploration Co. Ultra Petroleum Average, excludin
Slide 20: 2008 Gulf Coast Drilling Program
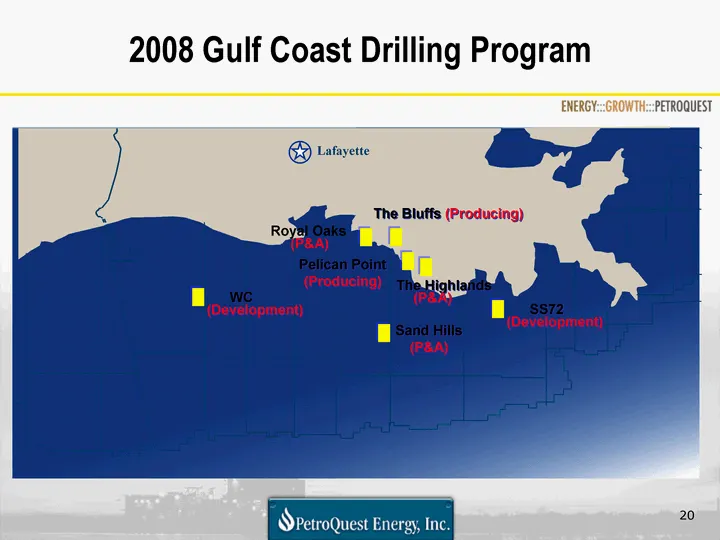
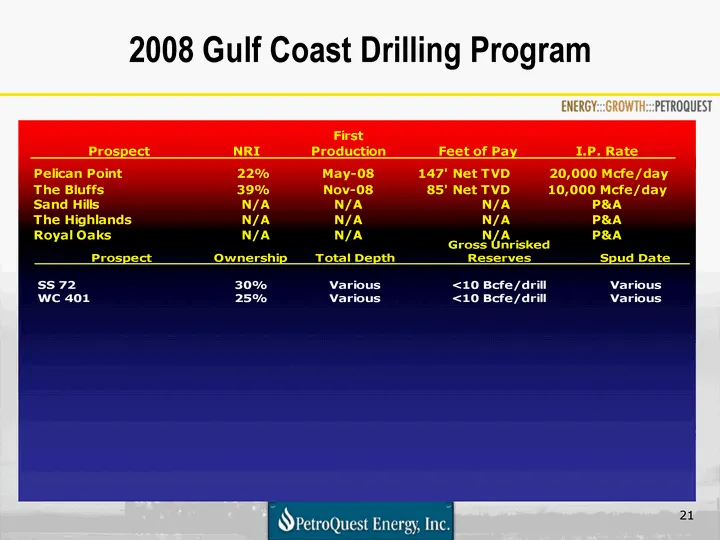
2008 Gulf Coast Drilling Program Lafayette Pelican Point (Producing) Sand Hills (P&A) The Highlands (P&A) The Bluffs (Producing) Royal Oaks (P&A) SS72 (Development) WC (Development)
Slide 21: 2008 Gulf Coast Drilling Program
2008 Gulf Coast Drilling Program
Slide 22: Consistent Approach Through Price Cycles
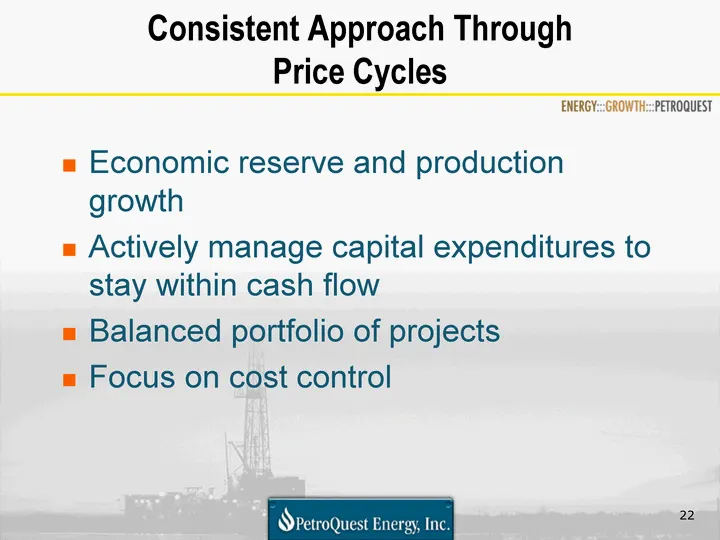
Consistent Approach Through Price Cycles Economic reserve and production growth Actively manage capital expenditures to stay within cash flow Balanced portfolio of projects Focus on cost control
Slide 23: Growth in Reserves
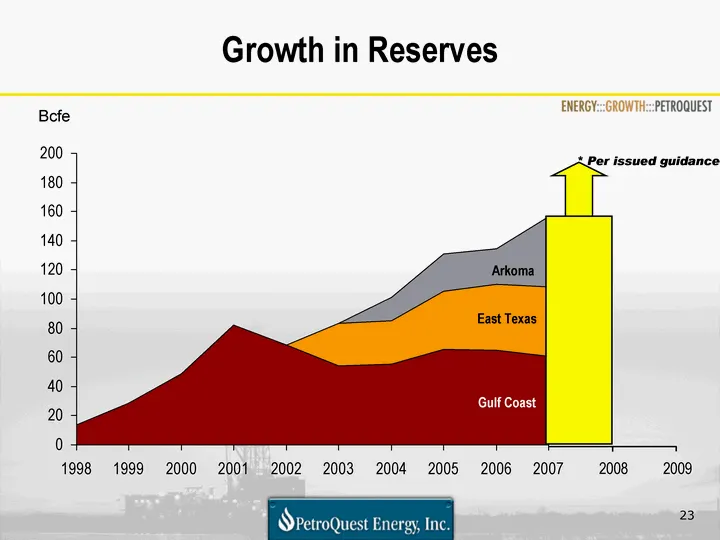
Growth in Reserves 1998 1999 2000 2001 2002 2003 2004 2005 2006 2007 East 13.585 28.289 48.824 82.225 68.685 54.31 55.507 65.427 64.7 60.9 West 28.951 29.385 40.098 45.4 47.5 North 16.463 25.447 24.5 48.1 East Texas Arkoma Gulf Coast Bcfe 2008 2009 * Per issued guidance
Slide 24: Growth in Production
Growth in Production 1998 1999 2000 2001 2002 2003 2004 2005 2006 2007 2008E Gulf Coast 1.553 3.461 4.848 13.774 13.34 9.267 12.206 11.3 18.2 22.995 13.567 East Texas 0.033 1.758 3.1 4.2 4.208 3.739 Arkoma 0.252 1.7 3.3 4.24 7.043 Guidance 11.056 Bcfe CAGR 39% (1) (1) Based upon actual nine month 20
Slide 25: Cash Flow Growth
Cash Flow Growth 1998 1999 2000 2001 2002 2003 2004 2005 2006 2007 9 MO 2008 East -960 4.59 15.926 42.317 32.813 32.915 70.31 83 133 196 188 West 38.6 34.6 31.6 North 46.9 45 43.9 in millions CAGR 114%
Slide 26: Gross Margin
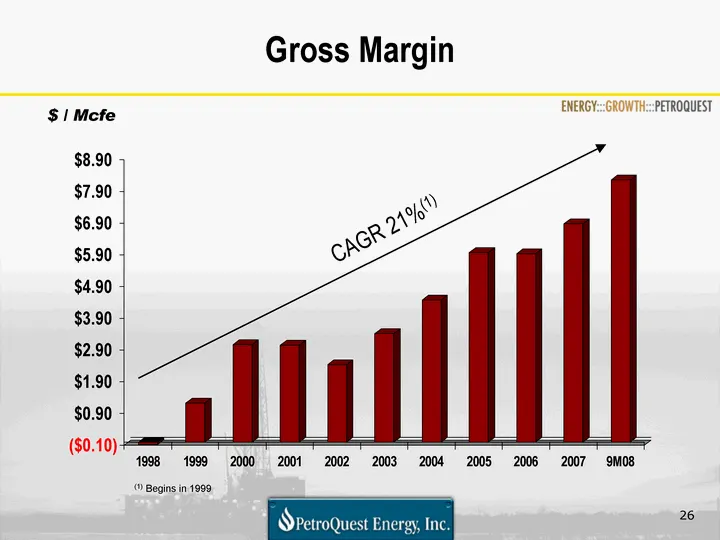
Gross Margin 1998 1999 2000 2001 2002 2003 2004 2005 2006 2007 9M08 East -0.07 1.23 3.08 3.06 2.44 3.43 4.47 5.97 5.94 6.88 8.26 West North $ / Mcfe CAGR 21%(1) (1) Begins in 1999
Slide 27: Capital Investment Program - Diversification Reduces Risk
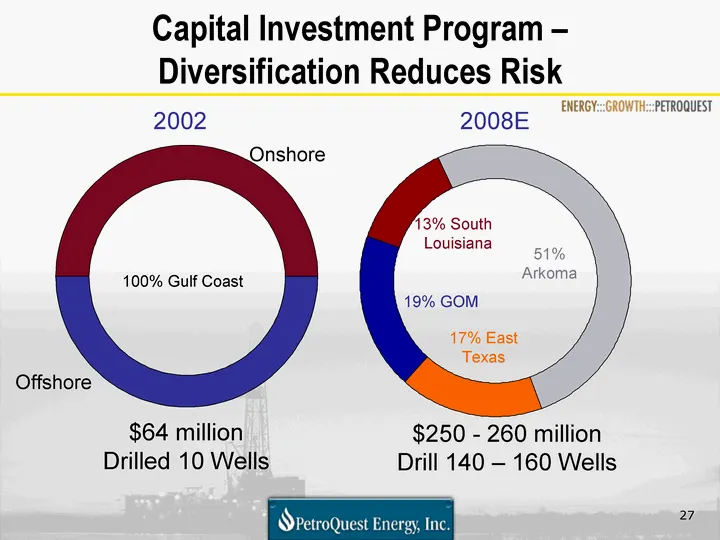
1st Qtr 2nd Qtr 3rd Qtr 4th Qtr East 42.582 46.495 32.125 127.935 West 30.6 38.6 34.6 31.6 North 45.9 46.9 45 43.9 Capital Investment Program - Diversification Reduces Risk Onshore Offshore 100% Gulf Coast 17% East Texas 51% Arkoma 13% South Louisiana 19% GOM $250 - 260 million Drill 140 - 160 Wells
Slide 28: New $300 Million Credit Facility
New $300 Million Credit Facility Increased the borrowing base from $95 million to $150 million on October 2, 2008 Extended maturity date from November 2009 to February 2012 (potential to extend to October 2013) Expanded bank group from three to five No change to financial covenants
Slide 29: Conservative Financial Philosophy
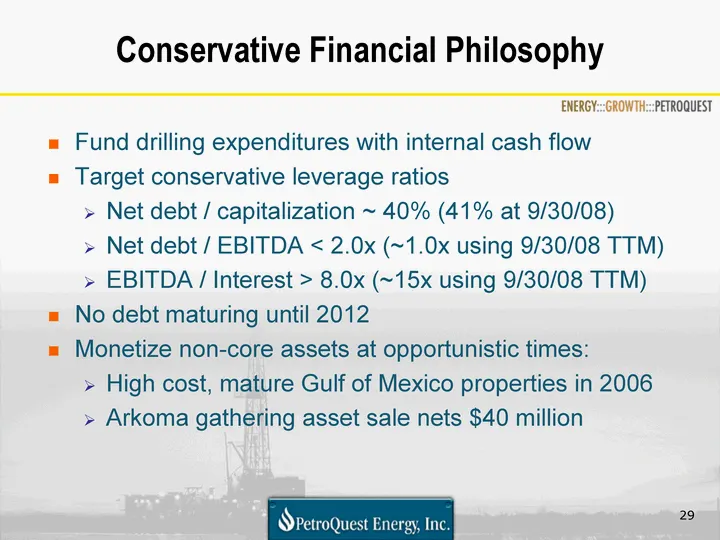
Conservative Financial Philosophy Fund drilling expenditures with internal cash flow Target conservative leverage ratios Net debt / capitalization ~ 40% (41% at 9/30/08) Net debt / EBITDA < 2.0x (~1.0x using 9/30/08 TTM) EBITDA / Interest > 8.0x (~15x using 9/30/08 TTM) No debt maturing until 2012 M
Slide 30: Hedging Positions Mitigate Risks
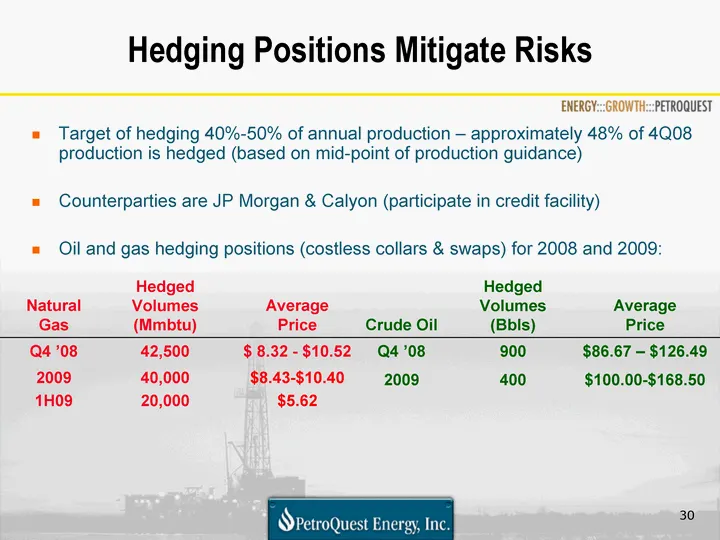
Hedging Positions Mitigate Risks Target of hedging 40%-50% of annual production - approximately 48% of 4Q08 production is hedged (based on mid-point of production guidance) Counterparties are JP Morgan & Calyon (participate in credit facility) Oil and gas hedging positions (costless collars & swaps)
Slide 31: Summary and Outlook
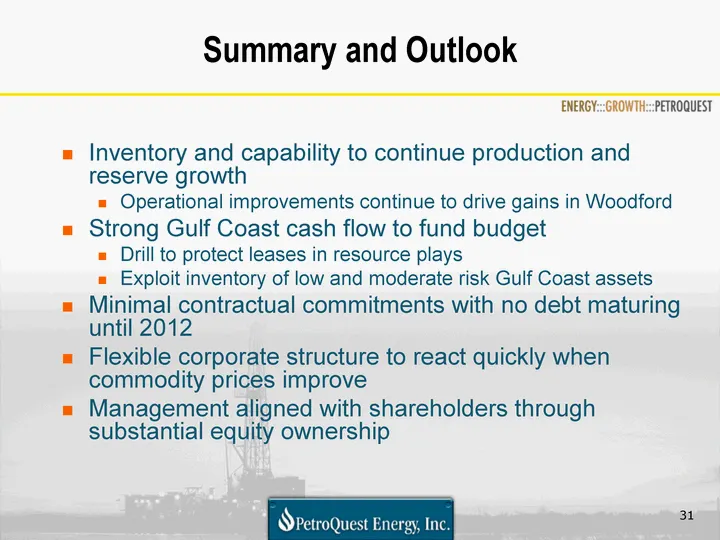
Summary and Outlook Inventory and capability to continue production and reserve growth Operational improvements continue to drive gains in Woodford Strong Gulf Coast cash flow to fund budget Drill to protect leases in resource plays Exploit inventory of low and moderate risk Gulf Coast assets Minima
Slide 32: PetroQuest Energy Oklahoma Woodford Shale
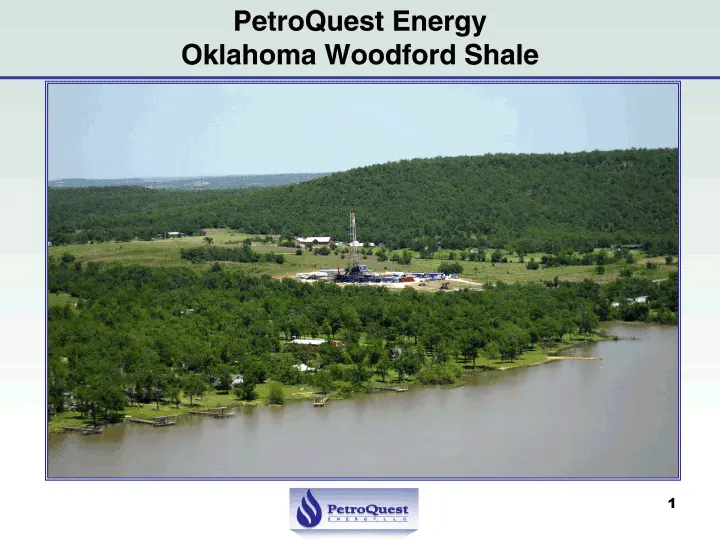
1 PetroQuest Energy Oklahoma Woodford Shale
Slide 33: Arkoma Basin - Established Resource Play
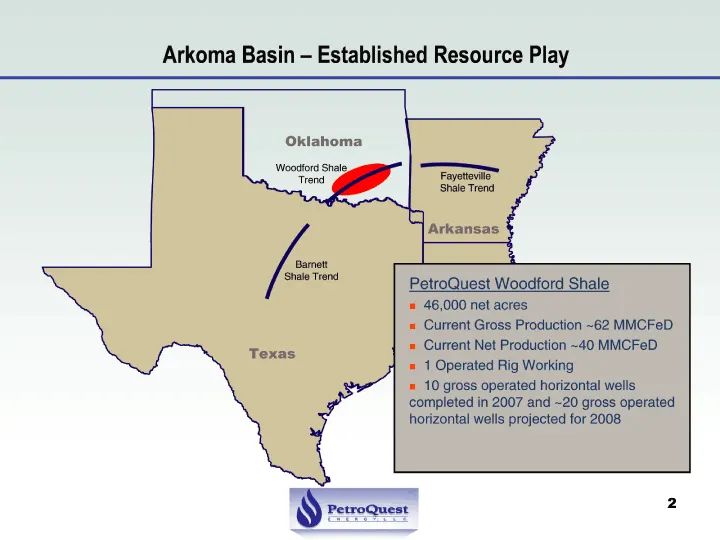
3 Arkoma Basin - Established Resource Play Woodford Shale Trend Fayetteville Shale Trend Barnett Shale Trend Texas Oklahoma Louisiana Arkansas PetroQuest Woodford Shale 46,000 net acres Current Gross Production ~62 MMCFeD Current Net Production ~40 MMCFeD 1 Operated Rig Working 10 gross operated hor
Slide 34: PetroQuest Net Oklahoma Production
5 PetroQuest Net Oklahoma Production First WF Rig Second WF Rig Third WF Rig CBM & Conventional Development
Slide 35: Advantages Inherent to Woodford Shale Play
7 Advantages Inherent to Woodford Shale Play High silica content yields hydraulic fracturing efficiency High recovery factor per acre Good frac barrier above and below limits water problems Located near major transportation corridor, allowing ready access to pipelines and infrastructure Rural locati
Slide 36: Lake McAlester
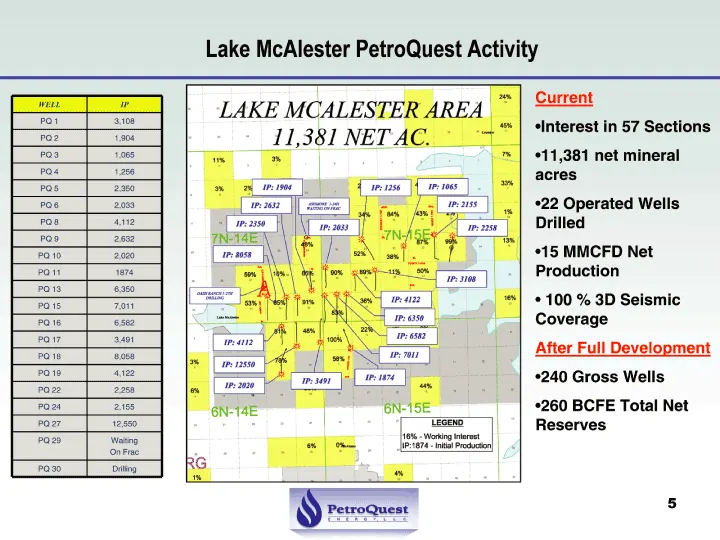
9 Lake McAlester PetroQuest Activity Current Interest in 57 Sections 11,381 net mineral acres 22 Operated Wells Drilled 15 MMCFD Net Production 100 % 3D Seismic Coverage After Full Development 240 Gross Wells 260 BCFE Total Net Reserves WELL IP PQ 1 3,108 PQ 2 1,904 PQ 3 1,065 PQ 4 1,256 PQ 5 2,350
Slide 37: Hoss
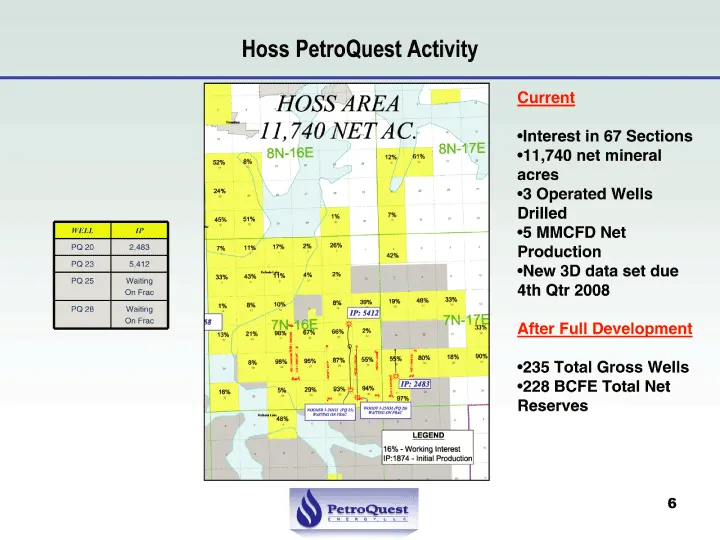
11 Hoss PetroQuest Activity Current Interest in 67 Sections 11,740 net mineral acres 3 Operated Wells Drilled 5 MMCFD Net Production New 3D data set due 4th Qtr 2008 After Full Development 235 Total Gross Wells 228 BCFE Total Net Reserves WELL IP PQ 20 2,483 PQ 23 5,412 PQ 25 Waiting On Frac PQ 28 W
Slide 38: Technical Reasons for PQ Woodford Success
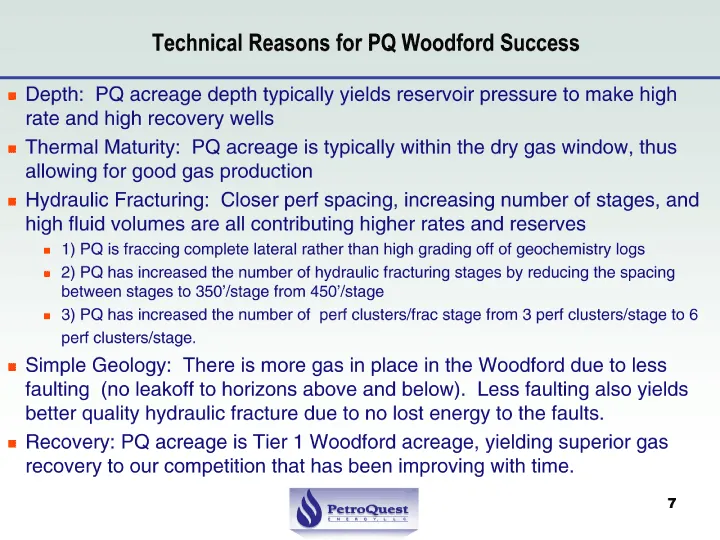
13 Technical Reasons for PQ Woodford Success Depth: PQ acreage depth typically yields reservoir pressure to make high rate and high recovery wells Thermal Maturity: PQ acreage is typically within the dry gas window, thus allowing for good gas production Hydraulic Fracturing: Closer perf spacing, inc
Slide 39: Current Woodford Development Wells
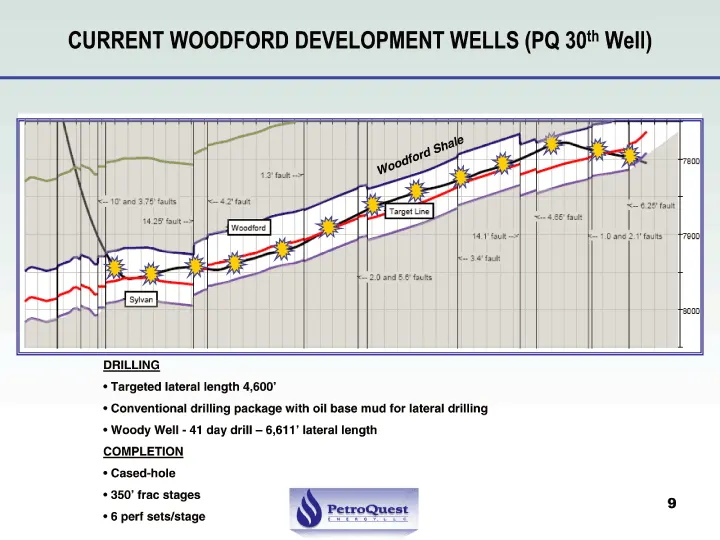
17 CURRENT WOODFORD DEVELOPMENT WELLS (PQ 30th Well) Woodford Shale DRILLING Targeted lateral length 4,600' Conventional drilling package with oil base mud for lateral drilling Woody Well - 41 day drill - 6,611' lateral length COMPLETION Cased-hole 350' frac stages 6 perf sets/stage
Slide 40: PQ Improving Gas Rate Performance
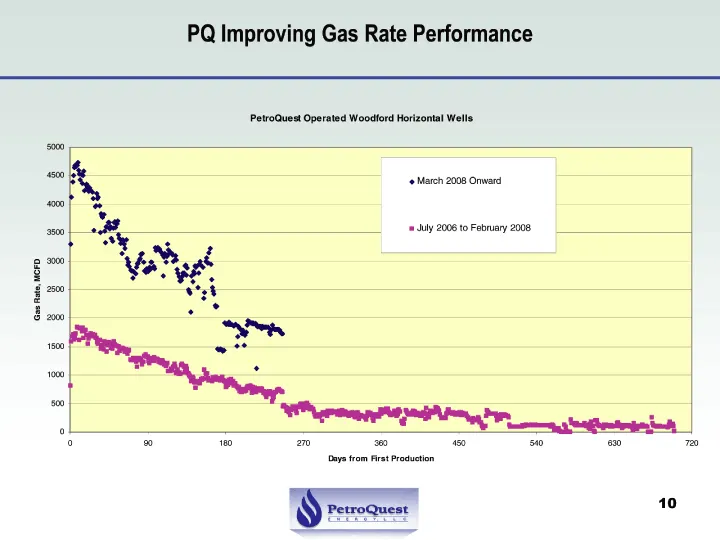
19 PQ Improving Gas Rate Performance 20% of the reserves are being recovered in the first year of production
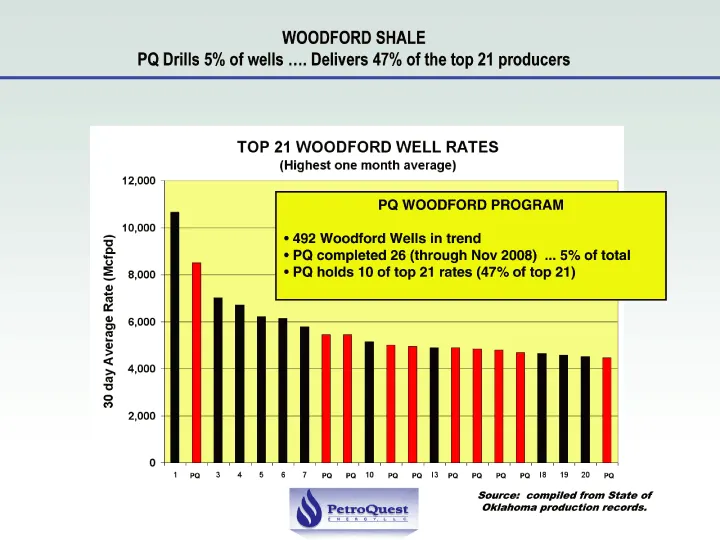
Slide 41: Woodford Shale: PQ Drills 5% of Wells, Delivers 47% of Top 21
WOODFORD SHALE PQ Drills 5% of wells .... Delivers 47% of the top 21 producers PQ PQ PQ PQ PQ PQ PQ PQ PQ PQ Source: compiled from State of Oklahoma production records. PQ PQ PQ PQ PQ PQ PQ PQ PQ PQ PQ WOODFORD PROGRAM 492 Woodford Wells in trend PQ completed 26 (through Nov 2008) ... 5% of total PQ
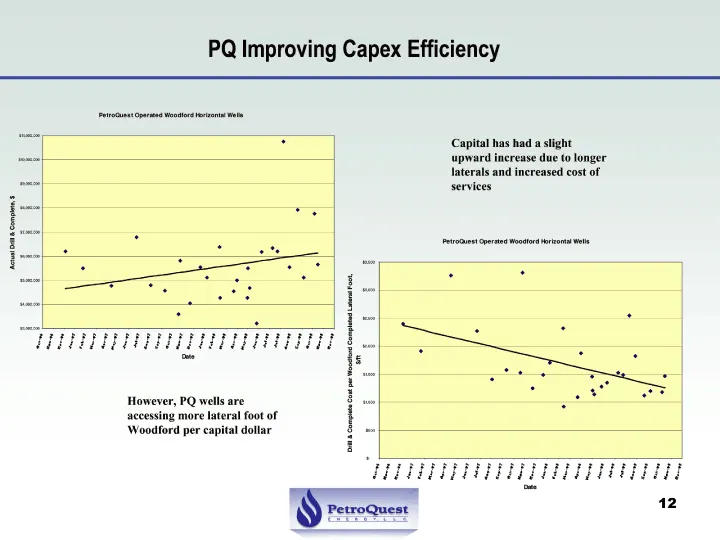
Slide 42: PQ Improving Capex Efficiency
23 PQ Improving Capex Efficiency Capital has had a slight upward increase due to longer laterals and increased cost of services However, PQ wells are accessing more lateral foot of Woodford per capital dollar
Source: SEC EDGAR · 8-K filed Dec 15, 2008
More decks from PetroQuest Energy Inc
 Corporate Update (June 2019)15 slides · Jun 19, 2019
 Investor Presentation (November 2018)16 slides · Nov 7, 2018
 Investor Presentation (July 2018)29 slides · Jul 10, 2018
 Investor Presentation (December 2017)6 slides · Dec 20, 2017
 Investor Presentation (January 2017)28 slides · Jan 9, 2017
 Investor Presentation (April 2016)29 slides · Apr 5, 2016