Superior Drilling Products Inc
Superior Drilling Products — Investor Presentation (May 2017)
21 slides from Superior Drilling Products's investor presentation, May 18, 2017
Slide 1: Investor Presentation May 2017
ING PRODUCTS Investor Presentation May 2017 Troy Meier Christopher Cashion Chairman and Chief Executive Officer Chief Financial Officer NYSE MKT: SDPI © 2017 Superior Drilling Products www.sdpi.com
Slide 2: Safe Harbor Statement
Safe Harbor Statement These slides and the accompanying oral presentation contain “forward-looking statements" within the meaning of the safe harbor provisions, 15U.S.C. § 78u-5, of the Private Securities Litigation Reform Act of 1995. All statements, other than statements of historical fact include
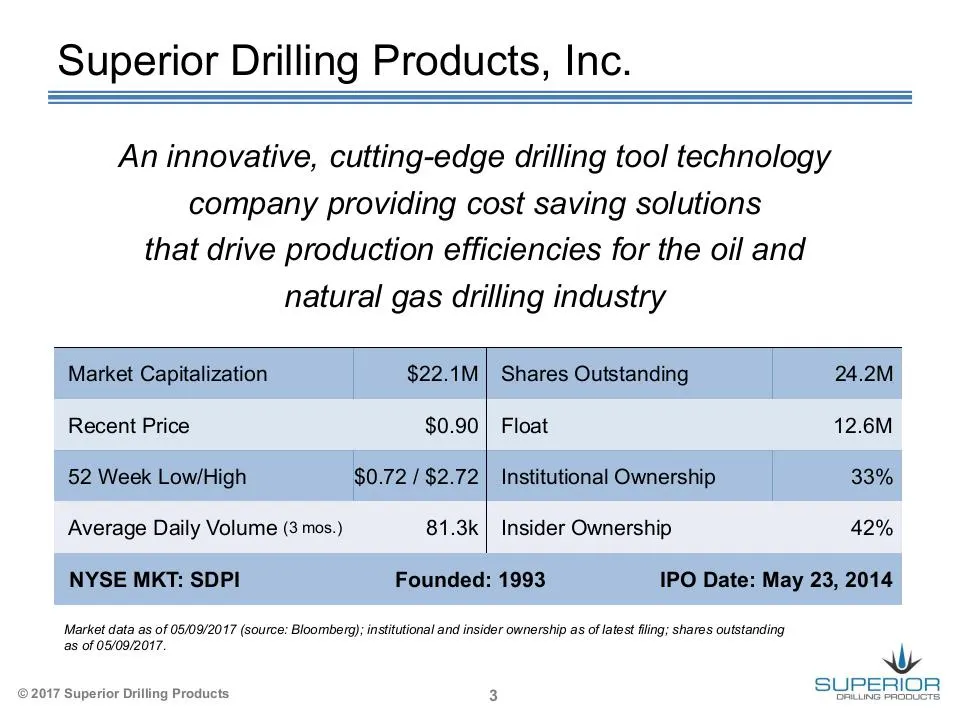
Slide 3: Superior Drilling Products, Inc.
Superior Drilling Products, Inc. An innovative, cutting-edge drilling tool technology company providing cost saving solutions that drive production efficiencies for the oil and natural gas drilling industry Market Capitalization $22.1M]| Shares Outstanding 24.2M Recent Price $0.90] Float 12.6M 52 We
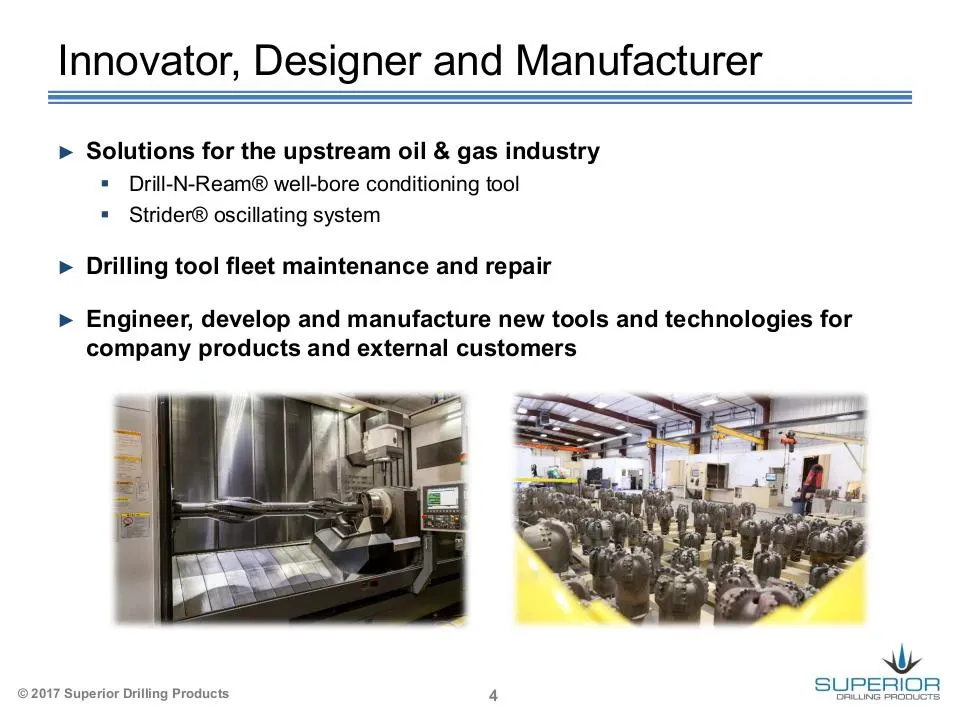
Slide 4: Innovator, Designer and Manufacturer
Innovator, Designer and Manufacturer > Solutions for the upstream oil & gas industry * Drill-N-Ream® well-bore conditioning tool * Strider® oscillating system > Drilling tool fleet maintenance and repair > Engineer, develop and manufacture new tools and technologies for company products and external
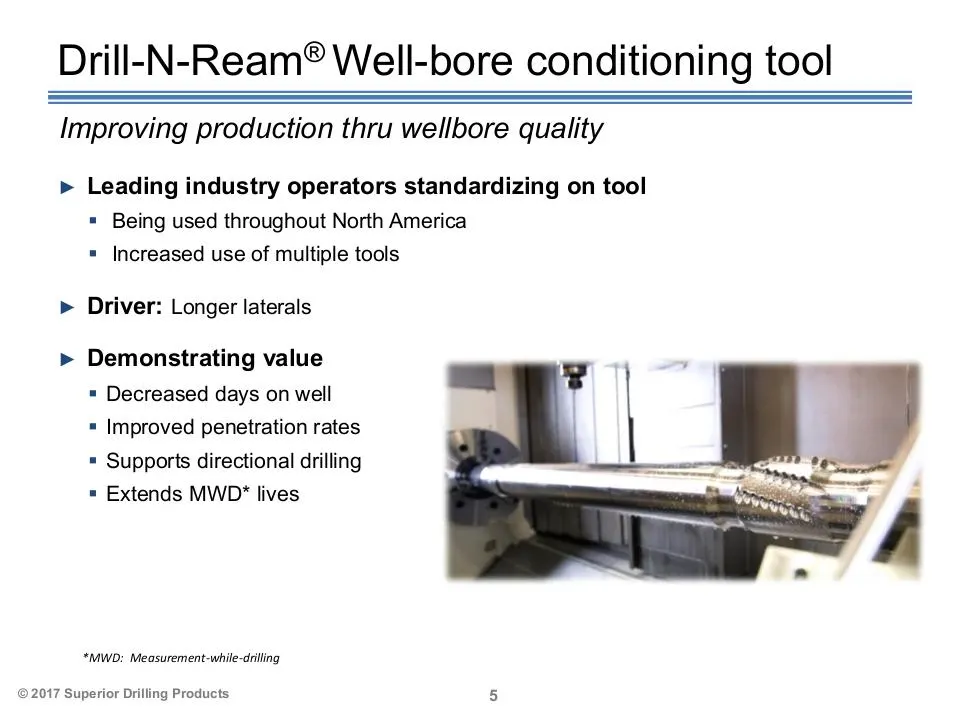
Slide 5: Drill-N-Ream Well-bore conditioning tool
Drill-N-Ream® Well-bore conditioning tool Improving production thru wellbore quality > Leading industry operators standardizing on tool = Being used throughout North America = Increased use of multiple tools > Driver: Longer laterals > Demonstrating value = Decreased days on well = Improved penetrat
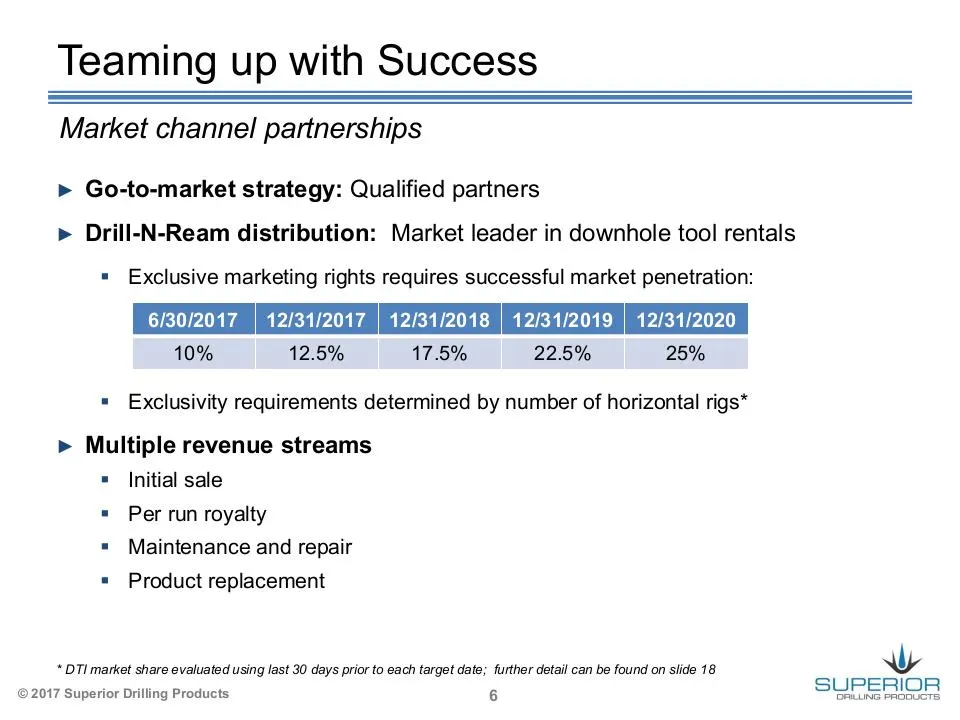
Slide 6: Teaming up with Success
Teaming up with Success Market channel partnerships > Go-to-market strategy: Qualified partners > Drill-N-Ream distribution: Market leader in downhole tool rentals = Exclusive marketing rights requires successful market penetration: 6/30/2017 | 12/31/2017 | 12/31/2018 | 12/31/2019 | 12/31/2020 10% 1
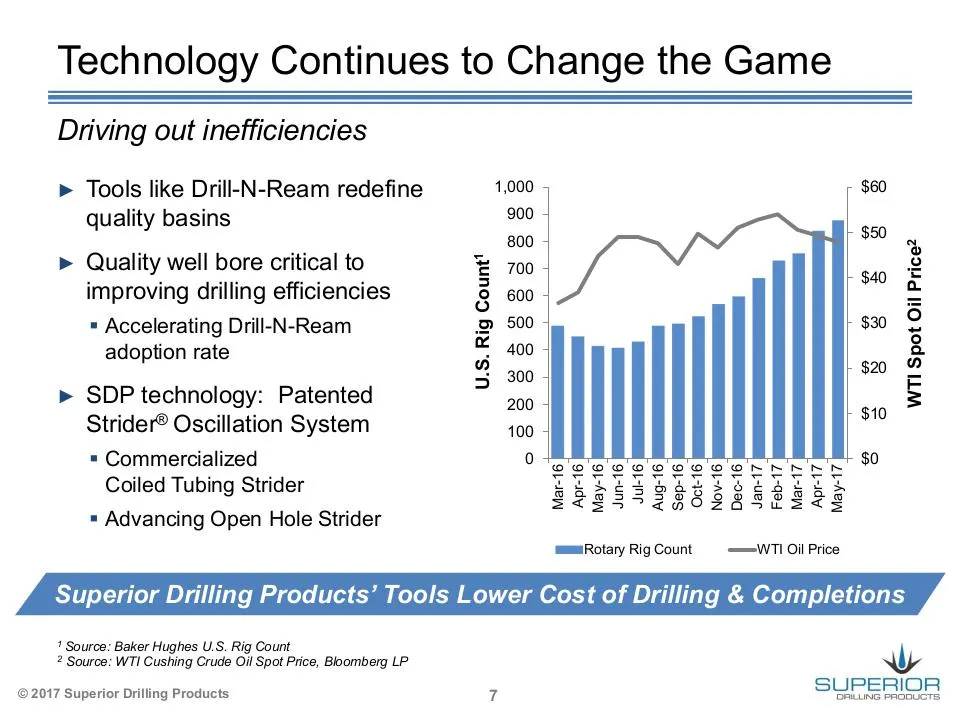
Slide 7: Technology Continues to Change the Game
Technology Continues to Change the Game Driving out inefficiencies > Tools like Drill-N-Ream redefine 1,000 $60 quality basins 900 800 so > Quality well bore critical to = 700 $40 2 improving drilling efficiencies 8 600 = * Accelerating Drill-N-Ream @ 500 $30 : adoption rate a 400 520 Cy 5; 300 = >
Slide 8: Financial Results
Financial Results © 2017 Superior Drilling Products
Slide 9: Significant Revenue Growth
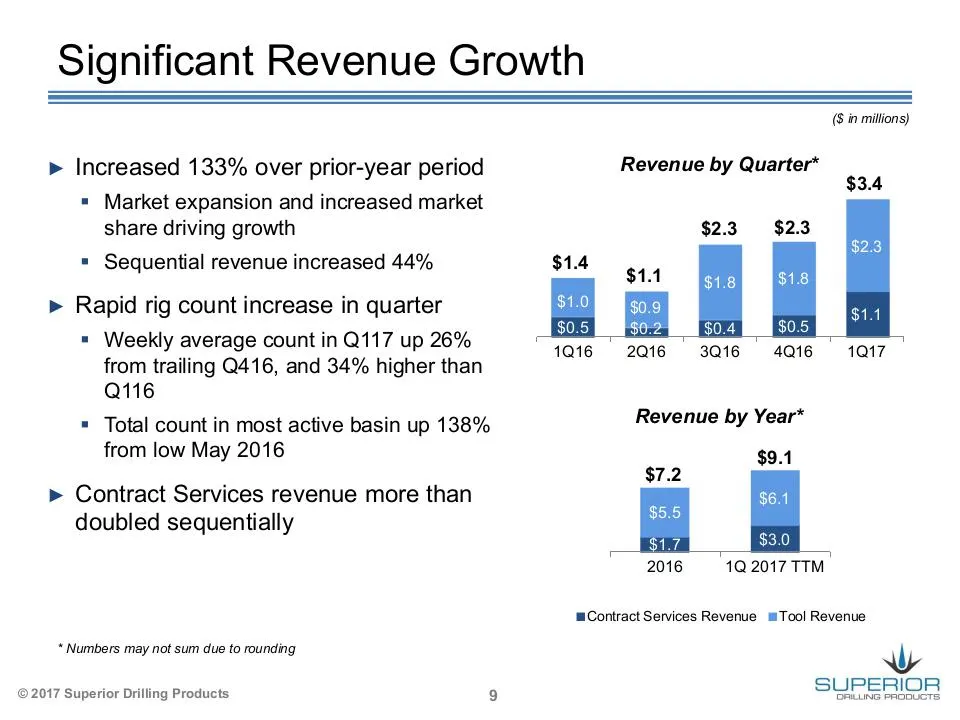
Significant Revenue Growth > Increased 133% over prior-year period = Market expansion and increased market share driving growth = Sequential revenue increased 44% > Rapid rig count increase in quarter = Weekly average count in Q117 up 26% from trailing Q416, and 34% higher than Q116 * Total count in
Slide 10: Tool Revenue Strength
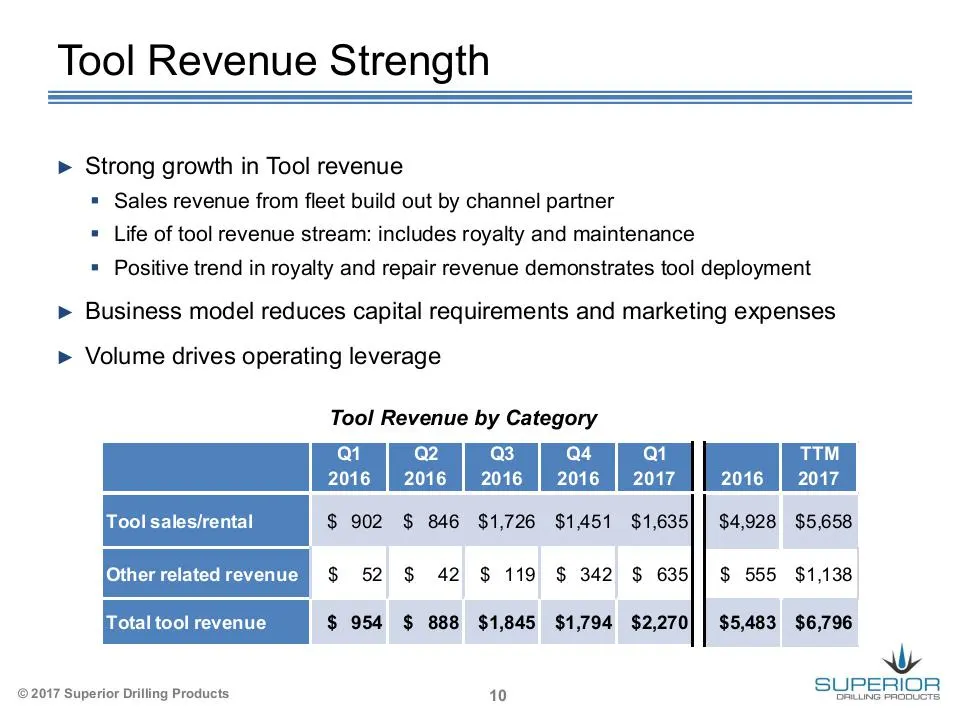
Tool Revenue Strength > Strong growth in Tool revenue * Sales revenue from fleet build out by channel partner * Life of tool revenue stream: includes royalty and maintenance * Positive trend in royalty and repair revenue demonstrates tool deployment > Business model reduces capital requirements and
Slide 11: Strong Cost Discipline
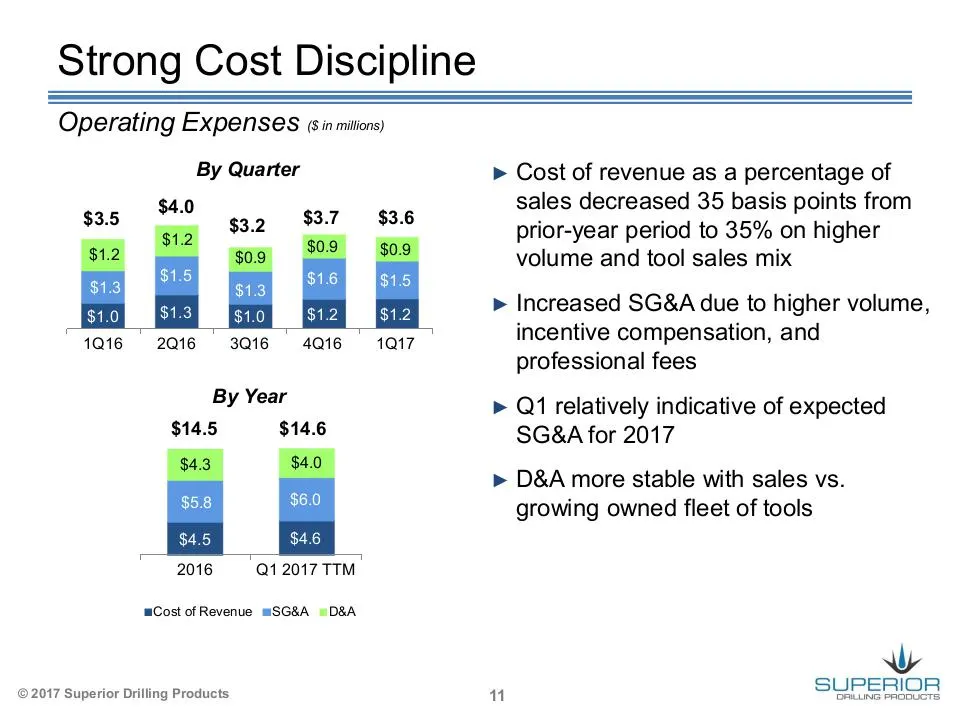
Strong Cost Discipline Operating Expenses (sin mitions) By Quarter $4.0 $3.7 $3.6 $3.5 1016 2016 3Q16 4016 1017 By Year $14.5 $14.6 "2016 Q1 2017 TTM mCost of Revenue SG&A =D&A ©2017 Superior Drilling Products > Cost of revenue as a percentage of sales decreased 35 basis points from prior-year perio
Slide 12: Created Better Margin Business Model
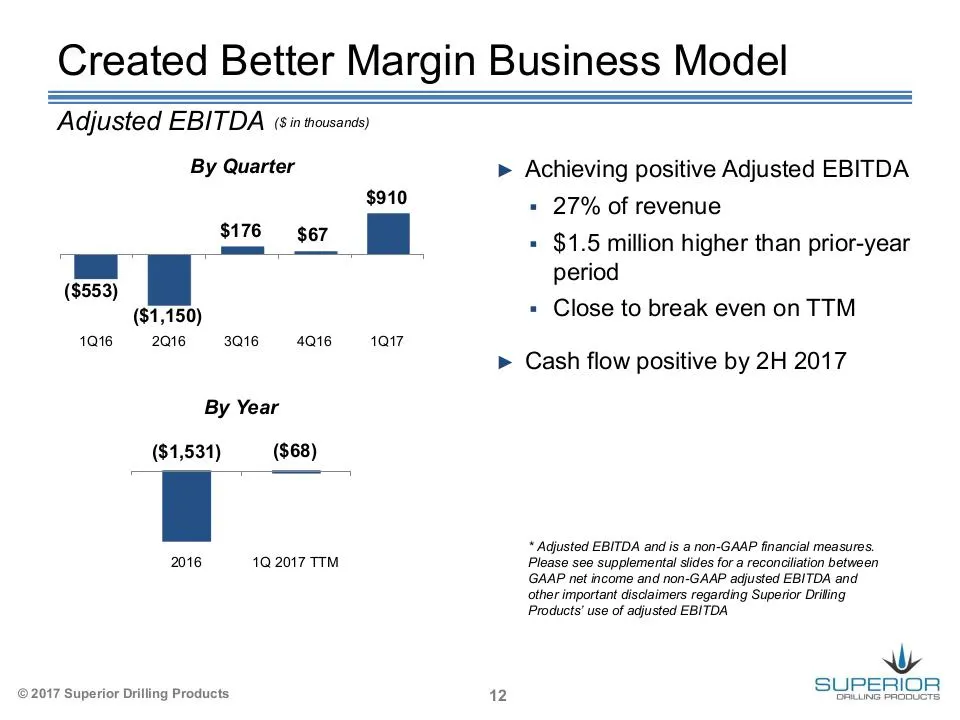
Created Better Margin Business Model Adjusted EBITDA (sia thousands) By Quarter > Achieving positive Adjusted EBITDA $810 * 27% of revenue $176 S8t = $1.5 million higher than prior-year ($553) period ($1,150) = Close to break even on TTM 1016-2016) 3Q1G SS 4Q16 1017 > Cash flow positive by 2H 2017 B
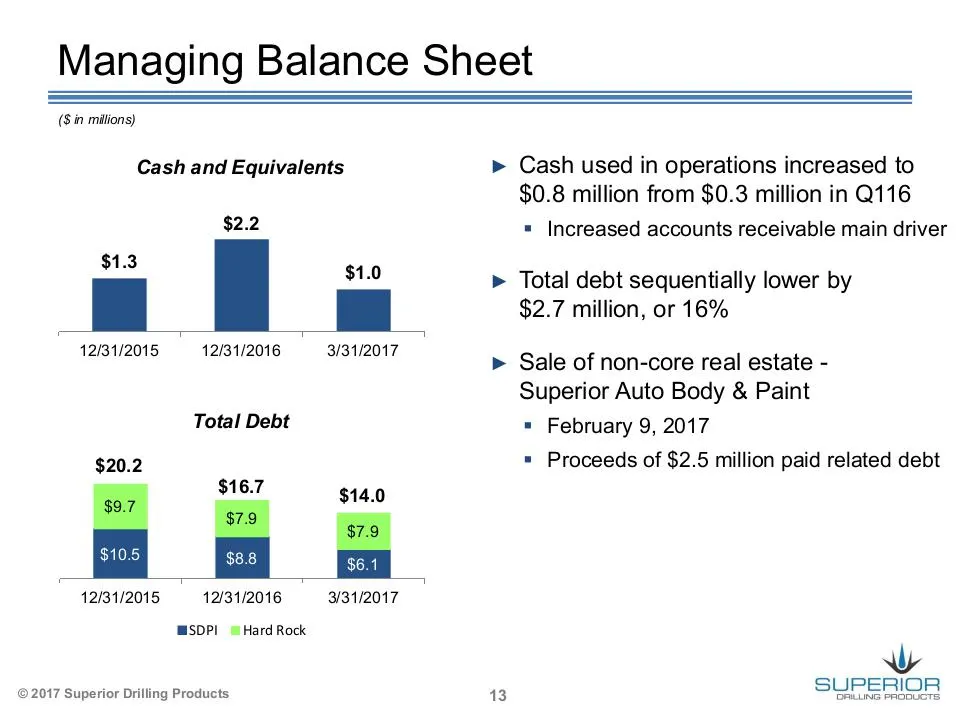
Slide 13: Managing Balance Sheet
Managing Balance Sheet (Sin milion) Cash and Equivalents $2.2 $1.3 $1.0 12/31/2015 12/31/2016 3/31/2017 Total Debt 12/31/2015 12/31/2016 3/31/2017 SDP! = Hard Rock © 2017 Superior Drilling Products > Cash used in operations increased to $0.8 million from $0.3 million in Q116 = Increased accounts rec
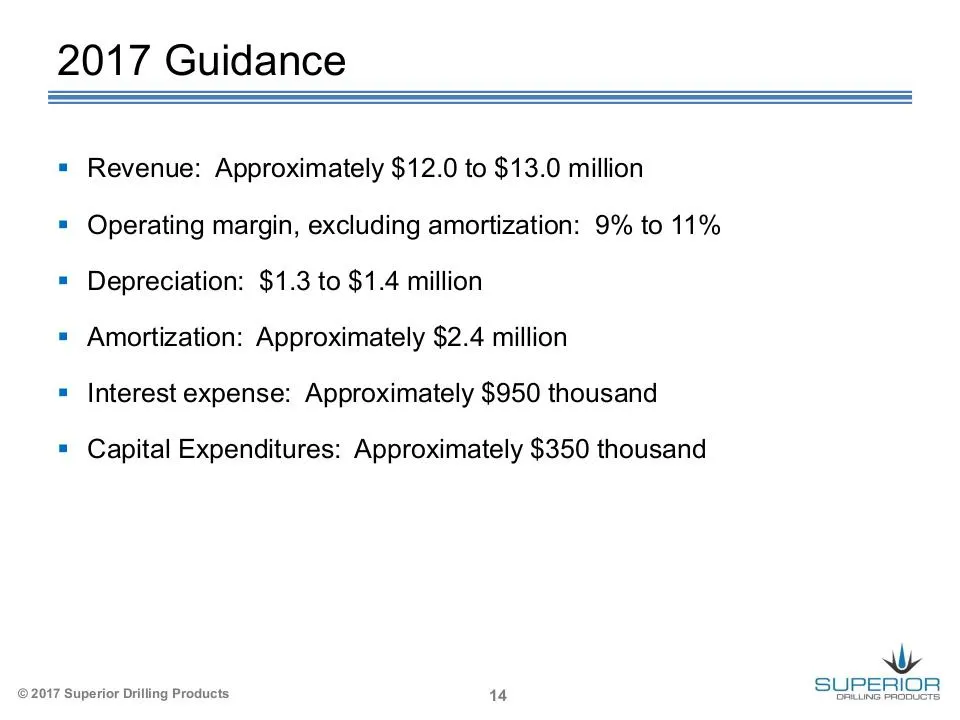
Slide 14: 2017 Guidance
2017 Guidance = Revenue: Approximately $12.0 to $13.0 million * Operating margin, excluding amortization: 9% to 11% = Depreciation: $1.3 to $1.4 million = Amortization: Approximately $2.4 million = Interest expense: Approximately $950 thousand = Capital Expenditures: Approximately $350 thousand © 20
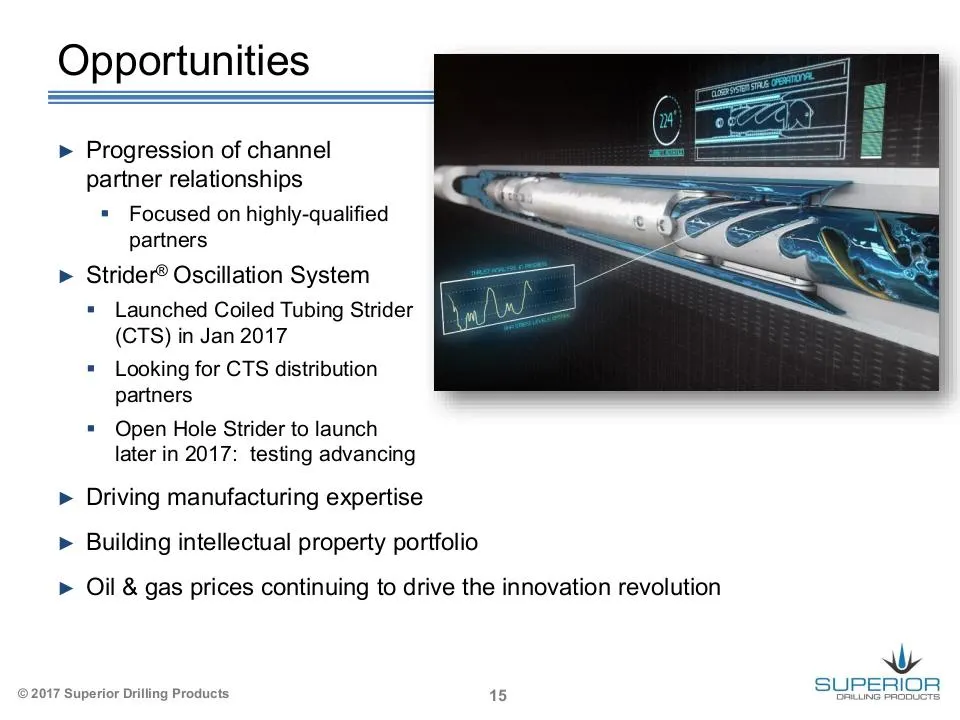
Slide 15: Opportunities
Opportunities > Progression of channel partner relationships * Focused on highly-qualified partners > Strider® Oscillation System * Launched Coiled Tubing Strider (CTS) in Jan 2017 * Looking for CTS distribution partners = Open Hole Strider to launch later in 2017: testing advancing > Driving manufa
Slide 16: Supplemental Information
Supplemental Information NYSE MKT: SDPI © 2017 Superior Drilling Products www.sdpi.com
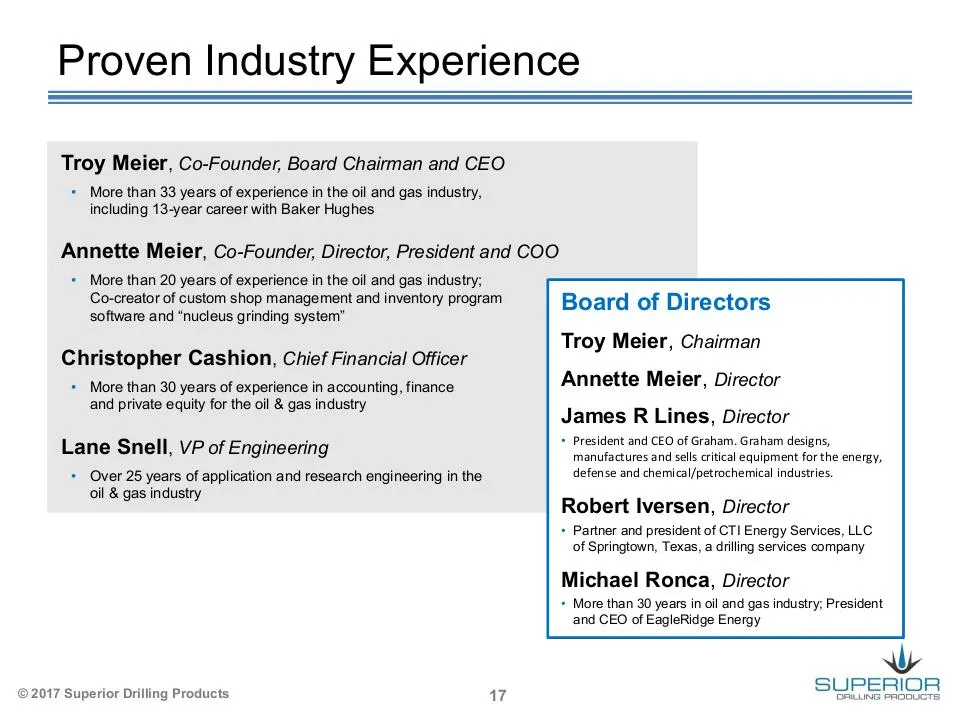
Slide 17: Proven Industry Experience
Proven Industry Experience Troy Meier, Co-Founder, Board Chairman and CEO + More than 33 years of experience in the oil and gas industry, including 13-year career with Baker Hughes Annette Meier, Co-Founder, Director, President and COO + More than 20 years of experience in the oil and gas industry;
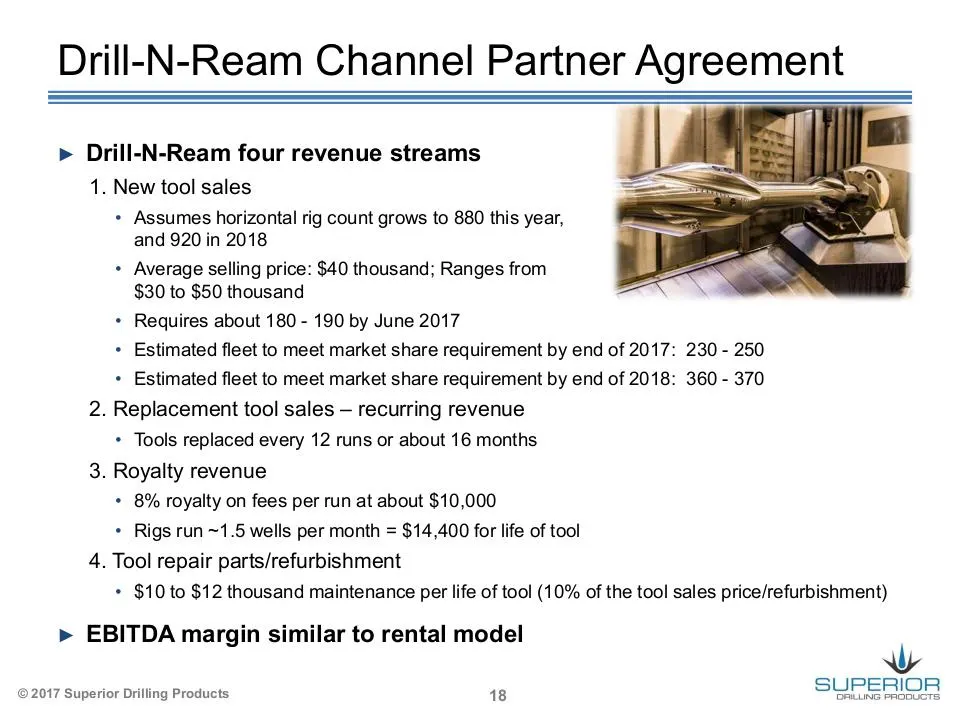
Slide 18: Drill-N-Ream Channel Partner Agreement
Drill-N-Ream Channel Partner Agreement > Drill-N-Ream four revenue streams 1. New tool sales + Assumes horizontal rig count grows to 880 this year, and 920 in 2018 + Average selling price: $40 thousand; Ranges from $30 to $50 thousand + Requires about 180 - 190 by June 2017 + Estimated fleet to meet
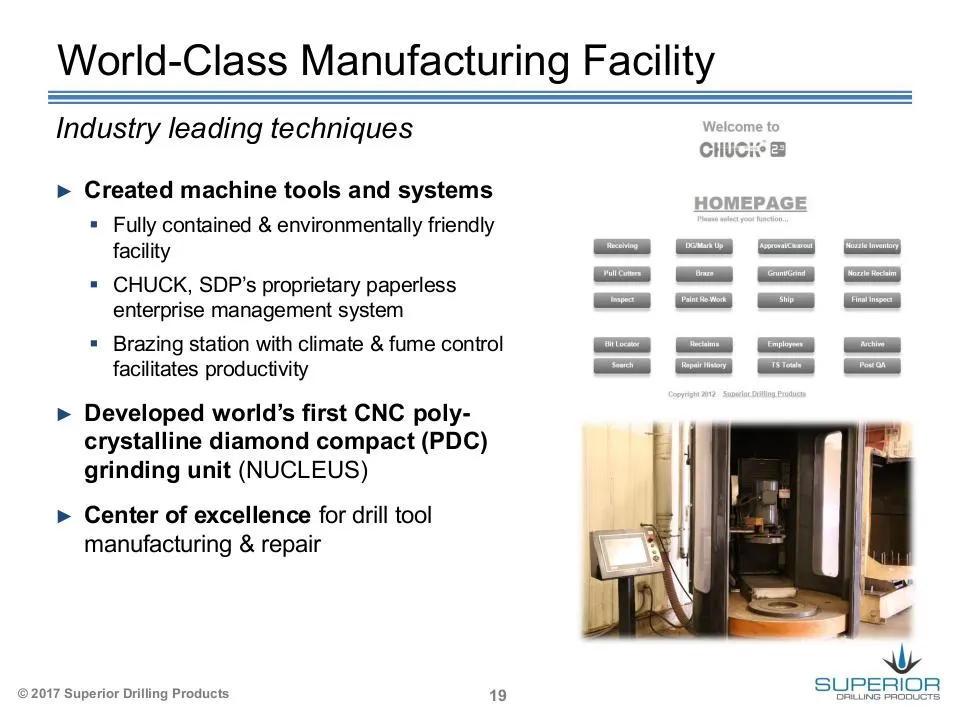
Slide 19: World-Class Manufacturing Facility
World-Class Manufacturing Facility Industry leading techniques > Created machine tools and systems * Fully contained & environmentally friendly facility = CHUCK, SDP’s proprietary paperless enterprise management system = Brazing station with climate & fume control facilitates productivity > Develope
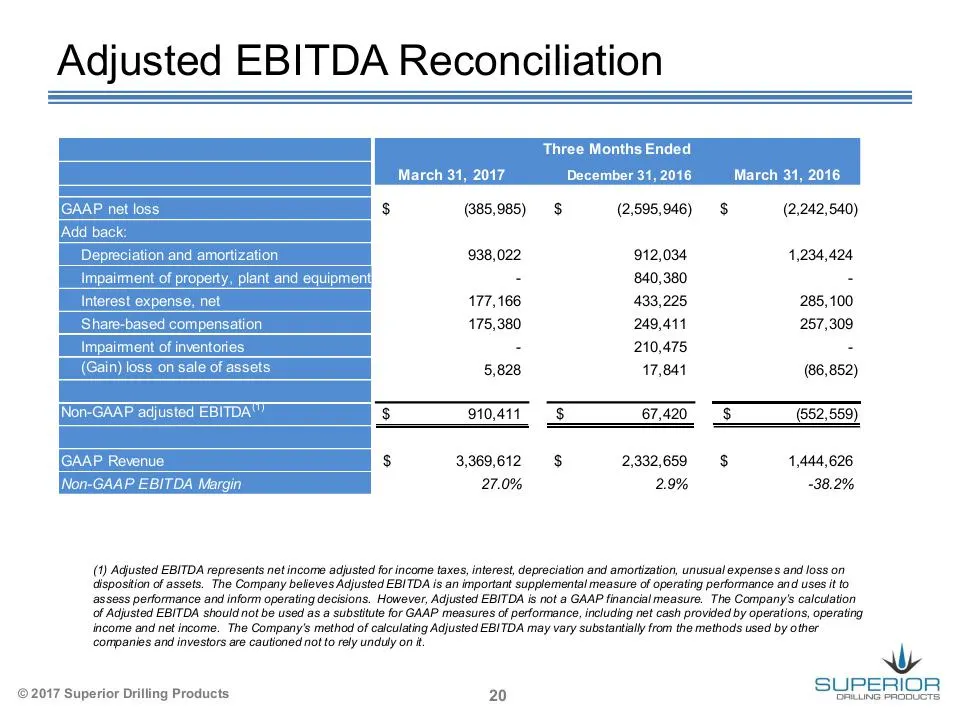
Slide 20: Adjusted EBITDA Reconciliation
Adjusted EBITDA Reconciliation Three Months End March 31, 2017 December 31, 2016 March 31, 2016 s —@25,965) 908,022 12.0% 1204428 (2,595,946) $ (2,242,540) Impairment of property, plant and equipment - 840,380 - 177,166 433,225 285,100 175,380 249,411 287,309 : 210,475 “ (¢ 5,828 17,841 (86,852) $ 9
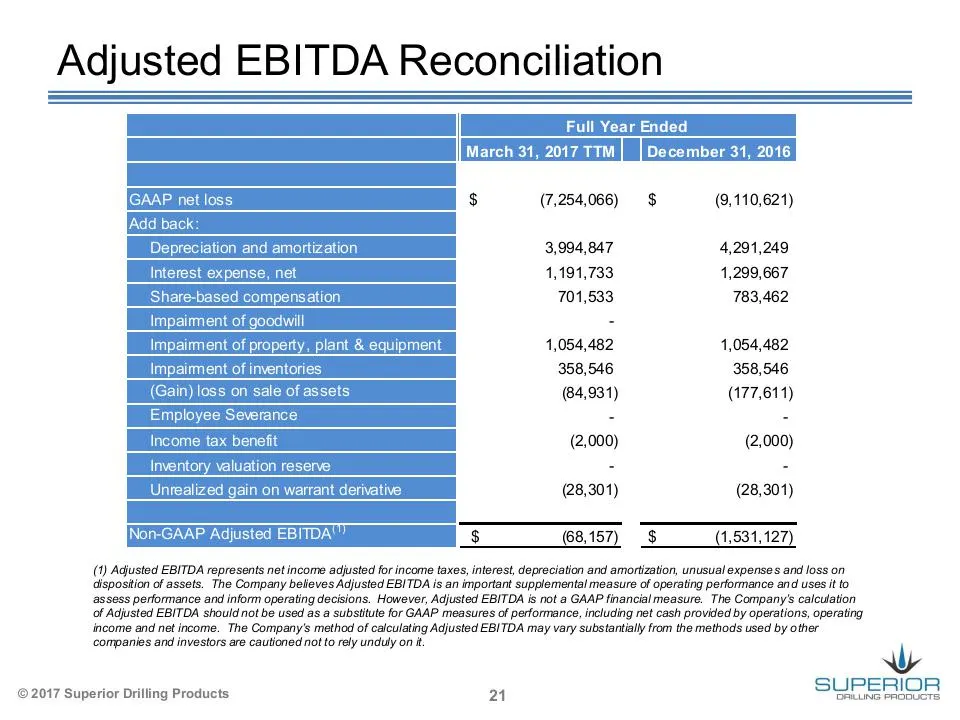
Slide 21: Adjusted EBITDA Reconciliation
Adjusted EBITDA Reconciliation Full Year Ended March 31, 2017 TTM |_| December 31, 2016 IGAAP net loss $ (7,254,066) $ (9,110,621) Z| > & a 2 >| Ea 5 Depreciation and amortization 3,994,847 4,291,249 Interest expense, net 1,191,733 1,299,667 Share-based compensation 701,533 783,462 Impairment of goo
Source: SEC EDGAR · 8-K filed May 18, 2017
More decks from Superior Drilling Products Inc
 Q3 2023 Earnings Presentation12 slides · Nov 9, 2023
 Q2 2023 Earnings Presentation12 slides · Aug 14, 2023
 Q1 2023 Earnings Presentation12 slides · May 15, 2023
 FY2022 Earnings Presentation13 slides · Mar 10, 2023
 Q3 2022 Earnings Presentation12 slides · Nov 14, 2022
 MicroCap Rodeo Windy City Roundup 202220 slides · Oct 12, 2022