Dye & Durham Ltd. · TSX:DND
Dye & Durham — Q4 FY2023 Earnings Presentation
14 slides from Dye & Durham's earnings presentation, Sep 13, 2023

Slide 1: Q4 & YE FY2023 Results Presentation
Q4 & YE FY2023 RESULTS PRESENTATION September 13, 2023 When being certain is everything dyedurham.com dyedurham.com
Slide 2: Disclaimer
ibdroot\projects\IBD-NY\driveins2022\902367_1\Presentations\05. Lender Presentation\DND Private LP - November 2022_v26.pptx DISCLAIMER This presentation has been prepared for informational purposes only. These materials are not, and in no circumstances are they to be construed as, a prospectus, an o
Slide 3: Disclaimer (Cont'd)
ibdroot\projects\IBD-NY\driveins2022\902367_1\Presentations\05. Lender Presentation\DND Private LP - November 2022_v26.pptx DISCLAIMER (CONT’D) Many of these risks are beyond the Company’s control. If any of these risks or uncertainties materialize, or if the opinions, estimates or assumptions under
Slide 4: Q4 & YE FY2023 Business Highlights
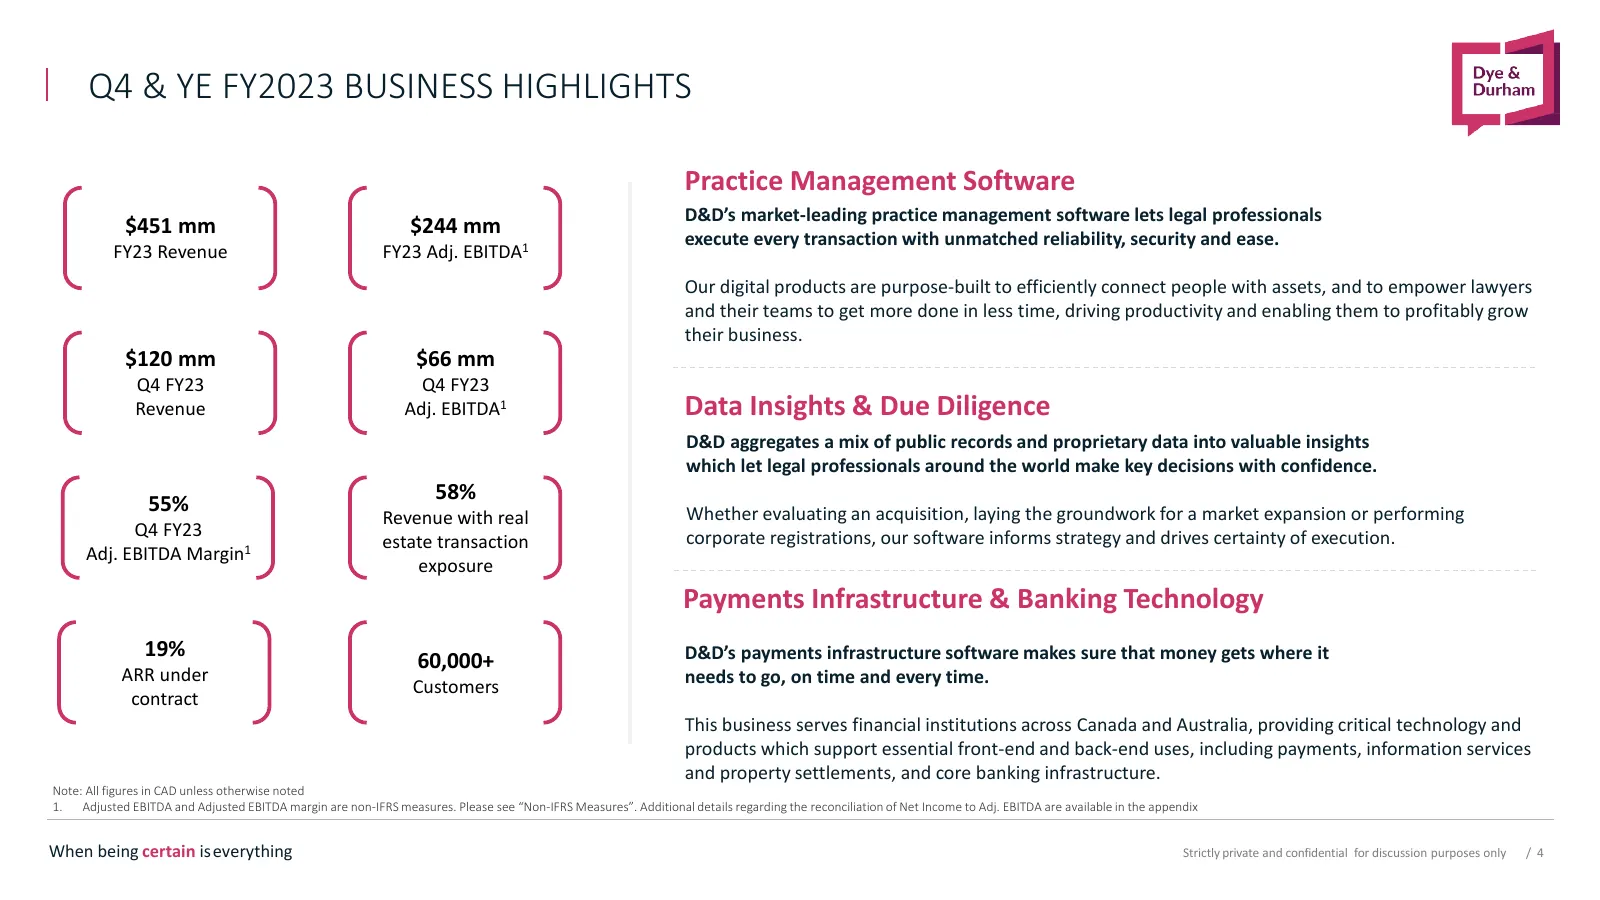
ibdroot\projects\IBD-NY\driveins2022\902367_1\Presentations\05. Lender Presentation\DND Private LP - November 2022_v26.pptx Q4 & YE FY2023 BUSINESS HIGHLIGHTS Practice Management Software D&D’s market-leading practice management software lets legal professionals $451 mm $244 mm execute every transac
Slide 5: Growth in Annual Recurring Contractual Revenue
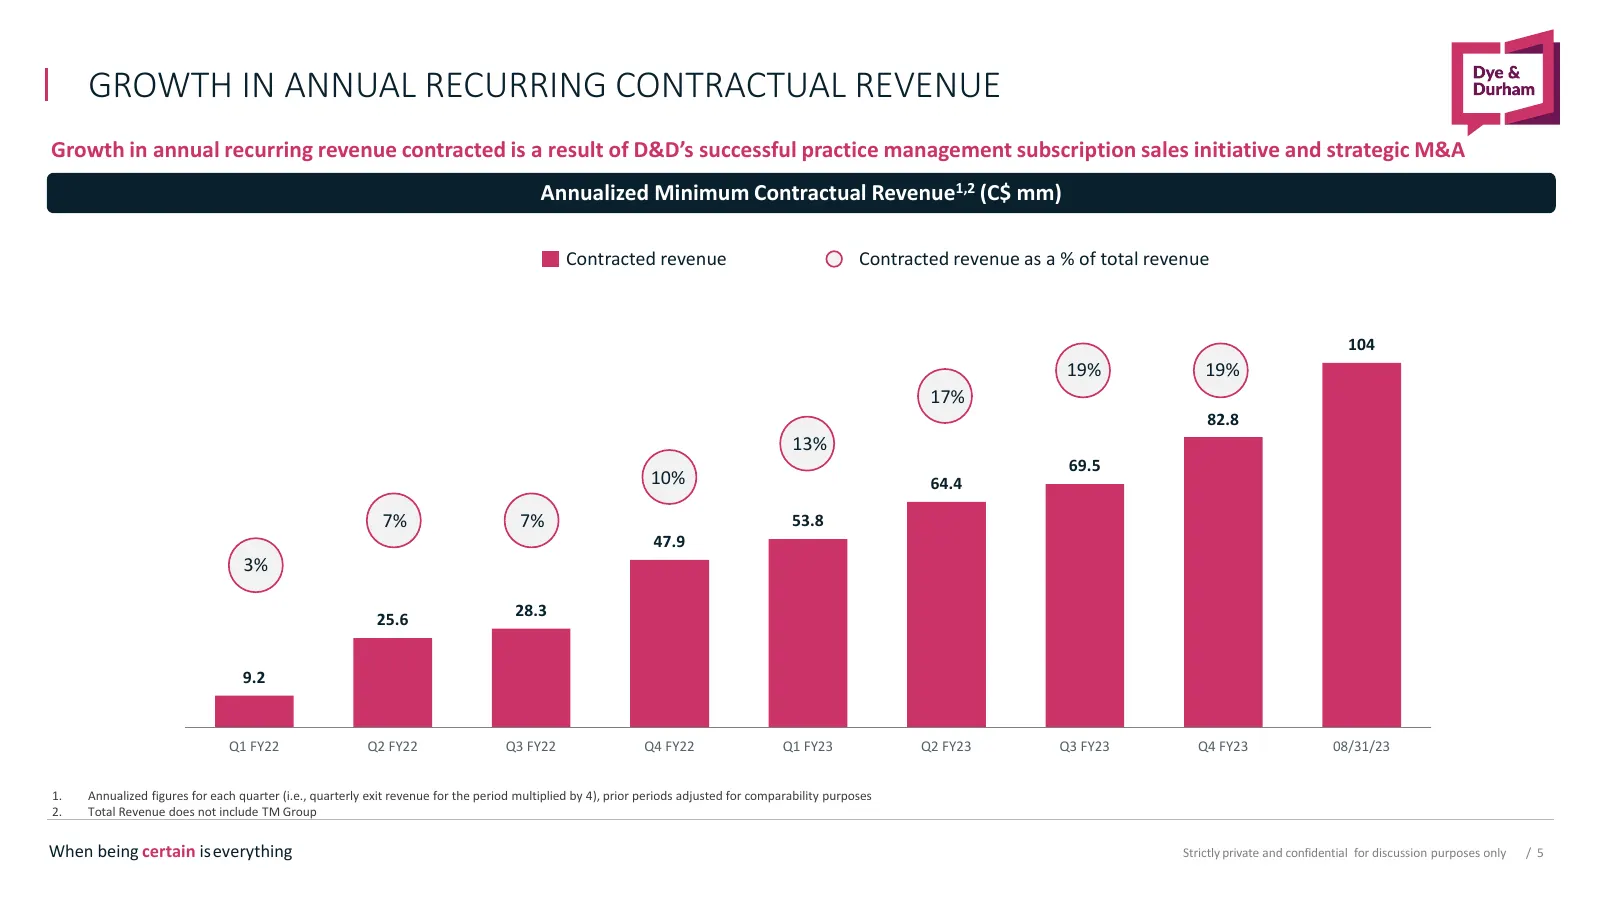
GROWTH IN ANNUAL RECURRING CONTRACTUAL REVENUE Growth in annual recurring revenue contracted is a result of D&D’s successful practice management subscription sales initiative and strategic M&A Annualized Minimum Contractual Revenue1,2 (C$ mm) Contracted revenue Contracted revenue as a % of total rev
Slide 6: Full Suite of Market Leading Legal Software
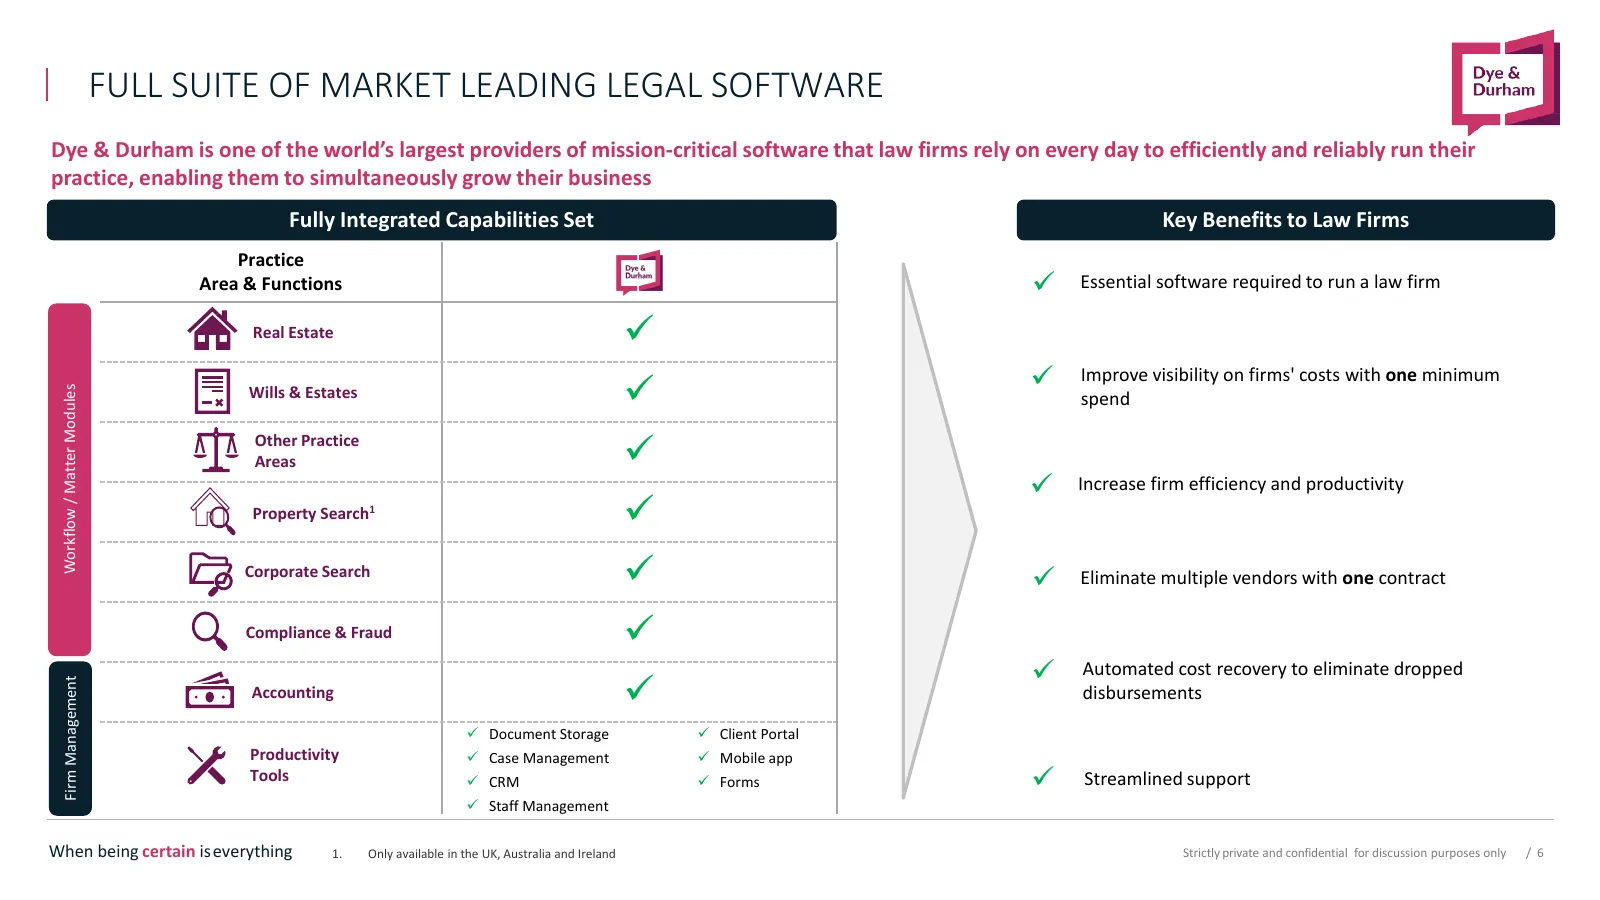
ibdroot\projects\IBD-NY\driveins2022\902367_1\Presentations\05. Lender Presentation\DND Private LP - November 2022_v26.pptx FULL SUITE OF MARKET LEADING LEGAL SOFTWARE Dye & Durham is one of the world’s largest providers of mission-critical software that law firms rely on every day to efficiently an
Slide 7: Strong Track Record of Executing and Integrating Acquisitions
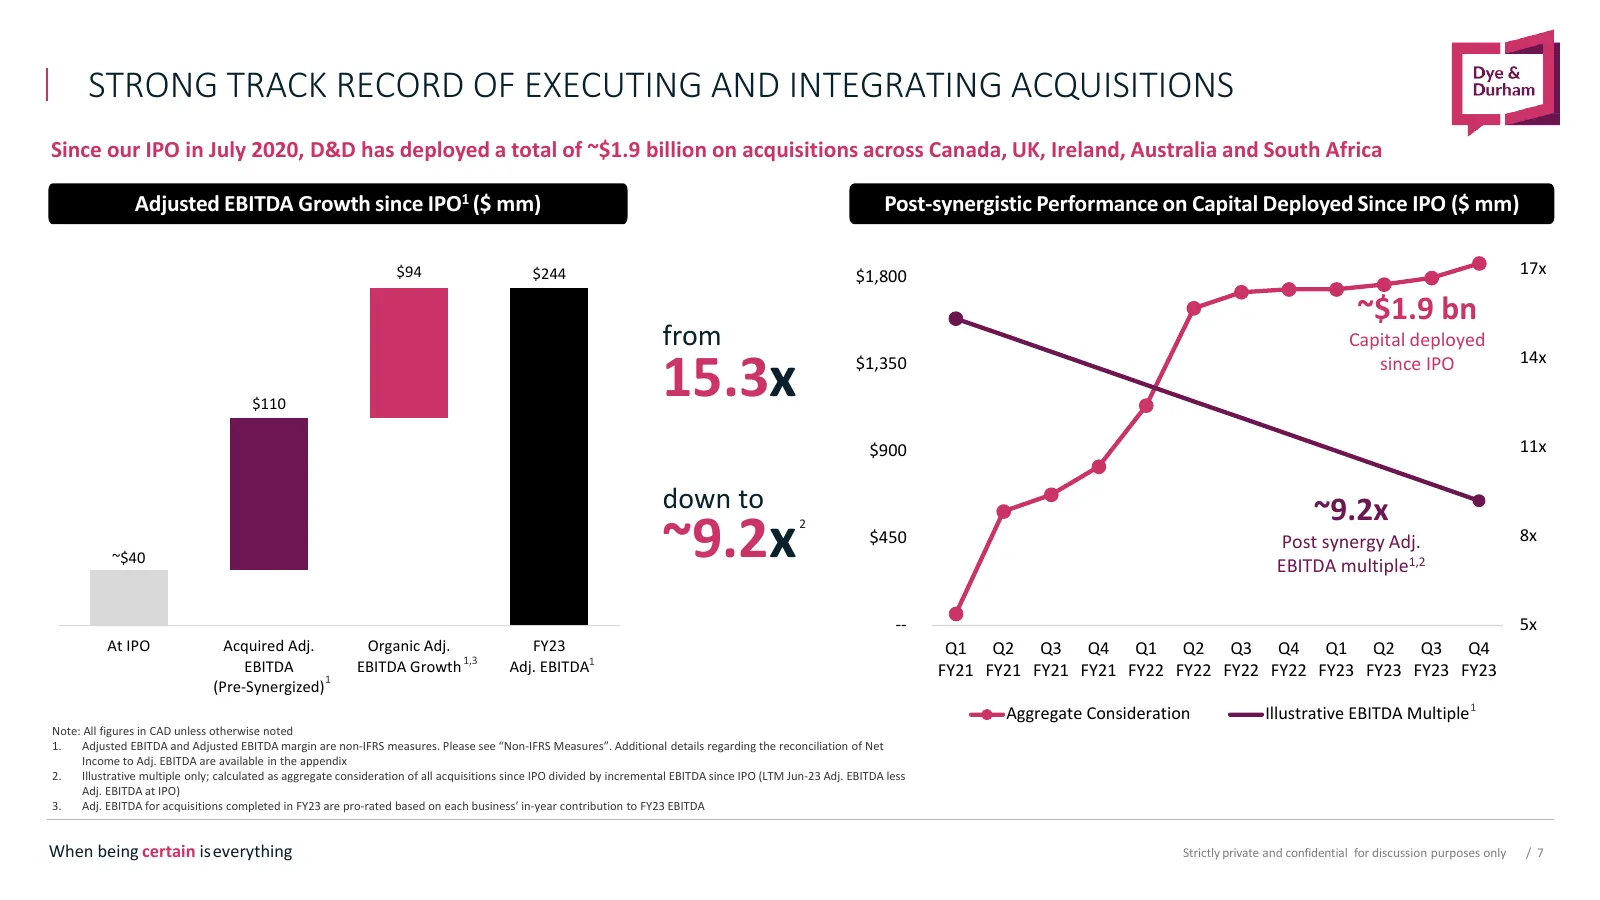
ibdroot\projects\IBD-NY\driveins2022\902367_1\Presentations\05. Lender Presentation\DND Private LP - November 2022_v26.pptx STRONG TRACK RECORD OF EXECUTING AND INTEGRATING ACQUISITIONS Since our IPO in July 2020, D&D has deployed a total of ~$1.9 billion on acquisitions across Canada, UK, Ireland,
Slide 8: Strategic Plan
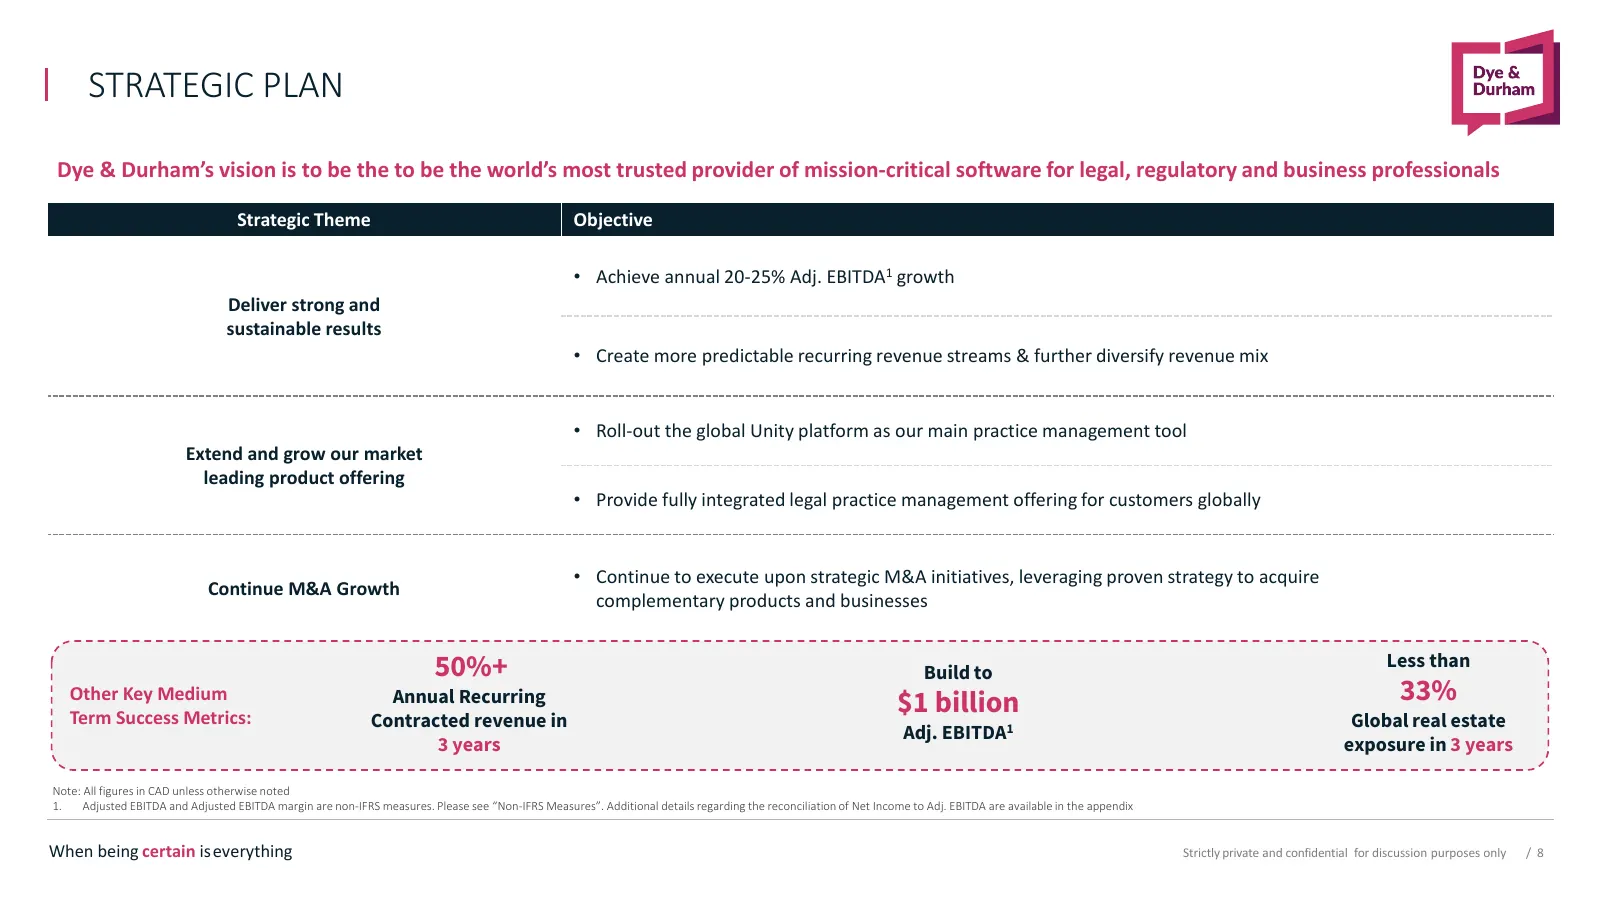
STRATEGIC PLAN Dye & Durham’s vision is to be the to be the world’s most trusted provider of mission-critical software for legal, regulatory and business professionals Strategic Theme Objective • Achieve annual 20-25% Adj. EBITDA1 growth Deliver strong and sustainable results • Create more predictab
Slide 9: Leading Performance, Lagging Valuation
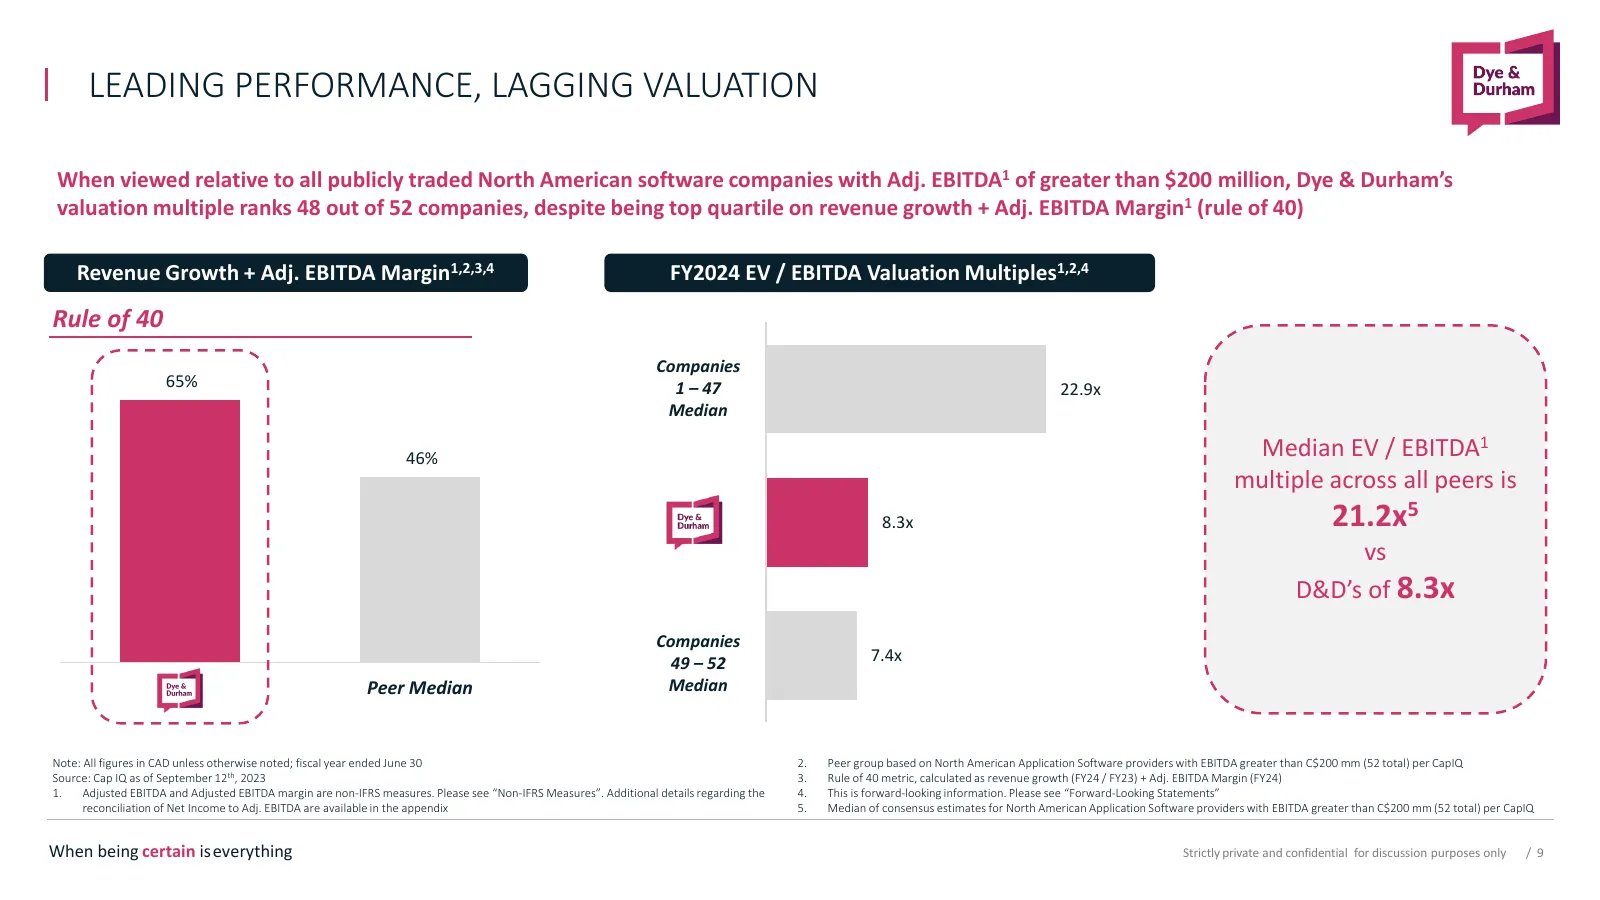
LEADING PERFORMANCE, LAGGING VALUATION When viewed relative to all publicly traded North American software companies with Adj. EBITDA1 of greater than $200 million, Dye & Durham’s valuation multiple ranks 48 out of 52 companies, despite being top quartile on revenue growth + Adj. EBITDA Margin1 (rul
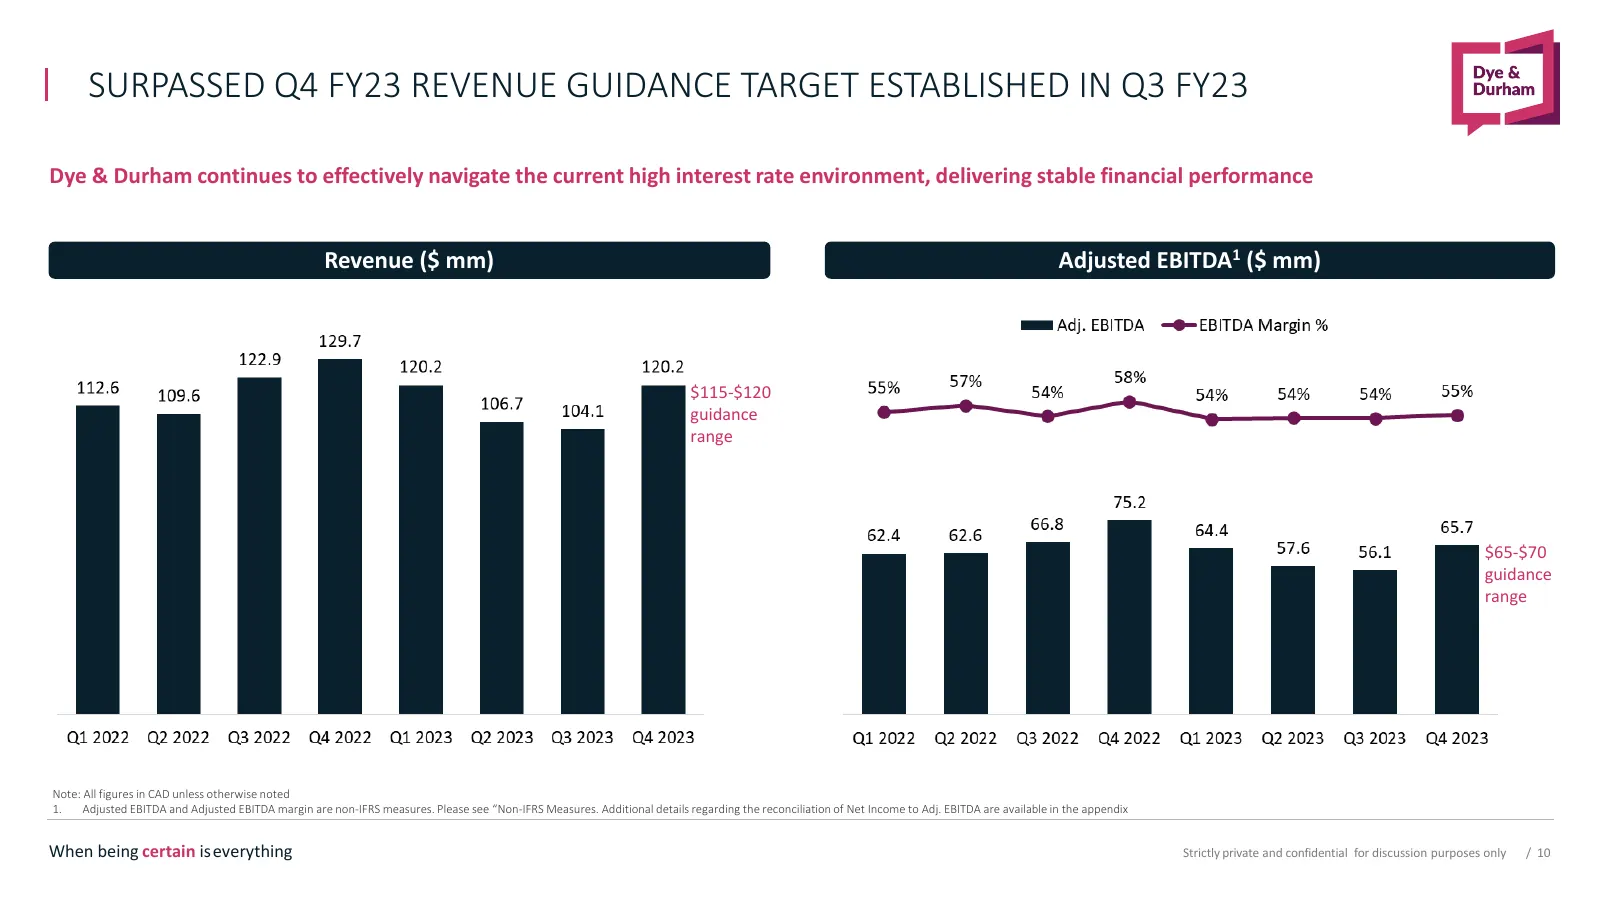
Slide 10: Surpassed Q4 FY23 Revenue Guidance Target Established in Q3 FY23
SURPASSED Q4 FY23 REVENUE GUIDANCE TARGET ESTABLISHED IN Q3 FY23 Dye & Durham continues to effectively navigate the current high interest rate environment, delivering stable financial performance Revenue ($ mm) Adjusted EBITDA1 ($ mm) $115-$120 guidance range $65-$70 guidance range Note: All figures
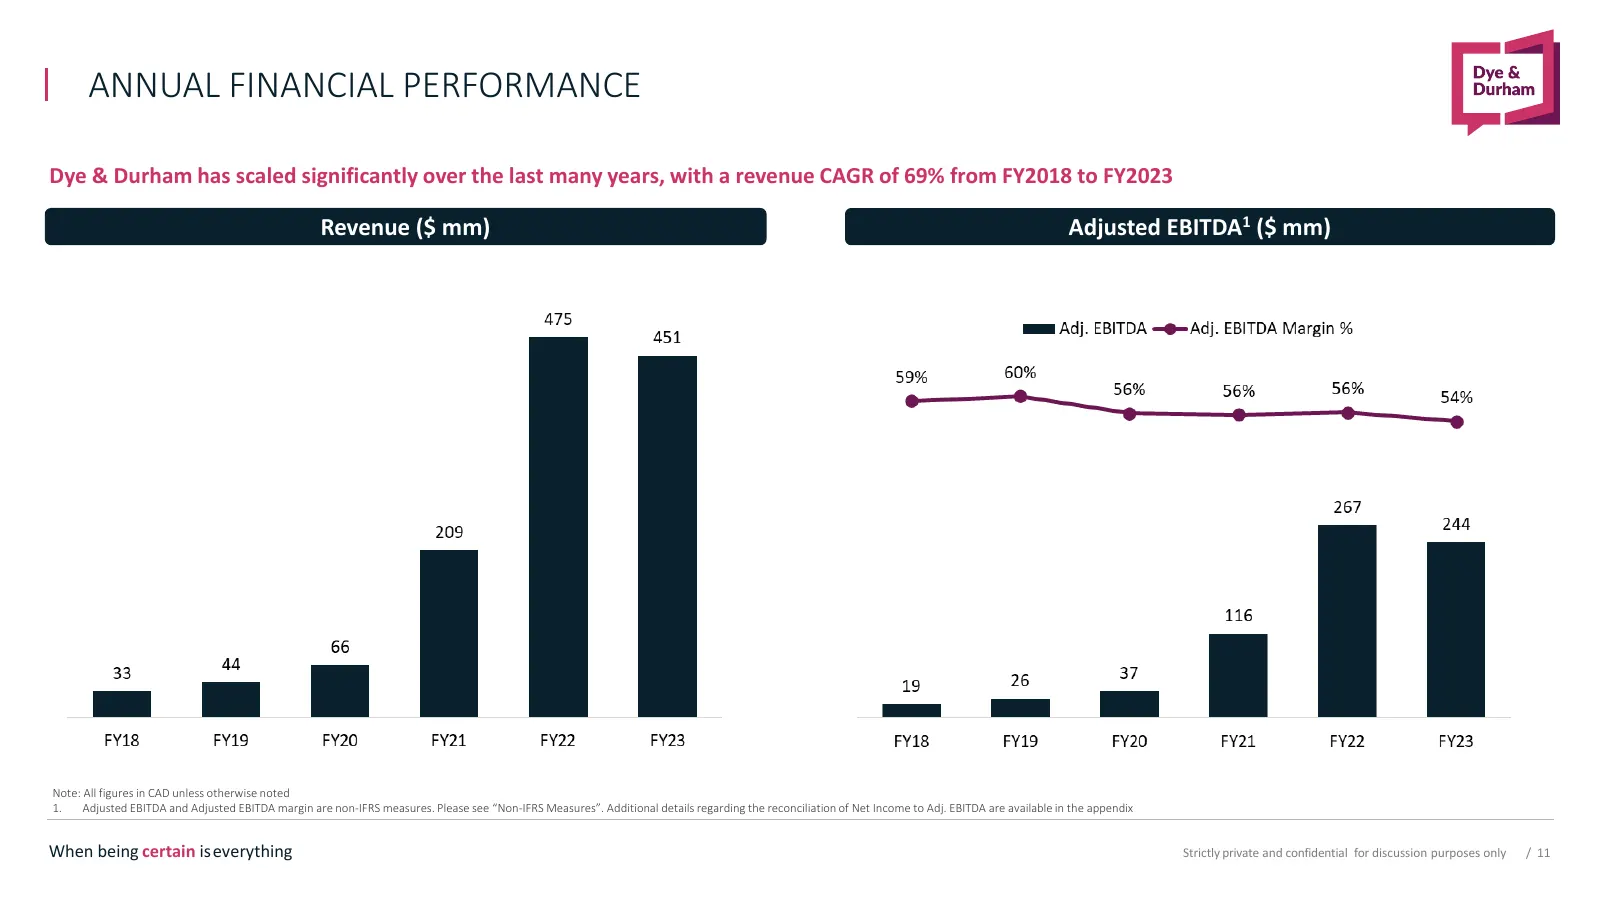
Slide 11: Annual Financial Performance
ANNUAL FINANCIAL PERFORMANCE Dye & Durham has scaled significantly over the last many years, with a revenue CAGR of 69% from FY2018 to FY2023 Revenue ($ mm) Adjusted EBITDA1 ($ mm) Note: All figures in CAD unless otherwise noted 1. Adjusted EBITDA and Adjusted EBITDA margin are non-IFRS measures. Pl
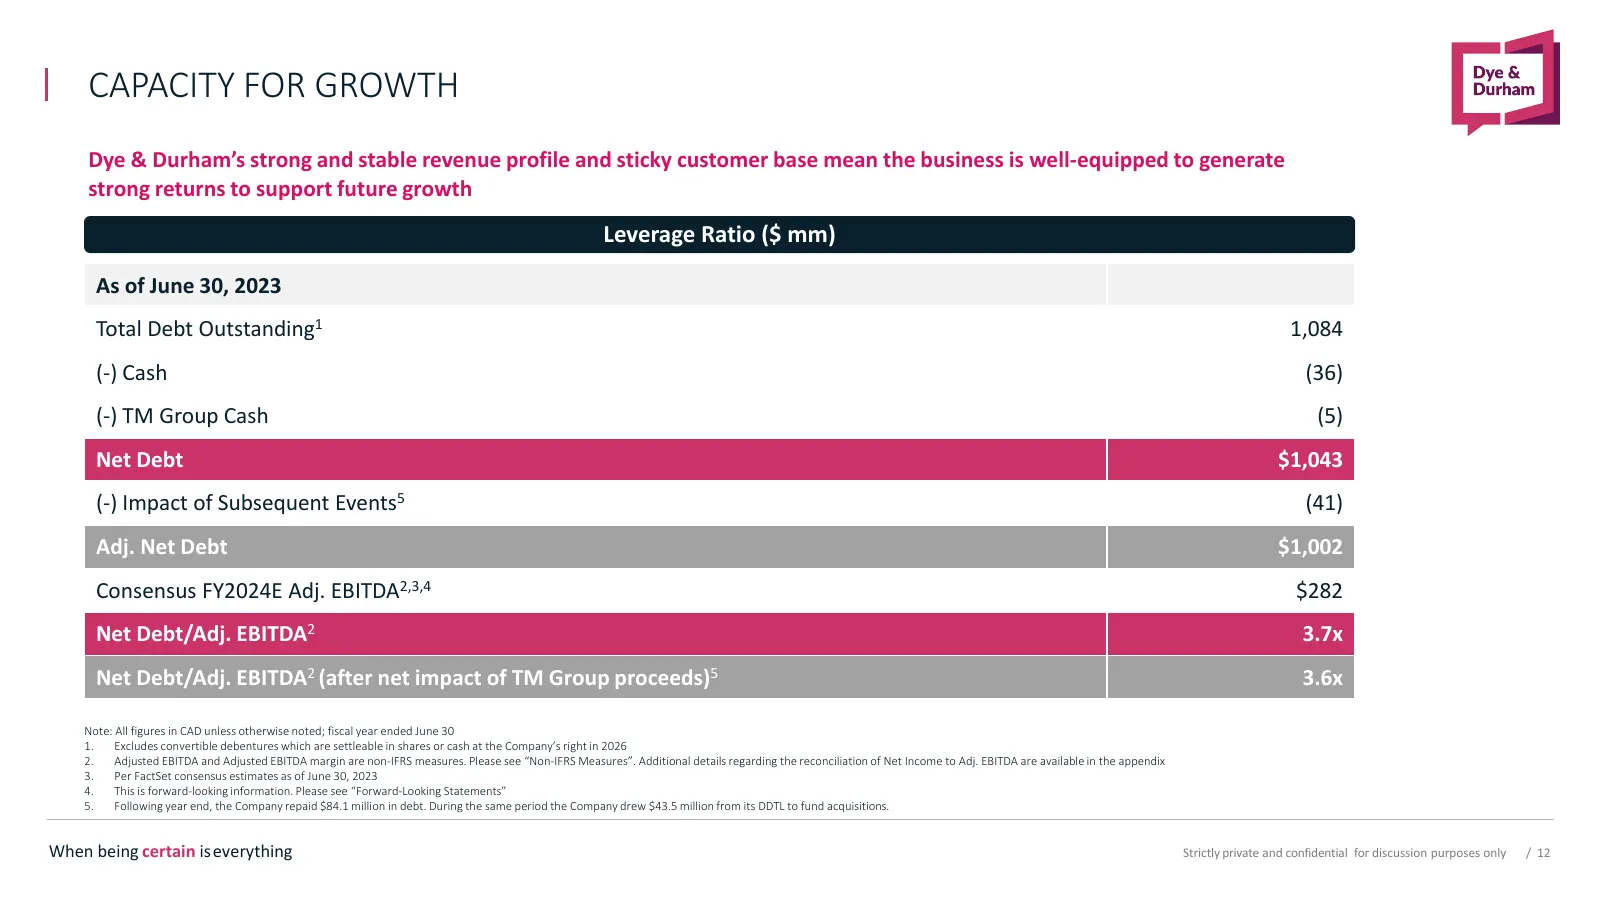
Slide 12: Capacity for Growth
CAPACITY FOR GROWTH Dye & Durham’s strong and stable revenue profile and sticky customer base mean the business is well-equipped to generate strong returns to support future growth Leverage Ratio ($ mm) As of June 30, 2023 Total Debt Outstanding1 1,084 (-) Cash (36) (-) TM Group Cash (5) Net Debt $1

Slide 13: Appendix
APPENDIX When being certain iseverything is everything Strictly private private and and confidential confidential for for discussion discussion purposes purposes only only / 1313
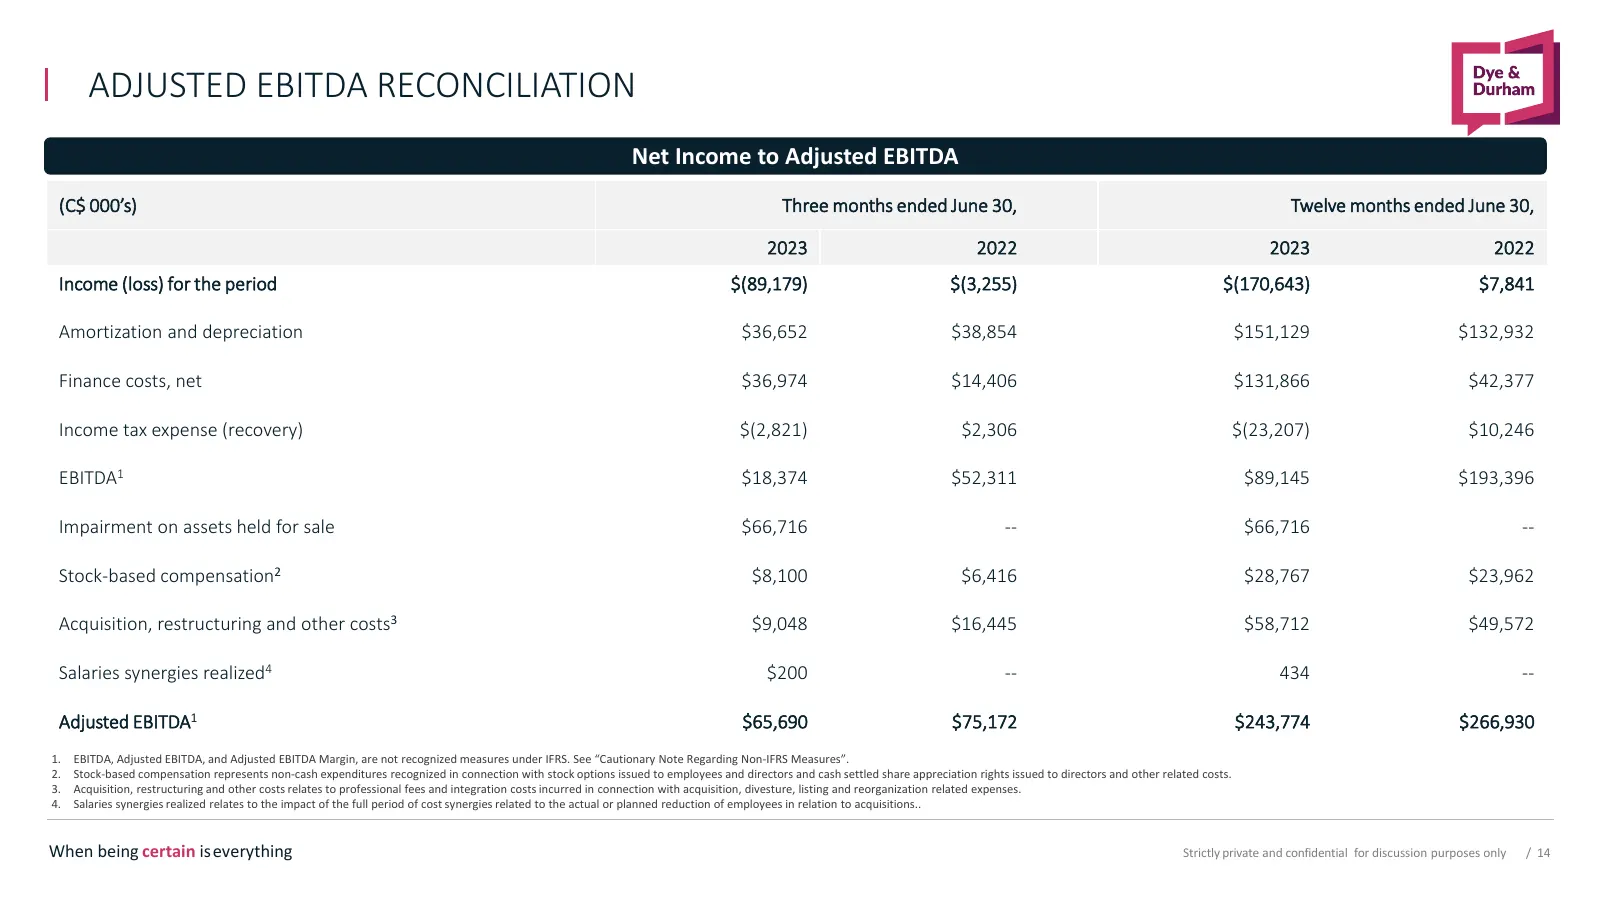
Slide 14: Adjusted EBITDA Reconciliation
ADJUSTED EBITDA RECONCILIATION Net Income to Adjusted EBITDA (C$ 000’s) Three months ended June 30, Twelve months ended June 30, 2023 2022 2023 2022 Income (loss) for the period $(89,179) $(3,255) $(170,643) $7,841 Amortization and depreciation $36,652 $38,854 $151,129 $132,932 Finance costs, net $3
Source: Internet Archive copy of dyedurham.com
More decks from Dye & Durham Ltd.
 Q4 2026 Earnings Presentation11 slides · Sep 30, 2026
 Q3 FY2026 Earnings Presentation12 slides · May 19, 2026
 Q2 2026 Earnings Presentation18 slides · Feb 17, 2026
 Q3 2025 Earnings Presentation17 slides · May 13, 2025
 Q2 FY2025 Earnings Presentation15 slides · Feb 13, 2025
 Proxy Contest (December 2024)85 slides · Dec 10, 2024