Superior Drilling Products Inc
Superior Drilling Products — Q2 2017 Earnings Presentation
17 slides from Superior Drilling Products's earnings presentation, Aug 14, 2017

Slide 1: Second Quarter 2017 Financial Results Conference Call
Second Quarter 2017 Financial Results Conference Call August 11, 2017 NYSE American: SDPI © 2017 Superior Drilling Products
Slide 2: Safe Harbor Statement
Safe Harbor Statement These slides and the accompanying oral presentation contain “forward-looking statements” within the meaning of the safe harbor provisions, 15 U.S.C. § 78u-5, of the Private Securities Litigation Reform Act of 1995. All statements, other than statements of historical fact includ
Slide 3: Troy Meier, Chairman and Chief Executive Officer
DRILLING PRODUCTS Troy Meier Chairman and Chief Executive Officer © 2017 Superior Drilling Products
Slide 4: Second Quarter 2017 Highlights
Second Quarter 2017 Highlights Exceptional financial results = Demonstrated significant leverage gained on higher volume = Channel partner achieved 10% Drill-N-Ream® (DnR) market share goal = Measurable improvement in operating income and margin = Strong revenue conversion: Net income of $307 thousa
Slide 5: Financial Results
Financial Results Christopher D. Cashion Chief Financial Officer © 2017 Superior Drilling Products
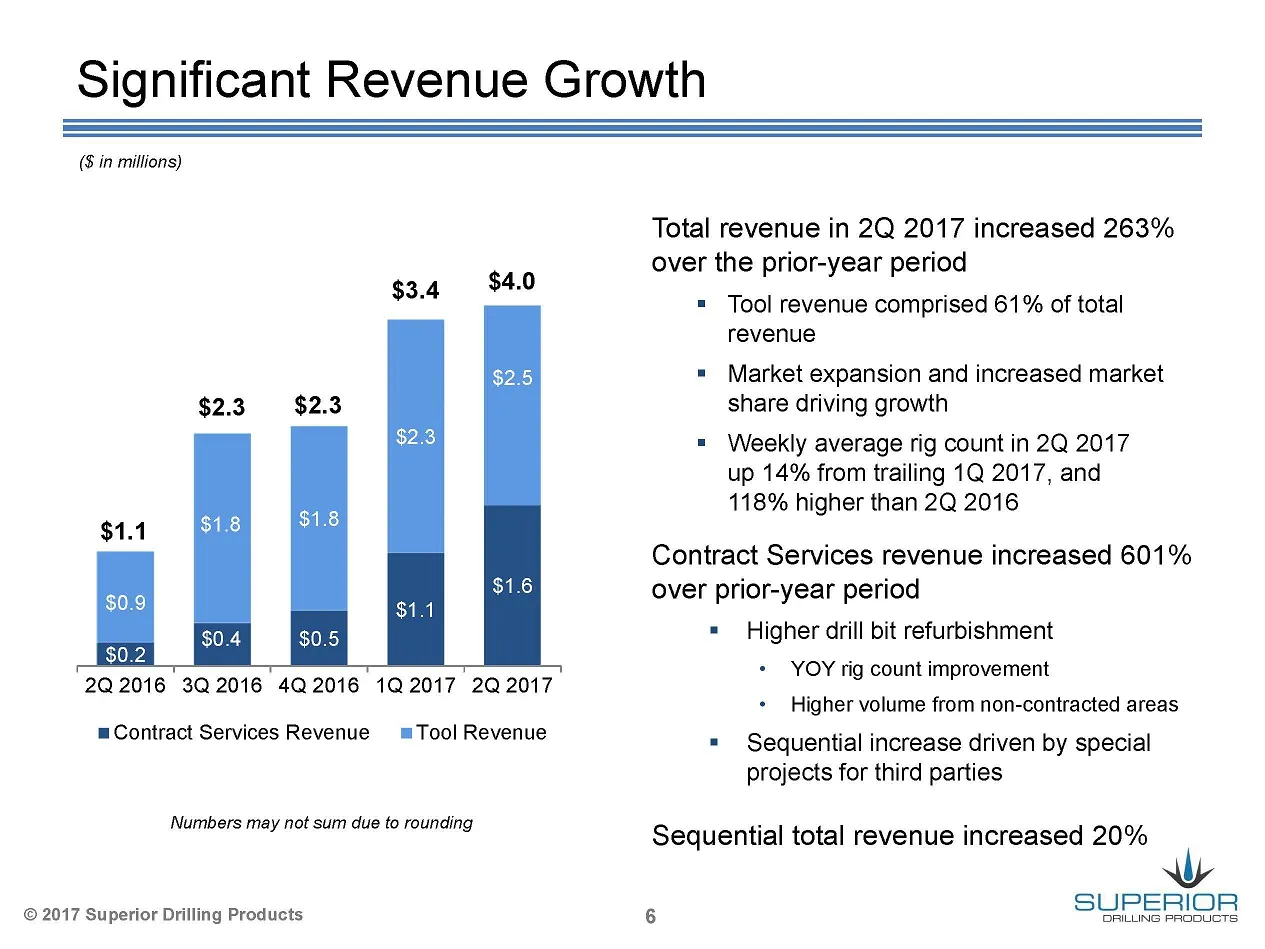
Slide 6: Significant Revenue Growth
Significant Revenue Growth ($ in millions) $3.4 $4.0 $2.3 $2.3 $2.3 $1.1 $1.8 $14 $0.4 2Q 2016 3Q2016 4Q2016 1Q2017 2Q 2017 mContract Services Revenue s=Tool Revenue Numbers may not sum due to rounding © 2017 Superior Drilling Products Total revenue in 2Q 2017 increased 263% over the prior-year peri
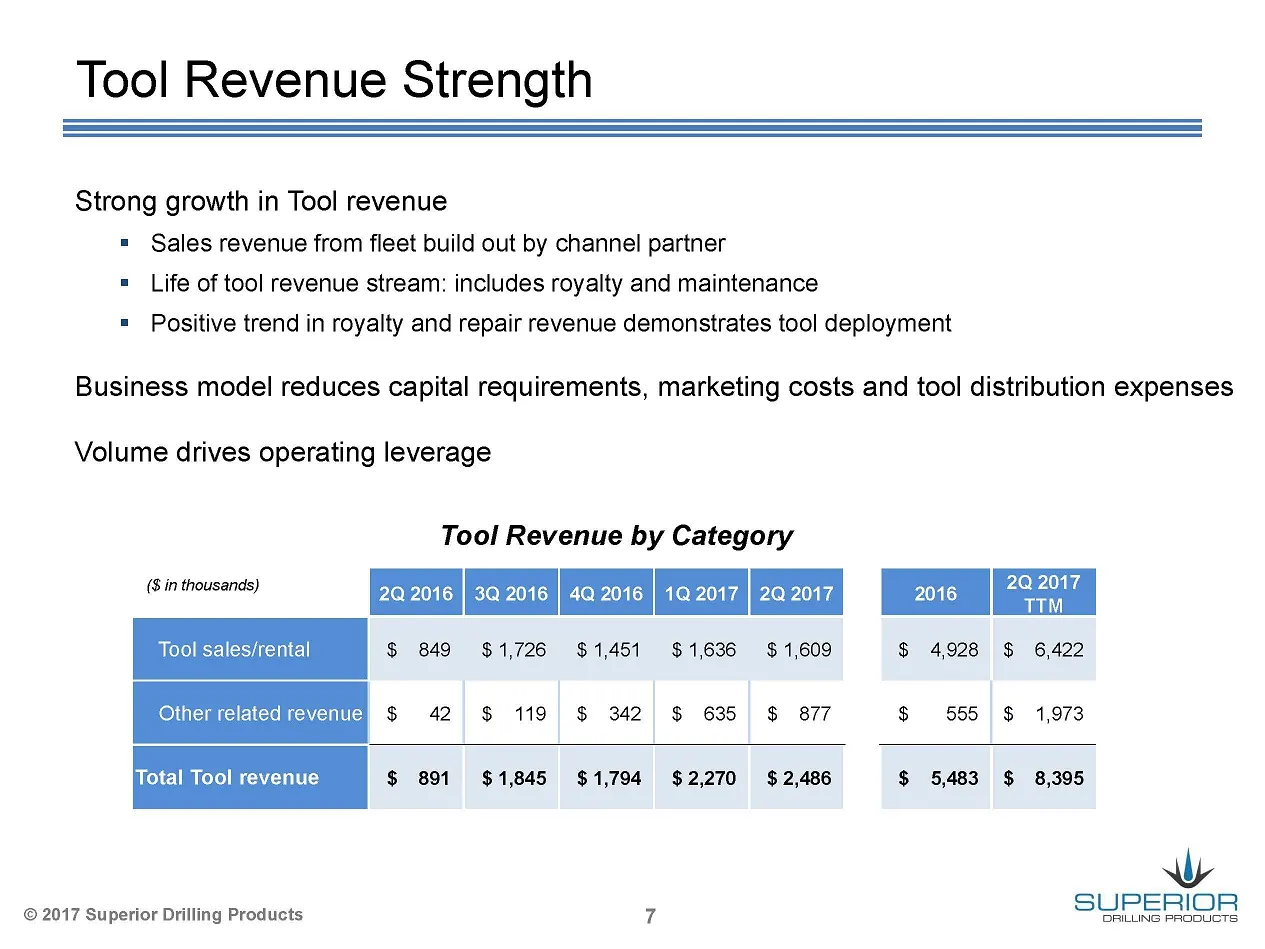
Slide 7: Tool Revenue Strength
Tool Revenue Strength Strong growth in Tool revenue = Sales revenue from fleet build out by channel partner = Life of tool revenue stream: includes royalty and maintenance = Positive trend in royalty and repair revenue demonstrates tool deployment Business model reduces capital requirements, marketi
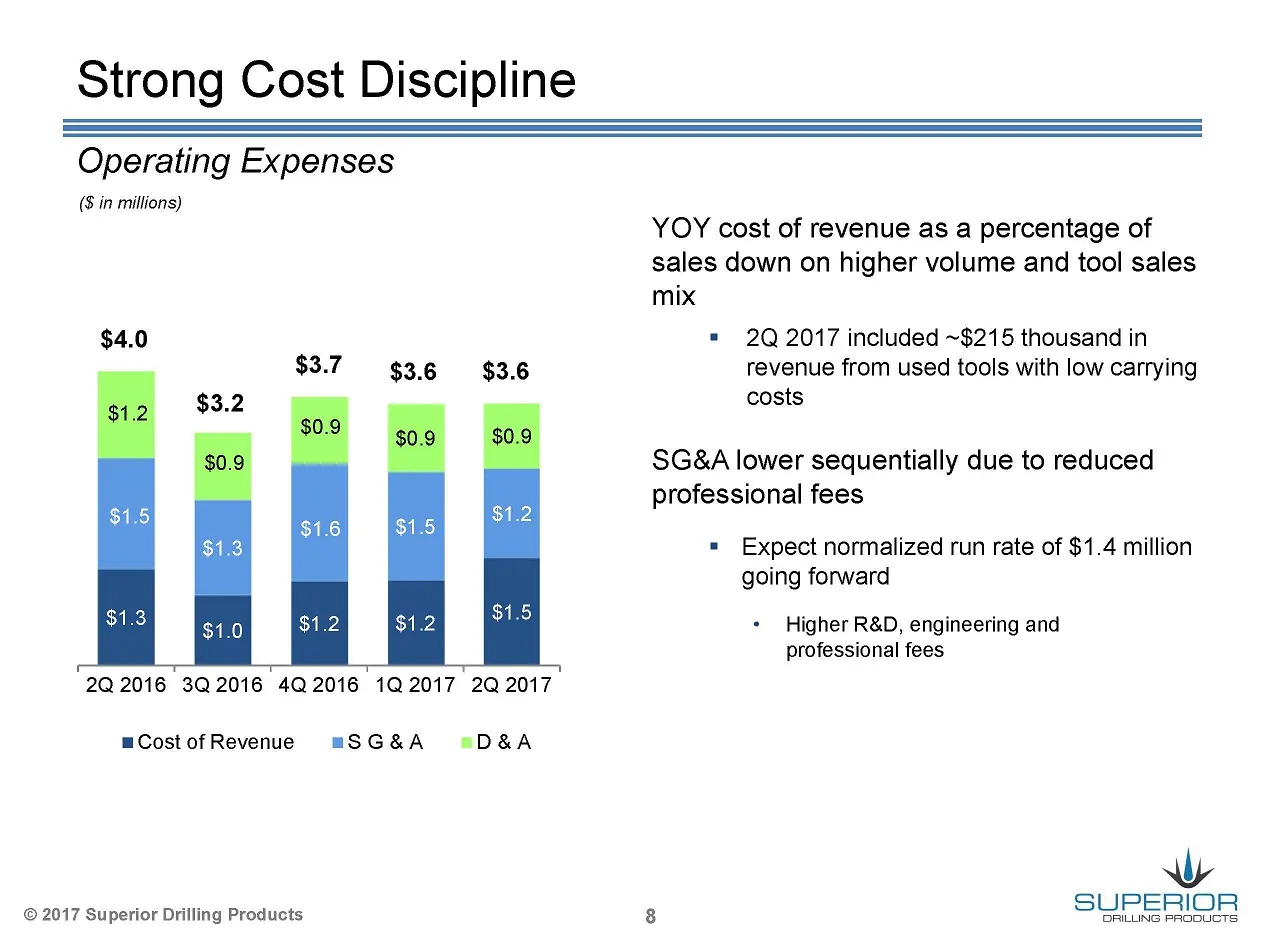
Slide 8: Strong Cost Discipline
Strong Cost Discipline Operating Expenses ($ in millions) YOY cost of revenue as a percentage of sales down on higher volume and tool sales mix $4.0 = 2Q 2017 included ~$215 thousand in revenue from used tools with low carrying costs SG&A lower sequentially due to reduced professional fees = Expect
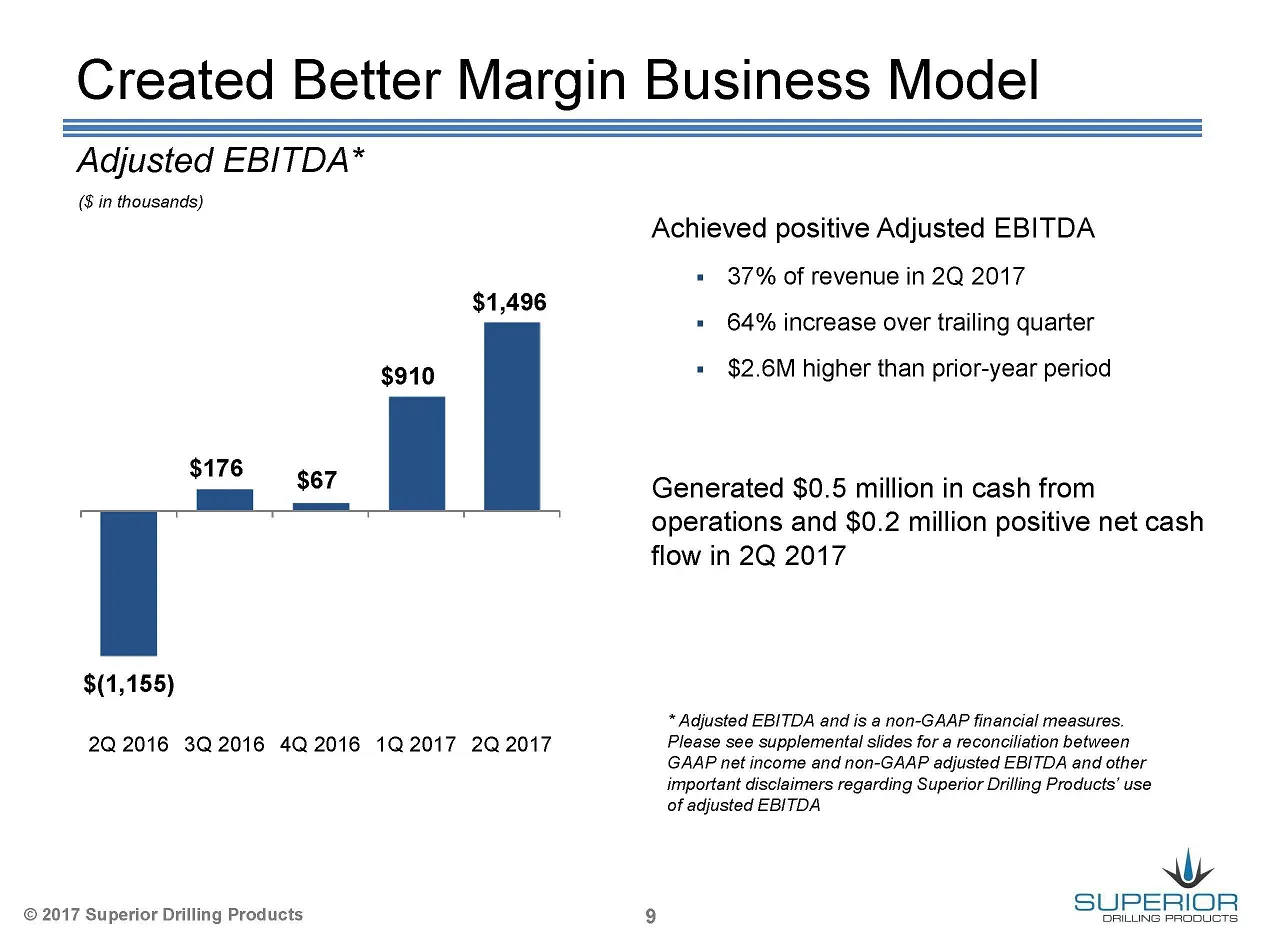
Slide 9: Created Better Margin Business Model
Created Better Margin Business Model Adjusted EBITDA* ($ in thousands) Achieved positive Adjusted EBITDA = 37% of revenue in 2Q 2017 $1,496 . - = 64% increase over trailing quarter $910 « $2.6M higher than prior-year period $176 gz Pe — Generated $0.5 million in cash from operations and $0.2 million
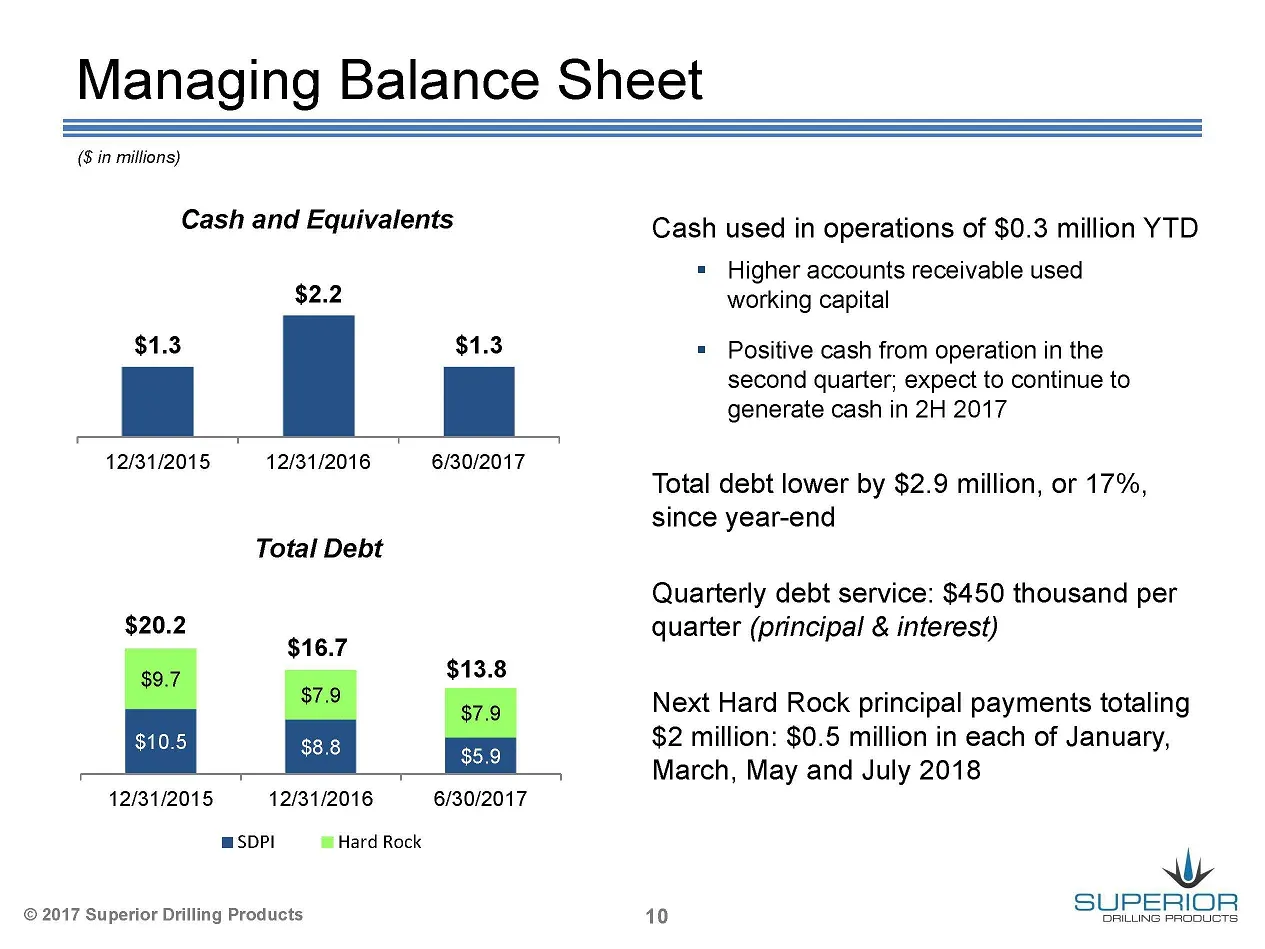
Slide 10: Managing Balance Sheet
Managing Balance Sheet (8 in millions) Cash and Equivalents C1 3 C 3 12/31/2015 12/31/2016 6/30/2017 Total Debt $20.2 $16.7 $13.8 “ ne 12/31/2015 12/31/2016 6/30/2017 mSDPI | Hard Rock © 2017 Superior Drilling Products Cash used in operations of $0.3 million YTD = Higher accounts receivable used wor
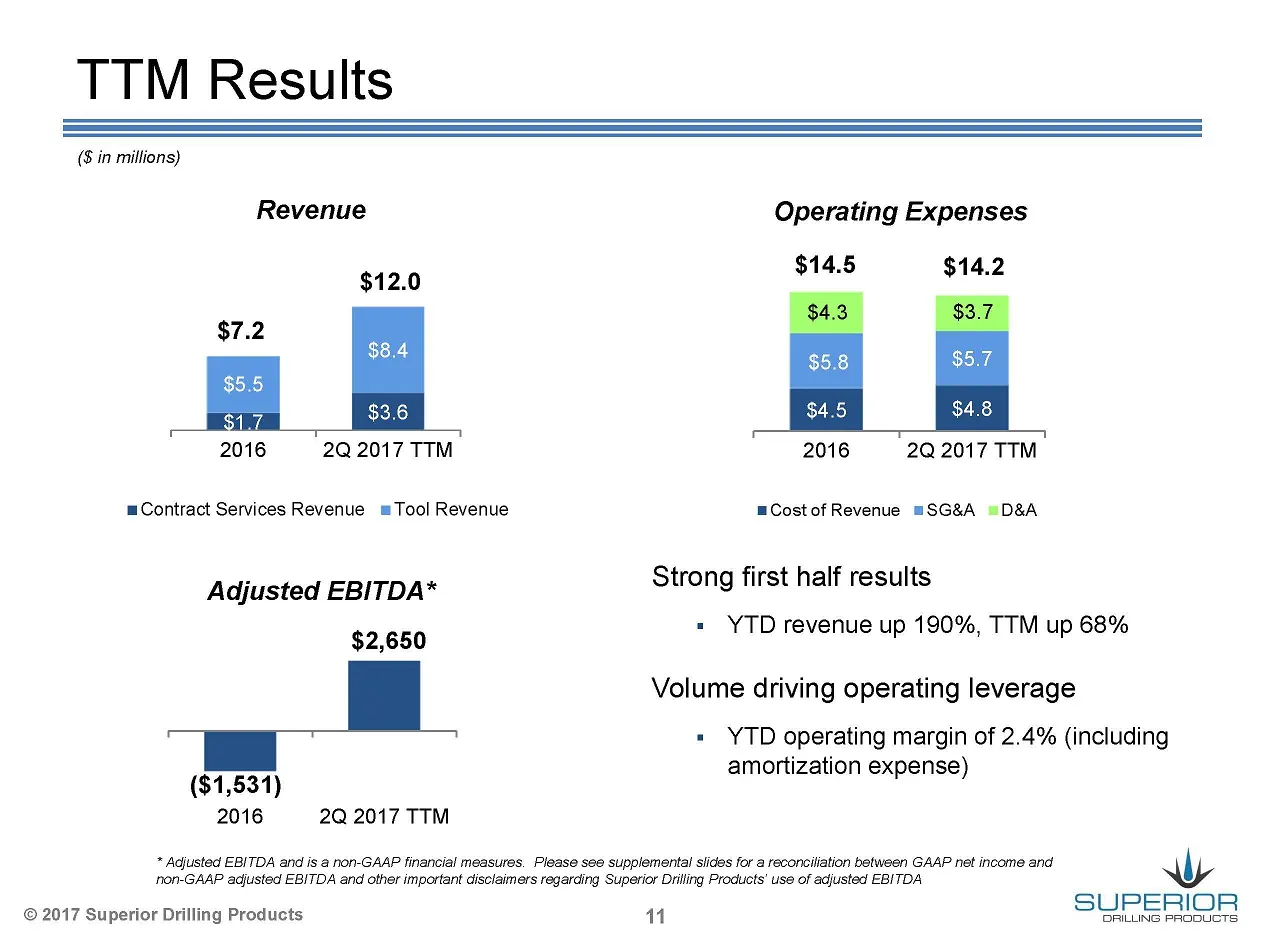
Slide 11: TTM Results
TTM Results (8 in millions) Revenue Operating Expenses $14.5 $14.2 $49 $87 $5.8 $5.7 $4.5 $4.8 2016 2Q 2017 TTM 2016 2Q 2017 TTM Contract Services Revenue Tool Revenue mCostof Revenue sSG&A =D&A Strong first half results Adjusted EBITDA* $2,650 » YTD revenue up 190%, TTM up 68% Volume driving operat
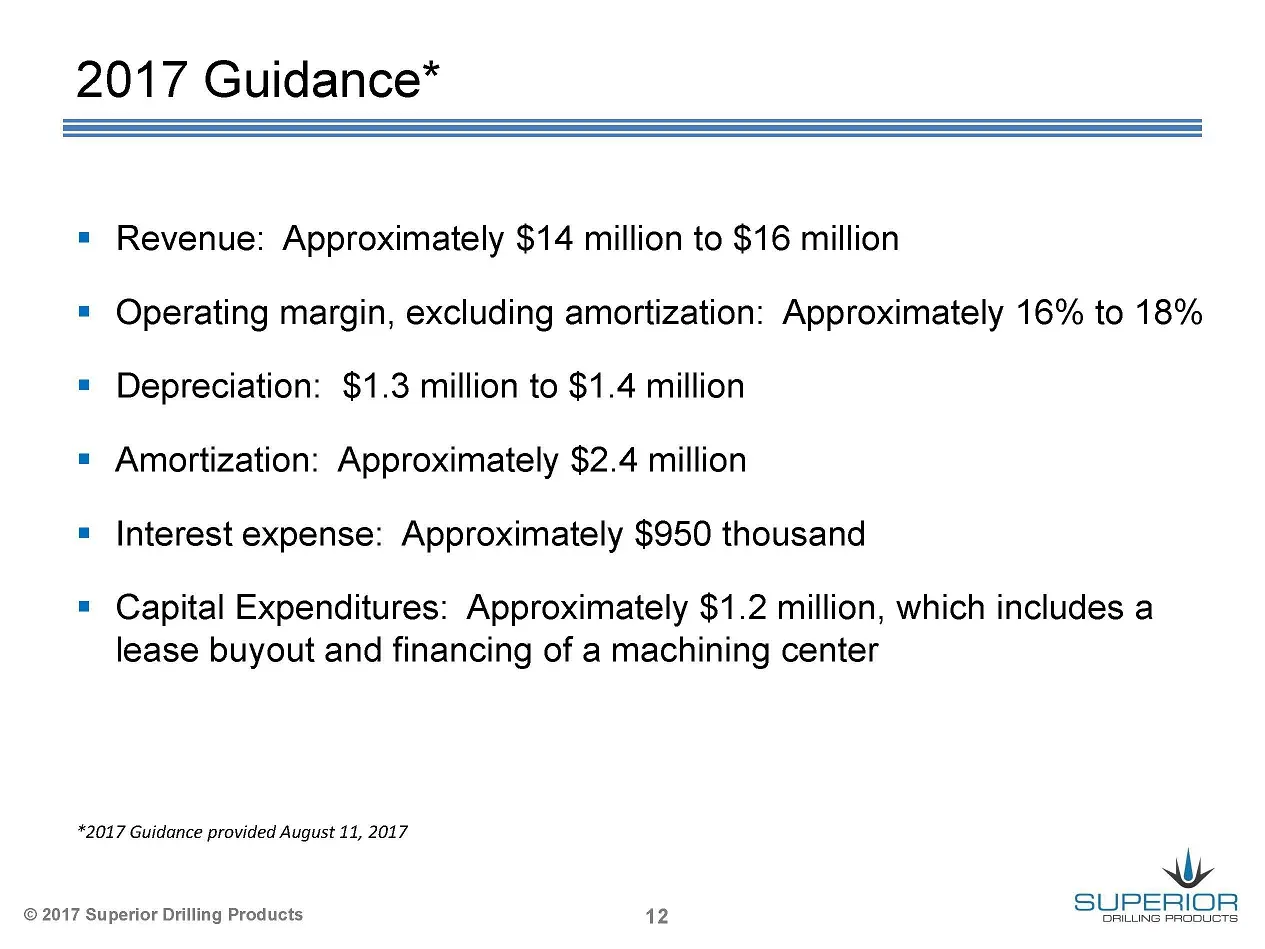
Slide 12: 2017 Guidance
2017 Guidance* = Revenue: Approximately $14 million to $16 million " Operating margin, excluding amortization: Approximately 16% to 18% = Depreciation: $1.3 million to $1.4 million « Amortization: Approximately $2.4 million « Interest expense: Approximately $950 thousand " Capital Expenditures: Appr
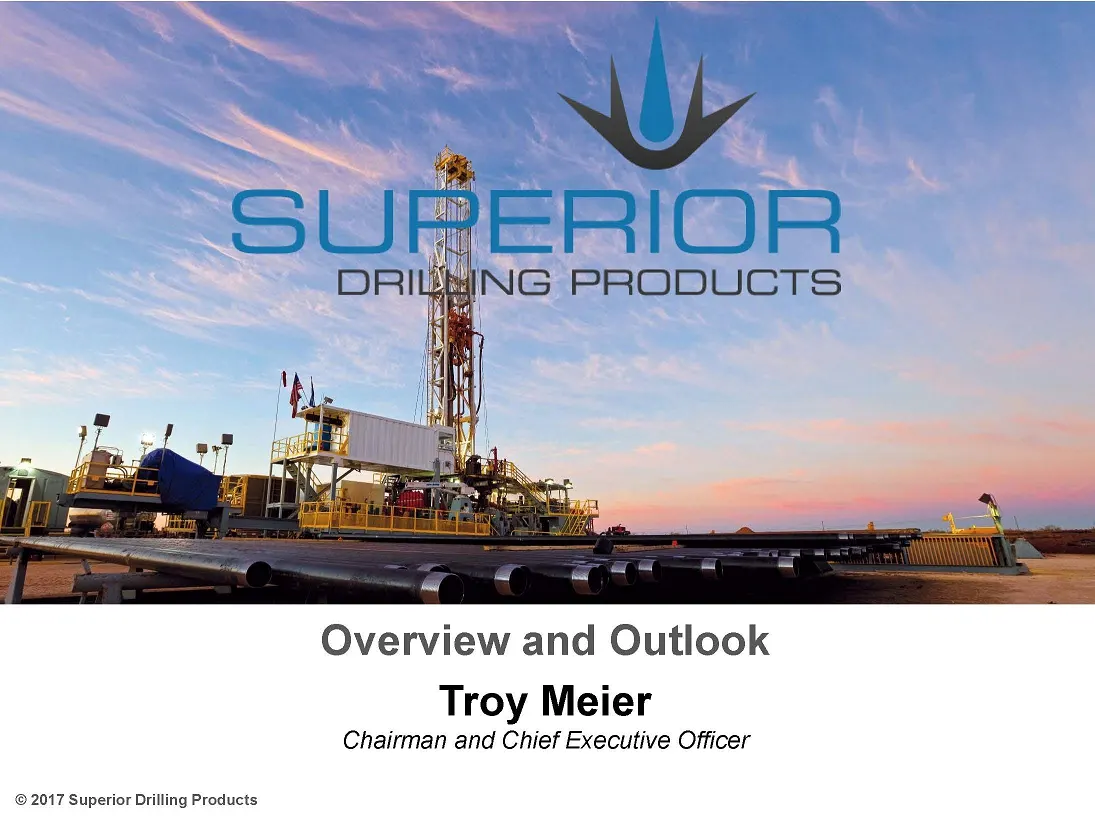
Slide 13: Overview and Outlook
Overview and Outlook Troy Meier Chairman and Chief Executive Officer © 2017 Superior Drilling Products
Slide 14: Opportunities
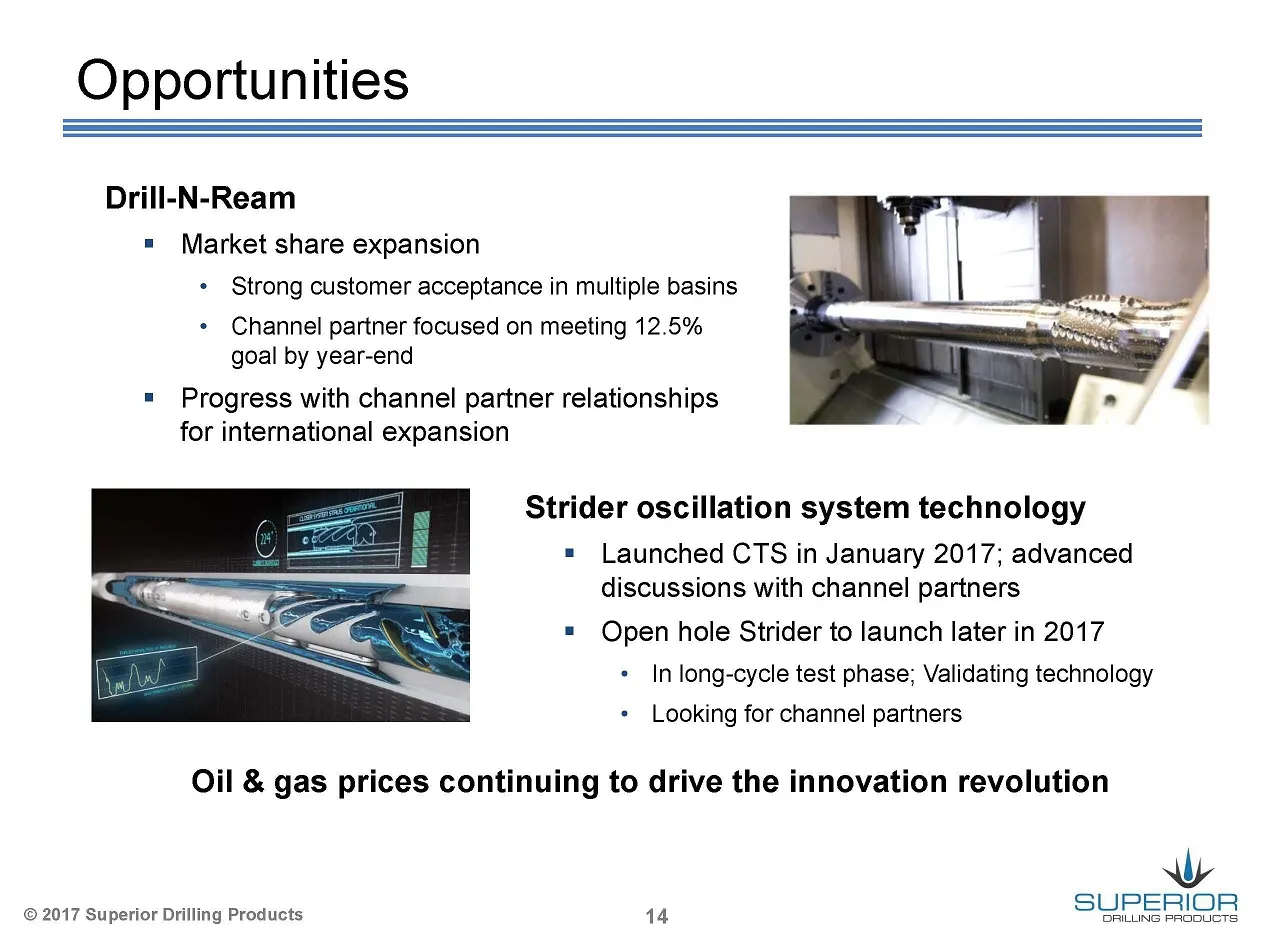
Opportunities Drill-N-Ream = Market share expansion * Strong customer acceptance in multiple basins * Channel partner focused on meeting 12.5% goal by year-end = Progress with channel partner relationships for international expansion Strider oscillation system technology = Launched CTS in January 20
Slide 15: Supplemental Information
Supplemental Information © 2017 Superior Drilling Products
Slide 16: Adjusted EBITDA Reconciliation
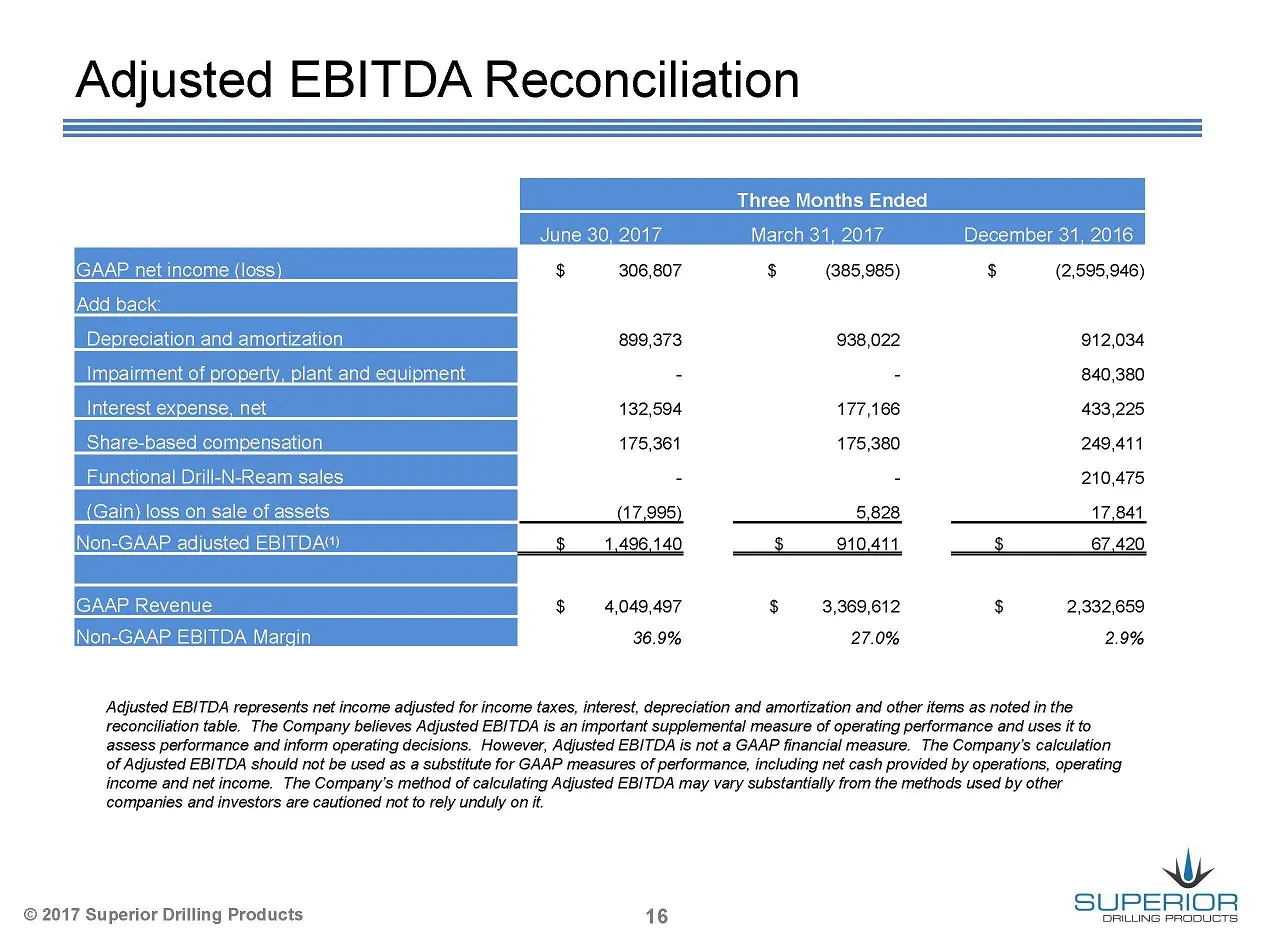
Adjusted EBITDA Reconciliation $ 306.807 $ (385,985) $595,946) 209,373 998,022 12034 : ; 240,980 i Share-based compensation 175,361 175,380 249,411 Eunctional Drill-N-Ream sales - - 210,475 Gain) loss_on sale of assets (17,995) 5,828 17,841 132,504 177,188 498,205 Non-GAAP adjusted EBITDA® $ 1,496,1
Slide 17: Adjusted EBITDA Reconciliation
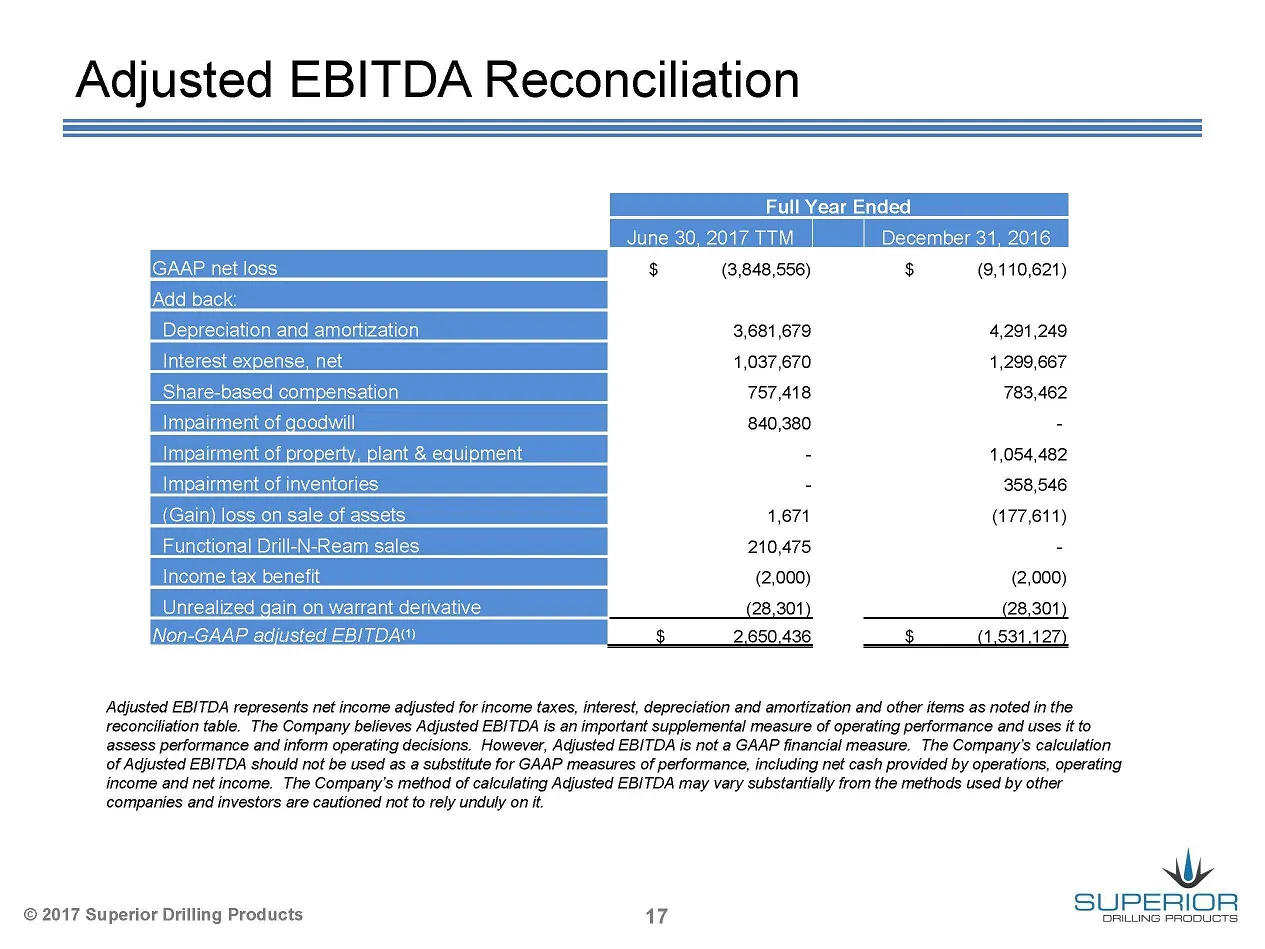
Adjusted EBITDA Reconciliation IGAAP net loss $ (3,848,556) $ (9,110,621) 3,681,679 4,291,249 1,037,670 1,299,667 757,418 783,462 840,380 - | - 358,546 4,671 (17,811) 210,475 - (2,000) (2,000) Unrealized gain on warrant derivative (28,301) (28,301) AAP adjusted EBITDA) 2,650,436 $ 1,531,127) f lant
Source: SEC EDGAR · 8-K filed Aug 14, 2017
More decks from Superior Drilling Products Inc
 Q3 2023 Earnings Presentation12 slides · Nov 9, 2023
 Q2 2023 Earnings Presentation12 slides · Aug 14, 2023
 Q1 2023 Earnings Presentation12 slides · May 15, 2023
 FY2022 Earnings Presentation13 slides · Mar 10, 2023
 Q3 2022 Earnings Presentation12 slides · Nov 14, 2022
 MicroCap Rodeo Windy City Roundup 202220 slides · Oct 12, 2022