Superior Drilling Products Inc
Superior Drilling Products — Q3 2017 Earnings Presentation
17 slides from Superior Drilling Products's earnings presentation, Nov 9, 2017
Slide 1: Third Quarter 2017 Financial Results Conference Call
© 2017 Superior Drilling Products Third Quarter 2017 Financial Results Conference Call November 9, 2017 NYSE American: SDPI
Slide 2: Safe Harbor Statement
© 2017 Superior Drilling Products 2 Safe Harbor Statement These slides and the accompanying oral presentation contain “forward - looking statements” within the meaning of the safe harbor p rovisions, 15 U.S.C. † 78u - 5, of the Private Securities Litigation Reform Act of 1995. All statements, other
Slide 3: Troy Meier, Chairman and Chief Executive Officer
© 2017 Superior Drilling Products Troy Meier Chairman and Chief Executive Officer
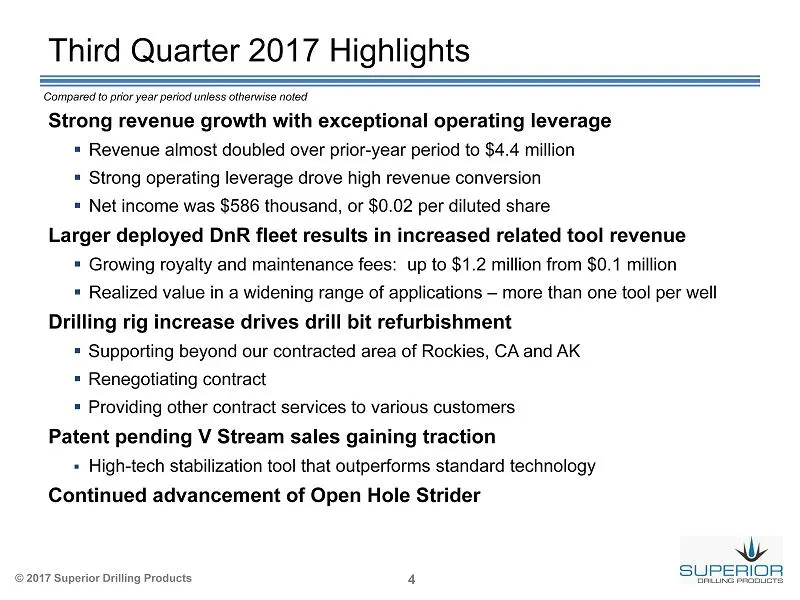
Slide 4: Third Quarter 2017 Highlights
© 2017 Superior Drilling Products 4 Strong revenue growth with exceptional operating leverage ▪ Revenue almost doubled over prior - year period to $4.4 million ▪ Strong operating leverage drove high revenue conversion ▪ Net income was $586 thousand, or $0.02 per diluted share Larger deployed DnR fle
Slide 5: Financial Results
© 2017 Superior Drilling Products Financial Results Christopher D. Cashion Chief Financial Officer
Slide 6: Significant Revenue Growth
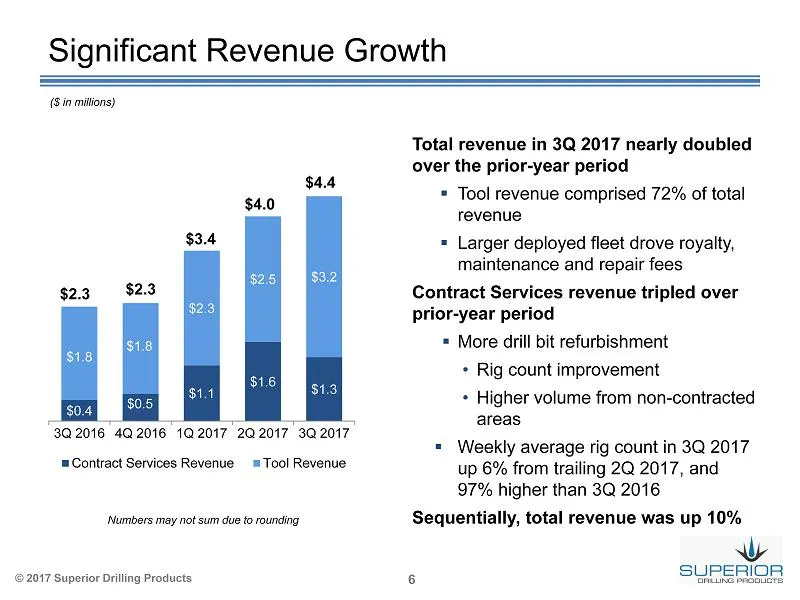
© 2017 Superior Drilling Products 6 $0.4 $0.5 $1.1 $1.6 $1.3 $1.8 $1.8 $2.3 $2.5 $3.2 3Q 2016 4Q 2016 1Q 2017 2Q 2017 3Q 2017 Contract Services Revenue Tool Revenue $2.3 $3.4 $4.4 $4.0 $2.3 Total revenue in 3Q 2017 nearly doubled over the prior - year period ▪ Tool revenue comprised 72% of total rev
Slide 7: Tool Revenue Strength
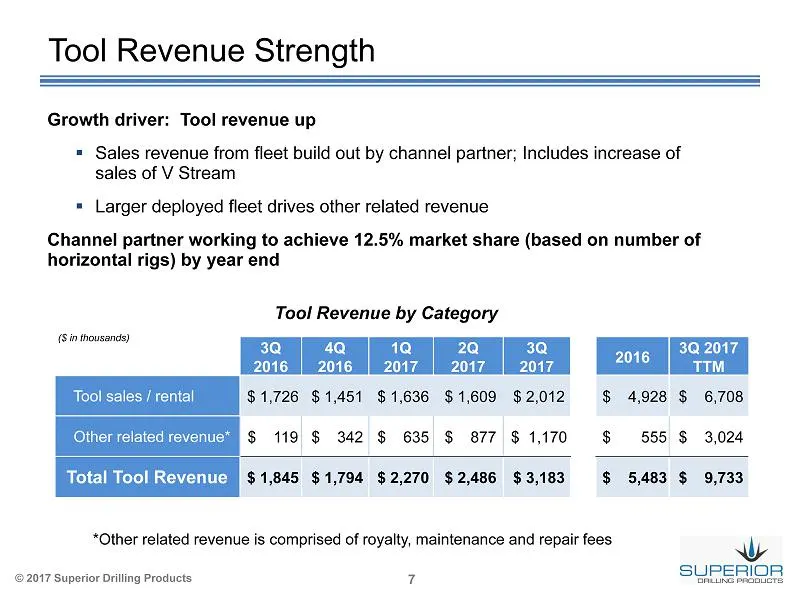
© 2017 Superior Drilling Products 7 Growth driver: Tool revenue up ▪ Sales revenue from fleet build out by channel partner; Includes increase of sales of V Stream ▪ Larger deployed fleet drives other related revenue Channel partner working to achieve 12.5% market share (based on number of horizontal
Slide 8: Strong Cost Discipline
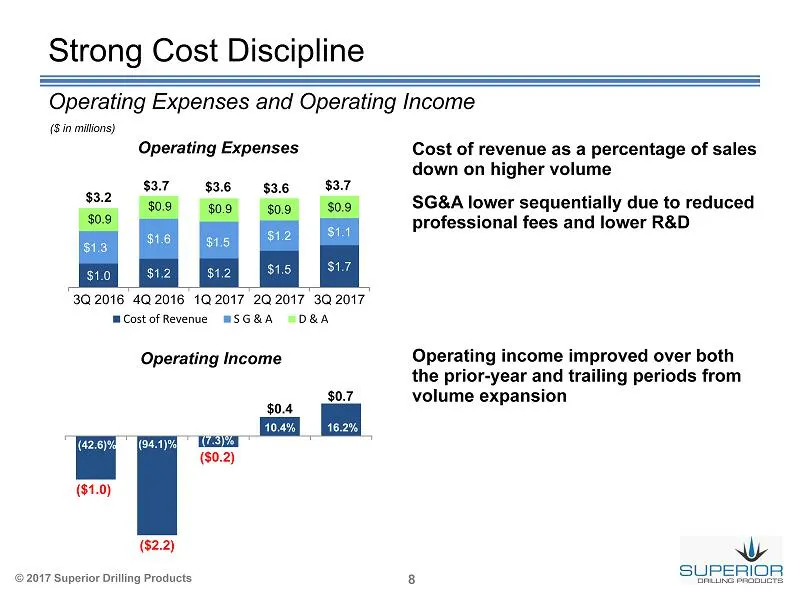
© 2017 Superior Drilling Products 8 $1.0 $1.2 $1.2 $1.5 $1.7 $1.3 $1.6 $1.5 $1.2 $1.1 $0.9 $0.9 $0.9 $0.9 $0.9 3Q 2016 4Q 2016 1Q 2017 2Q 2017 3Q 2017 Cost of Revenue S G & A D & A $3.7 $ 3.6 $ 3.7 $3.2 $ 3.6 ($ in millions) Strong Cost Discipline Operating Expenses and Operating Income C ost of rev
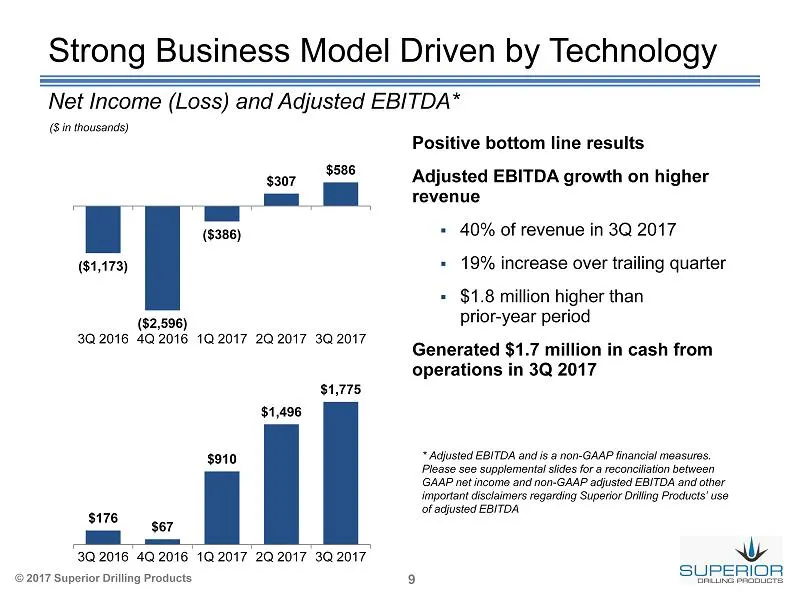
Slide 9: Strong Business Model Driven by Technology
© 2017 Superior Drilling Products 9 Strong Business Model Driven by Technology * Adjusted EBITDA and is a non - GAAP financial measures. Please see supplemental slides for a reconciliation between GAAP net income and non - GAAP adjusted EBITDA and other important disclaimers regarding Superior Drill
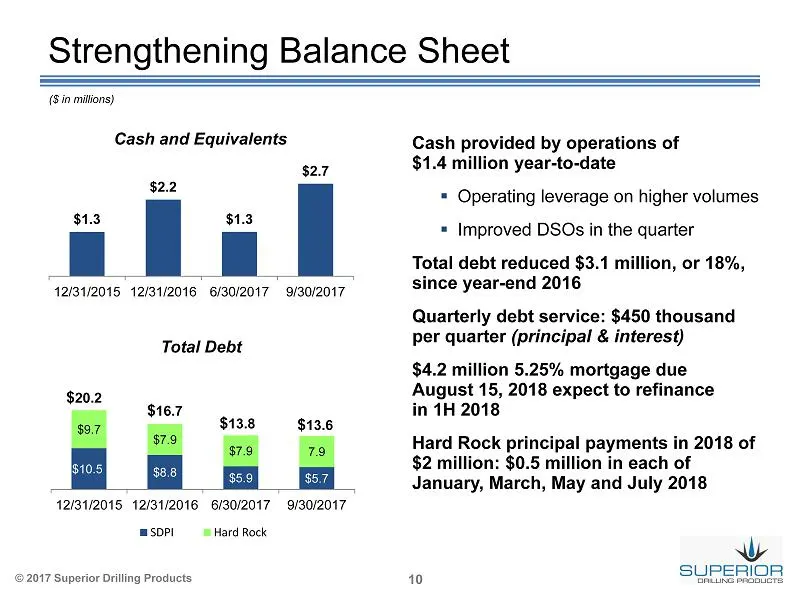
Slide 10: Strengthening Balance Sheet
© 2017 Superior Drilling Products 10 Strengthening Balance Sheet Cash and Equivalents Total Debt $10.5 $8.8 $5.9 $5.7 $ 9.7 $ 7.9 $ 7.9 7.9 12/31/2015 12/31/2016 6/30/2017 9/30/2017 SDPI Hard Rock $ 20.2 $ 16.7 $ 13.6 $ 13.8 ($ in millions) $1.3 $2.2 $1.3 $2.7 12/31/2015 12/31/2016 6/30/2017 9/30/20
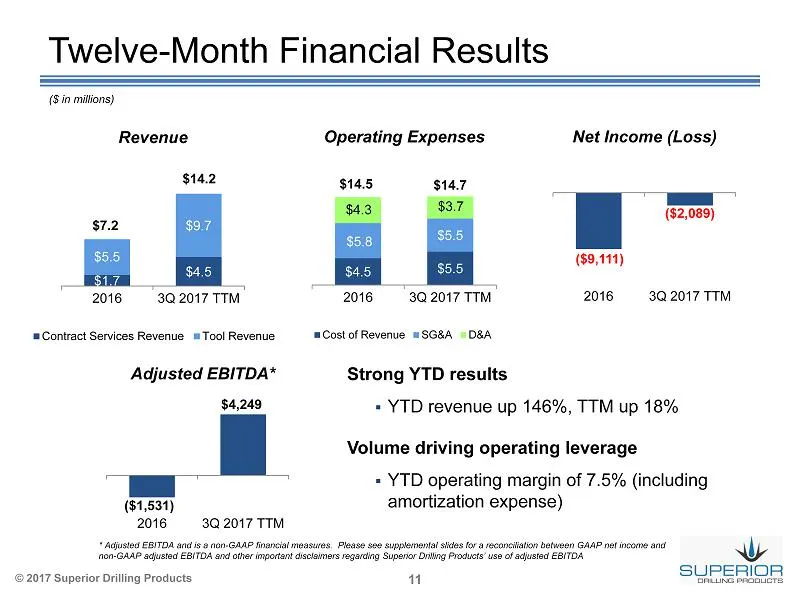
Slide 11: Twelve-Month Financial Results
© 2017 Superior Drilling Products 11 Twelve - Month Financial Results ($ in millions) $1.7 $4.5 $5.5 $9.7 2016 3Q 2017 TTM Contract Services Revenue Tool Revenue $14.2 $7.2 Revenue $4.5 $5.5 $5.8 $5.5 $4.3 $3.7 2016 3Q 2017 TTM Cost of Revenue SG&A D&A $14.5 $ 14.7 Operating Expenses Adjusted EBITDA
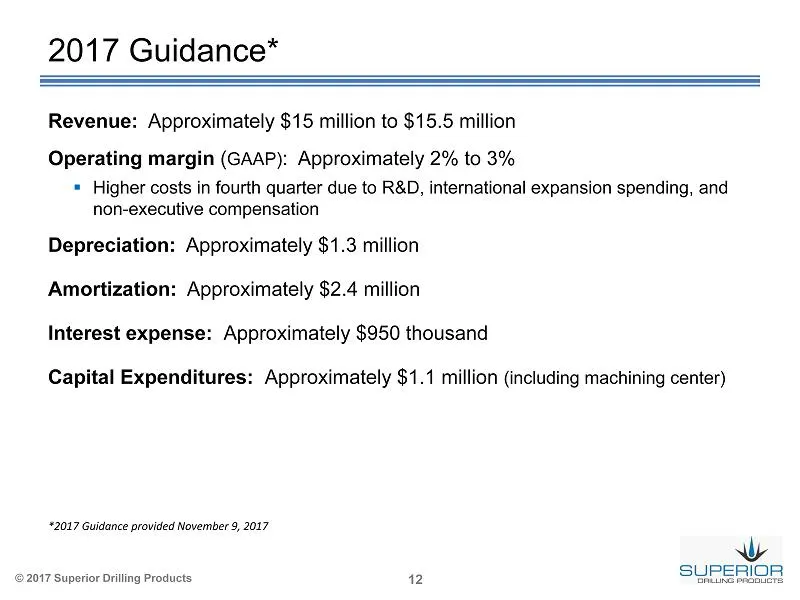
Slide 12: 2017 Guidance
© 2017 Superior Drilling Products 12 2017 Guidance* Revenue: Approximately $ 15 million to $ 15.5 million Operating margin ( GAAP) : Approximately 2 % to 3% ▪ Higher costs in fourth quarter due to R&D, international expansion spending, and non - executive compensation Depreciation: Approximately $1.
Slide 13: Overview and Outlook
© 2017 Superior Drilling Products Overview and Outlook Troy Meier Chairman and Chief Executive Officer
Slide 14: Opportunities
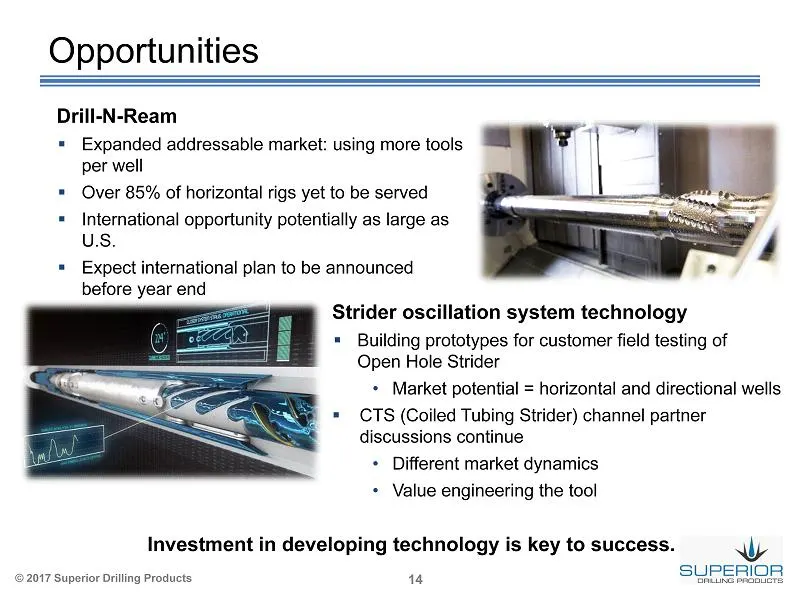
© 2017 Superior Drilling Products 14 Opportunities Drill - N - Ream ▪ Expanded addressable market: using more tools per well ▪ Over 85% of horizontal rigs yet to be served ▪ International opportunity potentially as large as U.S. ▪ Expect international plan to be announced before year end Strider osc
Slide 15: Supplemental Information
© 2017 Superior Drilling Products Supplemental Information
Slide 16: Adjusted EBITDA Reconciliation
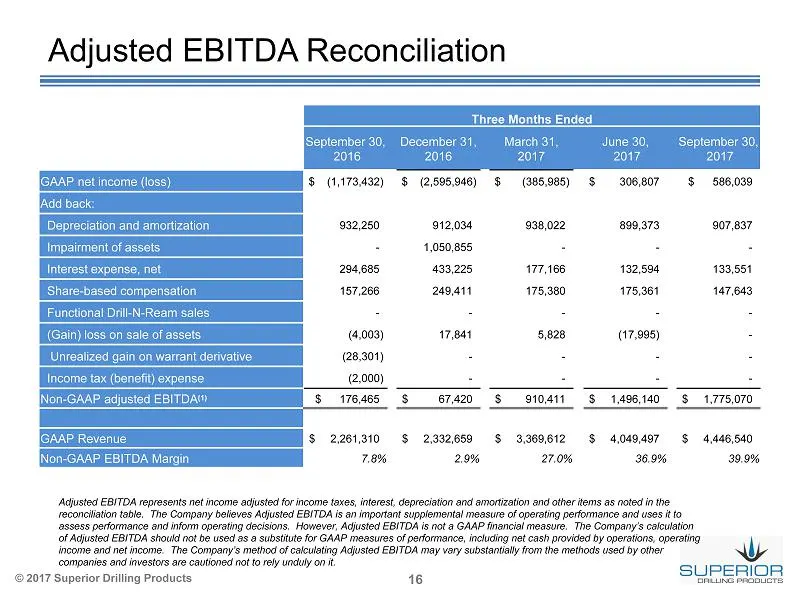
© 2017 Superior Drilling Products 16 Adjusted EBITDA Reconciliation Adjusted EBITDA represents net income adjusted for income taxes, interest, depreciation and amortization and other items as noted in t he reconciliation table. The Company believes Adjusted EBITDA is an important supplemental measur
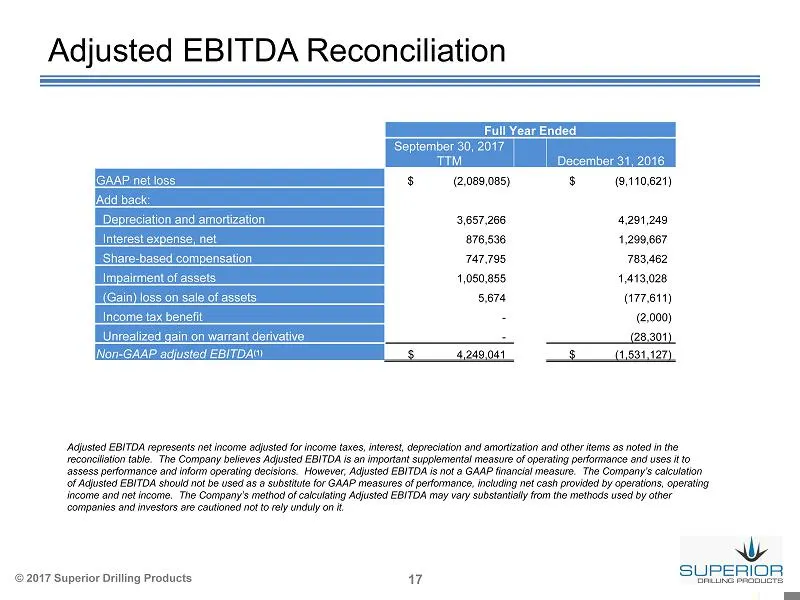
Slide 17: Adjusted EBITDA Reconciliation (TTM)
© 2017 Superior Drilling Products 17 Adjusted EBITDA Reconciliation Full Year Ended September 30, 2017 TTM December 31, 2016 GAAP net loss $ (2,089,085) $ (9,110,621) Add back: Depreciation and amortization 3,657,266 4,291,249 Interest expense, net 876,536 1,299,667 Share - based compensation 747,79
Source: SEC EDGAR · 8-K filed Nov 9, 2017
More decks from Superior Drilling Products Inc
 Q3 2023 Earnings Presentation12 slides · Nov 9, 2023
 Q2 2023 Earnings Presentation12 slides · Aug 14, 2023
 Q1 2023 Earnings Presentation12 slides · May 15, 2023
 FY2022 Earnings Presentation13 slides · Mar 10, 2023
 Q3 2022 Earnings Presentation12 slides · Nov 14, 2022
 MicroCap Rodeo Windy City Roundup 202220 slides · Oct 12, 2022