Superior Drilling Products Inc
Superior Drilling Products — Q1 2017 Earnings Presentation
18 slides from Superior Drilling Products's earnings presentation, May 12, 2017
Slide 1: First Quarter 2017 Financial Results Conference Call
NY NG PRODUCTS First Quarter 2017 Financial Results Conference Call May 12, 2017 NYSE MKT: SDPI © 2017 Superior Drilling Products
Slide 2: Safe Harbor Statement
Safe Harbor Statement These slides and the accompanying oral presentation contain “forward-looking statements” within the meaning of the safe harbor provisions, 15 U.S.C. § 78u-5, of the Private Securities Litigation Reform Act of 1995. All statements, other than statements of historical fact includ
Slide 3: Troy Meier, Chairman and Chief Executive Officer
MING PRODUCTS Troy Meier Chairman and Chief Executive Officer © 2017 Superior Drilling Products
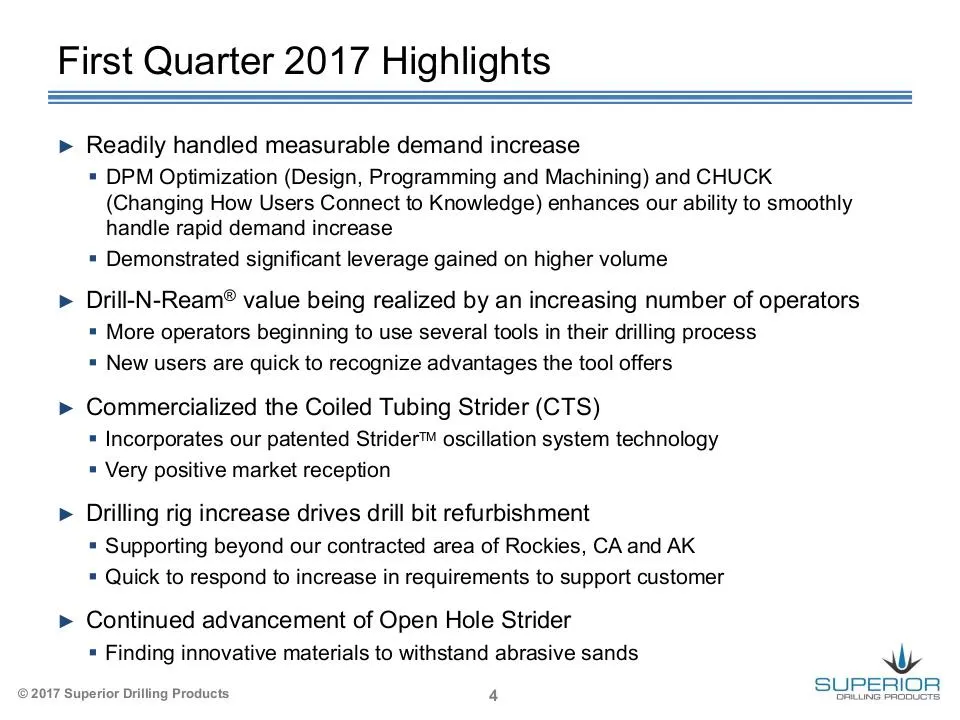
Slide 4: First Quarter 2017 Highlights
First Quarter 2017 Highlights > Readily handled measurable demand increase = DPM Optimization (Design, Programming and Machining) and CHUCK (Changing How Users Connect to Knowledge) enhances our ability to smoothly handle rapid demand increase = Demonstrated significant leverage gained on higher vol
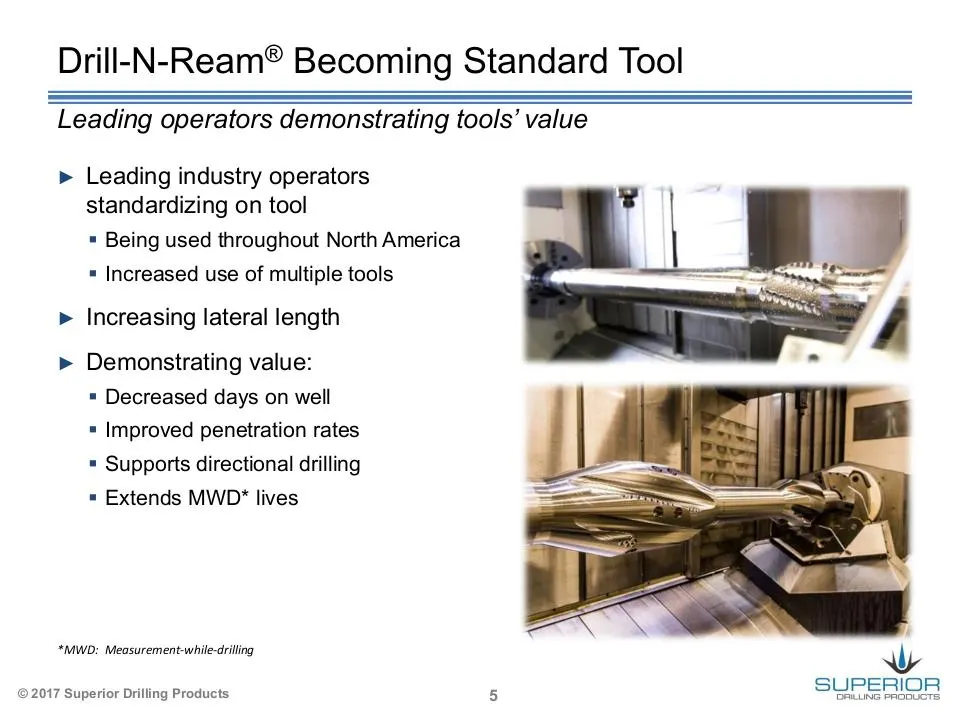
Slide 5: Drill-N-Ream Becoming Standard Tool
Drill-N-Ream® Becoming Standard Tool Leading operators demonstrating tools’ value > Leading industry operators standardizing on tool = Being used throughout North America = Increased use of multiple tools > Increasing lateral length > Demonstrating value: = Decreased days on well = Improved penetrat
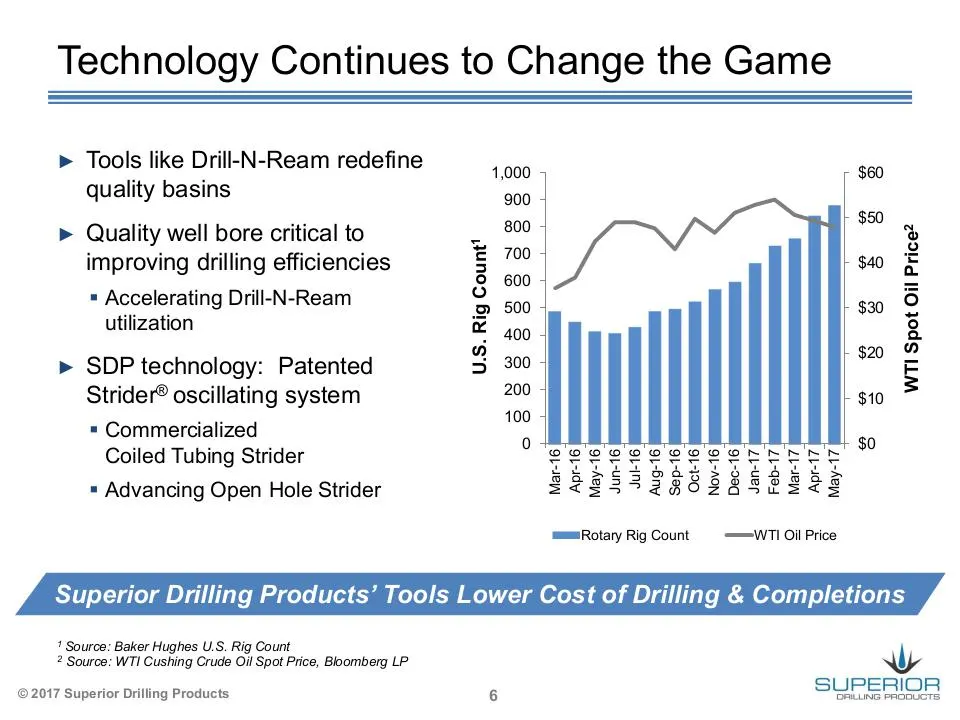
Slide 6: Technology Continues to Change the Game
Technology Continues to Change the Game > Tools like Drill-N-Ream redefine : . 1,000 $60 quality basins 900 ‘ “5 $50 > Quality well bore critical to a % improving drilling efficiencies A oe $40 F * Accelerating Drill-N-Ream © 500 s0 8 utilization X 400 g a $20 > SDP technology: Patented > 300 E Stri
Slide 7: Financial Results
Financial Results Christopher D. Cashion Chief Financial Officer © 2017 Superior Drilling Products
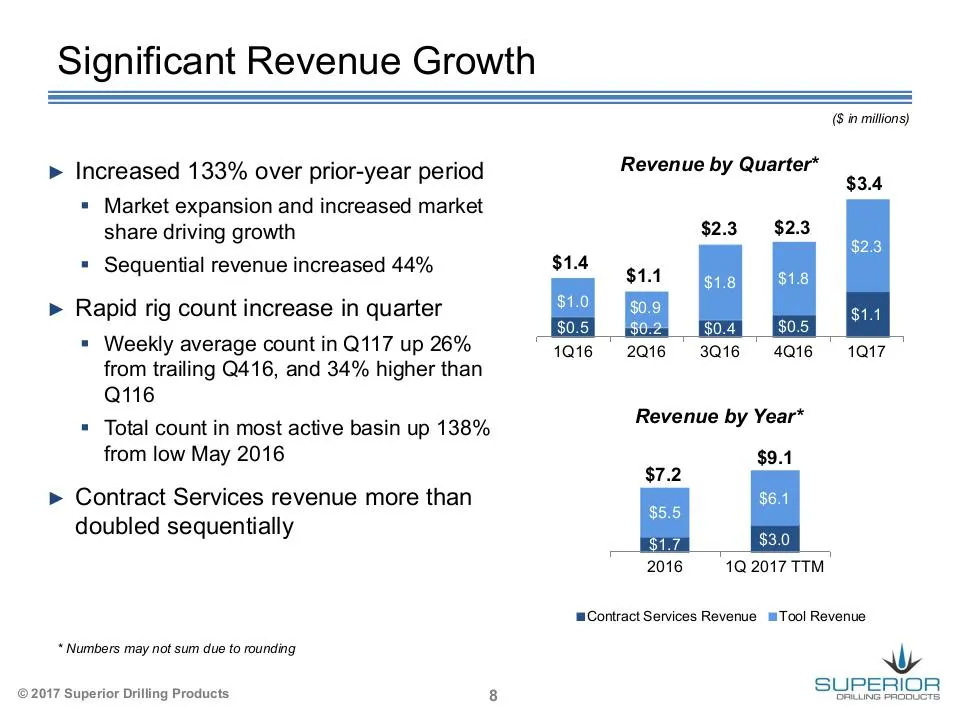
Slide 8: Significant Revenue Growth
Significant Revenue Growth > Increased 133% over prior-year period = Market expansion and increased market share driving growth = Sequential revenue increased 44% > Rapid rig count increase in quarter = Weekly average count in Q117 up 26% from trailing Q416, and 34% higher than Q116 * Total count in
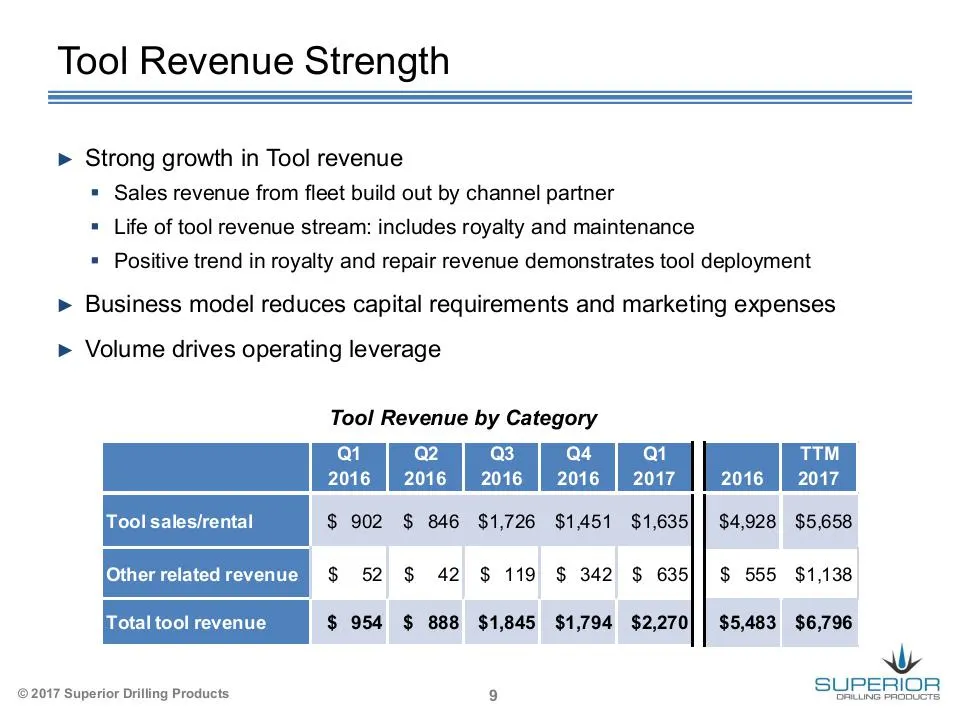
Slide 9: Tool Revenue Strength
Tool Revenue Strength > Strong growth in Tool revenue * Sales revenue from fleet build out by channel partner * Life of tool revenue stream: includes royalty and maintenance * Positive trend in royalty and repair revenue demonstrates tool deployment > Business model reduces capital requirements and
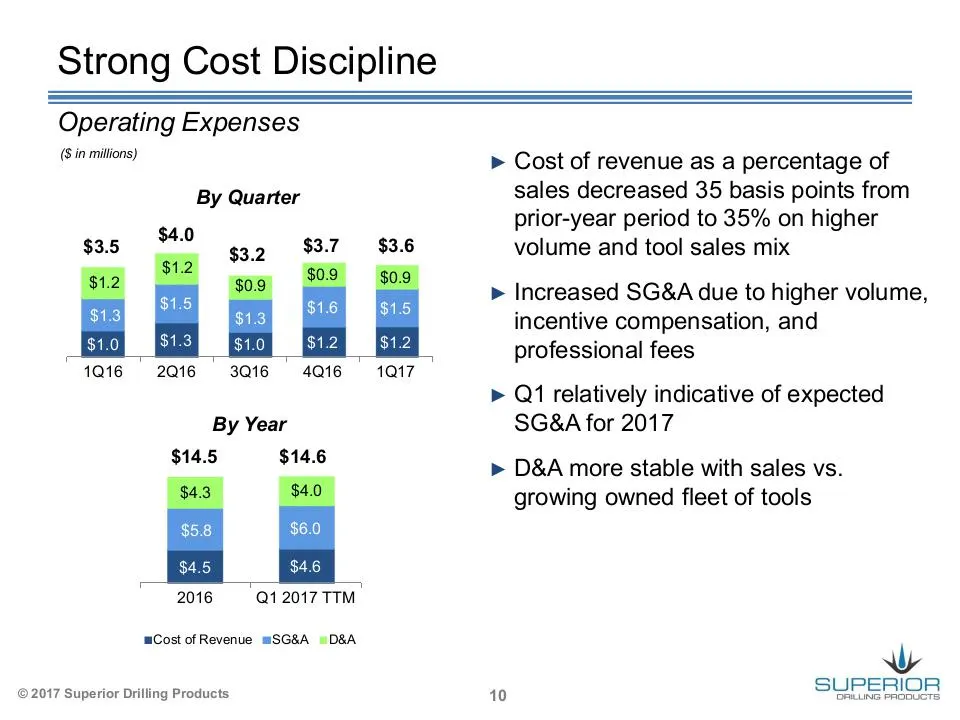
Slide 10: Strong Cost Discipline
Strong Cost Discipline Operating Expenses (Sin millions) By Quarter $4.0 $3.5 $3.7 $3.6 1016 2016 3016 | 4Q16 1017 By Year $14.5 $14.6 2016 Q1 2017 TTM mCost of Revenue SG&A D&A ©2017 Superior Drilling Products > Cost of revenue as a percentage of sales decreased 35 basis points from prior-year peri
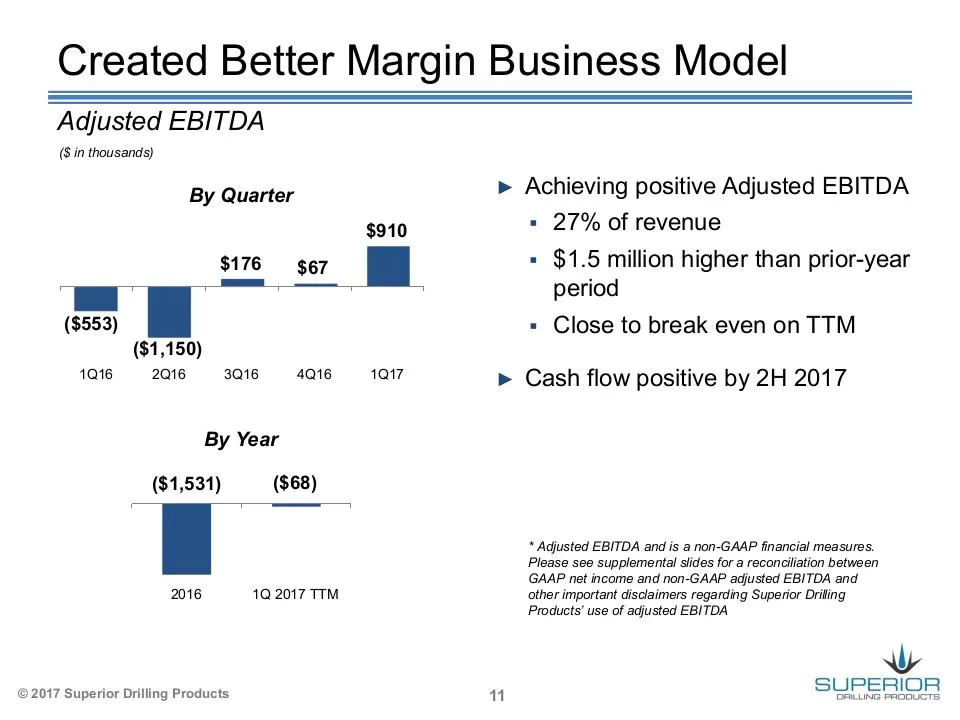
Slide 11: Created Better Margin Business Model
Created Better Margin Business Model Adjusted EBITDA ($ in thousands) > Achieving positive Adjusted EBITDA $910 = 27% of revenue = $1.5 million higher than prior-year period = Close to break even on TTM By Quarter $176 $67 ($553) ($1,150) awe 2016 3Q164Q16 1017 > Cash flow positive by 2H 2017 By Yea
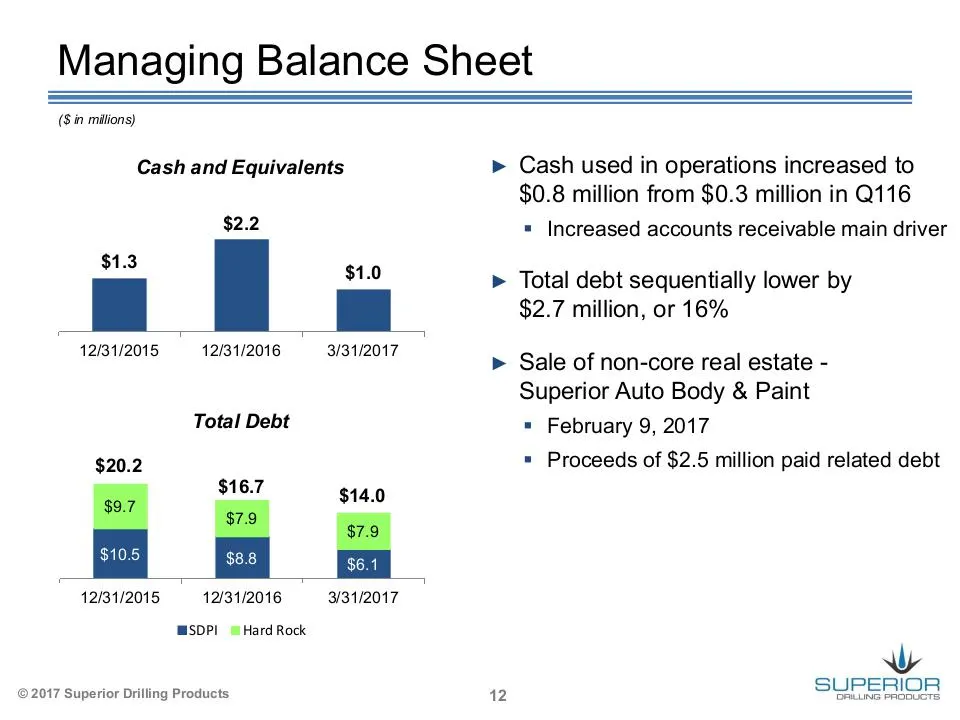
Slide 12: Managing Balance Sheet
Managing Balance Sheet (Sin milion) Cash and Equivalents $2.2 $1.3 $1.0 12/31/2015 12/31/2016 3/31/2017 Total Debt 12/31/2015 12/31/2016 3/31/2017 SDP! = Hard Rock © 2017 Superior Drilling Products > Cash used in operations increased to $0.8 million from $0.3 million in Q116 = Increased accounts rec
Slide 13: 2017 Guidance
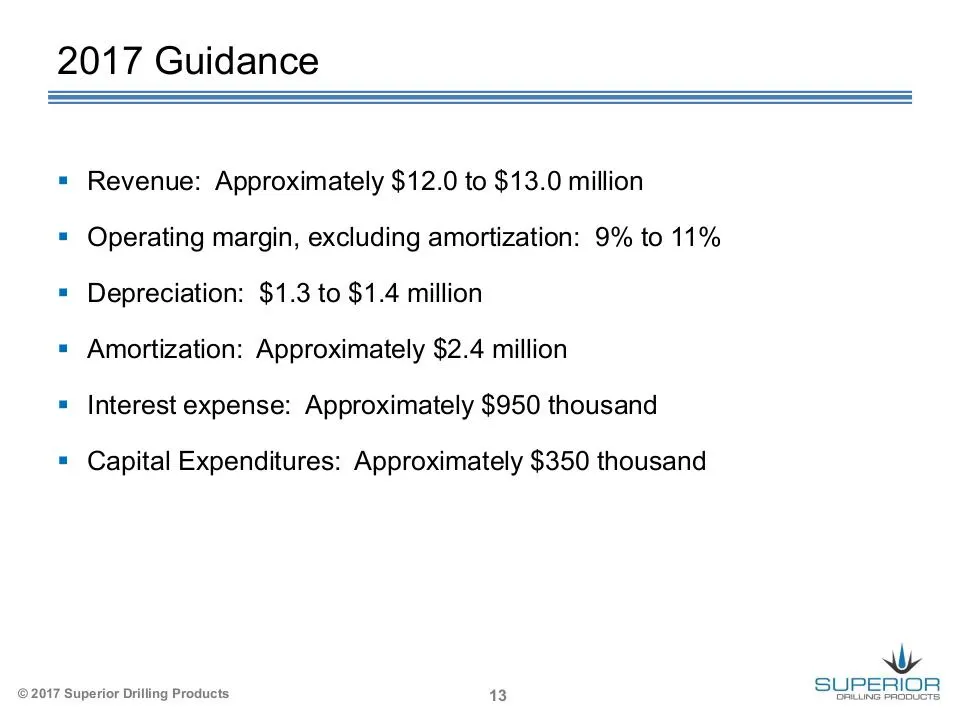
2017 Guidance = Revenue: Approximately $12.0 to $13.0 million = Operating margin, excluding amortization: 9% to 11% = Depreciation: $1.3 to $1.4 million = Amortization: Approximately $2.4 million = Interest expense: Approximately $950 thousand = Capital Expenditures: Approximately $350 thousand © 20
Slide 14: Overview and Outlook
Overview and Outlook Troy Meier Chairman and Chief Executive Officer © 2017 Superior Drilling Products
Slide 15: Opportunities
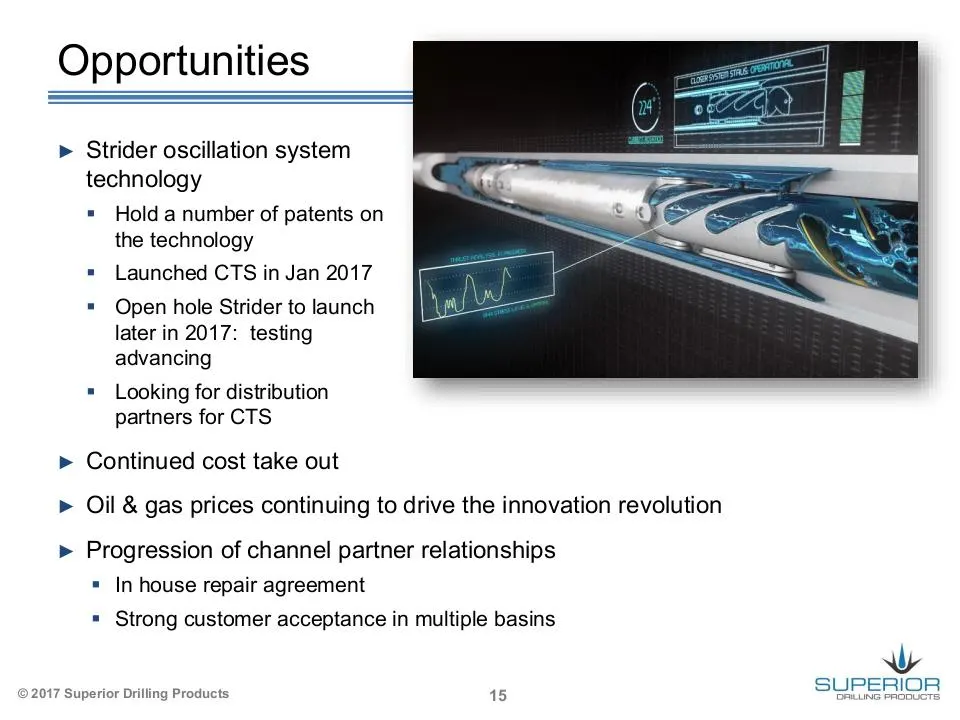
Opportunities > Strider oscillation system technology = Hold a number of patents on the technology » Launched CTS in Jan 2017 = Open hole Strider to launch later in 2017: testing advancing * Looking for distribution partners for CTS > Continued cost take out > Oil & gas prices continuing to drive th
Slide 16: Supplemental Information
NY NG PRODUCTS Supplemental Information © 2017 Superior Drilling Products
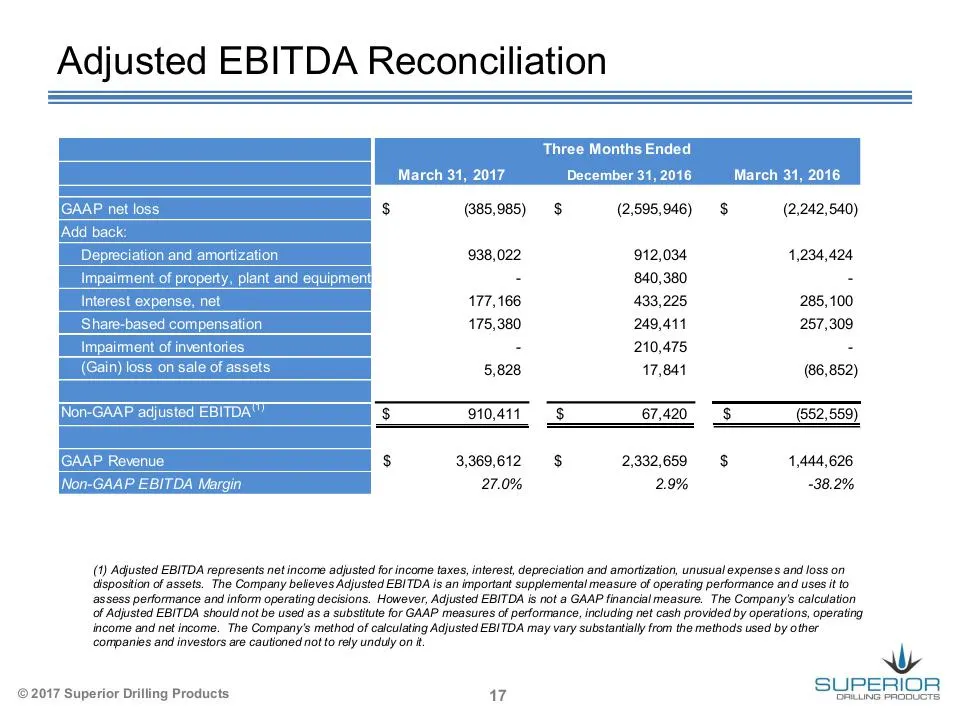
Slide 17: Adjusted EBITDA Reconciliation
Adjusted EBITDA Reconciliation Three Months End March 31, 2017 December 31, 2016 March 31, 2016 s —@25,965) 908,022 12.0% 1204428 (2,595,946) $ (2,242,540) Impairment of property, plant and equipment - 840,380 - 177,166 433,225 285,100 175,380 249,411 287,309 : 210,475 “ (¢ 5,828 17,841 (86,852) $ 9
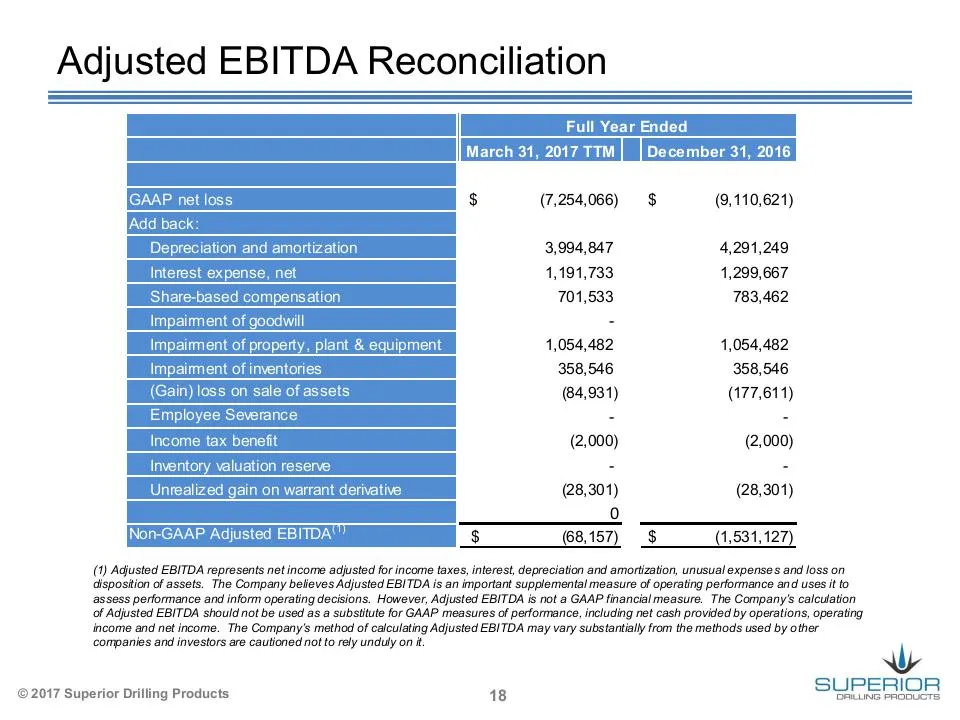
Slide 18: Adjusted EBITDA Reconciliation
Adjusted EBITDA Reconciliation Full Year Ended March 31, 2017 TTM |_| December 31, 2016 IGAAP net loss $ (7,254,066) $ (9,110,621) Z| > & a 2 >| Ea 5 Depreciation and amortization 3,994,847 4,291,249 Interest expense, net 1,191,733 1,299,667 Share-based compensation 701,533 783,462 Impairment of goo
Source: SEC EDGAR · 8-K filed May 12, 2017
More decks from Superior Drilling Products Inc
 Q3 2023 Earnings Presentation12 slides · Nov 9, 2023
 Q2 2023 Earnings Presentation12 slides · Aug 14, 2023
 Q1 2023 Earnings Presentation12 slides · May 15, 2023
 FY2022 Earnings Presentation13 slides · Mar 10, 2023
 Q3 2022 Earnings Presentation12 slides · Nov 14, 2022
 MicroCap Rodeo Windy City Roundup 202220 slides · Oct 12, 2022