Superior Drilling Products Inc
Superior Drilling Products — Q1 2019 Earnings Presentation
16 slides from Superior Drilling Products's earnings presentation, May 9, 2019
Slide 1: First Quarter 2019 Financial Results Conference Call
Ny SUPERIOR DRILLING PRODUCTS FIRST QUARTER 2019 FINANCIAL RESULTS CONFERENCE CALL May 9, 2019 NYSE American: SDPI www.sdpi.com
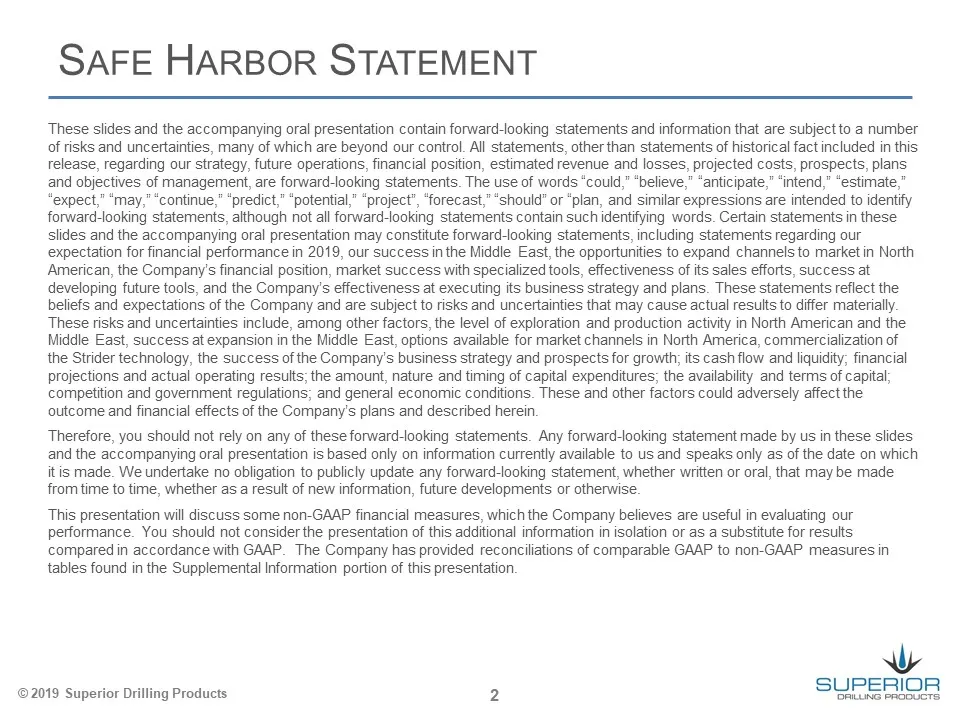
Slide 2: Safe Harbor Statement
SAFE HARBOR STATEMENT These slides and the accompanying oral presentation contain forward-looking statements and information that are subject to a number of risks and uncertainties, many of which are beyond our control. All statements, other than statements of historical fact included in this releas
Slide 3: Troy Meier, Chairman and Chief Executive Officer
Ny SUPERIOR DRILLING PRODUCTS TROY MEIER CHAIRMAN AND CHIEF EXECUTIVE OFFICER ©2019 Superior Drilling Products
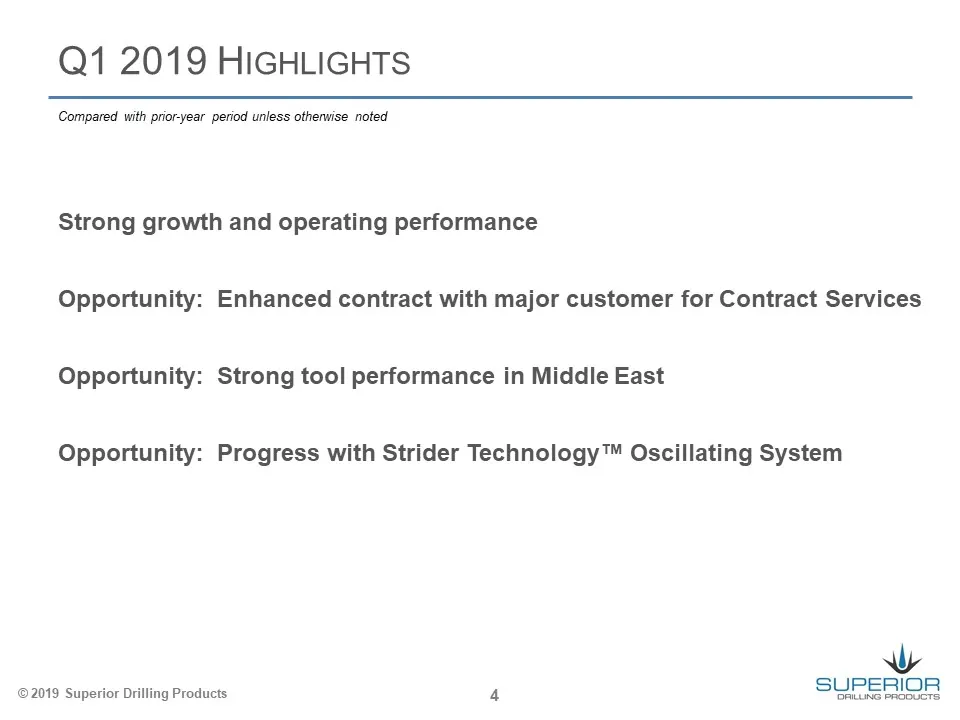
Slide 4: Q1 2019 Highlights
Q1 2019 HIGHLIGHTS Compared with prior-year period unless otherwise noted Strong growth and operating performance Opportunity: Enhanced contract with major customer for Contract Services Opportunity: Strong tool performance in Middle East Opportunity: Progress with Strider Technology™ Oscillating Sy
Slide 5: Christopher Cashion, Chief Financial Officer
Ny SUPERIOR DRILLING PRODUCTS CHRISTOPHER CASHION CHIEF FINANCIAL OFFICER
Slide 6: Significant Revenue Growth
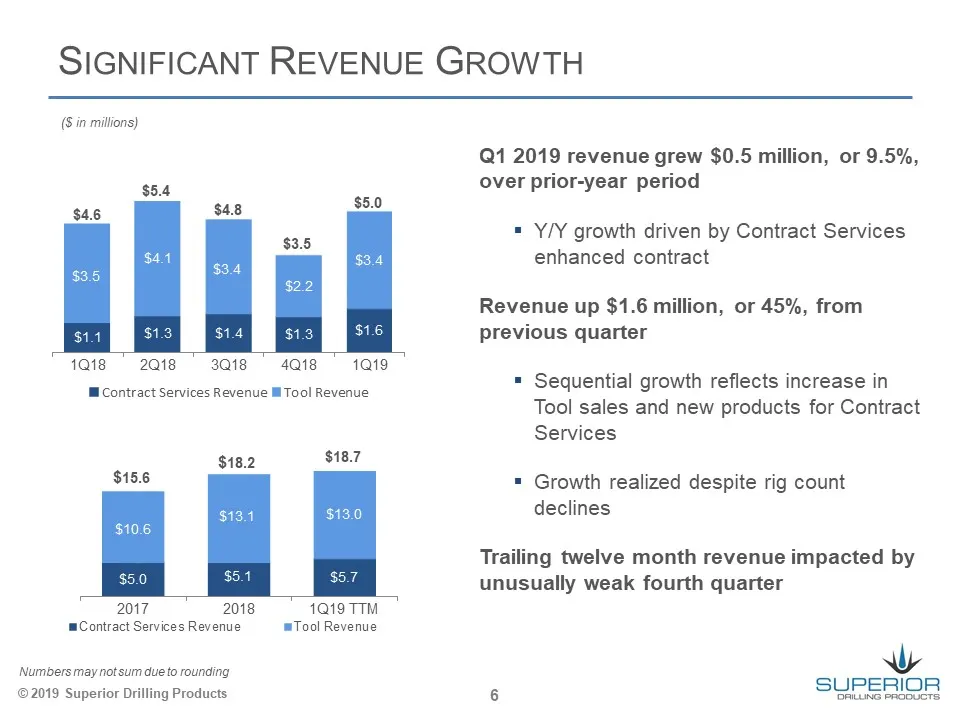
SIGNIFICANT REVENUE GROWTH (Sin millions) Q1 2019 revenue grew $0.5 mil over prior-year period ion, or 9.5%, = Y/Y growth driven by Contract Services enhanced contract Revenue up $1.6 mil previous quarter ion, or 45%, from 1018 2Q18 318 4Q18 = 119 Contract Services Revenue ll Tool Revenue = Sequenti
Slide 7: Tool Revenue
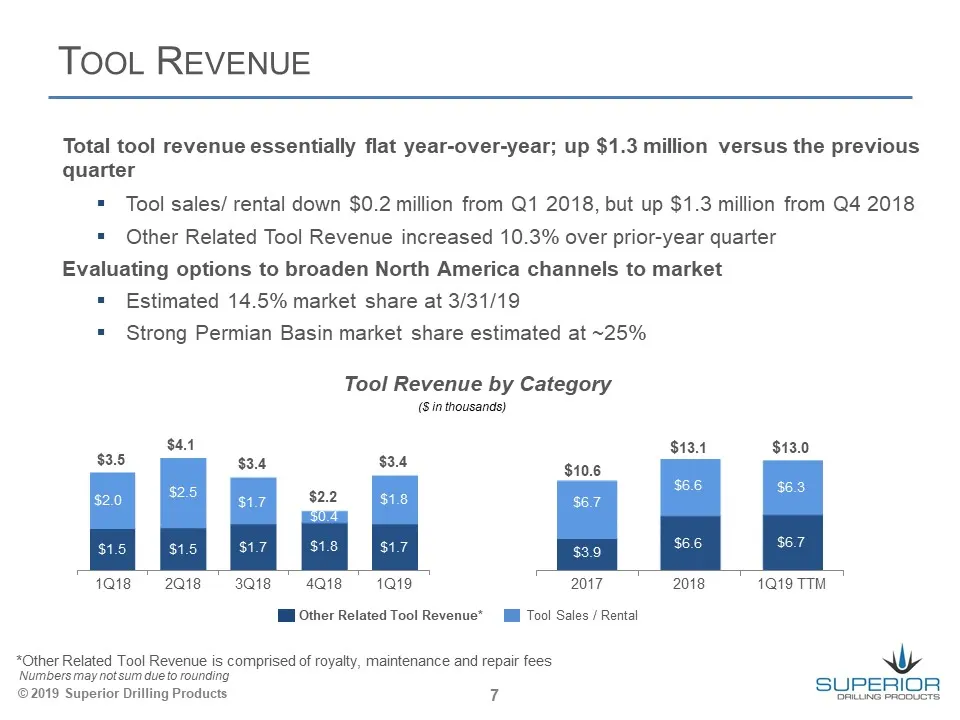
TOOL REVENUE Total tool revenue essentially flat year-over-year; up $1.3 million versus the previous quarter = Tool sales/ rental down $0.2 million from Q1 2018, but up $1.3 million from Q4 2018 = Other Related Tool Revenue increased 10.3% over prior-year quarter Evaluating options to broaden North
Slide 8: Investments in Growth
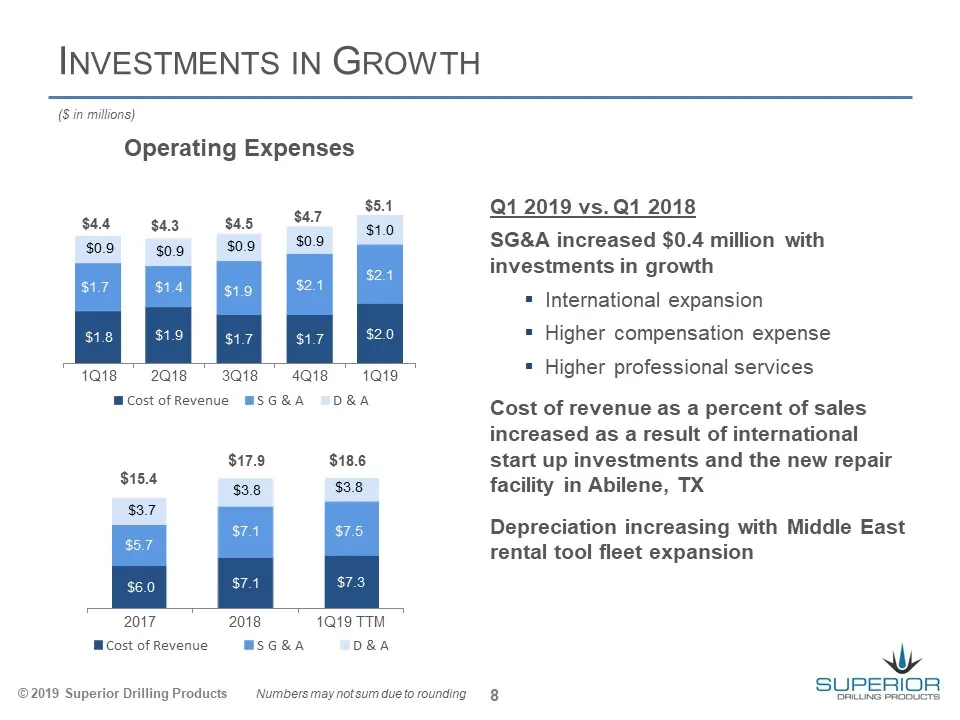
INVESTMENTS IN GROWTH (Sin millions) Operating Expenses $5.1 $1.0 $4.7 $0.9 $4.5 1018 2Q18 Cost of Revenue 3a1g 4a18 mSGRA 1Q19 D&A $17.9 $3.8 $18.6 $3.8 2017 Cost of Revenue 2018 MSG&A 1Q19 TTM D&A ©2019 Superior Drilling Products Numbers maynotsum due to rounding Q1 2019 vs. Q1 2018 SG&A increased
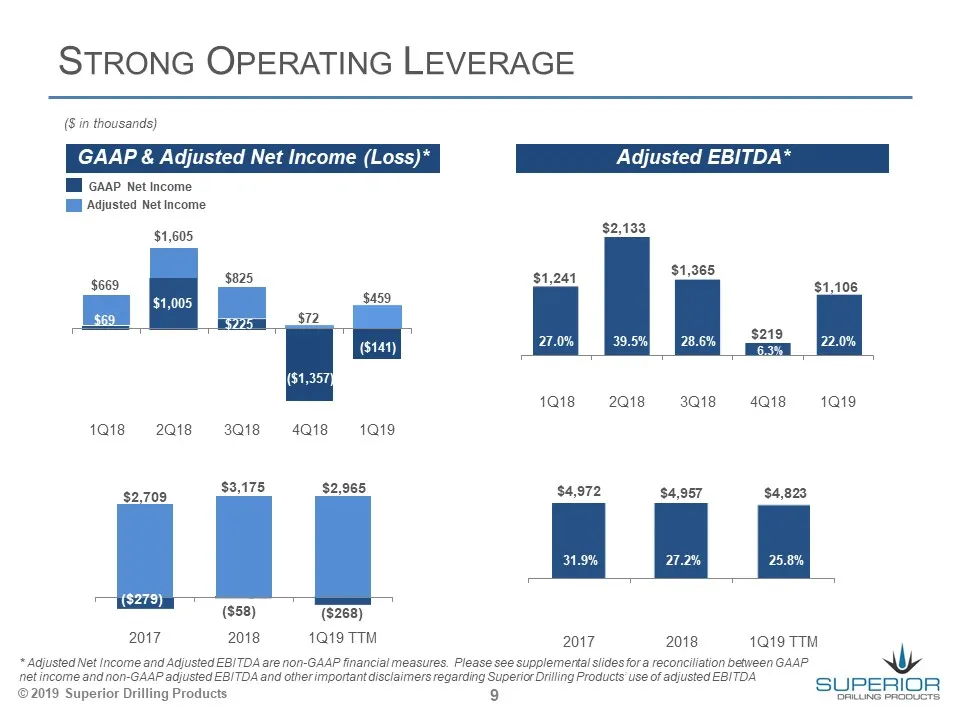
Slide 9: Strong Operating Leverage
STRONG OPERATING LEVERAGE (Sin thousands) GAAP & Adjusted Net Income (Loss)* Adjusted EBITDA* I GAAP Net Income Ill Adjusted Net income $1,605 $2,133 $669 $825 | | $459 $72 1018 2018 = 318 4s 1a19 1018-2018 = 3Q18_ 4Q18 119 $2709 $3,175 $2,965 $4,972 $4,957 $4,823 31.9% 21.2% 25.8% ($58) ($268) 2017
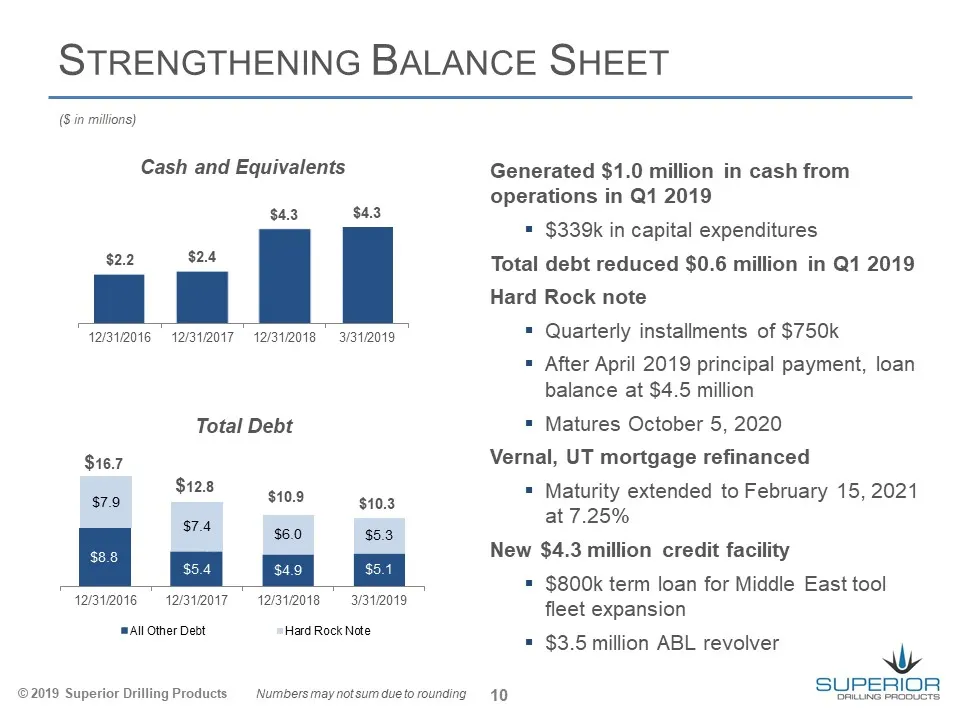
Slide 10: Strengthening Balance Sheet
STRENGTHENING BALANCE SHEET (Sin millions) Cash and Equivalents $2.2 $2.4 42/312016 12/31/2017 $4.3 $4.3 42/312018 3/31/2019 Total Debt $16.7 $128 $79 $10.9 $10.3 B a $60 $63 12312016 12/31/2017 All Other Debt ©2019 Superior Drilling Products 42/31/2018 3/34/2019 Hard Rock Note Numbers may notsum du
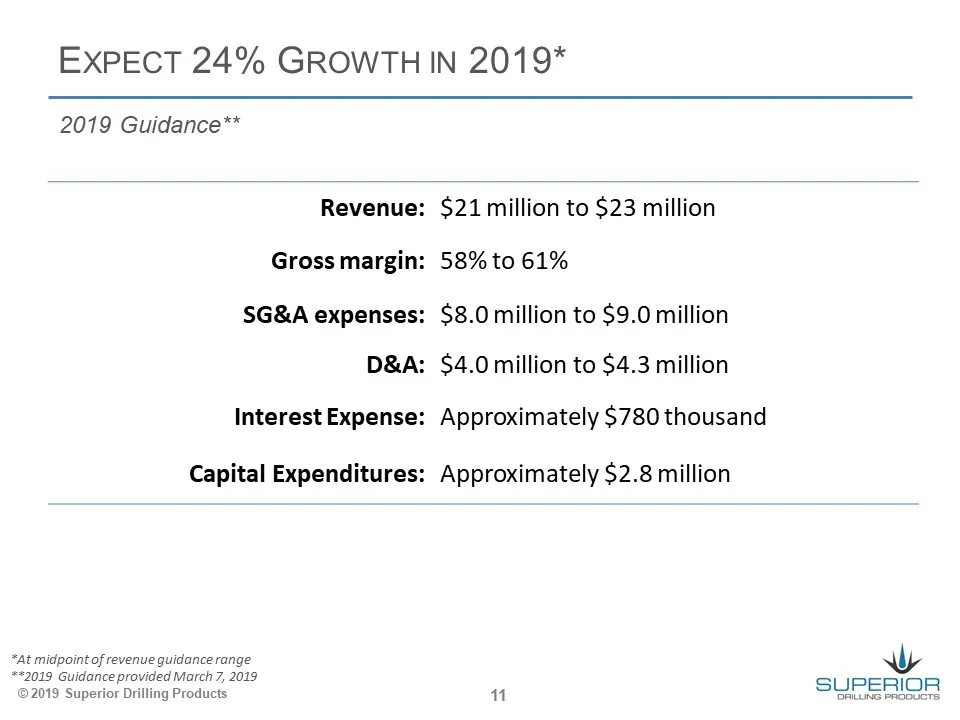
Slide 11: Expect 24% Growth in 2019
EXPECT 24% GROWTH IN 2019* 2019 Guidance** Revenue: Gross margin: SG&A expenses: D&A: Interest Expense: Capital Expenditures: “At midpoint of revenue guidance range *2019 Guidance provided March 7, 2019 ©2019 Superior Drilling Products $21 million to $23 million 58% to 61% $8.0 million to $9.0 milli
Slide 12: Supplemental Information
Ny SUPERIOR DRILLING PRODUCTS SUPPLEMENTAL INFORMATION
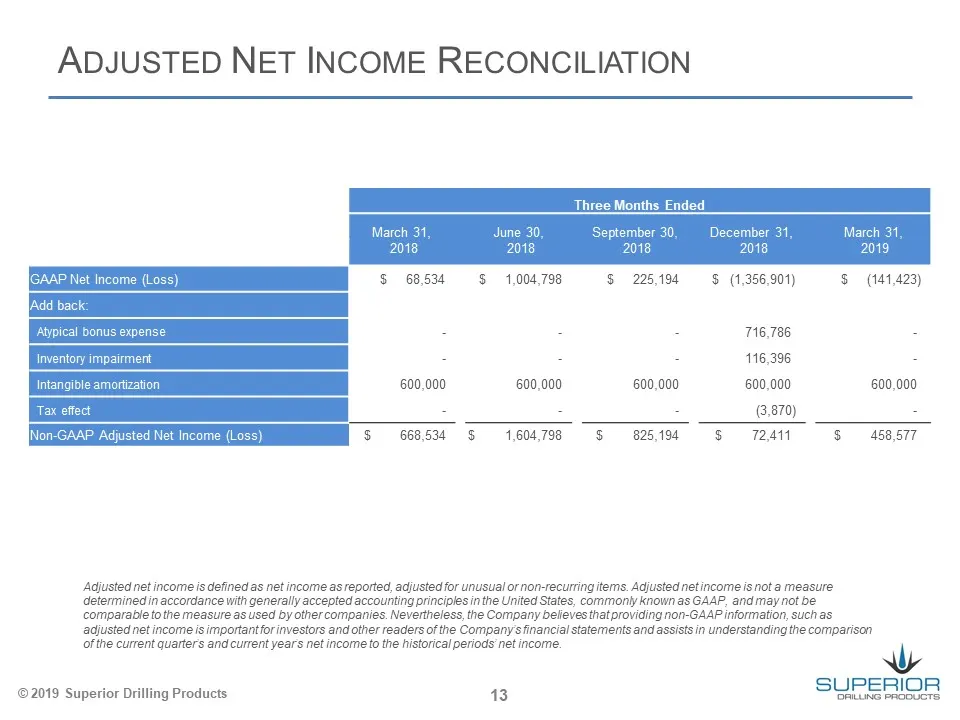
Slide 13: Adjusted Net Income Reconciliation
ADJUSTED NET INCOME RECONCILIATION Three Months Ended $ (1,356,901) $ (141,423) - - - 716,786 - - - - 116,396 - 600,000 600,000 600,000 600,000 600,000 : : : (3.870) : S 668.534 $ 1,604,798 $ 825,194 = § 72.411 S$ 458,577 Adjusted net income is defined as net income as reported, adjusted for unusual
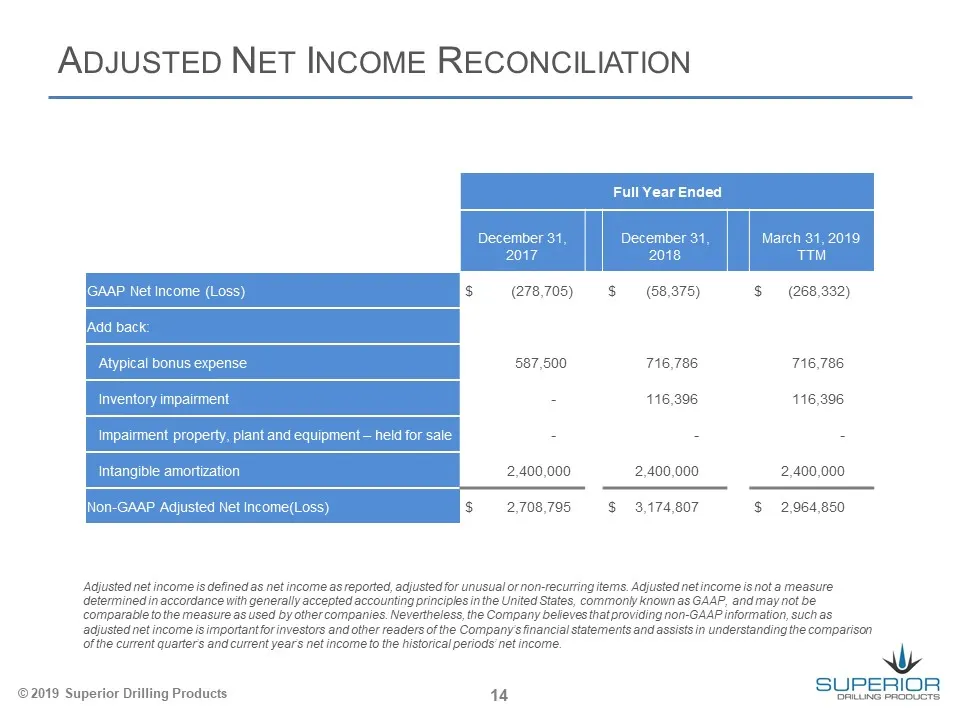
Slide 14: Adjusted Net Income Reconciliation
ADJUSTED NET INCOME RECONCILIATION Full Year Ended December 31 December 31 2017 2018 March 31,2019 TT™ (278,705) $ (58,375) $ (268,332) 716,786 716,786 116,296 116,296 2,400,000 2,400,000 2,708,795 $ 3,174,807 S$ 2,964,850 Adjusted net income is defined as net income as reported, adjusted for unusua
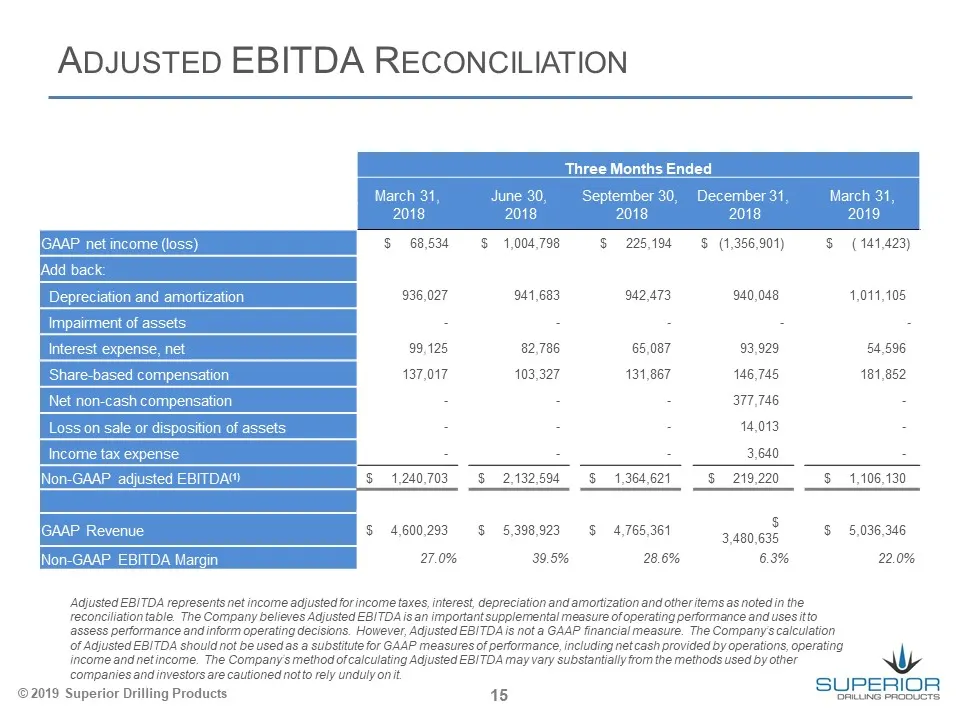
Slide 15: Adjusted EBITDA Reconciliation
ADJUSTED EBITDA RECONCILIATION 1,004,798 $ (1,356,901) $ (141,423) : !Add back: Depreciation and amortization 936,027 941,683 942.473 940,048 4,014,105 Impairment of = = we _ em 0 mm oma Share-based compensation 137,017 103,327 131,867 146,745 181,852 Net non-cash compensation - - - 377,748 - Lo: -
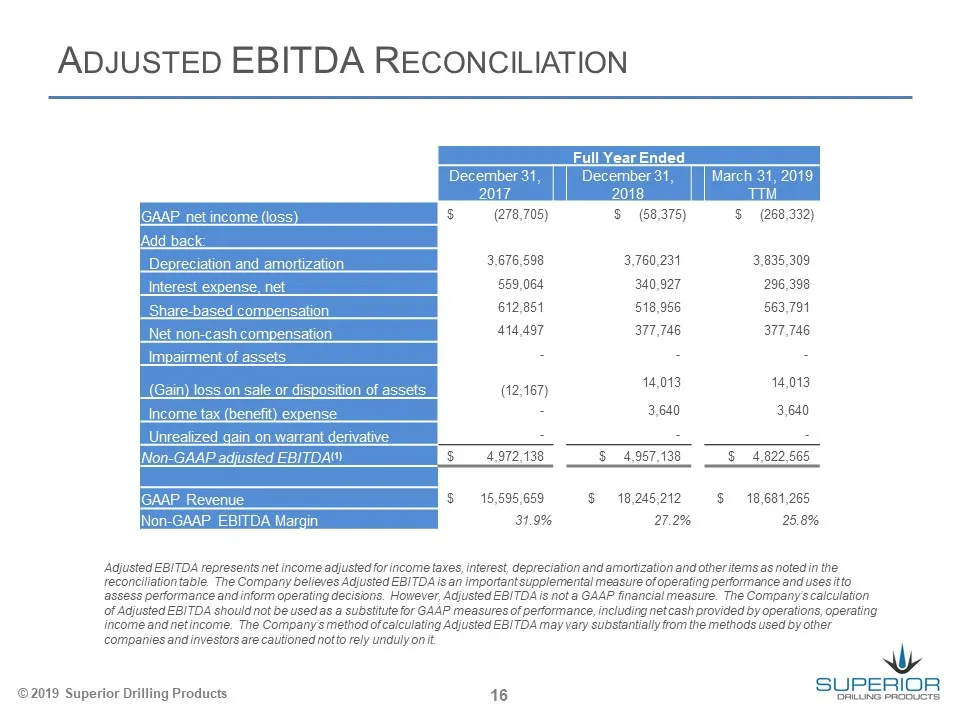
Slide 16: Adjusted EBITDA Reconciliation
ADJUSTED EBITDA RECONCILIATION Full Year En December 31 March 31, 2019 018 TM (278,705) $ (68,375) $ (268,332) 3,676,598 3,760,231 3,836,309 559,064 340,927 296,398 sation 612,851 518,956 563,791 414497 377.746 sr. ir ment of assets - le or disposition of (12,167) M18 a8 Income tax (benefit) expe -
Source: SEC EDGAR · 8-K filed May 9, 2019
More decks from Superior Drilling Products Inc
 Q3 2023 Earnings Presentation12 slides · Nov 9, 2023
 Q2 2023 Earnings Presentation12 slides · Aug 14, 2023
 Q1 2023 Earnings Presentation12 slides · May 15, 2023
 FY2022 Earnings Presentation13 slides · Mar 10, 2023
 Q3 2022 Earnings Presentation12 slides · Nov 14, 2022
 MicroCap Rodeo Windy City Roundup 202220 slides · Oct 12, 2022