M3, Inc. · TSE:2413
M3 — FY2020 Earnings Presentation
27 slides from M3's earnings presentation, April 2021
Slide 1: M3, Inc. Presentation Material April 2021
M3, Inc. Presentation Material April 2021 Copyright © 2021 M3, Inc. All rights reserved.
Slide 2: Forward-looking statements disclaimer
The following presentation contains forecasts, future plans, management targets and other forward-looking projections relating to M3, Inc. and/or its group. These statements are drawn from assumptions of future events based on data currently available to us, and there exist possibilities that such a
Slide 3: FY2020 Consolidated Results
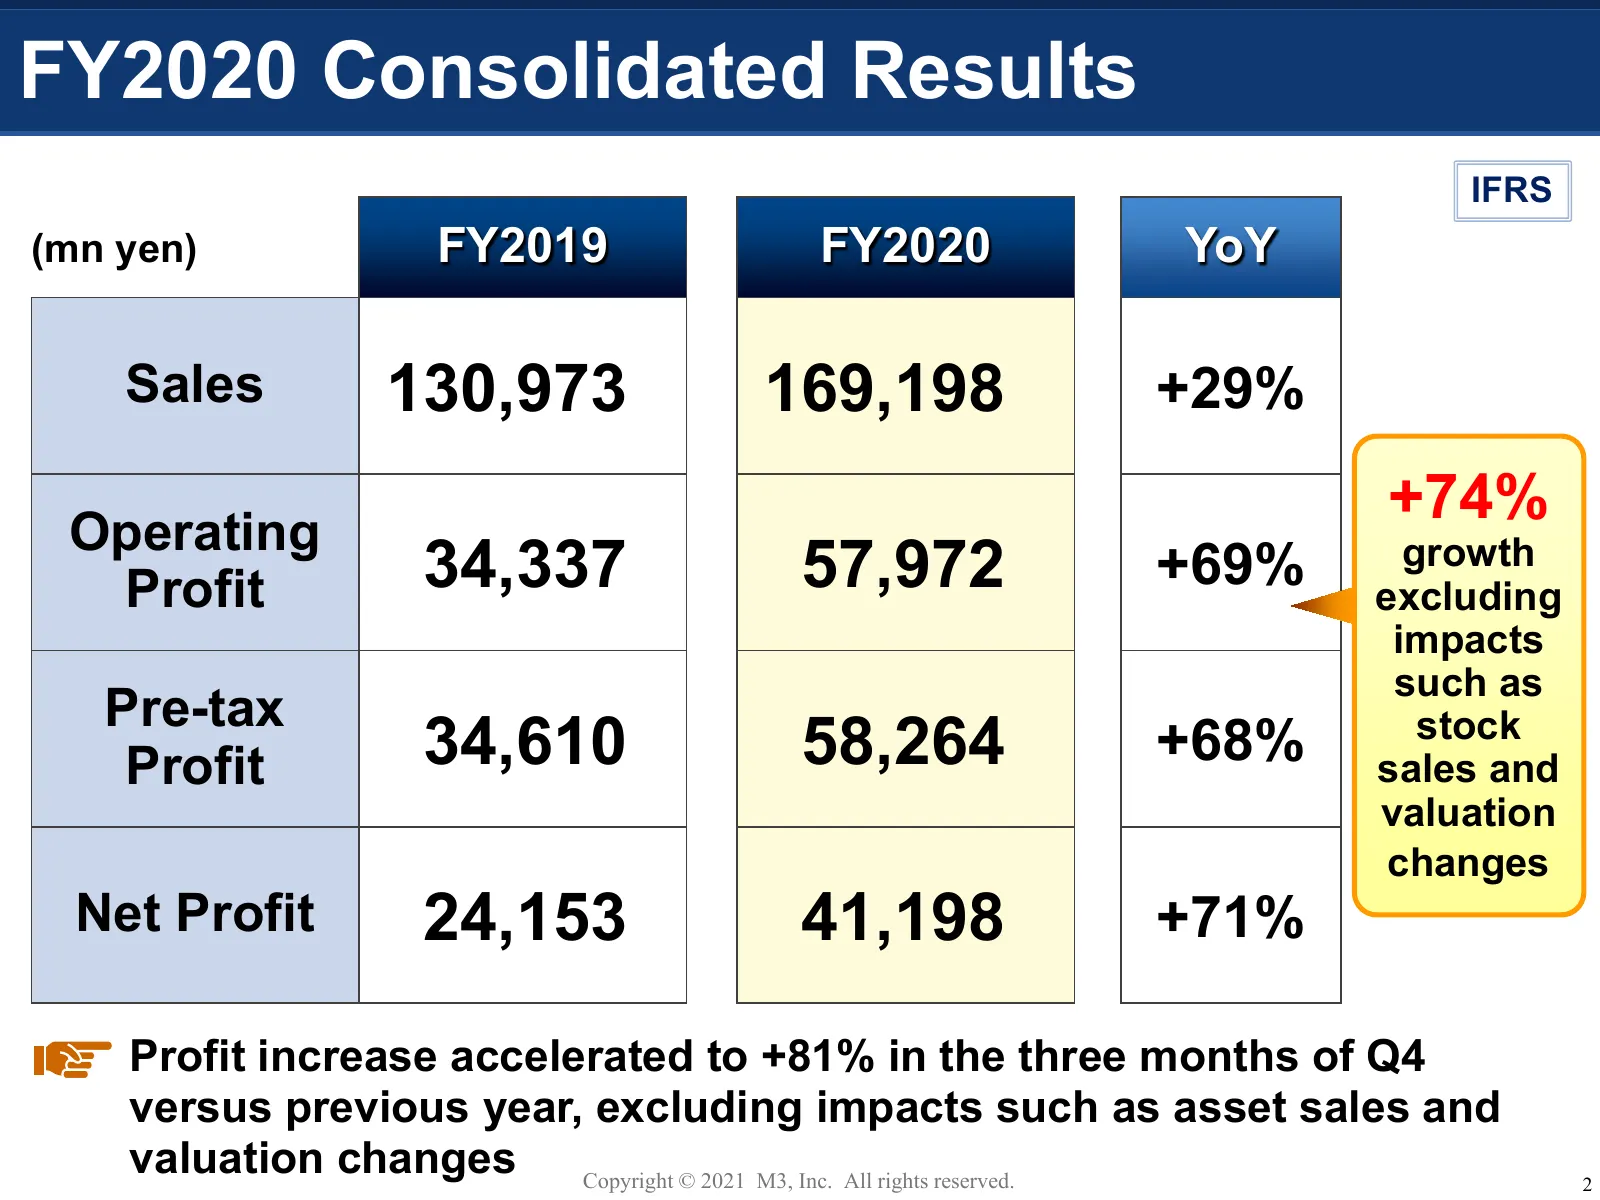
FY2020 Consolidated Results IFRS (mn yen) FY2019 FY2020 YoY Sales 130,973 169,198 +29% +74% Operating Profit 34,337 57,972 +69% growth excluding impacts such as Pre-tax Profit 34,610 58,264 +68% stock sales and valuation changes Net Profit 24,153 41,198 +71% Profit increase accelerated to +81% in th
Slide 4: FY2020 Consolidated Results by Segment
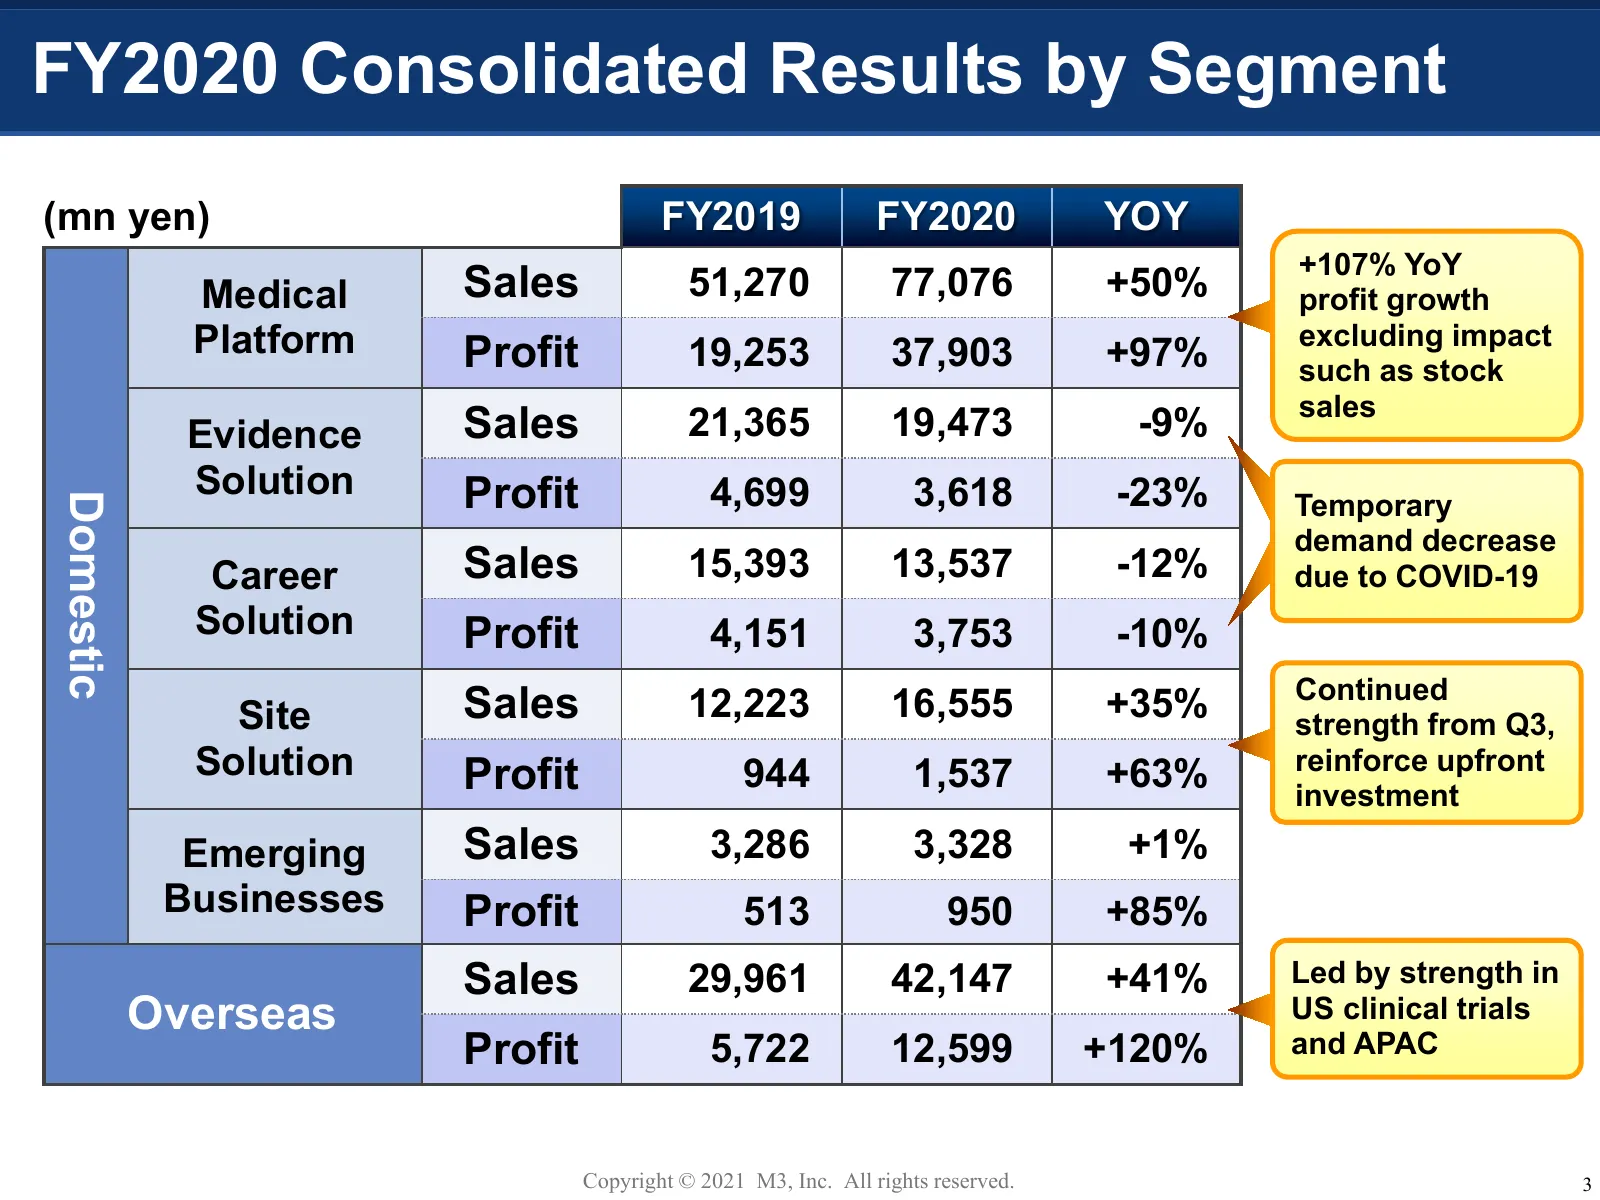
FY2020 Consolidated Results by Segment (mn yen) FY2019 FY2020 YOY +107% YoY Medical Sales 51,270 77,076 +50% profit growth Platform Profit 19,253 37,903 +97% excluding impact such as stock sales Evidence Sales 21,365 19,473 -9% Solution Profit 4,699 3,618 -23% Temporary Domestic demand decrease Care
Slide 5: FY2020 Consolidated Operating Profit Contribution
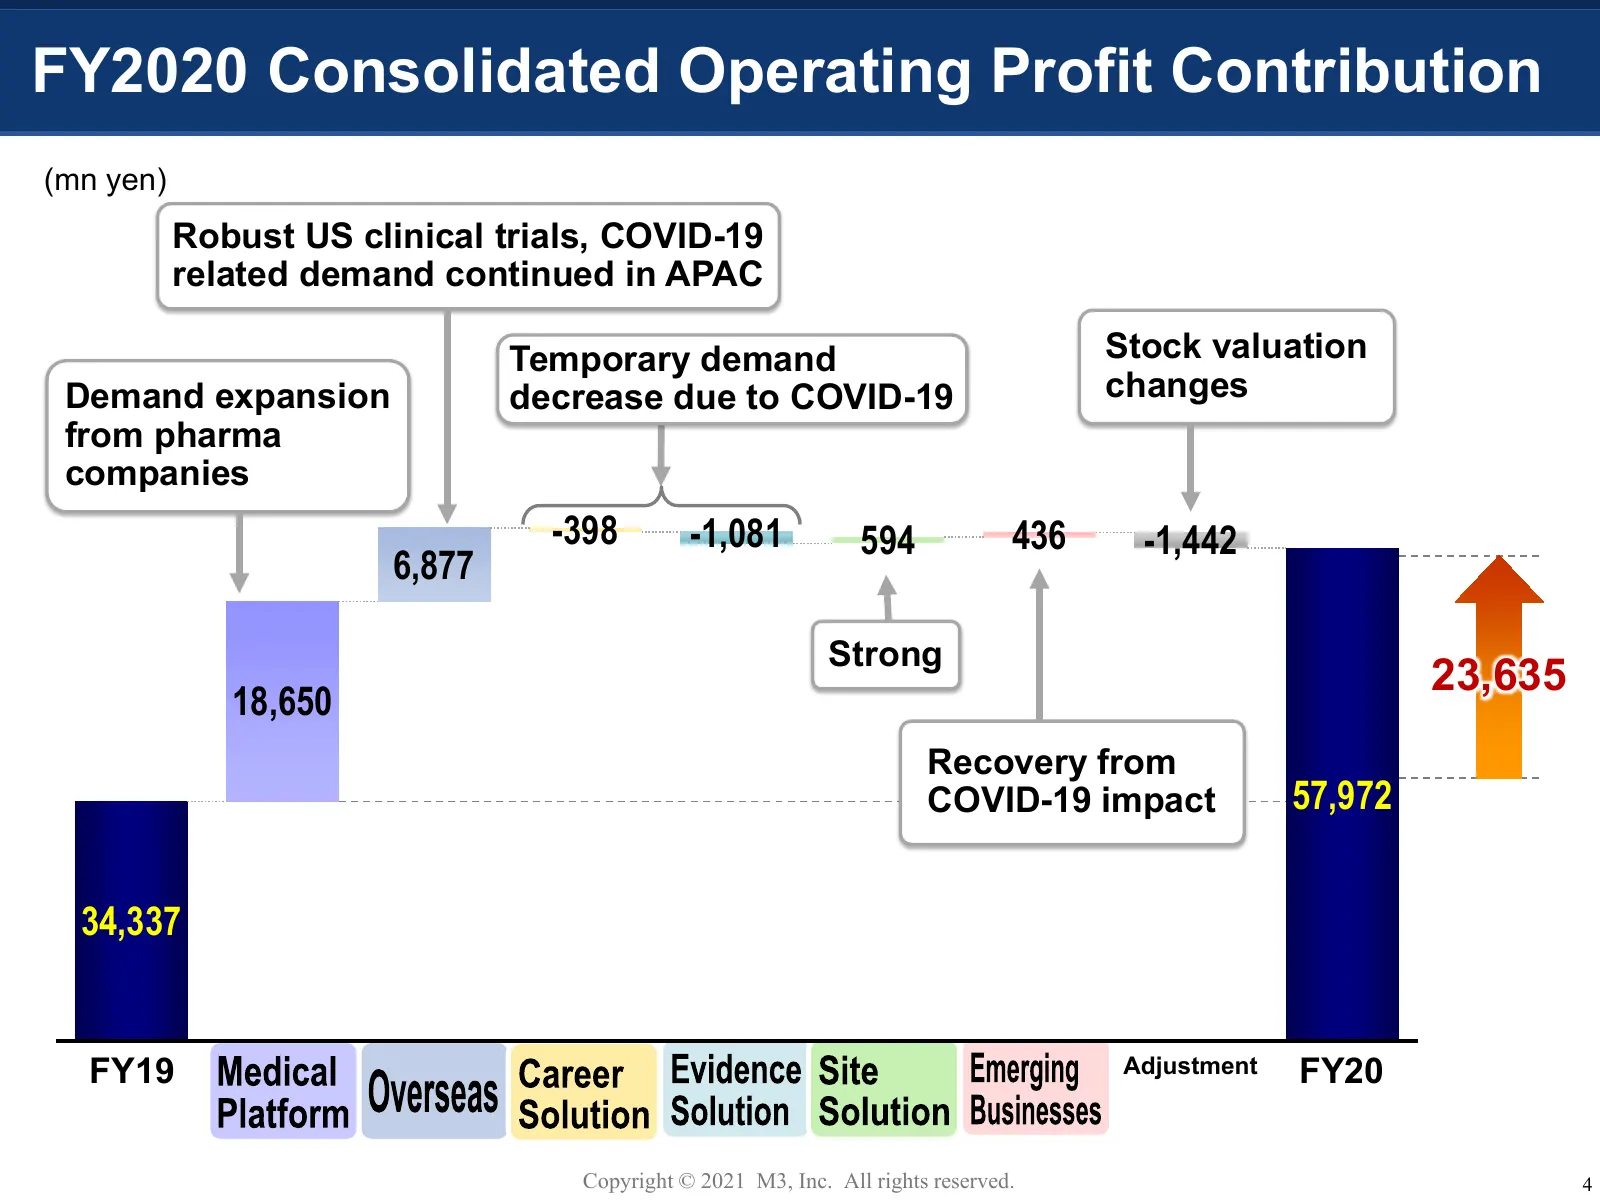
FY2020 Consolidated Operating Profit Contribution (mn yen) Robust US clinical trials, COVID-19 related demand continued in APAC Temporary demand Stock valuation Demand expansion decrease due to COVID-19 changes from pharma companies -398 -1,081 594 436 -1,442 6,877 Strong 23,635 18,650 Recovery from
Slide 6: FY2020 Overview
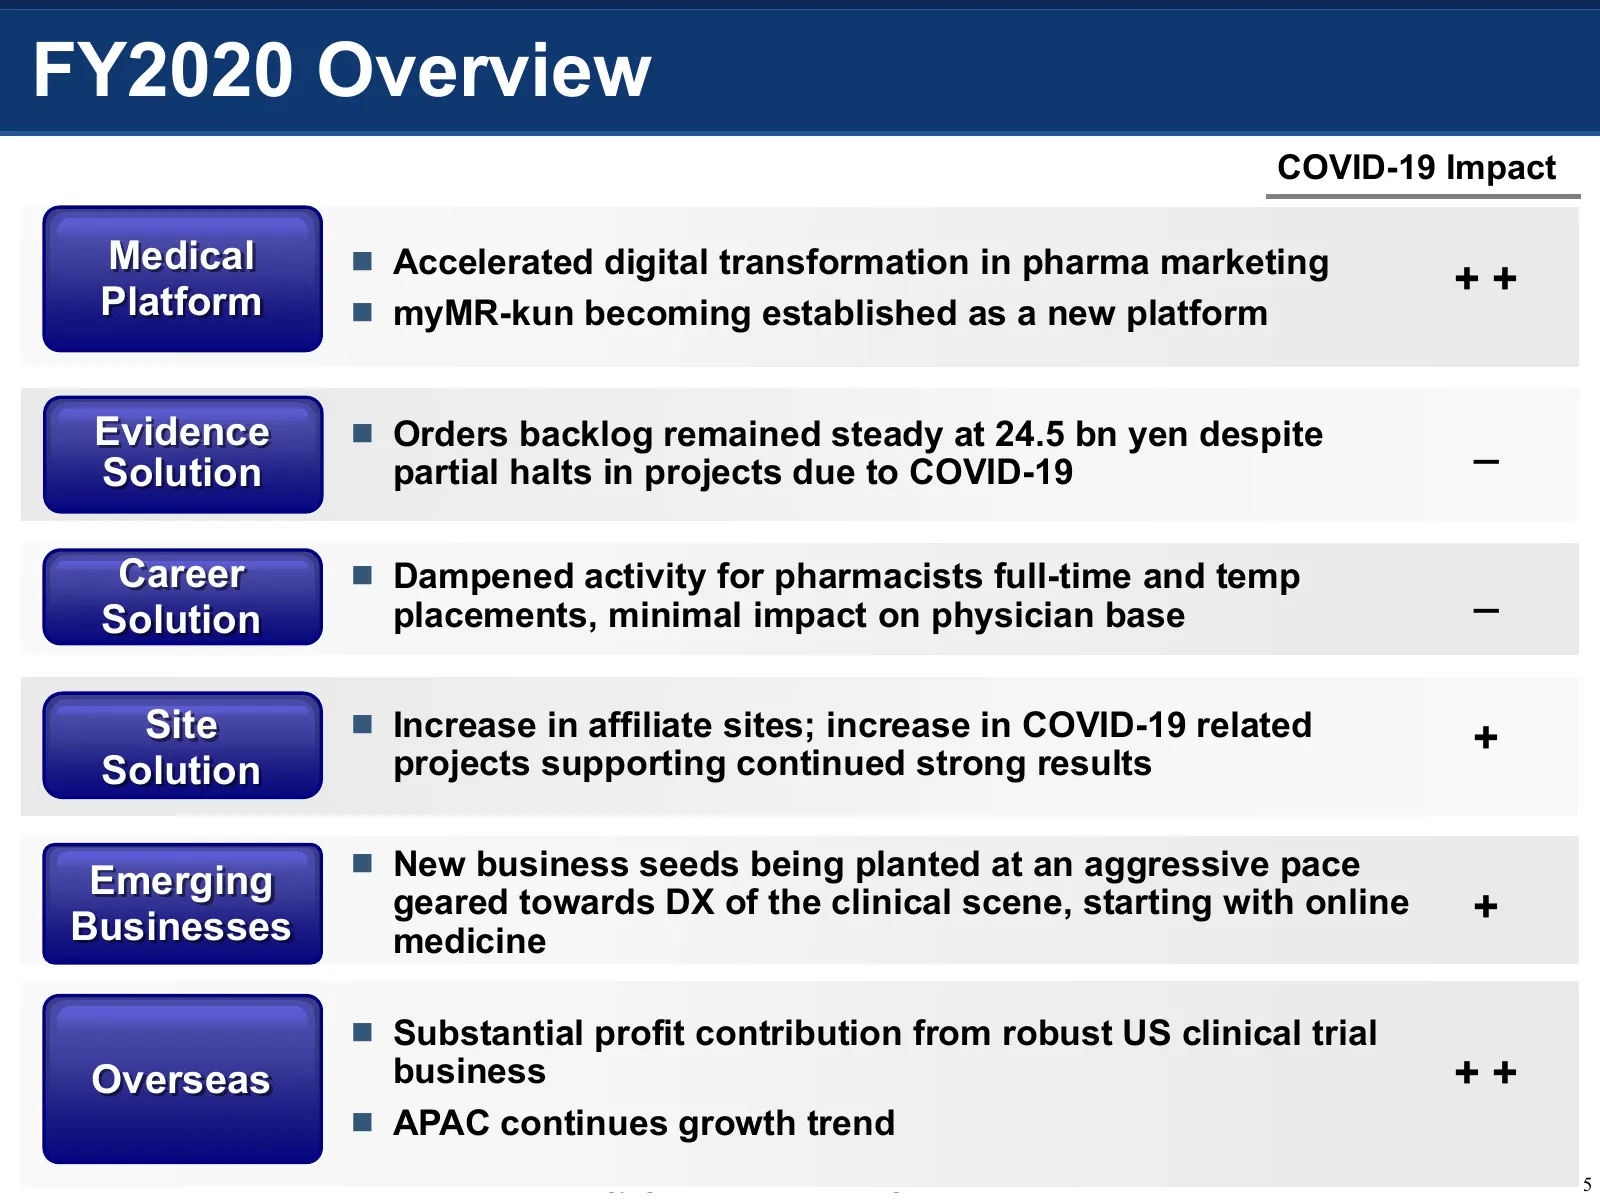
FY2020 Overview COVID-19 Impact Medical Accelerated digital transformation in pharma marketing Platform ++ myMR-kun becoming established as a new platform Evidence Orders backlog remained steady at 24.5 bn yen despite _ Solution partial halts in projects due to COVID-19 Career Dampened activ
Slide 7: m3.com Platform Strength
m3.com Platform Strength Copyright © 2021 M3, Inc. All rights reserved. 6
Slide 8: m3.com Tops 300,000 Members, Gross Profits Double
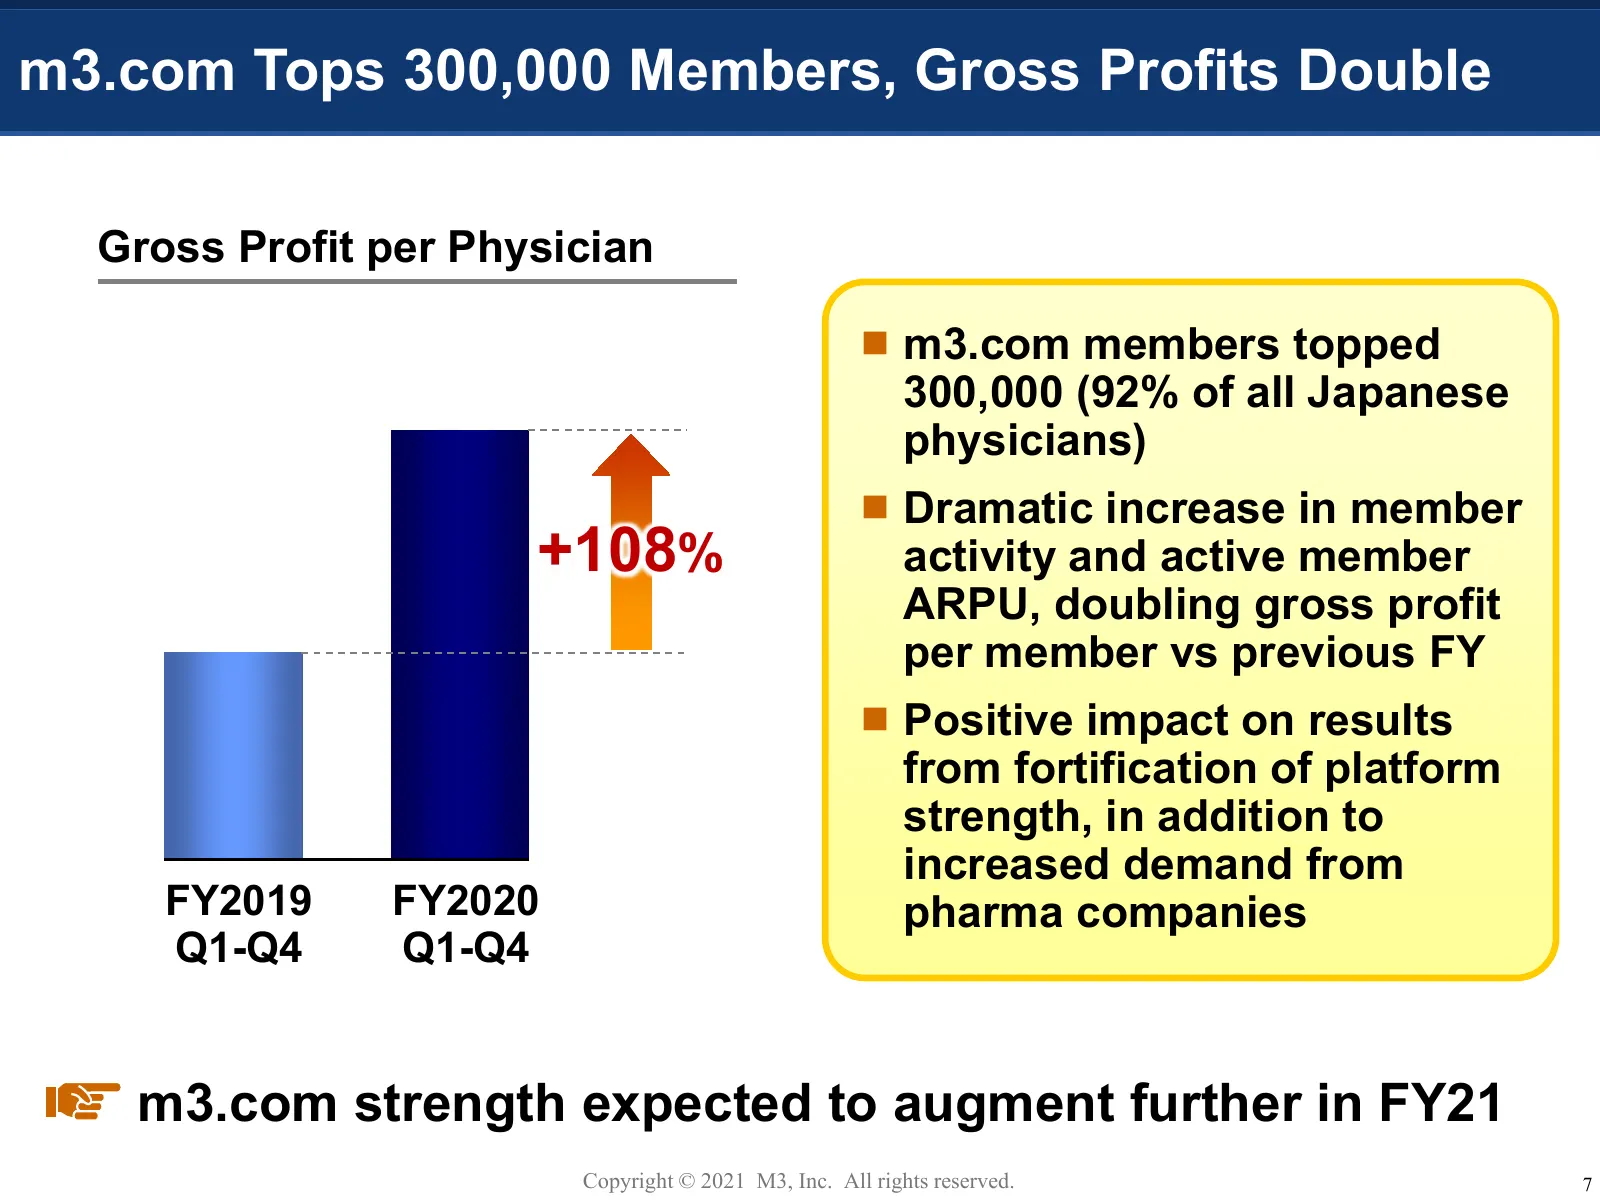
m3.com Tops 300,000 Members, Gross Profits Double Gross Profit per Physician m3.com members topped 300,000 (92% of all Japanese physicians) Dramatic increase in member +108% activity and active member ARPU, doubling gross profit per member vs previous FY Positive impact on results from fortifi
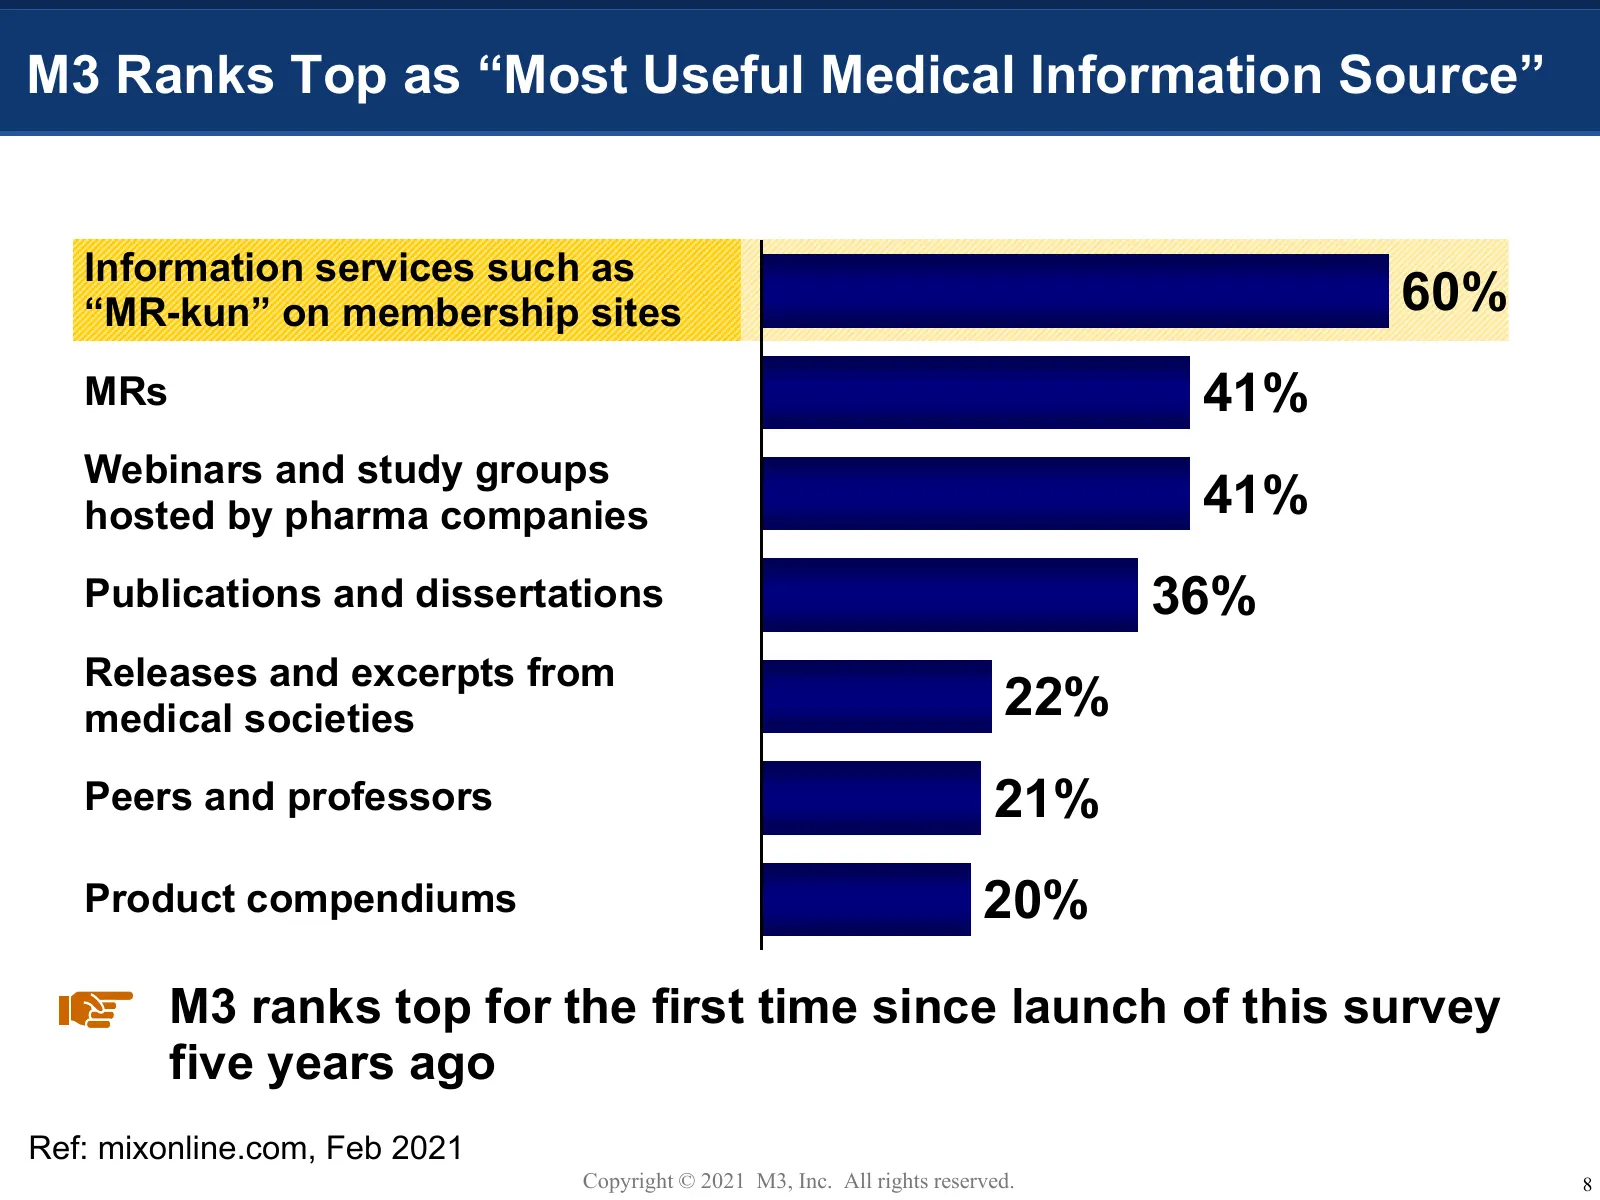
Slide 9: M3 Ranks Top as "Most Useful Medical Information Source"
M3 Ranks Top as “Most Useful Medical Information Source” Information services such as “MR-kun” on membership sites 60% MRs 41% Webinars and study groups hosted by pharma companies 41% Publications and dissertations 36% Releases and excerpts from medical societies 22% Peers and professors 21% Product

Slide 10: Pharmaceutical Sales & Marketing DX
Pharmaceutical Sales & Marketing DX Copyright © 2021 M3, Inc. All rights reserved. 9
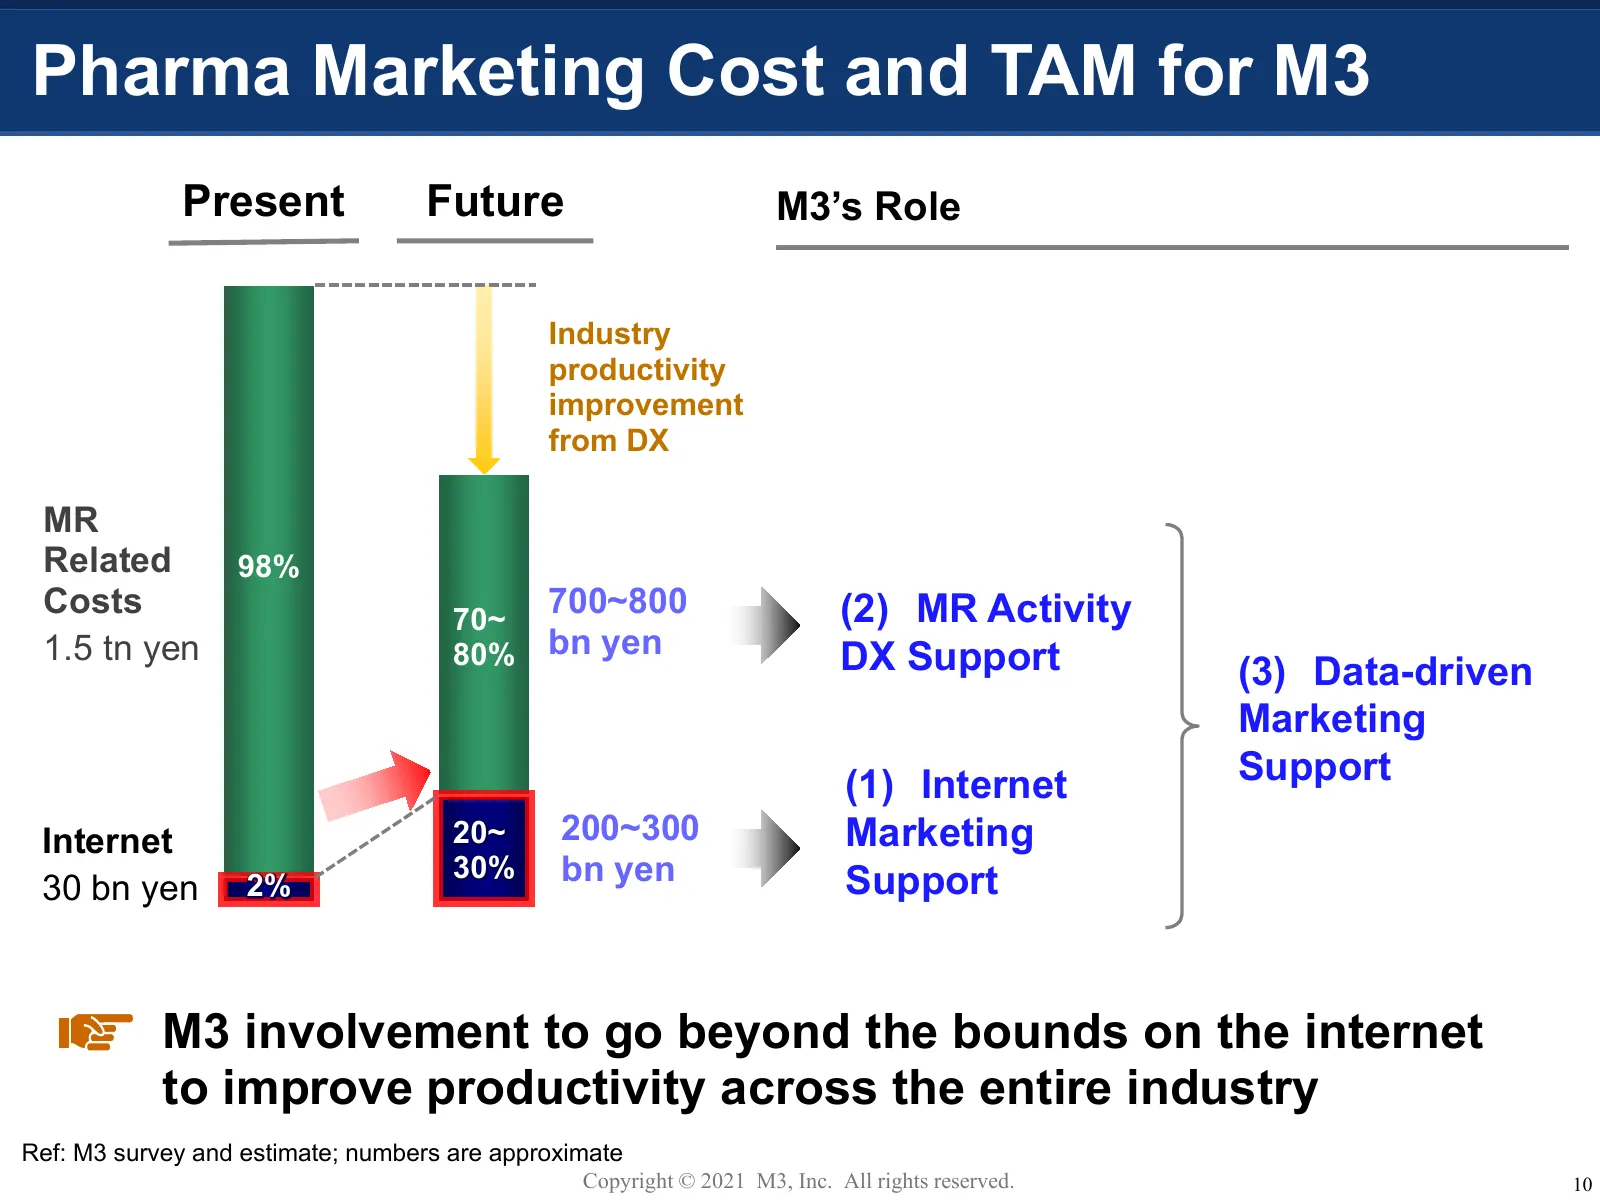
Slide 11: Pharma Marketing Cost and TAM for M3
Pharma Marketing Cost and TAM for M3 Present Future M3’s Role Industry productivity improvement from DX MR Related 98% Costs 70~ 700~800 (2) MR Activity 1.5 tn yen 80% bn yen DX Support (3) Data-driven Marketing (1) Internet Support Internet 20~ 200~300 Marketing 30% bn yen Support 30 bn yen 2% M3 i
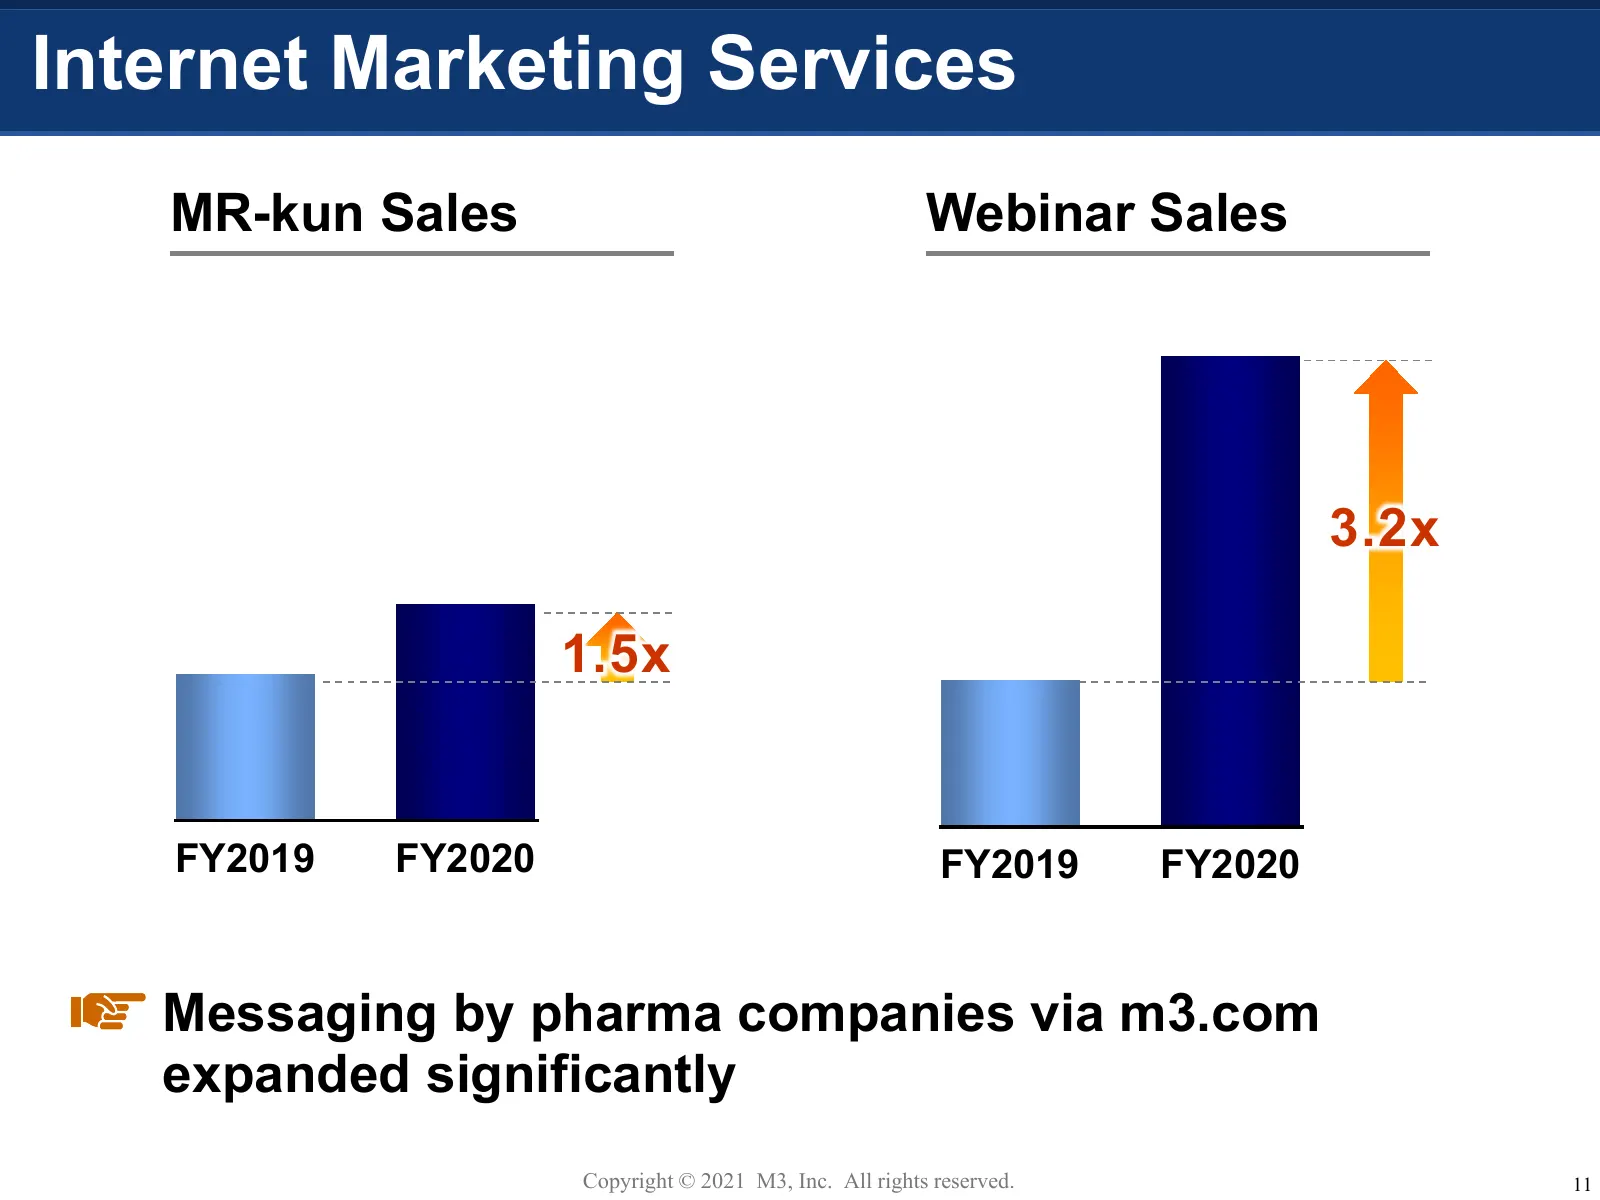
Slide 12: Internet Marketing Services
Internet Marketing Services MR-kun Sales Webinar Sales 3.2x 1.5x FY2019 FY2020 FY2019 FY2020 Messaging by pharma companies via m3.com expanded significantly Copyright © 2021 M3, Inc. All rights reserved. 11
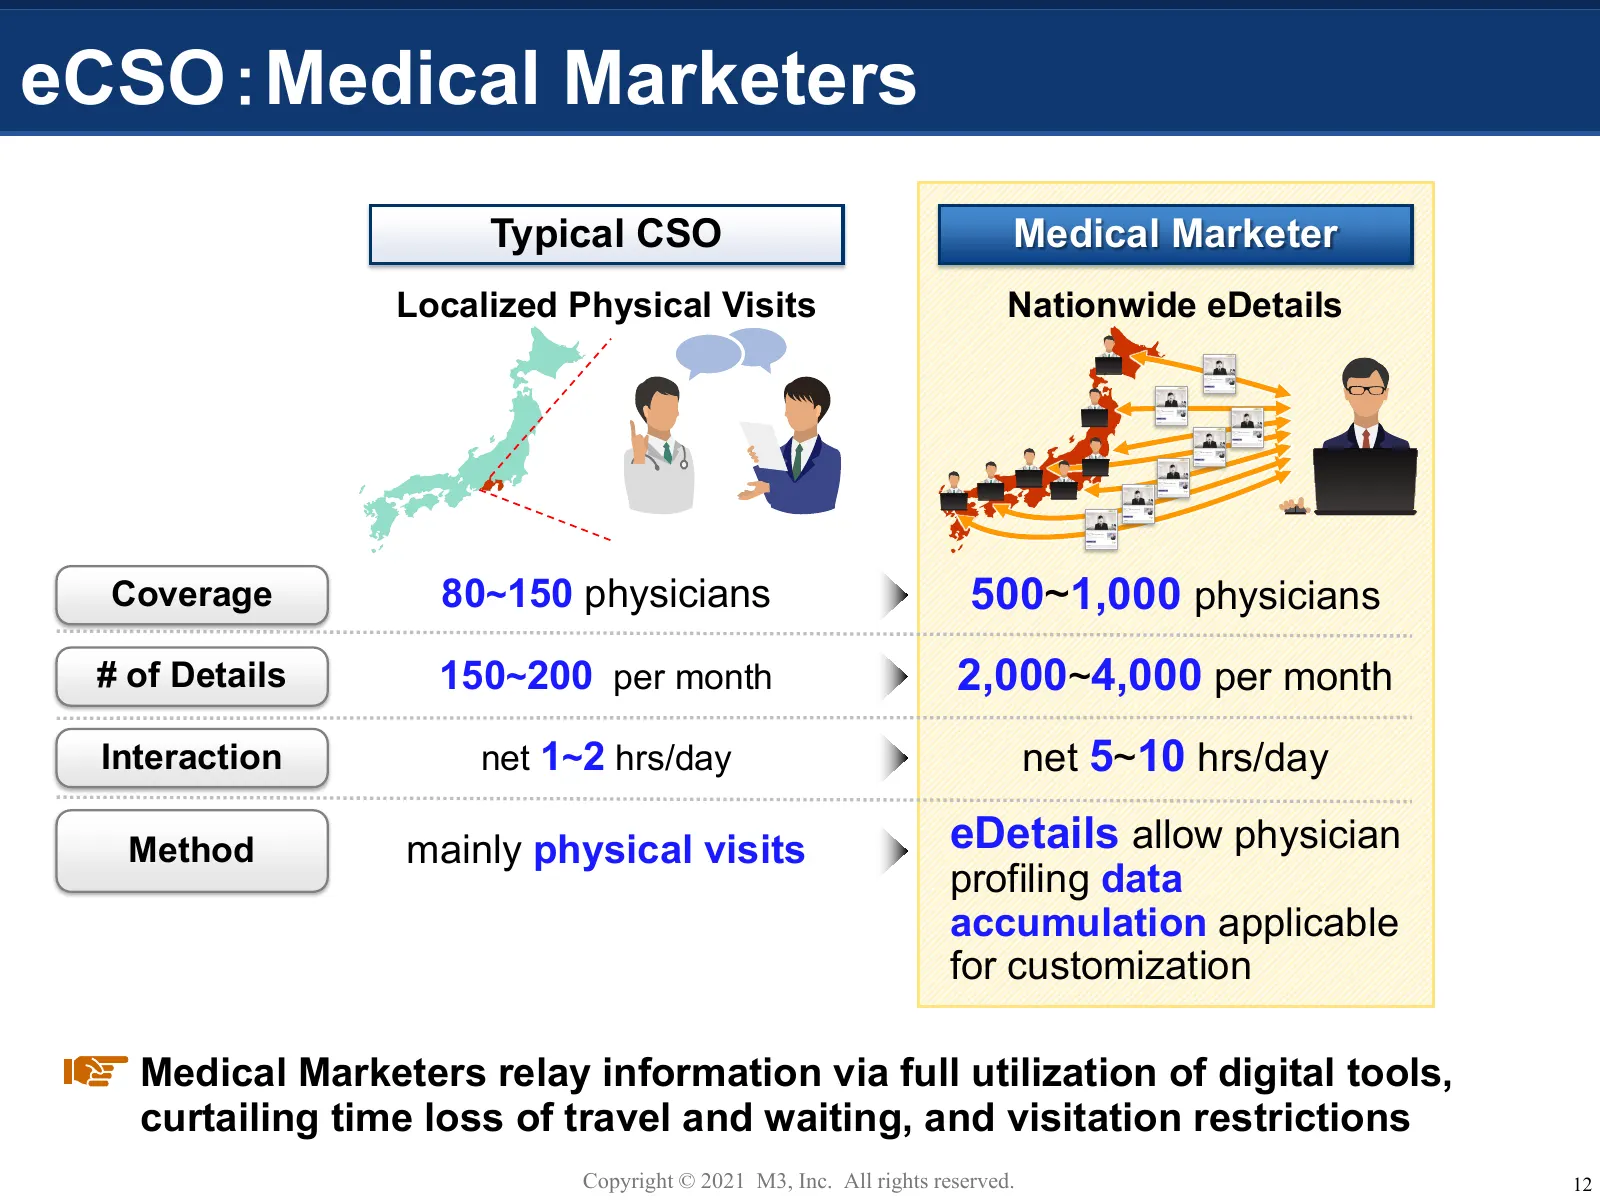
Slide 13: eCSO: Medical Marketers
eCSO:Medical Marketers Typical CSO Medical Marketer Localized Physical Visits Nationwide eDetails Coverage 80~150 physicians 500~1,000 physicians # of Details 150~200 per month 2,000~4,000 per month Interaction net 1~2 hrs/day net 5~10 hrs/day Method mainly physical visits eDetails allow physician p
Slide 14: DX of the Clinical Scene
DX of the Clinical Scene Copyright © 2021 M3, Inc. All rights reserved. 13
Slide 15: DX of Clinics
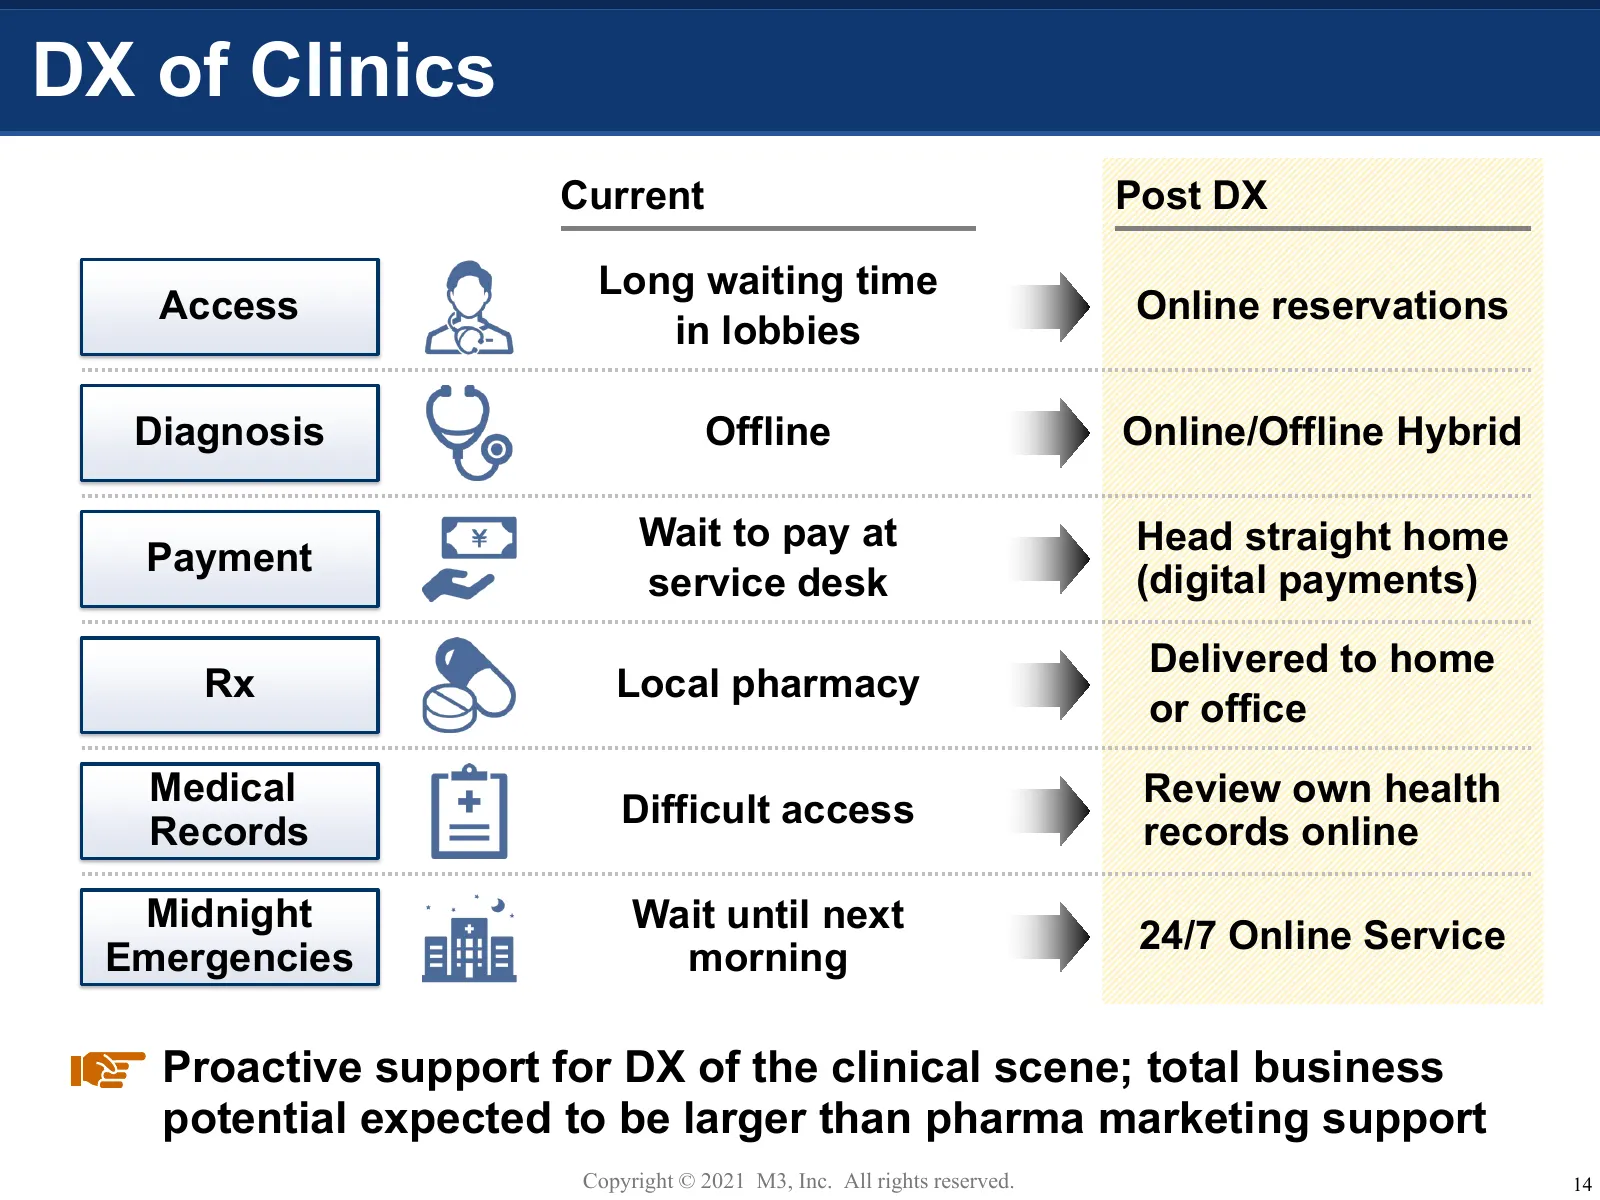
DX of Clinics Current Post DX Long waiting time Access Online reservations in lobbies Diagnosis Offline Online/Offline Hybrid Wait to pay at Head straight home Payment service desk (digital payments) Delivered to home Rx Local pharmacy or office Medical Review own health Difficult access Records rec
Slide 16: DX 1: M3 DigiKar EHR Growth
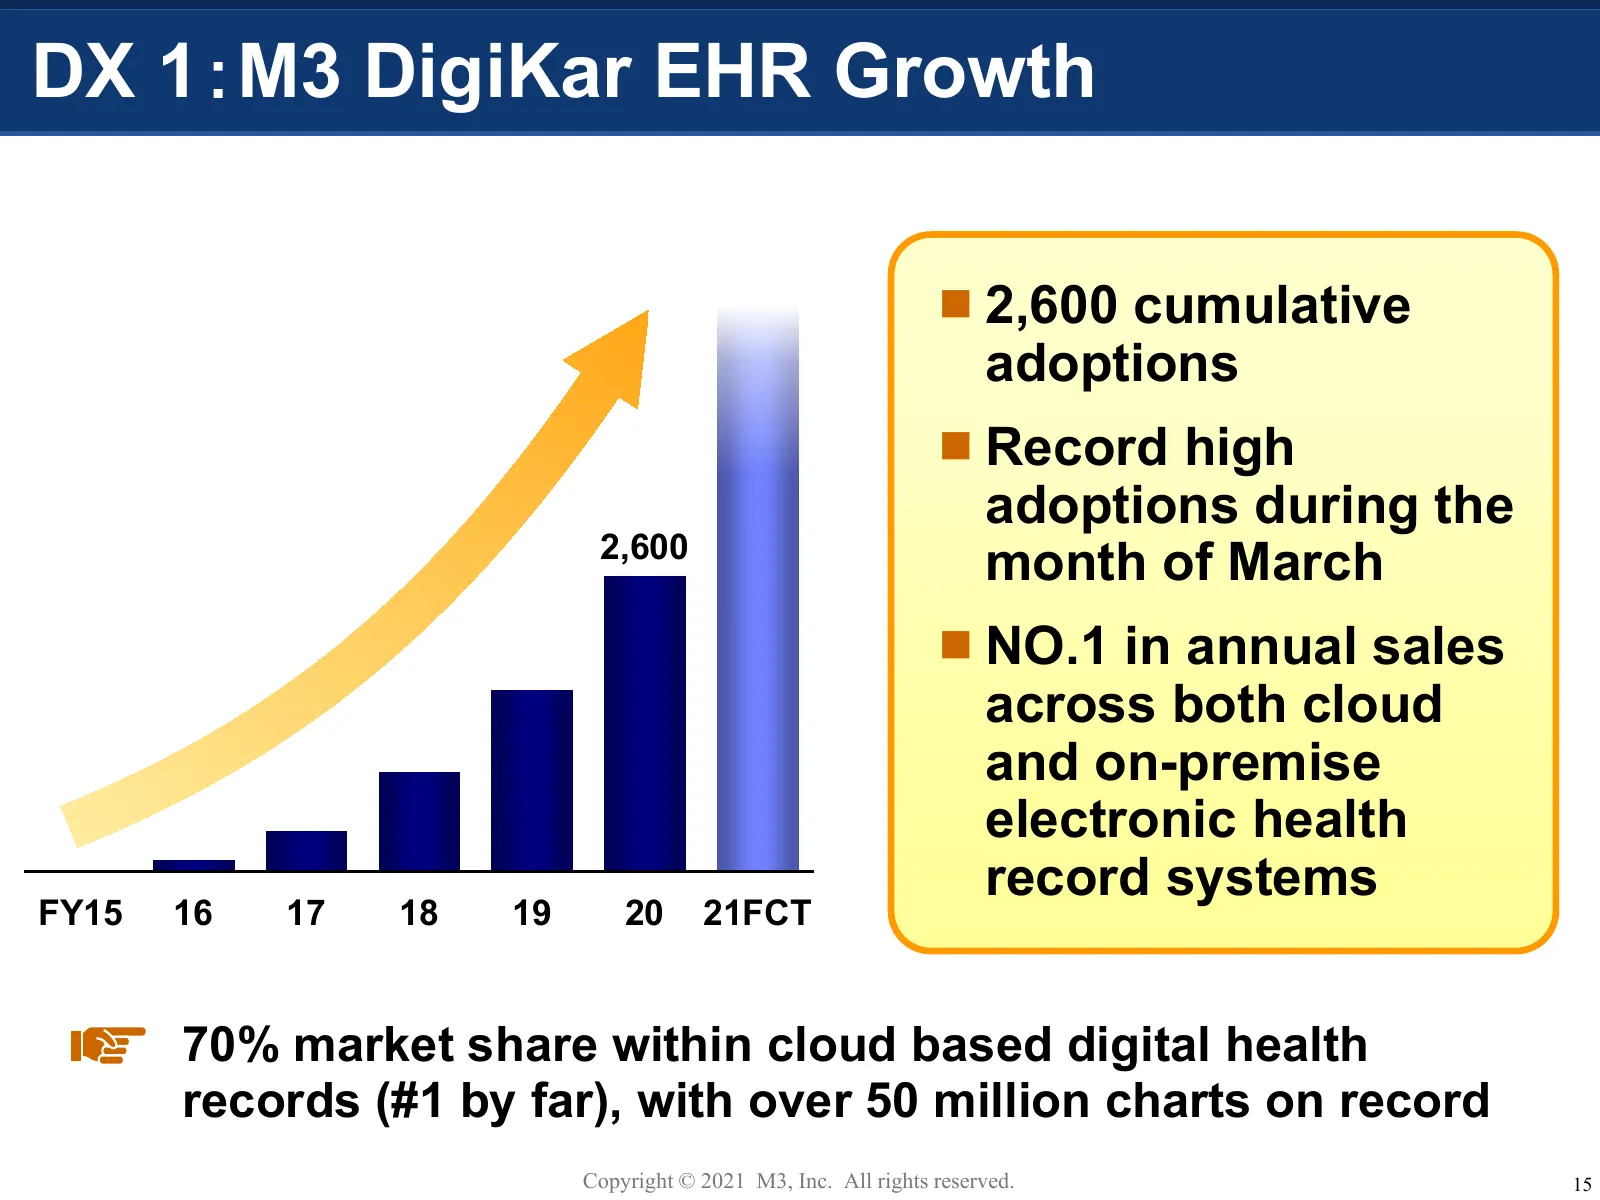
DX 1:M3 DigiKar EHR Growth 2,600 cumulative adoptions Record high adoptions during the 2,600 month of March NO.1 in annual sales across both cloud and on-premise electronic health record systems FY15 16 17 18 19 20 21FCT 70% market share within cloud based digital health records (#1 by far), w
Slide 17: DX 2: LINEDoctor
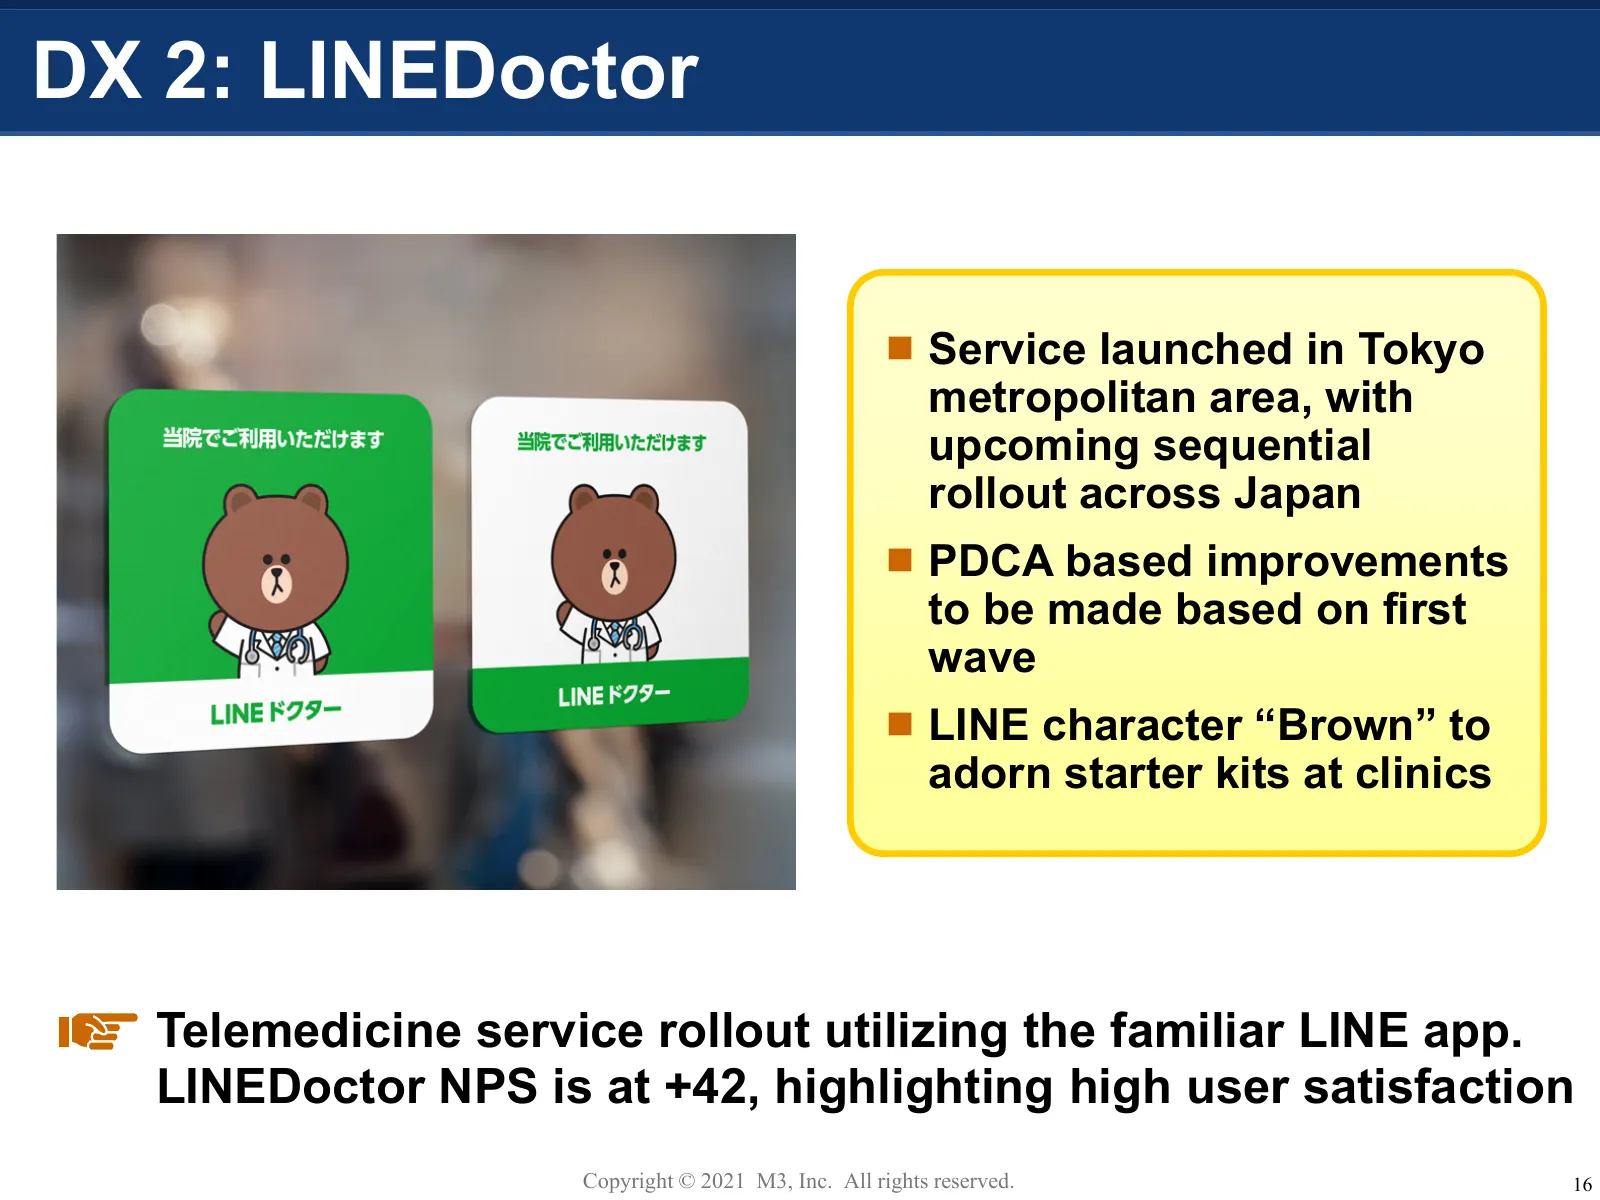
DX 2: LINEDoctor Service launched in Tokyo metropolitan area, with upcoming sequential rollout across Japan PDCA based improvements to be made based on first wave LINE character “Brown” to adorn starter kits at clinics Telemedicine service rollout utilizing the familiar LINE app. LINEDoctor NP
Slide 18: Ref: M3 Service NPS (Net Promoter Score)
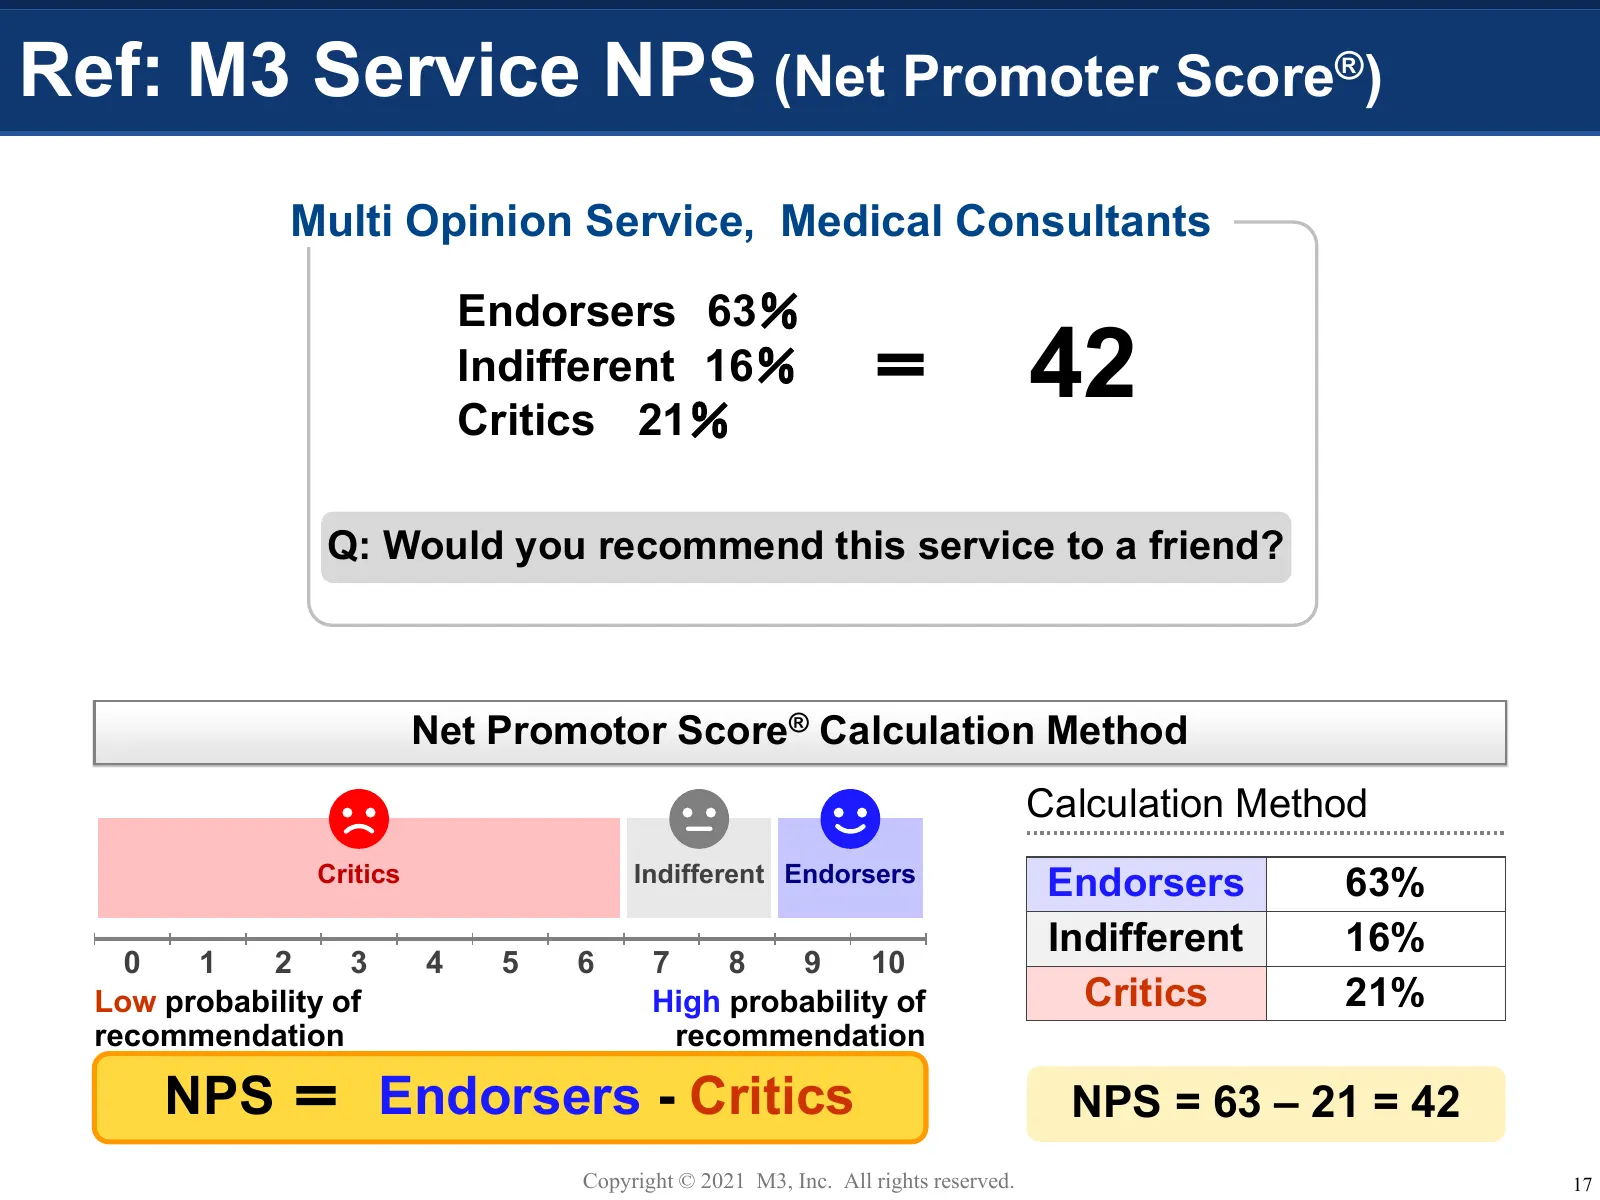
Ref: M3 Service NPS (Net Promoter Score®) Multi Opinion Service, Medical Consultants Endorsers 63% Indifferent 16% Critics 21% = 42 Q: Would you recommend this service to a friend? Net Promotor Score® Calculation Method Calculation Method Critics Indifferent Endorsers Endorsers 63% Indifferent 16% 0
Slide 19: LHC: Disease Awareness for the General Public
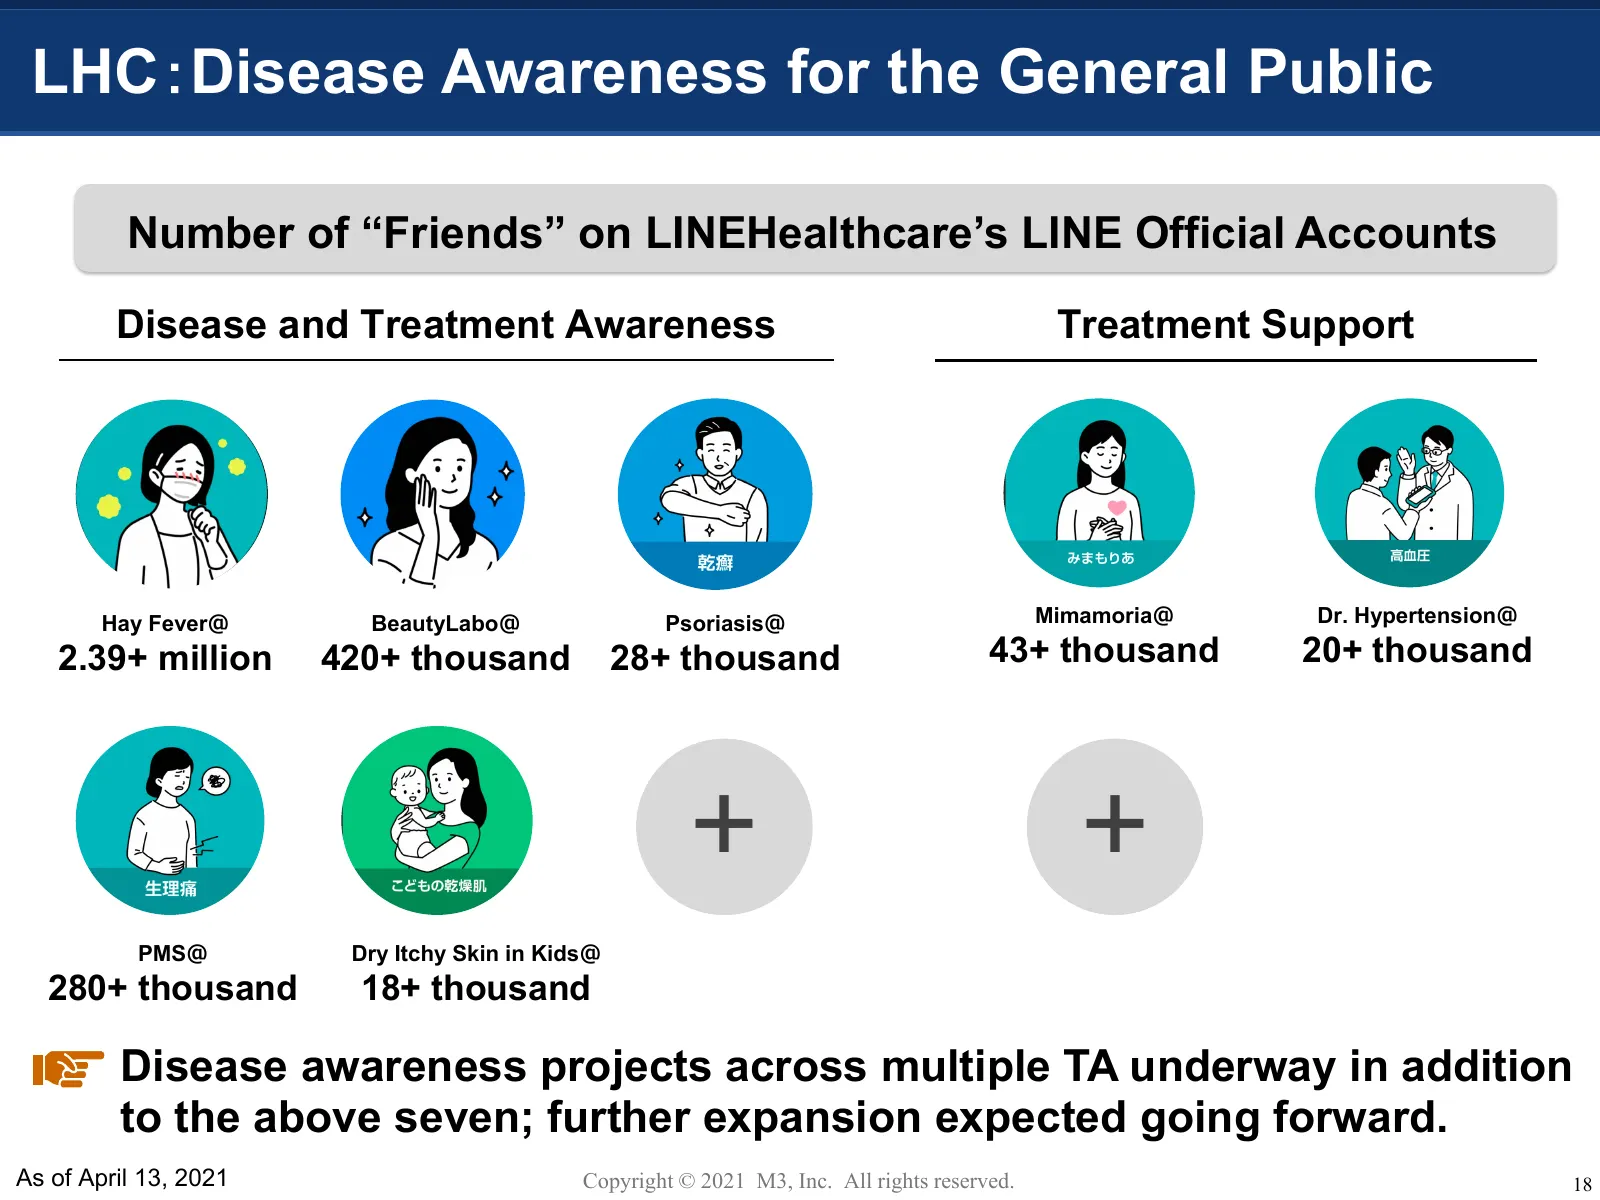
LHC:Disease Awareness for the General Public Number of “Friends” on LINEHealthcare’s LINE Official Accounts Disease and Treatment Awareness Treatment Support Hay Fever@ BeautyLabo@ Psoriasis@ Mimamoria@ Dr. Hypertension@ 2.39+ million 420+ thousand 28+ thousand 43+ thousand 20+ thousand + + PMS@ Dry
Slide 20: DX 3: Cashless Payment (expected May launch)
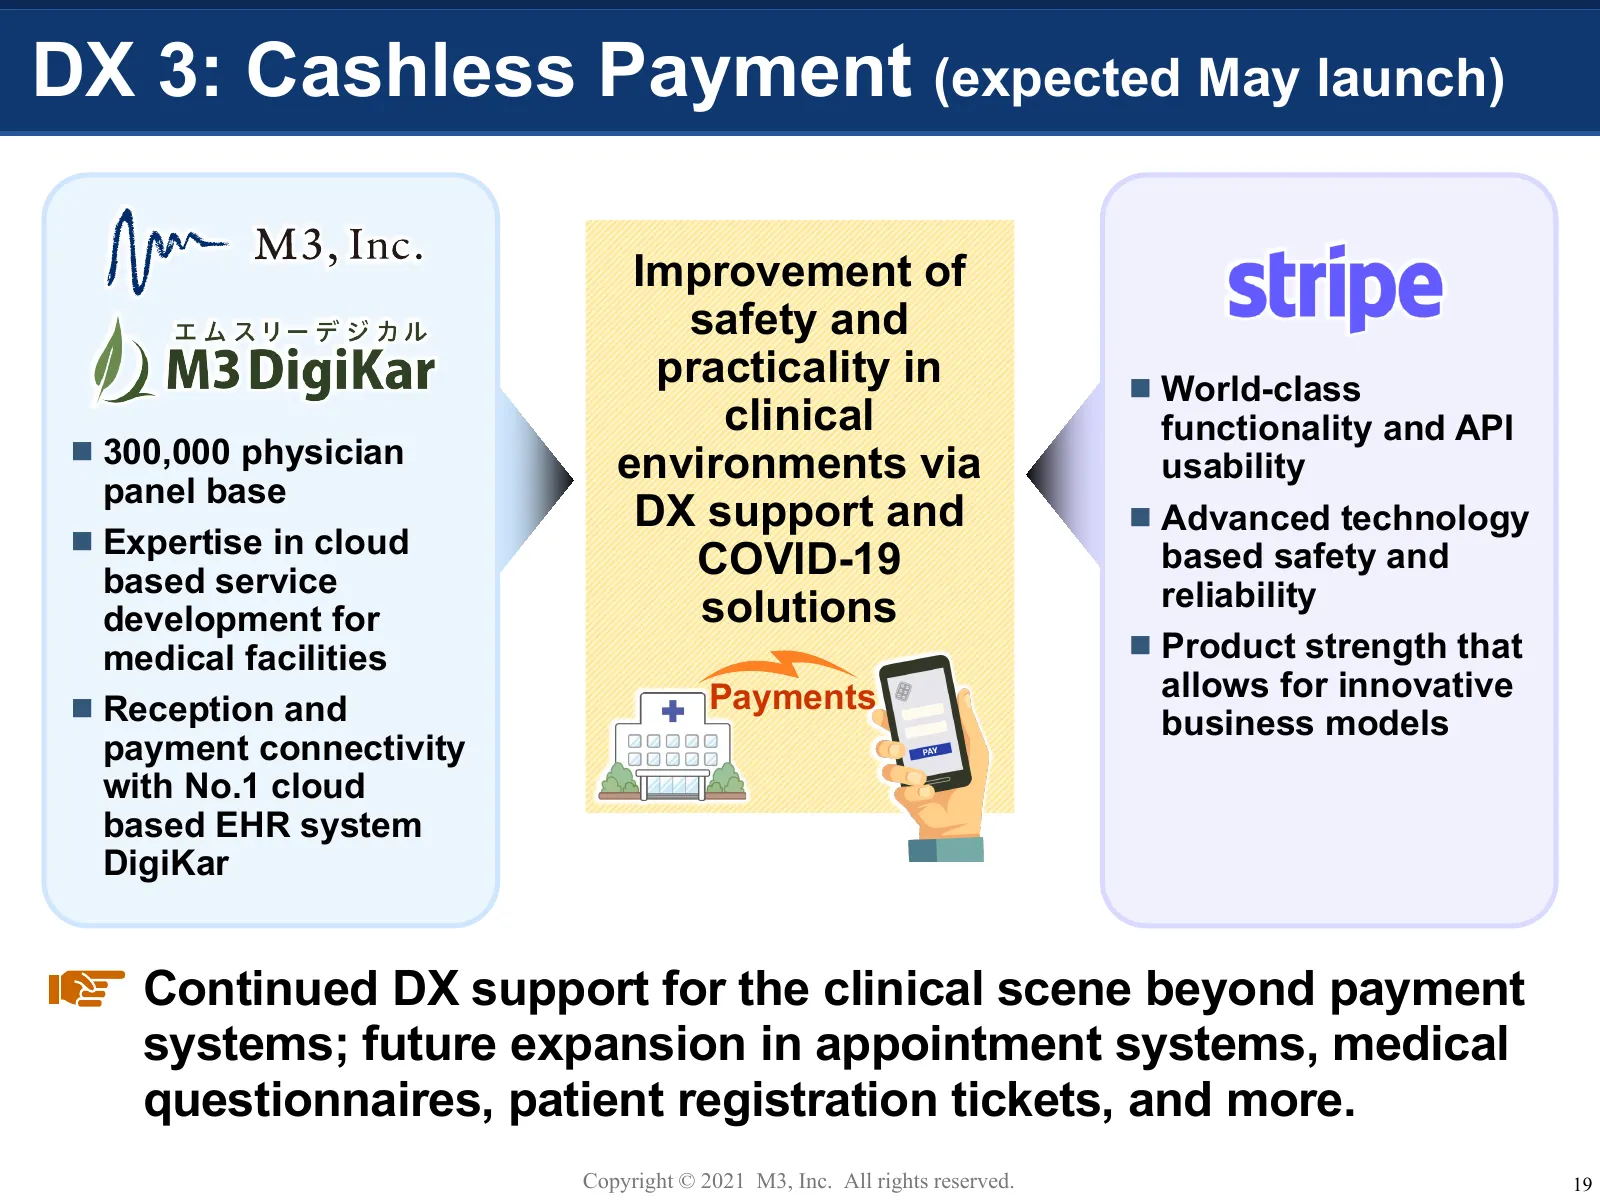
DX 3: Cashless Payment (expected May launch) Improvement of safety and practicality in World-class clinical functionality and API 300,000 physician environments via usability panel base DX support and Advanced technology Expertise in cloud based service COVID-19 based safety and solutions re
Slide 21: FY2021 Outlook
FY2021 Outlook Copyright © 2021 M3, Inc. All rights reserved. 20
Slide 22: FY2021 Outlook
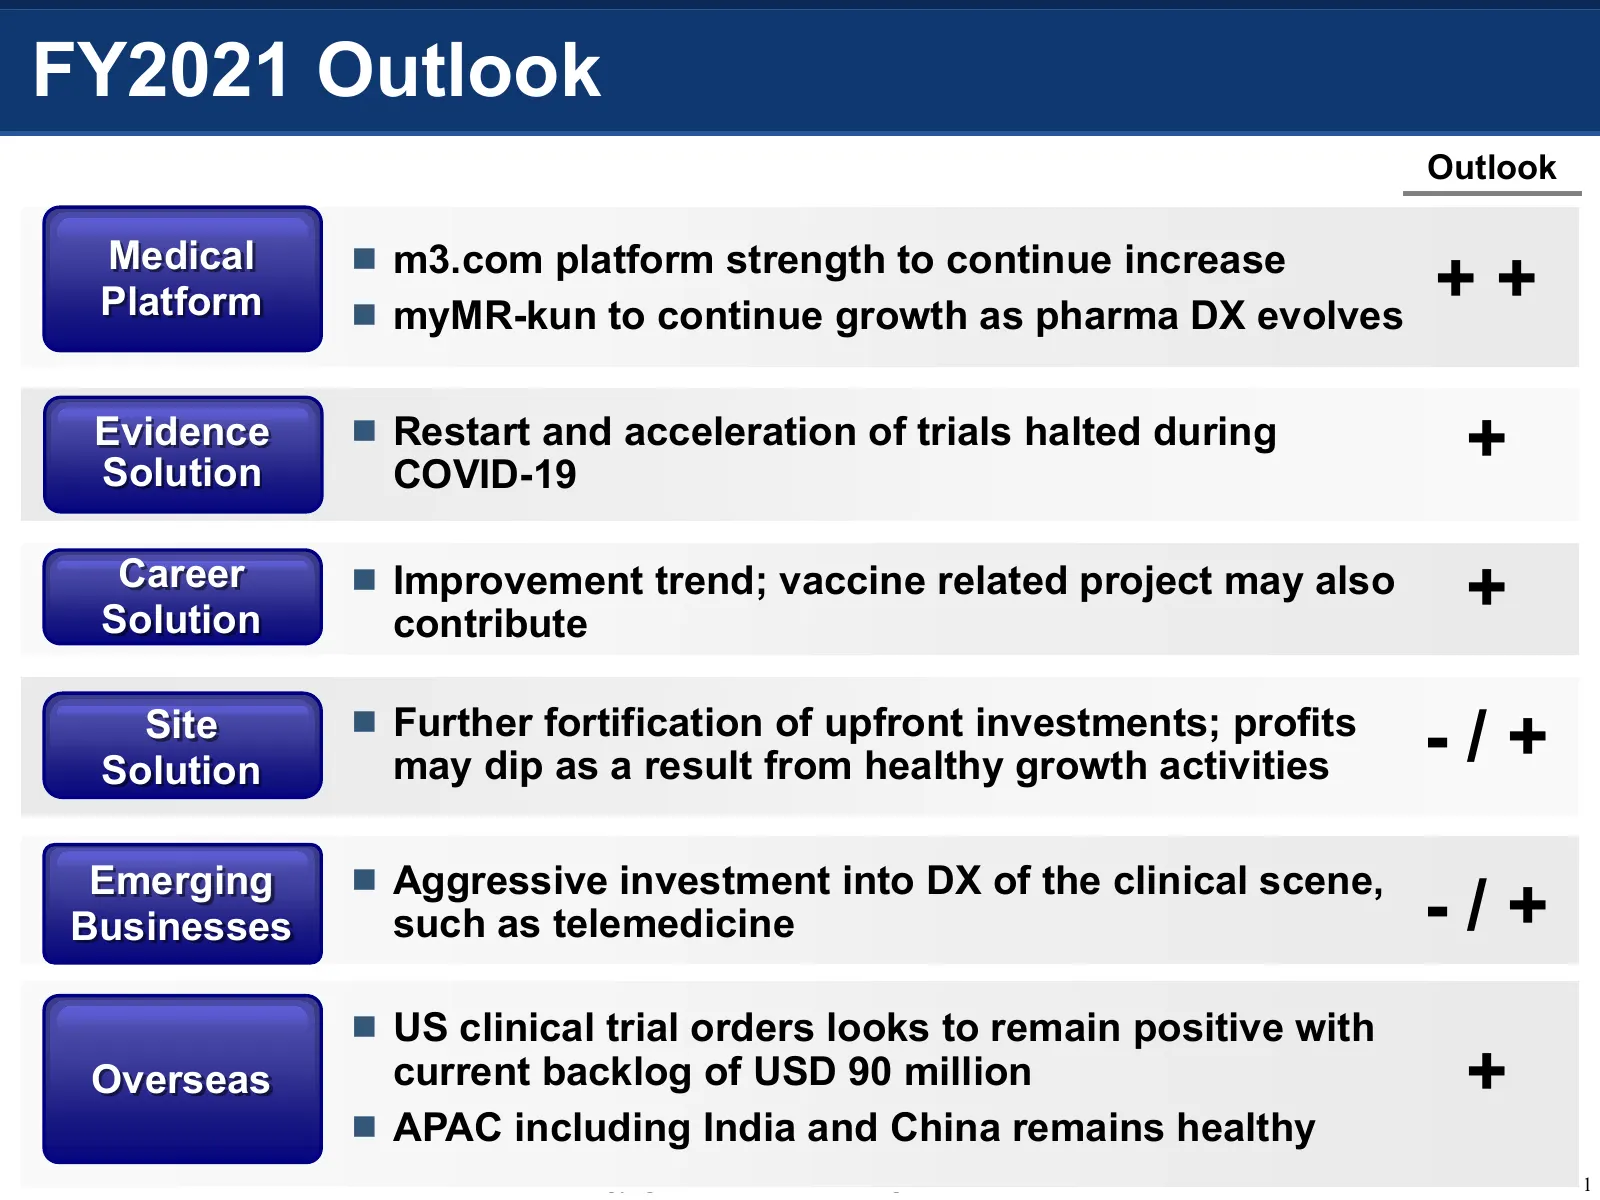
FY2021 Outlook Outlook Medical Platform m3.com platform strength to continue increase myMR-kun to continue growth as pharma DX evolves ++ Evidence Solution Restart and acceleration of trials halted during COVID-19 + Career Solution Improvement trend; vaccine related project may also contribu
Slide 23: M3's COVID-19 Efforts
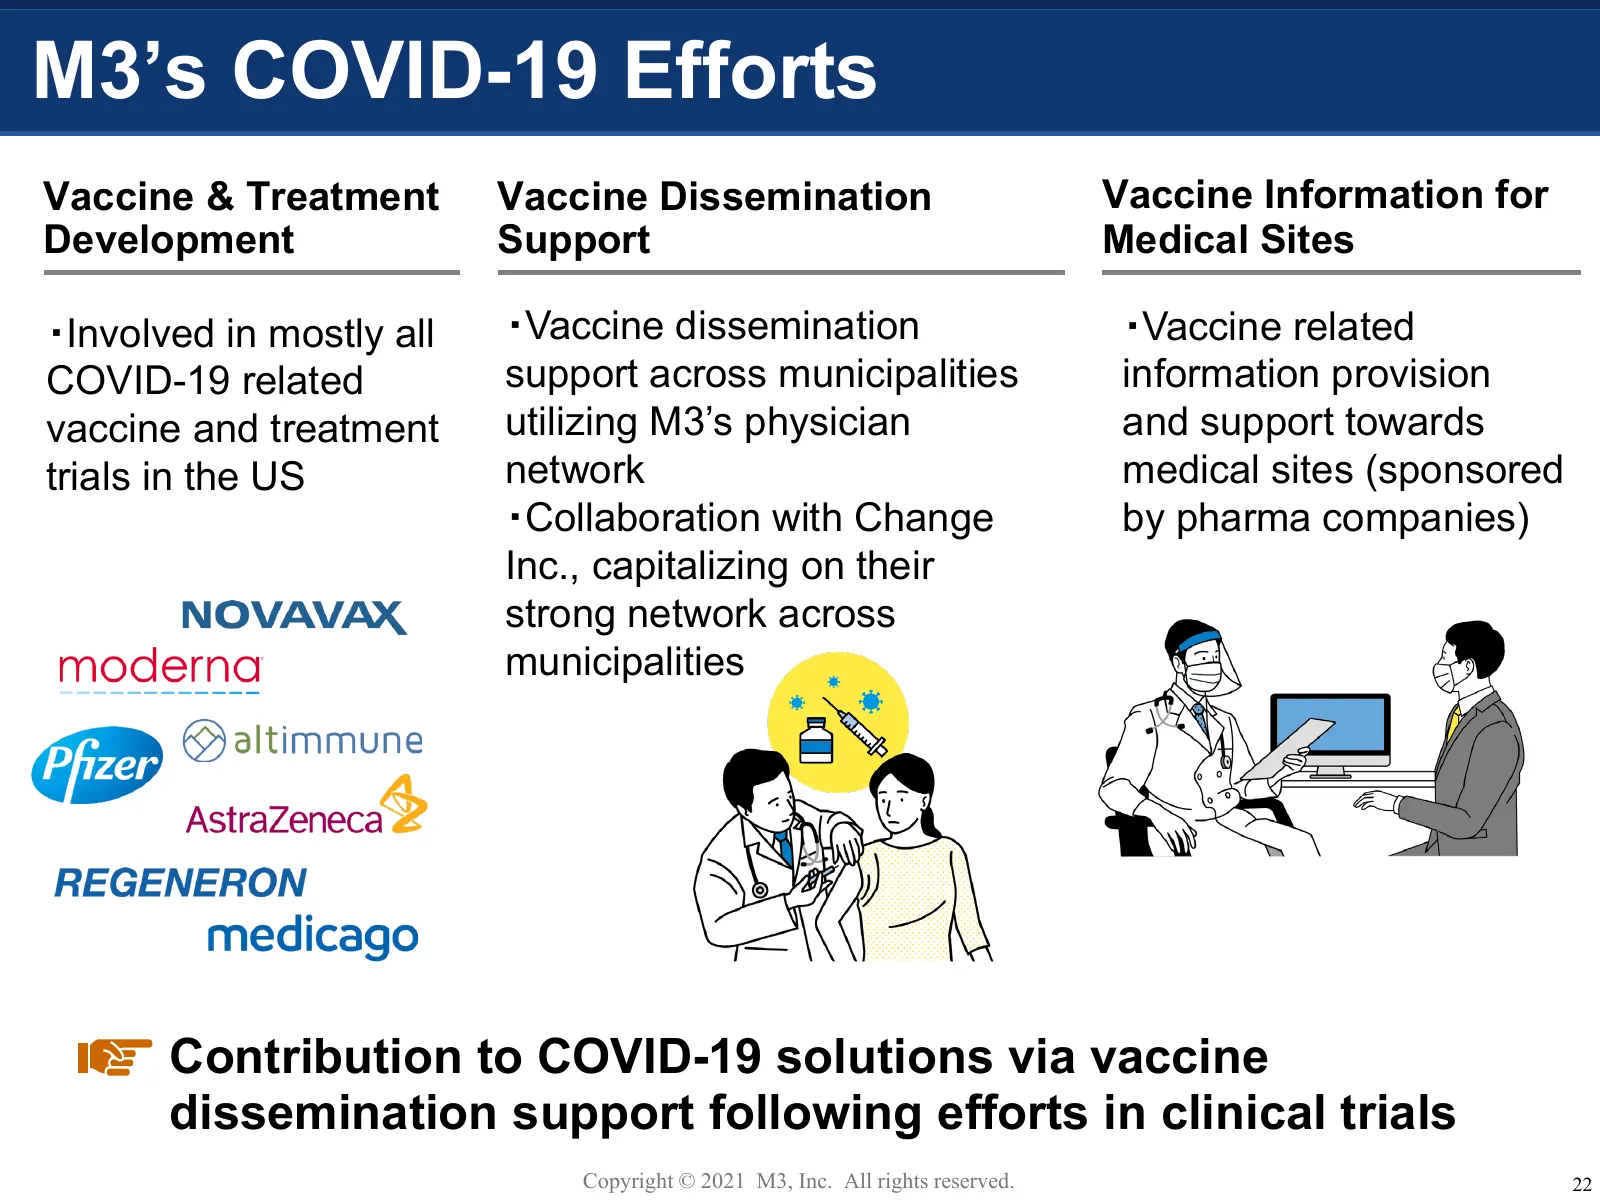
M3’s COVID-19 Efforts Vaccine & Treatment Vaccine Dissemination Vaccine Information for Development Support Medical Sites ・Involved in mostly all ・Vaccine dissemination ・Vaccine related COVID-19 related support across municipalities information provision vaccine and treatment utilizing M3’s physicia
Slide 24: M3 Growth Strategy
M3 Growth Strategy Copyright © 2021 M3, Inc. All rights reserved. 23
Slide 25: Business Scope Expansion and Growth Potential
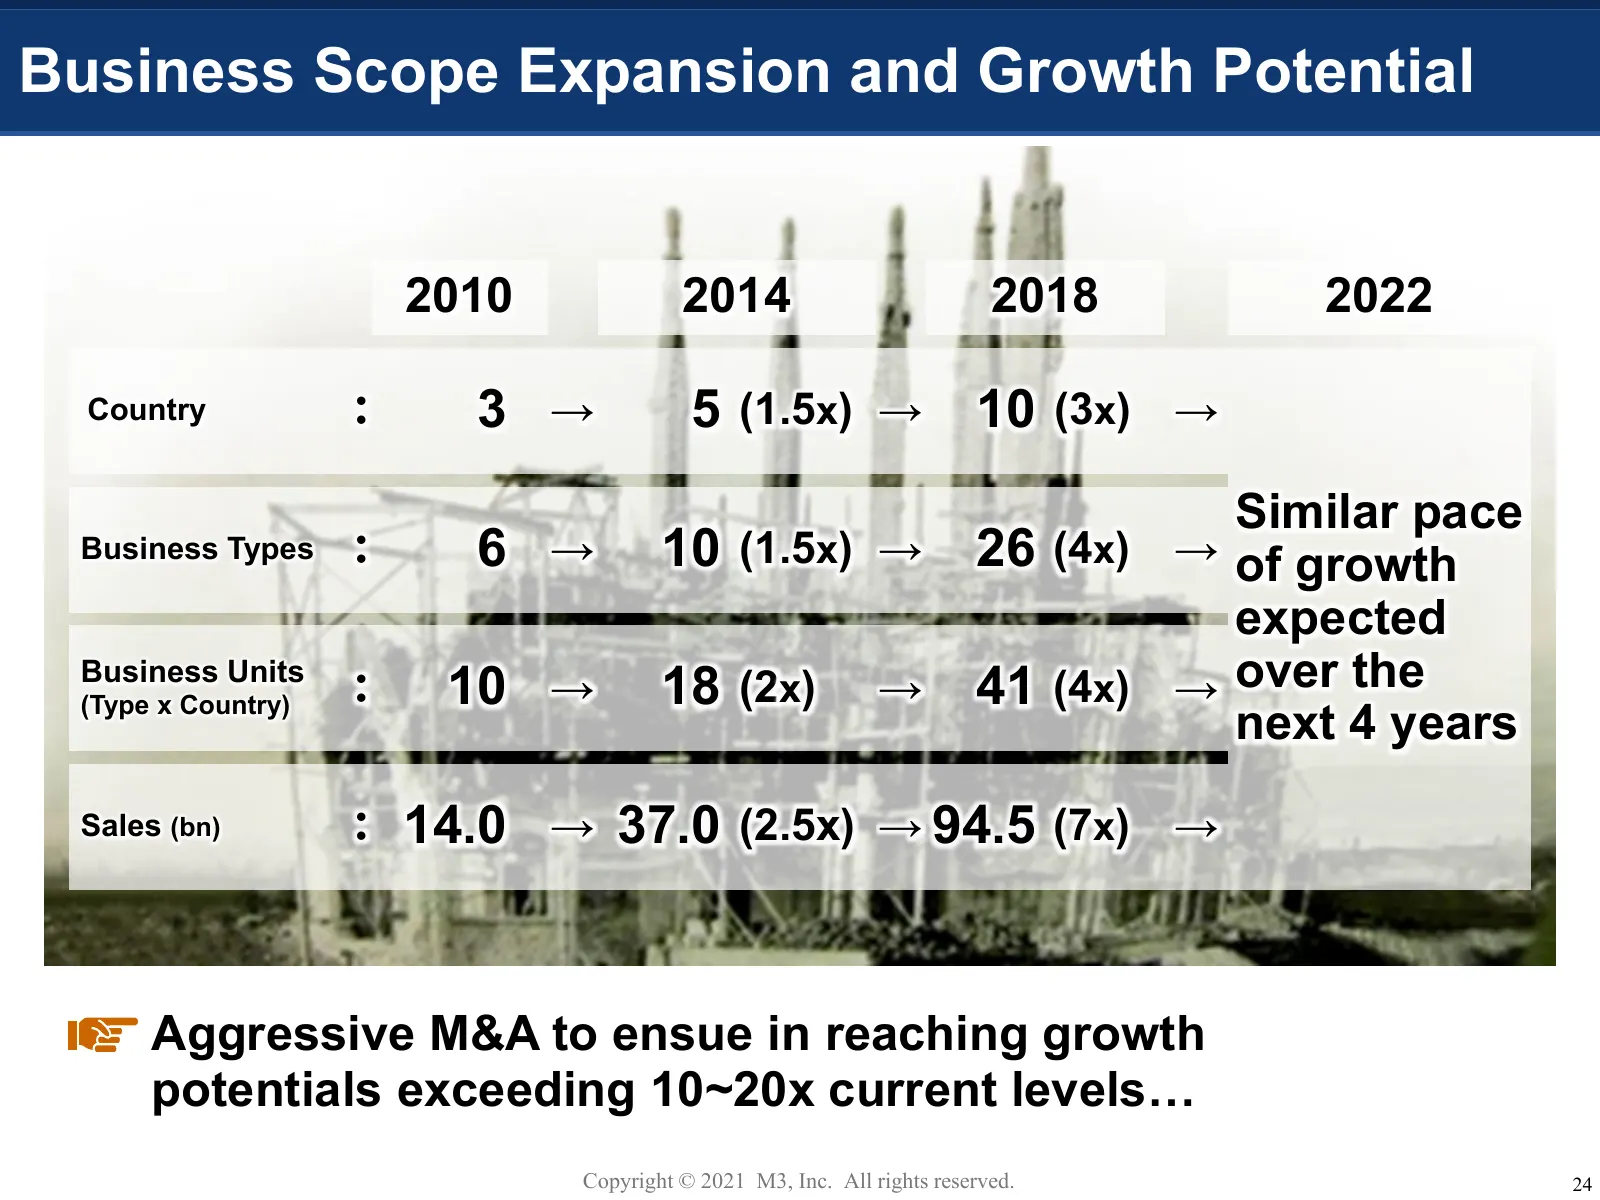
Business Scope Expansion and Growth Potential 2010 2014 2018 2022 Country : 3 → 5 (1.5x) → 10 (3x) → Similar pace Business Types : 6 → 10 (1.5x) → 26 (4x) → of growth expected Business Units (Type x Country) : 10 → 18 (2x) → 41 (4x) → over the next 4 years Sales (bn) : 14.0 → 37.0 (2.5x) → 94.5 (7x)
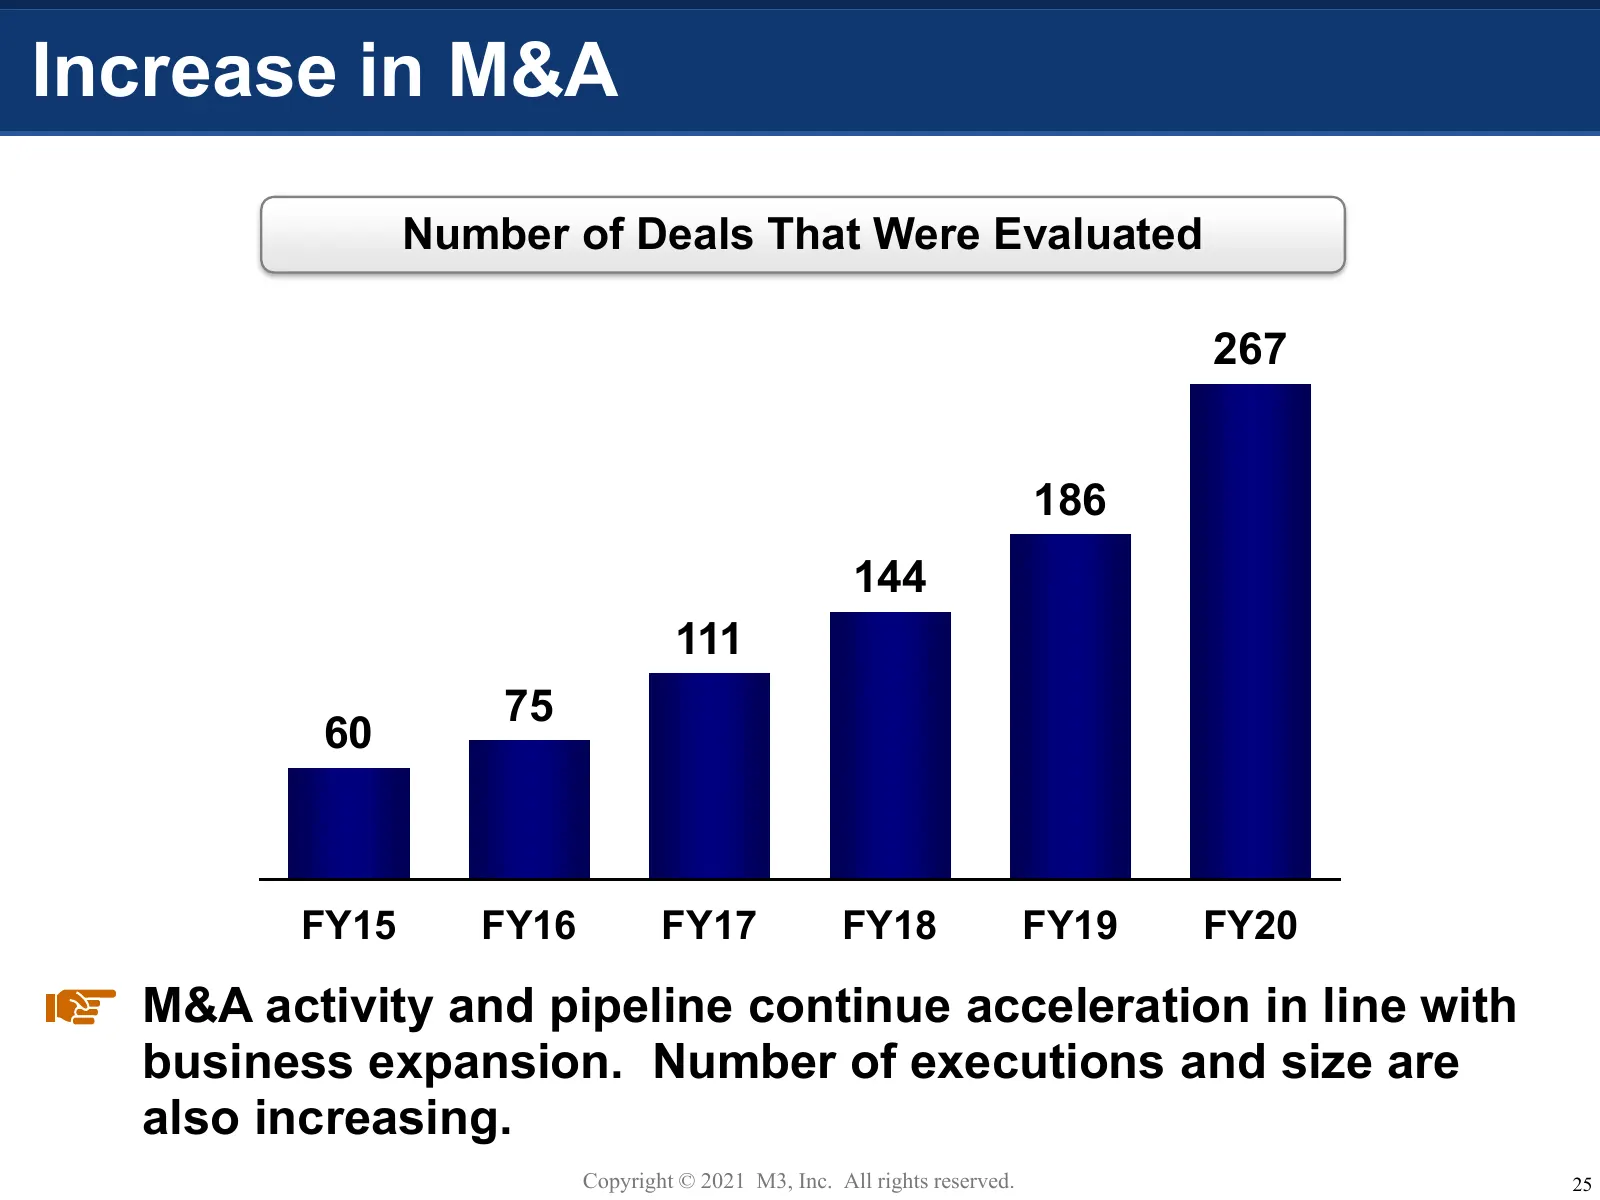
Slide 26: Increase in M&A
Increase in M&A Number of Deals That Were Evaluated 267 186 144 111 75 60 FY15 FY16 FY17 FY18 FY19 FY20 M&A activity and pipeline continue acceleration in line with business expansion. Number of executions and size are also increasing. Copyright © 2021 M3, Inc. All rights reserved. 25
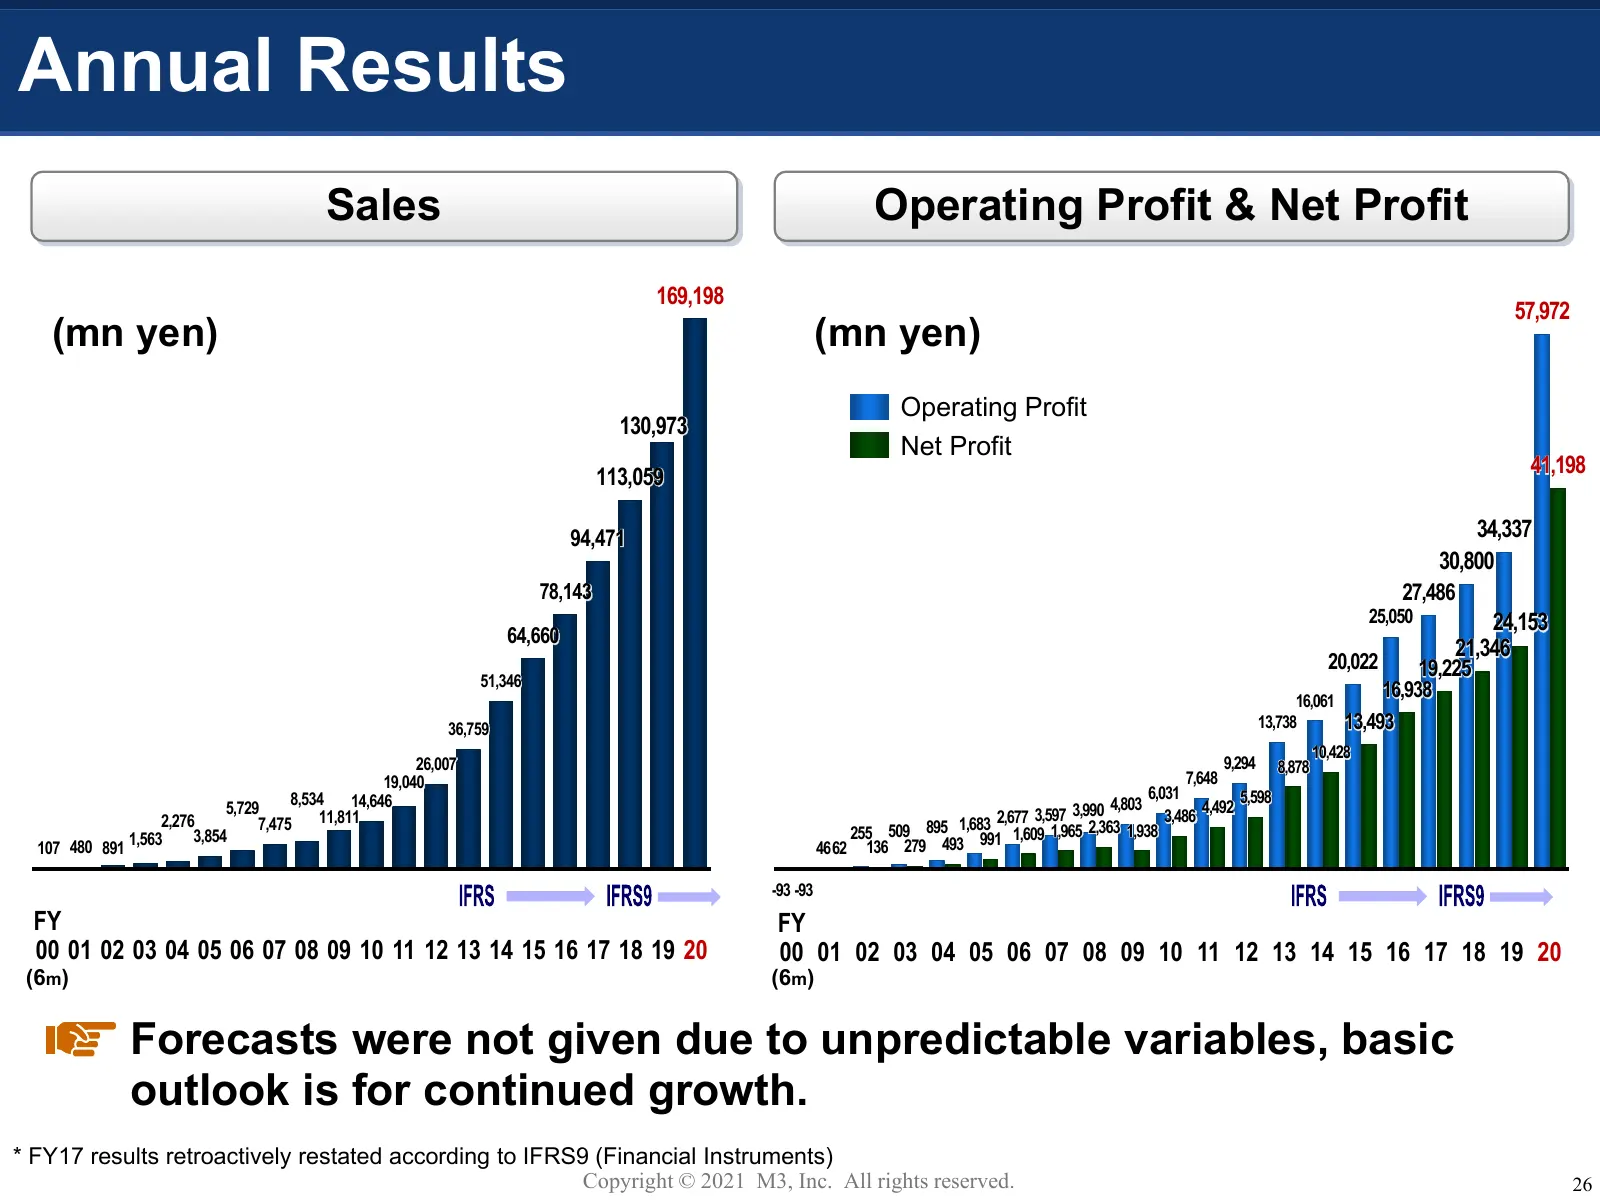
Slide 27: Annual Results
Annual Results Sales Operating Profit & Net Profit 169,198 57,972 (mn yen) (mn yen) Operating Profit 130,973 Net Profit 113,059 41,198 94,471 34,337 30,800 78,143 27,486 25,050 24,153 64,660 21,346 20,022 19,225 51,346 16,061 16,938 36,759 13,738 13,493 10,428 26,007 9,294 8,878 19,040 7,648 8,534 1
Source: Internet Archive copy of corporate.m3.com
More decks from M3, Inc.
 Investor Presentation (November 2026)8 slides · Nov 20, 2026
 H1 FY2026 Earnings Presentation44 slides · Nov 4, 2026
 Q2 FY2026 Earnings Presentation44 slides · Nov 4, 2026
 Q1 FY2026 Earnings Presentation42 slides · Aug 6, 2026
 Merger or Acquisition (June 2026)14 slides · Jun 5, 2026
 FY2025 Earnings Presentation54 slides · May 1, 2026