
31 March 2026
CleanTech Lithium PLC ("CTL", CleanTech Lithium" or the "Company")
Positive Pre-Feasibility Study Completed and Reserves Declared for Laguna Verde
Pre-Tax NPV8 US$1.37bn and IRR of 24.2%
CleanTech Lithium (AIM: CTL, Frankfurt:T2N), an exploration and development company advancing sustainable lithium projects in Chile, reports the results of its independent Pre-Feasibility Study ("PFS") for the Laguna Verde project (the "Project"). The PFS demonstrates positive technical foundations and compelling economic outcomes of the Project at PFS level, marking a significant milestone in the Company's development pathway. Completing the PFS, which includes the first declared JORC (2012) compliant reserves, enables CTL to accelerate engagement with potential strategic partners.
The Company is now in a position to share the results of the PFS with selected parties after it was announced that CTL and the Chilean Government agreed the contractual terms of the long-term Special Lithium Operating Contract ("CEOL") for Laguna Verde, which is subject to final ratification by the Comptroller General's Office, as announced on 10 March 2026.
Laguna Verde PFS Highlights:
· The PFS demonstrates production of 15,000 tonnes per annum ("tpa") of battery grade lithium carbonate for an operating life of 25 years with positive economic performance based on the assumptions applied in the PFS.
|
Key Economic Metrics: |
|
|
Pre-Tax NPV8 |
US$1.37bn |
|
Pre-Tax IRR |
24.2% |
|
Post-Tax NPV8 |
US$959 million |
|
Post-Tax IRR |
21.2% |
|
Capex (including contingency of 20.6%) |
US$748 million |
|
Opex |
US$5,768 per tonne |
|
Payback Period |
4 Years |
· The economic results are based on preliminary engineering and economic assessments and are subject to risks and uncertainties, including lithium price variability, process performance, permitting outcomes and project execution.
· The PFS, led by leading engineering firm Worley as study integrator and supported by additional independent specialists, bases the Project´s process design on a Direct Lithium Extraction ("DLE") technology with prior commercial deployment experience and a standard downstream process to final lithium carbonate product.
· The study demonstrates the Project's advantages with a high level of optionality for plant design and power supply, very high-water recovery, which is a critical path item for mining projects in Chile, and strong community engagement and environmental progress.
Ignacio Mehech, Chief Executive Officer, CleanTech Lithium said: "The completion of the PFS is a major achievement for CleanTech Lithium and the work demonstrates the Laguna Verde Project has very strong technical merits and highly favourable economics. The estimated Capex intensity of approximately US$49,900 per tonne of battery grade lithium carbonate compares favourably with DLE projects in development globally, and the estimated Opex places the project in the lowest cost quartile for the industry, leveraging Chile´s advantages in infrastructure, logistics and a large highly skilled workforce. The depth of work completed to date places the Company in a highly favourable position as we have the unique opportunity to become the next lithium producer to come online in Chile after more than 30 years.
The Board believes that Laguna Verde is a highly attractive opportunity for strategic partners seeking long-term lithium supply at a time when global demand is growing rapidly and not enough projects are being developed to meet forecast demand. Completion of the PFS allows us to kickstart the process of selecting a strategic partner to fund and develop the Project, with our already engaged consultant Cutfield Freeman & Co.
As promised, we end Q1 2026 very strongly after having agreed the long term CEOL, released a PFS with very attractive economics and begun a strategic partner selection process that we believe will be very competitive, given the historical interest our project has drawn from such parties. What lies ahead is an exciting period, as we will look to begin preparing the Environmental Impact Assessment ("EIA"), seeking to dual-list on the ASX and begin preparing for the Definitive Feasibility Study ("DFS"), all the while completing the strategic partner selection process by year end.
I am really enthusiastic for CleanTech Lithium, our shareholders and me personally, as we have delivered on our promises and can now finally begin the next stage of development of Laguna Verde. I look forward to updating our shareholders in the coming days on the merits of our PFS and our plans to unlock the real potential of our flagship project."
Pre-Feasibility Study
The PFS was led by the study integrator, who coordinated the work of third-party consultants and information provided by the Company.
Major third-party contributors to the study include:
· Montgomery & Associates - Geology, hydrogeology, resources, reserve modelling and wellfield design
· Xi-an Lanshen New Material Technology Company ("Lanshen") - Process design and engineering, process capital and operating cost estimates
· Ad Infinitum - Process design review, flowsheet development and processing technical oversight (Competent Person - Processing)
· Benchmark Minerals Intelligence - Lithium product marketing studies
· Worley - Project infrastructure engineering and infrastructure capital and operating cost estimates, construction planning and financial modelling
Process design inputs were developed by Lanshen and reviewed and integrated by Ad Infinitum, whose principal acted as the Competent Person responsible for processing. Worley´s role was focused on infrastructure, engineering, and cost estimation whereas Lanshen was primary responsible for process design.
The PFS incorporates inputs from third-party specialists, including process design, hydrogeology and market analysis, which have been relied upon for the purposes of the study. The study integrator has not independently verified all third-party inputs and does not accept responsibility for such information.
Project Overview
The Laguna Verde Project is located in the Atacama Region, Chile, at elevations exceeding 4,300 metres above sea level. The Project is situated approximately 265km east of the regional mining centre of Copiapó. A paved highway Route 31 which extends from Copiapó through to Argentina, runs through the project area. The proximity to the international border and established transport corridors supports logistics for equipment supply, reagent importation, and export of finished product.
As part of the PFS process a plant location trade-off study was undertaken as announced to the market on July 02, 2024 (Link). The study resulted in the decision to locate the downstream Lithium Carbonation Plant ("LC Plant") in Copiapó, and the plant for the DLE and eluate concentration stages which produce a concentrated lithium chloride (LiCl) solution, at the Laguna Verde project site, as shown in Figure 1. This configuration greatly reduces the footprint at the project site, from power supply, storage, camp and plant facilities, along with construction phase and environmental impacts. With approximately 70% of the operational workforce employed at the carbonation plant, locating it in Copiapó provides major advantages in accessing a skilled workforce, along with existing infrastructure, power supply and other inputs. This carbonation plant could be expanded to process LiCl from additional future projects in the region.
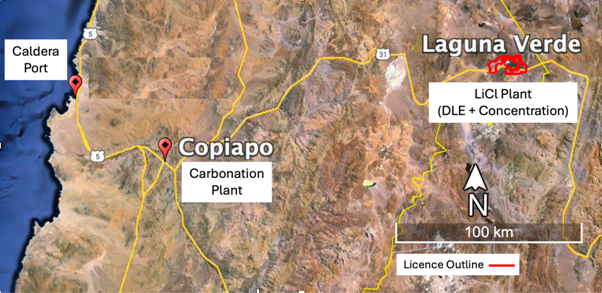
Figure 1: Regional Map and Plant Locations
Project Configuration and Recovery Method
The proposed development for production of 15,000 LCE comprises two project sites:
Laguna Verde Site - LiCl Production:
o Lithium chloride (LiCl) production facility
o Brine extraction and reinjection wellfields
o Raw brine handling and DLE processing
o Concentration and purification to produce a transportable LiCl solution
Copiapó Site (conversion to 15,000tpa battery grade lithium carbonate):
o Lithium carbonate (Li₂CO₃) conversion facility
o Final product drying, micronizing and packaging
The Process Block Diagram further details this configuration by showing an overview of the recovery method as presented in Figure 2 below.
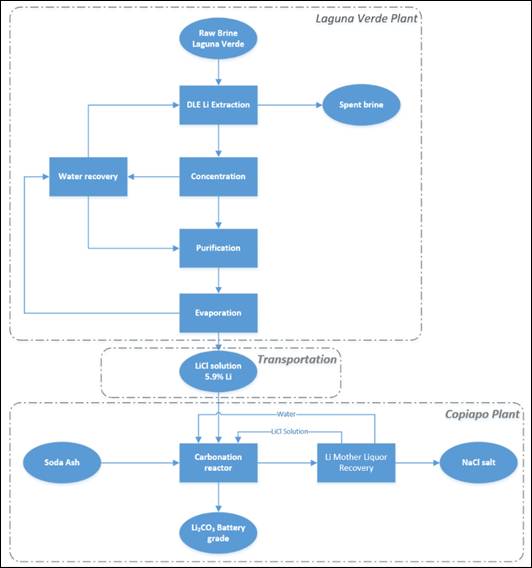
Figure 2: Process Block Diagram
Laguna Verde LiCl Plant
At the Laguna Verde project site brine is extracted from the production wellfield and pre-treated to control suspended solids prior to DLE processing. For the PFS, the Company selected the DLE adsorbent provided by Lanshen after extensive test-work on various adsorbents. Lanshen´s provides an alumina-based adsorbent which is the most commercially established DLE adsorbent, and it has been a leader in commercial deployment in the DLE sector.
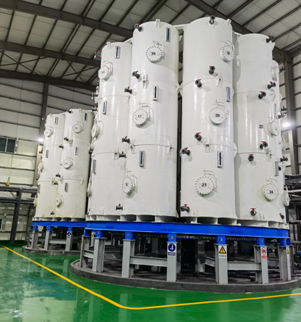
Figure 3: Lanshen Commercial DLE Unit in China
In the DLE process lithium is selectively recovered by passing the feed brine through columns filled with the adsorbent. The columns are arranged in a carousel system, a commercial scale example of which is shown in Figure 3. Lithium is desorbed with demineralised water to produce a dilute LiCl eluate, which is subsequently upgraded through a staged purification and concentration circuit.
At the Laguna Verde site the plant will produce a LiCl solution that is approximately 5.88% lithium, suitable for bulk transport to Copiapó for carbonate conversion. Depleted brine and process effluents are managed through integrated water recovery systems and reinjection into the basin aquifer to minimize net freshwater consumption and aquifer depletion.
The key recovery parameters achieved at the Laguna Verde LiCl plant are:
· DLE lithium recovery: 90.0%
· Membranes recovery (RO-NF-ED) + IX: 98.4%
· LiCl Plant total recovery: 88.6%
Copiapó Lithium Carbonate (LC) Plant
The concentrated LiCl solution is transported to Copiapó and converted to lithium carbonate using soda ash (Na₂CO₃) carbonation at approximately 85°C. The conversion process includes:
· Carbonation reactor,
· Solid-liquid separation,
· Hot washing,
· Drying and micronizing to meet battery-grade specifications,
· Mother-liquor recovery circuit for lithium recovery and recycling.
The recovery achieved in the carbonation stage is 87.2% however the design achieves incremental recovery from the mother-liquor circuit that results in total recovery from the Lithium Carbonation Plant of 96.5%.
Based on the total recovery rates of the LiCl plant of 88.6% and the total recovery of the Lithium Carbonation plant of 96.5%, the global recovery rate for the process is 85.5%. The flowsheet is designed around high internal water recovery. Key features include:
· RO/NF/ED-based water recovery systems,
· Evaporation condensate reuse,
· Reinjection of depleted brine and treated effluents.
From an environmental perspective, the absence of conventional evaporation ponds and reliance on reinjection represent a fundamental design feature intended to reduce long-term disturbance.
Project Infrastructure
The infrastructure framework supporting the Laguna Verde Project comprises the two primary sites and associated logistics corridors. Product export and most reagent imports are expected to be routed via Angamos Port (Mejillones). Various other port options were assessed, and it was considered based on current available capacity to be the superior option. This will require further evaluation.
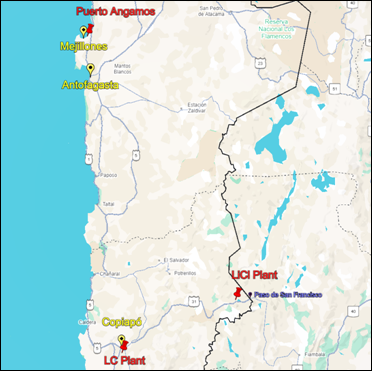
Figure 4: Plants and Port Location
Laguna Verde Site Infrastructure
The LiCl Plant facilities will be situated northwest of the Laguna Verde, as illustrated in Figure 5, with remaining infrastructure spread around the periphery of the laguna, mainly being:
a) Brine extraction wells.
b) Industrial facilities area for reagent/utilities.
c) Concentrated LiCl brine storage tanks for truck transport to the LC Plant. Two (2) tanks are considered, with a storage capacity of 500 m3 each (operational volume), from where the trucks are loaded, to transport the brine to the LC Plant.
d) No solid discards are generated from this plant, and all liquid discards are mixed with the spent brine for reinjection.
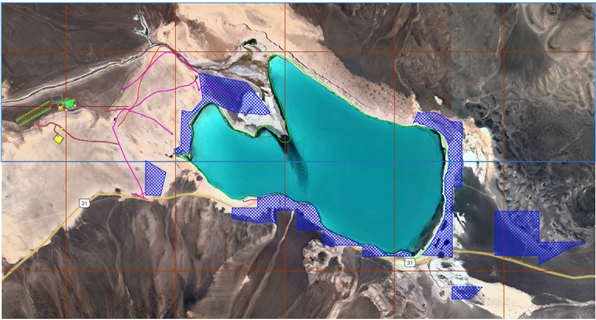
Figure 5: Area of the LiCl Plant infrastructure
For the production of concentrated LiCl eluate with a capacity of 15,000 tpa LCE, the plant´s permanent installations are configured as depicted in Figure 6. The central area marked as DLE plant comprises the DLE modules which total 10 carousels each with 30 columns.
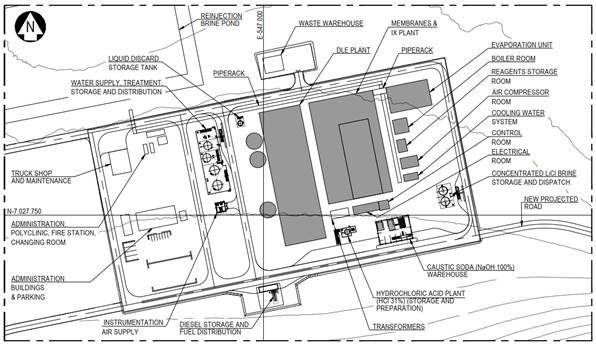
Figure 6: Main installations and facilities for LiCl Plant.
Electrical and Thermal Power
Electricity represents the primary energy input for the project. The electrical consumption for the plants at the Laguna Verde site and at Copiapó is estimated as below, with the former having a much larger requirement:
· Laguna Verde (LiCl plant): 175,200 MWh/year
· Copiapó (Li₂CO₃ plant): 19,200 MWh/year
Electricity and thermal energy consumption have been estimated based on data supplied by Lanshen and supplemented with engineering estimates for auxiliary equipment and plant utilities. The consumption values are used to calculate annual electrical and thermal energy costs for the project. The energy basis includes:
· Electrical demand for motors, pumps, compressors, wellfield pumping, instrumentation, and general services.
· Thermal energy requirements, including LPG consumption for boilers and saturated steam generation.
· Diesel usage for vehicles and mobile equipment at both plant sites.
· Market-based unit pricing, derived from Chilean energy market data and preliminary supplier information for LPG and diesel.
A number of options were evaluated for the supply of electricity to the Laguna Verde site. Based on the technical information provided by CleanTech Lithium, a non-binding reference proposal was prepared by an established power transmission company in Chile. The proposal is based on a Build-Own-Operate-Transfer (BOOT) model.
The operating time of the electrical supply is considered for the years of operational life of the project. The BOOT proposal would deliver the required electrical supply to the Laguna Verde site via a 220 kV transmission lines and a step-up substation. This will be a length of 130 km and follow the route of the national highway 31, as shown in Figure 7, from a connection point near the existing La Coipa substation to the Laguna Verde plant. Alternative routes will be evaluated in future stages of development.
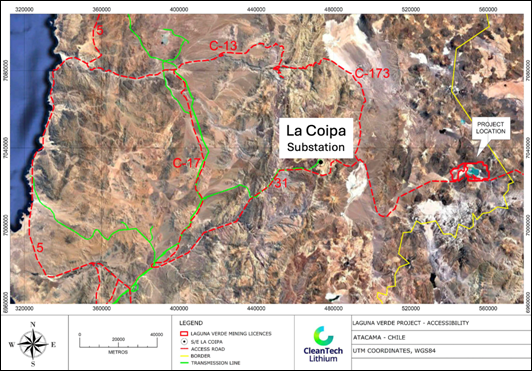
Figure 7: Route of Electrical Transmission Line based on Reference Proposal
The Chilean national electricity grid has one of the highest renewable energy penetration rates globally. As a result, the Company will be well positioned to secure a BOOT agreement for 100% renewable energy. In addition, the Company undertook several studies or proposals to evaluate other options related to the energy requirements of the project, across electrical supply, gas or alternative heating technologies, and transport fuel. A major consideration in undertaking this work was the potential to maximise the sustainability of the energy input required for the project. These evaluations included:
· A study on utilising onsite renewables comprising a solar photovoltaic power plant, wind turbines and a battery energy storage system to provide the full electrical energy requirements at the project site
· Evaluation of solar thermal, or concentrated solar, technologies to provide the heat and steam energy requirements at the Project site.
· A desktop study was completed on the potential for geothermal energy to provide the heat and steam energy requirements at the Project site. Laguna Verde is a recognised site for geothermal energy potential in Chile.
· A proposal was received for utilising electric trucks for the transport of eluate from the project site to the downstream processing plant at Copiapó. This would take advantage of a very large altitude gradient between the two sites, which provides regenerative charging when transporting heavy loads down gradient and a much lighter load on the return.
These studies or proposals provided valuable ideas and insights that will be further evaluated at the next stages of project feasibility studies.
LPG
Liquid petroleum gas (LPG) is to be used in the project as a heat energy source, specifically for the boiler at the LiCl Plant and for the boiler and dryer in the LC Plant. This utility will be obtained locally and transported to the plant by trucks.
Process Water
Water mass balances were completed for each of the plants at the Laguna Verde Site and at Copiapó, and the consumption of water is as follows:
· LiCl Plant: 160,800 m3/y (5.6 L/s)
· LC Plant: no industrial water is required during normal operation due to recirculation of all water within the process. Water is specifically required for start-up.
There are several options available for supply of process water under evaluation. Firstly, surface water courses that contribute to the Laguna Verde. The Peñas Blanca River flows from west to east and has a continuous flow throughout the year, while to the east of the Laguna Verde, there are intermittent surface water flows. Freshwater exploration wells also exist in the western portion of the basin with demonstrated pumping rates that exceed 40 L/s (Hydro Exploraciones, 2020). Furthermore, a conceptual water balance of the basin recharge has been prepared and indicates that the average estimated freshwater recharge in the Laguna Verde Basin corresponds to 570 L/s (M&A, 2024a). Potential sources of freshwater for the Project include the application for groundwater rights in the basin or the purchase of existing water rights from third parties. Under normal conditions, the constitution of water rights may require approximately one year from the date of filing.
The extracted process water at the project area will require treatment with a low-pressure reverse osmosis unit to produce the required quality of demineralized water for eluate washing and other process water requirements.
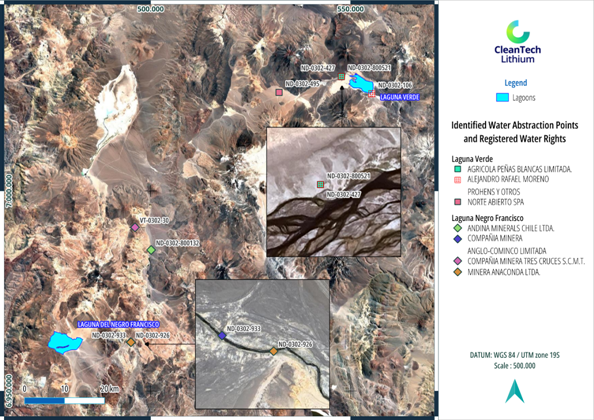
Figure 8: Identified Water Abstraction Points and Registered Water Rights
Laguna Verde and Laguna del Negro Francisco Areas
Mining Method
The mine plan is based on a 25-year Life-of-Mine (LOM) with an initial ramp-up followed by steady-state production of 15,000 tpa LCE:
• Months 1 - 2: 70% capacity
• Month 3: 85% capacity
• Months 4 - 5: 90% capacity
• Month 6 onward: Full capacity (15,000 tpa LCE)
The modelled average extracted lithium concentration over the LOM is approximately 186 mg/L, with limited dilution over time. Modelled average brine feed rates are:
• ~498 L/s during Year 1
• ~540 L/s from Year 2 onward
Wellfield Design
Full-scale production requires 36 vertical production wells, each designed to:
• Reach a total depth of approximately 400 m
• Be screened from 200-400 m below surface
• Target permeable unconsolidated and coarse tuff units
• Be spaced on average approximately 400 m apart
Placing the top of the screen at a 200 m depth is intended to minimize dilution from shallow freshwater or reinjected brine. Wells are projected to be constructed with 10-inch stainless steel casing and equipped with 8-inch submersible pumps. Brine will be conveyed through HDPE pipelines to a raw brine receiving pond and then to the DLE facility.
Production well locations were selected to remain within Measured and Indicated Resource zones, fall within the CEOL polygon (outside of the exclusion zone) and within CleanTech's preferential licenses, and be located in areas supported by aquifer testing (notably wells LV05 and LV06 which were pump tested).
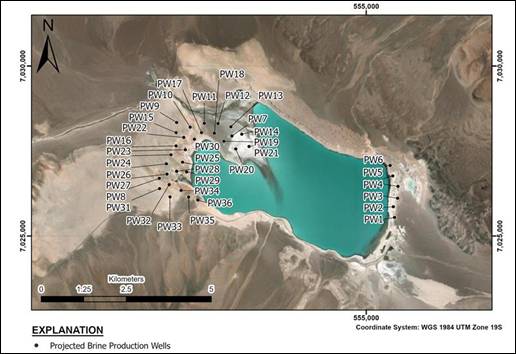
Figure 9: Well Field Layout
Mineral Resource Assessment and Reserves
The total Measured plus Indicated plus Inferred Resource estimate for the Laguna Verde Project is estimated at 1.90 million tonnes LCE, with an average lithium grade of 174 mg/L. Of this, Measured plus Indicated is 835,000 tonnes LCE at an average lithium grade of 178 mg/L. This resource estimate was completed on October 30 2025 and a detailed announcement was released on November 10, 2025 (Link). For further details on the estimate please refer to this announcement.
The Ore Reserve estimate is derived from the Measured and Indicated Mineral resources and is based on:
- A calibrated 3D groundwater model (MODFLOW -USG),
- Variable density flow and transport,
- 25-year production simulation.
- A 36 well production wellfield
- Screens set at 200-400 m depth to limit dilution
Ore Reserves are reported at the point of reference of processed brine (rather than from the production wellheads); the lithium mass extracted from the wells was multiplied by a process efficiency factor of 90% based on conducted pilot testing.
All Ore Reserves are classified as Probable.
The Probable Reserve Estimate for the Project corresponds to 378,000 tonnes of LCE at an average grade of 186 mg/L, sufficient to support the ramp-up and subsequent annual output of 15,000 tonnes LCE over the 25-year operating life. A lithium cut-off grade of 100 mg/L was applied to the reserve estimate based on the chosen direct lithium extraction processing method, as well as conservative metrics for long term lithium prices, and capital expenditure and operating expenses.
|
Category |
Gross |
Net attributable |
Operator |
||||
|
LCE (million tonnes) |
Lithium grade (mg/L) |
Contained lithium metal (tonnes) |
LCE (million tonnes) |
Lithium grade (mg/L) |
Contained lithium metal (tonnes) |
||
|
Ore/Mineral reserves per asset |
CleanTech Lithium |
||||||
|
Proved |
- |
- |
- |
- |
- |
- |
|
|
Probable |
0.38 |
186 |
71,000 |
0.38 |
186 |
71,000 |
|
|
Total |
0.38 |
186 |
71,000 |
0.38 |
186 |
71,000 |
|
|
Mineral resources per asset |
|||||||
|
Measured |
0.39 |
181 |
74,000 |
0.39 |
181 |
74,000 |
|
|
Indicated |
0.45 |
175 |
84,000 |
0.45 |
175 |
84,000 |
|
|
Inferred |
1.07 |
167 |
200,000 |
1.07 |
167 |
200,000 |
|
|
Total |
1.90 |
174 |
358,000 |
1.90 |
174 |
358,000 |
|
|
Notes: |
|||||||
|
1. LCE = lithium carbonate equivalent. |
|||||||
|
2. The conversion factor used to calculate LCE from lithium is based on molar weight. The equation is as follows: lithium x 5.323 = lithium carbonate equivalent (Li2CO3). |
|||||||
|
3. Average grades were calculated from the division between lithium mass (tonnes) and brine volume. |
|||||||
|
4. Lithium tonnages are rounded to the nearest thousand and grades are rounded to the nearest whole number; minor discrepancies may exist when comparing values due to the use of averaging methods and rounding. |
|||||||
|
5. A lithium cut-off grade of 100 mg/L was applied based on the chosen DLE processing method, as well as anticipated capital expenditure and operating expenses. |
|||||||
|
6. Mineral Resources that are not Mineral Reserves do not have demonstrated economic viability. Furthermore, not all Mineral Resources can be converted into Mineral Reserves after application of the modifying factors, which include but are not limited to mining, processing, economic, and environmental factors. 7. Mineral Resources are reported inclusive of Mineral Reserves. |
|||||||
|
8. Mineral Reserves are reported at a point of reference of processed brine using a recovery factor of 90% based on pilot testing results. |
|||||||
Table 1: Summary of Resources and Reserves by Category (Resource effective date of 30 October 2025, and Reserve effective date of 09 March 2026)
Permitting and Environmental Considerations
A CEOL is required in Chile to exploit lithium. A decree was issued by the Ministry Mining on 10 March 2026 granting a CEOL to the Company for the Laguna Verde project for 40 years. This decree is, as required for all decrees, undergoing review by the Comptroller General's Office to ensure it complies with the Constitution and laws of Chile following which the CEOL will be signed by the President of Chile and the Company.
The environmental and social assessment is aligned with Chilean regulatory requirements and reflects the Project's development stage at the PFS level. The Project incorporates DLE with reinjection of spent brine, significantly reducing evaporative losses compared to traditional solar evaporation operations with faster production rates and a higher rate of recoveries of lithium with a smaller environmental footprint.
Environmental baseline studies have been initiated and form the foundation for permitting. Key environmental considerations include:
· Hydrogeological management,
· Reinjection strategy,
· Water sourcing,
· Energy supply,
· Waste management, and
· Community engagement.
The Project remains subject to Chilean environmental permitting processes and CEOL regulatory requirements. Permitting remains a critical path item.
The Project will require submission to Chile's Environmental Impact Assessment System ("SEIA") and approval of a Resolution of Environmental Qualification ("RCA") prior to construction. The Project is not located within Sistema Nacional de Áreas Silvestres Protegidas del Estado ("SNASPE") protected areas but lies within a Zone of Tourist Interest ("ZOIT"). Exploration activities have been designed to minimize impacts.
Community Engagement and Social Strategy
There are no communities within the area of influence of the project, however six communities are present along transportation routes CH31 and CH601. The Pastos Grandes, Runa Urka and Sinchi Wayra communities are located on the CH31 route, while the Pai Ote, Copiapó and Sol Naciente communities are present on the CH601 route.
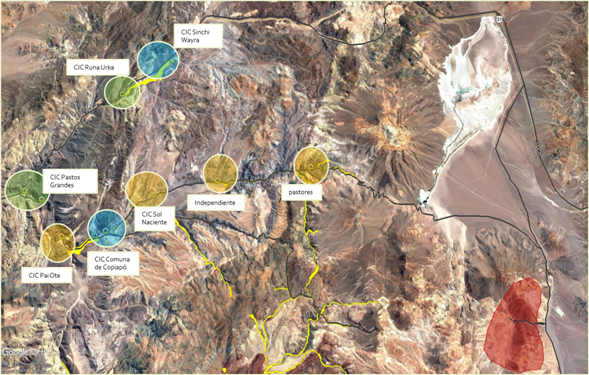
Figure 10: Location of Indigenous Communities
CleanTech Lithium frames lithium development in a manner that is environmentally and socially sound. The Company is committed to a sustainability strategy that positions it as a leader in sustainable lithium development through early participation of indigenous communities and a broad range of stakeholders.
A formal partnership agreement with the nearby indigenous communities, signed in December 2024, supports baseline work and EIA participation through a joint working group. Through this agreement, communities will provide vital local knowledge for baseline studies and contribute directly to the overall EIA process.
The Company's engagement strategy is built on the following principles:
· Early and participatory consultation
· Transparent information channels and ongoing dialogue mechanisms
· Focus on impact management, local employment and investment
· Commitment to free, prior and informed consultation processes
This approach is evidenced by multiple engagement activities, including organised visits to the DLE pilot plant, drilling campaigns and numerous consultation meetings. The Company's commitment to regional development is further demonstrated by the opening of a community outreach office in Copiapó and an employment and local skills strategy developed in partnership with the Universidad de Atacama. The recent public endorsement by local communities including from Indigenous Community President Ercilia Araya confirms that this is not merely a statement of intent, but a clear path of engagement grounded in cultural and environmental stewardship.
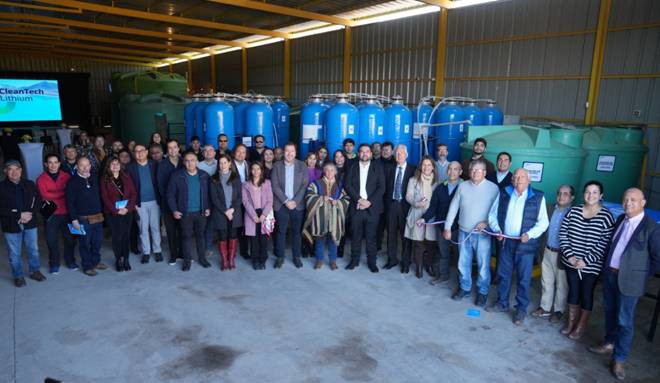
Figure 11: DLE Pilot Plant Inauguration Event with Indigenous Communities and Local Government Representatives, May 2024
The social strategy aims to support long-term community acceptance and shared value development. Early conversations on topics such as protocols, participation, investments, local employment and follow-up of initiatives have enabled the Company to identify areas to foster autonomy and acceptance of the Project.
Project Financials and Economics
Capital Costs
The capital cost estimate has been prepared with an effective date of 1 March 2026. The capital estimate corresponds to an AACE Class 4 level of definition, consistent with a PFS. The expected accuracy range is approximately -30% to +45%, reflecting the current level of engineering maturity. Pricing is based on Q4 2025 US dollar values in constant terms, with no escalation applied.
Mechanical works represent the largest discipline component within direct costs, followed by concrete and structural works. This distribution reflects the process-intensive nature of both the DLE-based LiCl plant and the lithium carbonate conversion facility. From an area perspective, the Laguna Verde salar site represents the largest share of direct capital expenditure, driven by:
· The LiCl process plant;
· Production and reinjection wells;
· Infrastructure and energy systems;
· High-altitude construction requirements.
The Copiapó site capital is primarily driven by the lithium carbonate plant and associated reception, storage and services infrastructure.
The base case assumes that the high-voltage transmission line will be delivered under a third-party BOOT arrangement. Accordingly, the capital estimate includes only on-site electrical infrastructure and connection facilities.
Capital Cost Summary:
The PFS includes a detailed analysis of the direct and indirect costs based on a CAPEX Report prepared by the study integrator. Key third-party and client-supplied inputs incorporated into the estimate include:
· The Laguna Verde LiCl plant and the Copiapó Li₂CO₃ plant, designed and budget-priced by Lanshen;
· Main buildings at both sites, costed by ISM Ingeniería (including prefabricated structures and civil works);
· 36 production wells and associated booster pumps, costed by CTL based on a budgeted quotation provided by Geotec Boyles SA, a company based in Santiago, Chile;
· Brine pumping and transport infrastructure (civil, electrical systems, transmission lines and pipelines), engineered by Agora Soluciones.
The capital estimate reports a Total Installed Cost (TIC) of approximately US$748.2 million, including owner's costs and contingency. Capital costs are shown by project area and Work Breakdown Structure (WBS) is provided in Table 2, distinguishing between the Salar site and the Copiapó site:
|
Description |
Cost USD |
Cost USD |
% TIC |
|
SALAR |
|||
|
General Salar |
39,579,065 |
5.3 |
|
|
Wells |
40,837,235 |
5.5 |
|
|
Lithium Chloride Plant |
160,020,694 |
21.4 |
|
|
Salar Reagents Products |
4,571,284 |
0.6 |
|
|
General Services Salar |
7,806,865 |
1.0 |
|
|
Infrastructure Salar |
59,600,226 |
8.0 |
|
|
Energy Salar |
33,112,829 |
4.4 |
|
|
Total Salar |
345,528,198 |
46.2 |
|
|
COPIAPÓ |
|||
|
General Copiapó |
10,745,834 |
1.4 |
|
|
LiCI Reception and Storage |
8,899,206 |
1.2 |
|
|
Lithium Carbonate Plant |
88,841,204 |
11.9 |
|
|
Copiapó Reagents Products |
4,744,646 |
0.6 |
|
|
General Services Copiapó |
7,309,295 |
1.0 |
|
|
Infrastructure Copiapó |
6,342,715 |
0.8 |
|
|
Energy Copiapó |
2,100,645 |
0.3 |
|
|
Total Copiapó |
128,983,545 |
17.2 |
|
|
Total Direct Cost |
474,511,741 |
63.4 |
|
|
Indirect Cost |
129,604,435 |
17.3 |
|
|
Owner Cost |
18,980,470 |
2.5 |
|
|
Contingency - 20% of other costs |
125,109,805 |
16.7 |
|
|
Escalation |
- |
- |
|
|
Total Installed Costs |
748,206,451 |
100.0 |
|
|
CAPEX OUTFLOWS |
USD |
% |
|
|
Construction Year 1 - 2029 |
261,872,258 |
35.0 |
|
|
Construction Year 2 - 2030 |
486,334,194 |
65.0 |
|
|
Total Outflows |
748,206,452 |
100.0 |
Table 2: Project Cost Estimate Summary by Area
Direct costs total approximately US$474.5 million, representing approximately 63% of TIC. Indirect costs total approximately US$129.6 million, reflecting execution strategy, high-altitude logistics and temporary facilities requirements. Owner's costs total approximately US$19.0 million (approximately 3% of TIC), and contingency totals approximately US$125.1 million, representing approximately 17% of TIC and approximately 20% of the base estimate.
Indirect Costs, Owner's Costs and Contingency:
· Indirect costs: (approximately US$129.6 million) include engineering, procurement and construction management (EP/CM), temporary facilities, a 600-bed construction camp, freight and duties, spares and first-fill items (including adsorbents, resins and membranes), third-party engineering services, vendor representatives and commissioning support.
· Owner's costs: (approximately US$19.0 million) are estimated at approximately 4% of direct costs and include project management support functions and allowances for permitting, EIA preparation and community engagement.
· Contingency: (approximately US$125.1 million) has been included to address uncertainties inherent at PFS level, including design maturity, quantity variability, productivity assumptions, logistics and high-altitude construction risk. Contingency excludes scope changes and force majeure costs.
The following Figure 12 shows the capex profile of the project, including first fill and sustaining capex:
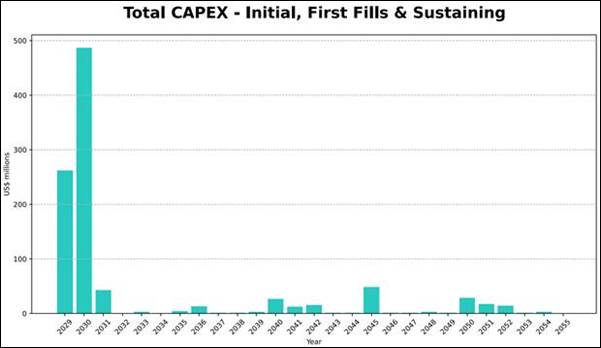
Figure 12: Capital Expenditures and Timing
Capex Cost Intensity:
The capex costs of US$748m equates to a capex intensity of approximately US$49,900 per tonne of battery grade lithium carbonate which compares favourably with other DLE projects in development globally. The Company will look to further optimise the project capex during the DFS stage and is considering various technical options which could improve efficiencies in the overall DLE process.
Key Qualifications and Exclusions:
Exclusions from the estimate include escalation, financing costs, foreign exchange impacts, closure and rehabilitation costs, ramp-up operating losses, sustaining capital and environmental or community expenditures beyond the defined owner's allowance.
Sustaining Capex:
Sustaining capex is required after the initial project investment to maintain ongoing operations. Sustaining capital for the Project primarily comprises the first fill of consumable process materials supplied by Lanshen, including adsorbents, resins, and membranes. The sustaining capital costs for adsorbents and resins, which are required to commission and operate the facilities, total US$42.83 million.
Ongoing sustaining capex is required throughout the remaining 24-year life of the project, amounting to an average of approximately US$9 million per annum, although costs vary year on year, depending on facility requirements.
Operating Costs
The operating cost estimate has been prepared at PFS level, primarily based on an OPEX Report prepared as part of the study. The estimate integrates process definitions, mass balances, and reagent and consumable consumption data provided by CTL and Lanshen, combined with Worley's cost databases and prevailing Chilean and international pricing for labour, energy, reagents, consumables and logistics.
The operating model assumes steady-state production of 15,000 tpa of battery-grade Li₂CO₃, with continuous operation across both the Laguna Verde salar facilities and the Copiapó lithium carbonate plant. The basis assumes approximately 8,000 operating hours per year.
The estimate excludes escalation, financing costs, corporate overhead beyond the Project General Manager level, technology licensing fees, and government royalties (which are incorporated separately in the economic model).
Operating Cost Structure:
Operating costs are classified into direct and indirect components, consistent with Worley's PFS methodology. The total operating cost combines Laguna Verde and Copiapó direct costs plus local G&A.
· Total production cost: US$ 5,768/t Li₂CO₃ (approximately US$ 86.516 million per year)
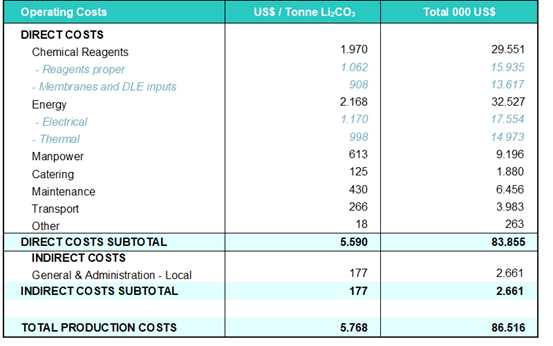
Table 3: Project Total OPEX - 15,000 tpa Li2CO3
Indirect operating costs include General and administrative (G&A) expenses, Insurance, communications and security, personnel transport between urban centres and operating sites.
Economic Analysis
The economic evaluation for the Laguna Verde Project PFS was completed in accordance with JORC and written to be consistent with the disclosure requirements of NI 43-101, with an effective date of March 1, 2026. The evaluation was based on a discounted cash flow (DCF) model prepared for the study that integrated the CAPEX and OPEX estimates, a production schedule constrained by hydrogeology and process design (Montgomery & Associates and Lanshen inputs), and long-term lithium carbonate pricing assumptions from Canaccord Genuity (Nov 2025). The model produces annual cash flows and calculates NPV, IRR, and payback on both a before-tax and after-tax basis.
Evaluation Criteria:
The analysis evaluates an approximately two-year construction period followed by 25 years of operations. Results are stated in real (constant dollar) 2026 US dollars with no inflation escalation applied to costs or revenues. Cash flows are discounted at an 8% real discount rate, and NPVs are calculated as of the start of construction in 2029 (cash flows discounted to this 2029 date).
Cashflow & Economic Analysis:
The economic analysis carried out in the study included the following basic assumptions:
|
CAPEX |
Schedule |
2029 - US$261.9 million 2030 - US$486.3 million Total - US$748.2 million |
|
Production |
Schedule Grade |
Annual production of 15,000 tonnes per annum commencing in 2031 Production ramp-up projected at 50% in Year 1 with full capacity being achieved in Year 2. 50% of initial production will be battery grade, reaching 95% in Year 2 and 100% by Year 4 |
|
Lithium Carbonate Sales Prices |
Annual Prices |
2031 - US$22,500 per tonne Long-term - US$22,500 per tonne Source: Canaccord Genuity Forecast (Nov. 2025) |
|
Opex |
Cost per tonne |
US$5,768 |
|
Financing |
Project Funding |
Analysis assumes entire project funded by the Company from its own capital. No debt or financing costs included. |
|
Taxes & Royalties |
Corporate Tax Royalties (CEOL) Withholding Tax |
First Category Tax as currently defined in the Chilean tax regime for mining industries - 27% on net profits (after royalties) Specific payments to the Chile State and other parties - Based on the CEOL terms agreed in March 2026: § Annual Operating Margin Payment: a progressive table which increases from 0% where the operating margin is below 20% maximum rate of 15.5% when the operating margin exceeds 99%. § Contributions to local indigenous communities: Payments are made to designated indigenous communities in accordance with the provisions of the Laguna Verde CEOL and related private agreements. Contributions are calculated at 0.4% of gross annual lithium sales revenue. § Contributions to Local Government: Payments are made for regional and municipal development in accordance with the CEOL provisions. These payments are allocated to the Regional Government and local municipalities. Calculated at 0.4% of gross annual lithium sales revenue. § Ad Valorem Royalty: Applies to lithium product sales and is calculated on a progressive, marginal basis according to the realized sales price per metric tonne of lithium product. The royalty is applied marginally across each price band, including the following examples: o US$0-US$10k per tonne sales price - 1% marginal rate o Over US$10k-US$15k per tonne - 2.5% o Over US$20k-US$25k - 7.5% o Over US$30k-$35k - 30% o Over US$40k - 50% o Under this scenario, the effective weighted average royalty rate is approximately 2.9% of gross sales revenue for the period § Contributions to Sustainable Productive Development: Contributions to the State and designated institutions to support sustainable productive development under the CEOL. The contribution is calculated as 15% of the ad valorem royalty component. The amount, when calculated, is deductible from the Ad Valorem royalty payment for that period With foreign companies or investors, the additional tax that companies must pay when distributing their profits and dividends overseas is 35%, in which case, the First Category Tax operates as a credit. In the PFS, the tax rate of 27% is used as the applicable rate on a project economics basis. PFS also assumes CleanTech Lithium will establish tax arrangements in Chile and elsewhere to manage the additional 8% net withholding tax which may be payable in the event that dividends are distributed outside Chile. |
Table 4: Key Assumptions in Economic Analysis of Laguna Verde project
Revenues:
Based on annual production of 15,000 tpa LCE:
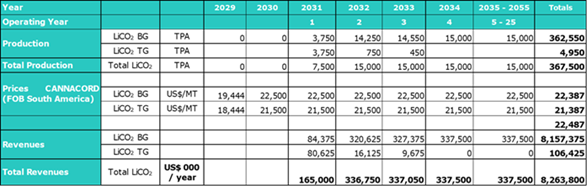
Table 5: Production Revenues
Cash Flow Projection:
The cash flow forecast integrates capital expenditures, operating costs, revenues, taxes, royalties, CEOL-related payments, depreciation, amortization, and working capital movements to generate annual before-tax and after-tax cash flows.
The resulting Project cash flow projection forms the basis for the calculation of economic indicators, including NPV, IRR, and payback period:
Annual cashflows are strong throughout the life of the project as shown in Figure 13 below:
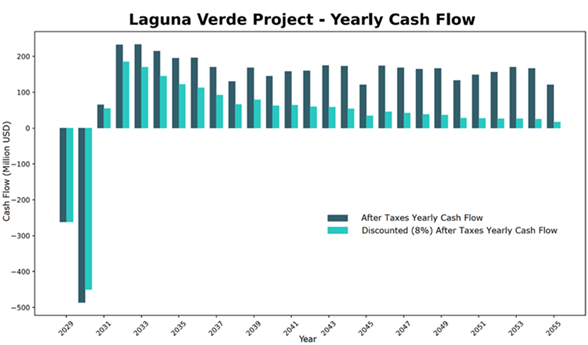
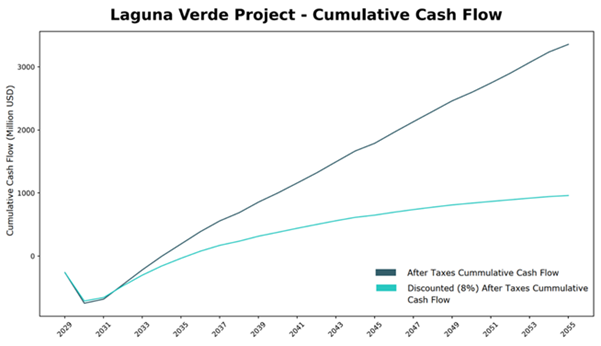
Figure 14: Cumulative Cash Flows - 15,000 tpa Li2CO3
During steady-state operations, annual royalty payments are approximately US$18 million. Based on an assumed production rate of 15,000 tpa of lithium carbonate and a lithium sales price of US$22,500 per metric tonne, the combined weighted average royalty burden over the evaluation period is estimated at approximately 6.1% of gross revenues.
Economic Evaluation Results:
Based on the assumptions described above, the Laguna Verde Project demonstrates strong economic performance. On a before-tax basis, the project generates an NPV (8%) of approximately US$ 1.37 billion, with an IRR of approximately 24.2% and a payback period of approximately 3.9 years from commencement of commercial production.
On an after-tax basis, the project generates an NPV (8%) of approximately US$0.96 billion, with an IRR of approximately 21.2% and a payback period of approximately 4.0 years.
|
BEFORE TAX
|
AFTER TAX
|
||
|
MM US$
|
|||
|
NPV 0% |
4.599 |
NPV 0% |
3.354 |
|
NPV 6% |
1.830 |
NPV 6% |
1.306 |
|
NPV 8% |
1.366 |
NPV 8% |
959 |
|
NPV 10% |
1.020 |
NPV 10% |
699 |
|
IRR |
24,2% |
IRR |
21,2% |
|
PAY BACK |
3 Y & 11 M |
PAY BACK |
4 Y & 0 M |
Table 6: Summary of Economic Results
Sensitivity Analysis:
A post-tax sensitivity analysis evaluates the effect of varying CAPEX, lithium carbonate price, production rate, and OPEX independently to 80%, 90%, 110%, and 120% of base case, measuring impacts on NPV (8%) and IRR. The results show NPV is most sensitive to price, followed by production, while CAPEX and OPEX have comparatively smaller impacts on NPV within the tested ranges. Similar results are obtained for the IRR sensitivity.
| DRIVER VARIABLE | BASE CASE VALUES |
PROJECT NPV (8%) - MMUS$
|
|||||
| 80% | 90% | 100% | 110% | 120% | |||
|
CAPEX |
MUS$ |
748 |
1,094 |
1,026 |
959 |
891 |
824 |
|
Price |
US$/Tonne |
22,500 |
546 |
757 |
959 |
1,158 |
1,357 |
|
Production |
TPA |
15,000 |
635 |
798 |
959 |
1,120 |
1,279 |
|
OPEX |
US$/Tonne |
5,768 |
1,063 |
1,010 |
959 |
905 |
852 |
Table 7: Project After Taxes - NPV 8% Sensitivity
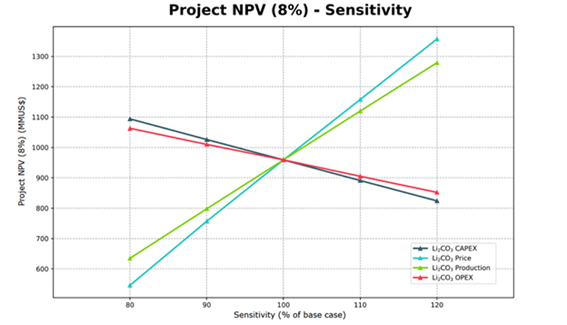
Figure 15: Project After Taxes NPV 8% Sensitivity
The results indicate that, as expected, the project's NPV is highly sensitive to lithium carbonate price levels. A ±20% variation in lithium carbonate price results in an approximate 42% change in NPV, making price the most influential driver on project value.
The project is also materially sensitive to production levels, with a ±20% variation in production rate resulting in an approximate 33% change in NPV. This reflects the strong leverage of production throughput on revenue generation and overall project economics.
By comparison, the project's NPV is less sensitive to variations in CAPEX and OPEX. A ±20% variation in CAPEX results in an approximate 12% change in NPV, while a ±20% variation in OPEX leads to an approximate 11% change in NPV. This reflects the relative scale of operating margins and long-term revenue generation compared to upfront and ongoing cost variations.
The economic results are based on preliminary engineering and economic assessments and are subject to risks and uncertainties, including lithium price variability, process performance, permitting outcomes and project execution.
The PFS is based on preliminary engineering and economic assessments and incorporates information provided by CleanTech Lithium PLC and third-party consultants. While Worley has acted as study integrator and provided engineering and cost estimation services, it has not independently verified all third-party inputs and does not accept responsibility for such information. The results presented are subject to risks and uncertainties typical of projects at this stage of development.
Funding the Development
CleanTech Lithium announced in early January 2026 that it had appointed Cutfield Freeman & Company Limited ("Cutfield") as its Financial Advisor for the purposes of supporting the Company in selecting a strategic partner for the next phase of development at the Laguna Verde project and in structuring the financing pathway towards commercial production.
The Company has been working closely with Cutfield since their appointment and they are confident the economics of PFS are sufficiently robust to elicit real interest from the many parties of scale they have on the target list agreed with the Company, including relevant supporting banks. This includes OEMs, international traders, battery manufacturers, industry players and other entities. This is in addition to parties the Company has had under NDA for some time and who have been awaiting the approval of the CEOL and release of the PFS.
Cutfield will now commence their process to select a strategic partner. The CTL Board believes that Laguna Verde will be a very attractive project for parties looking to secure long-term lithium carbonate supply at a time where demand is forecast to increase substantially in the coming years and supply becomes increasingly constrained.
Competent Persons Statement
The following professionals act as competent persons, as defined in the AIM Note for Mining, Oil and Gas Companies (June 2009) and JORC Code (2012):
Mr. Michael Rosko is a Registered Member of the Society for Mining, Metallurgy and Exploration, member #4064687. He graduated from the University of Illinois with a bachelor's degree in geosciences in 1983, and from the University of Arizona with a master's degree in geosciences in 1986. Mr. Rosko is a registered professional geologist in the states of Arizona (#25065), California (#5236), and Texas (#6359). Mr. Rosko has practiced his profession for 40 years and has been directly involved in design of numerous exploration and production well programs in salar basins in support of lithium exploration, and estimation of the lithium resources and reserves for many other lithium projects in Argentina and Chile. Mr. Rosko is a Vice President and Senior Hydrogeologist at Montgomery & Associates.
Mr. Brandon Schneider is employed as a Senior Hydrogeologist at Montgomery & Associates. He graduated from California Lutheran University in 2011 with a Bachelor of Science degree in Geology (with Honors) and obtained a Master of Science in Geological Sciences (Hydrogeology focus) from the University of Notre Dame in 2013. He is a professional in the discipline of Hydrogeology, and is a Registered Professional Geologist in Arizona (#61267) and SME Registered Member (#4306449). He has practiced his profession continuously since 2013. His relevant experience includes: (i) from 2013 to 2016, consulting hydrogeologist specializing in hydrogeological characterizations, aquifer test analyses, groundwater modeling, and pumping well optimization for mining projects and sedimentary basins in Arizona, United States; (ii) since 2017, consulting hydrogeologist in Chile specializing in lithium brine projects in Argentina and Chile with relevant and continuous experience in brine exploration, lithium brine resource and reserve estimates, resource and reserve reporting, variable density flow and transport modeling, and optimization of groundwater pumping.
Mr. Marcelo Bravo, Chemical Engineer (Universidad Católica del Norte), has a Master's Degree in Engineering Sciences major in Mineral Processing, Universidad de Antofagasta. He currently works as a Senior Process Consulting Engineer at the Ad-Infinitum company. Mr Bravo has relevant experience in researching and developing potassium, lithium carbonate, and solar evapo-concentration design processes in Chile, Argentina, and Bolivia. Mr Bravo, who has reviewed and approved the information contained in the chapters relevant to his expertise contained in this announcement, is registered with No. 412 in the public registry of Competent Persons in Mining Resources and Reserves per the Law of Persons Competent and its Regulations in force in Chile. Mr Bravo has sufficient experience relevant to the metallurgical tests and the type of subsequent processing of the extracted brines under consideration and to the activity being carried out to qualify as a competent person, as defined in the JORC Code. Mr Bravo consents to the inclusion in the press release of the matters based on his information in the form and context in which it appears.
|
For further information contact: |
|
|
CleanTech Lithium PLC |
|
|
Ignacio Mehech/Gordon Stein/Nick Baxter |
Office: +44 (0) 1534 668 321 Mobile: +44 (0) 7494 630 360 Email: info@ctlithium.com |
|
Beaumont Cornish Limited (Nominated Adviser) Roland Cornish/Asia Szusciak |
+44 (0) 20 7628 3396 |
|
Istar Capital Limited (Joint Broker) Daniel Fox-Davies |
+44 (0) 20 3884 8450 |
|
Canaccord Genuity (Joint Broker) James Asensio |
+44 (0) 20 7523 4680 |
Tables included in this RNS have been sourced directly from the PFS or are based on data that is from the PFS.
Investors can sign up to Investor Meet Company for free and add to meet CleanTech Lithium Plc via: https://www.investormeetcompany.com/cleantech-lithium-plc/register-investor
Beaumont Cornish Limited ("Beaumont Cornish") is the Company's Nominated Adviser and is authorised and regulated by the FCA. Beaumont Cornish's responsibilities as the Company's Nominated Adviser, including a responsibility to advise and guide the Company on its responsibilities under the AIM Rules for Companies and AIM Rules for Nominated Advisers, are owed solely to the London Stock Exchange. Beaumont Cornish is not acting for and will not be responsible to any other persons for providing protections afforded to customers of Beaumont Cornish nor for advising them in relation to the proposed arrangements described in this announcement or any matter referred to in it.
Glossary
|
CaCl2 |
calcium chloride |
|
|
CaCO3 |
calcium carbonate |
|
|
CAPEX |
Capital Cost Estimates |
|
|
CAPEX intensity |
Annual revenue ratio |
|
|
CEOL |
Special Operation Contracts for Lithium in Chile |
|
|
Cl |
chlorine |
|
|
CP |
competent person |
|
|
DLE |
direct lithium extraction |
|
|
DFS |
Definitive feasibility study |
|
|
EIA |
Environmental Impact Assessment Study |
|
|
IRR |
Internal Rate of Return |
|
|
JORC Code (2012) |
a professional code of practice that sets minimum standards for Public Reporting of minerals Exploration Results, Mineral Resources and Ore Reserves published by the Australasian Joint Ore Reserves Committee |
|
|
IX |
ion-exchange |
|
|
km |
kilometre |
|
|
km2 |
square kilometre |
|
|
l/s |
litres per second |
|
|
LCE |
lithium carbonate equivalent |
|
|
Li |
lithium |
|
|
LiCl |
lithium chloride |
|
|
LiOH*H2O |
lithium hydroxide |
|
|
Li2CO3 |
lithium carbonate |
|
|
LCE |
lithium carbonate equivalent |
|
|
LOM |
Life-of-mine |
|
|
LV |
Laguna Verde |
|
|
m |
metre |
|
|
m3 |
cubic metres |
|
|
mg/L |
milligram per litre |
|
|
Na |
sodium |
|
|
Na2CO3 |
sodium carbonate (soda ash) |
|
|
NPV |
Net Present Value |
|
|
OPEX |
Operating Cost Estimates |
|
|
PFS |
Pre-feasibility study |
|
|
QP |
Qualified Person |
|
|
RCA |
Resolution of Environmental Qualification |
|
|
RO-NF-ED |
RO (Reverse Osmosis), NF (Nanofiltration), and ED (Electrodialysis) |
|
|
t |
tonnes |
|
|
tpa |
tonnes per annum |
|
|
TIC |
total installed costs |
|
|
US$ |
United States dollar |
|
|
ZOIT |
Zone of Tourist Interest |
Notes
CleanTech Lithium (AIM:CTL, Frankfurt:T2N) is an exploration and development company advancing lithium projects in Chile for the clean energy transition. CleanTech Lithium has two key lithium projects in Chile, Laguna Verde and Viento Andino, and exploration stage project in Arenas Blancas (Salar de Atacama), located in the lithium triangle, a leading centre for battery grade lithium production. CleanTech Lithium and the Mining Ministry in Chile have agreed the contractual terms for the Special Lithium Operating Contract ("CEOL") for Laguna Verde, subject to final ratification.
CleanTech Lithium is committed to utilising Direct Lithium Extraction ("DLE") with reinjection of spent brine. Direct Lithium Extraction is a transformative technology which removes lithium from brine with higher recoveries, short development lead times and no extensive evaporation pond construction. For more information, please visit: www.ctlithium.com
**ENDS**
JORC Code, 2012 Edition - Table 1Section 1 Sampling Techniques and Data
(Criteria in this section apply to all succeeding sections.)
|
Criteria |
JORC Code explanation |
Commentary |
|
Sampling techniques |
· Nature and quality of sampling (eg cut channels, random chips, or specific specialised industry standard measurement tools appropriate to the minerals under investigation, such as down hole gamma sondes, or handheld XRF instruments, etc). These examples should not be taken as limiting the broad meaning of sampling. · Include reference to measures taken to ensure sample representativity and the appropriate calibration of any measurement tools or systems used. · Aspects of the determination of mineralisation that are Material to the Public Report. · In cases where 'industry standard' work has been done this would be relatively simple (eg 'reverse circulation drilling was used to obtain 1 m samples from which 3 kg was pulverised to produce a 30 g charge for fire assay'). In other cases more explanation may be required, such as where there is coarse gold that has inherent sampling problems. Unusual commodities or mineralisation types (eg submarine nodules) may warrant disclosure of detailed information. |
· Sub-surface brine samples were obtained using six different methods: Packer sampling, PVC airlift sampling, disposable bailer sampling, electric valve bailer sampling, Hydrasleeve sampling, and composite brine sampling during pumping tests. · Brine water samples were taken from the surface of the lagoon, in an 800 m sampling grid, including eight sampling duplicates at random locations. The samples were taken from a 0.5 m depth, and for positions with a depth above 5 m, a bottom sample was also obtained. · In the field, electrical conductivity and temperature were measured for every sample with a Hanna Multiparameter device. All materials and sampling bottles were first flushed with brine water before being filled. · For every sample, 2 liters of brine were obtained with a 1-liter double valve bailer, using a new bailer for each sampling position. All materials and sampling bottles were first flushed with 100 cc of brine water before receiving the final sample. Electrical conductivity was measured for every sample with a Hanna Multiparameter model HI98192. The last two samples that had similar stabilized electrical conductivity values were identified as the primary and duplicate samples. · For the packer sampling, a packer bit tool provided by the drilling company (Big Bear) was used. Once the sampling support was sealed, a purging operation took place until no drilling mud was detected. After the purging operation, a half an hour waiting period took place to let brine enter to the packer tool before sampling with a double valve bailer. · Successive 1-liter samples were taken every 30 minutes with a double valve bailer. · Packer samples were obtained approximately every 18 m. · PVC casing suction brine samples were extracted after well development. Once the well was clean and enough water was purged (at least three times the well volume), the PVC casing suction samples were taken from bottom to top while the 2-inch PVC was extracted from the well. A 20-liter bucket was filled with brine and samples were obtained from the bucket once the remaining fine sediments were decanted. · Brine airlift samples were taken every 6 m. · Disposable bailer samples were obtained by JCP Ltda. specialists in water sampling. Samples were taken from the interest depths with a double valve disposable bailer. The bailer was lowered and raised with an electric cable winch to maintain a constant velocity and avoid bailer valves opening after taking the sample. A new bailer was used for each well. · Disposable bailer samples were obtained every 6 m. · In the first quarter of 2023, electric bailer samples were taken from wells LV05, LV06, and LV02 after their proper development. Depth-specific samples were obtained with a 1-liter electric bailer. This sampling process was undertaken by Geodatos. · On all sampling procedures the materials and sampling bottles were first flushed with 100 cc of brine water before receiving the final sample. · Packer samples were taken in wells LV01, LV02, LV03, LV07, and LV11. Airlift samples were obtained from wells LV01, LV04, LV05, and LV06. Disposable bailer samples were taken in wells LV01 and LV02. Electronic bailer samples were obtained from wells LV02, LV05, and LV06. Hydrasleeve samples were taken from LV04 and LV11. Composite brine samples from pumping tests were taken at wells LV05 and LV06. |
|
Drilling techniques |
· Drill type (eg core, reverse circulation, open-hole hammer, rotary air blast, auger, Bangka, sonic, etc) and details (eg core diameter, triple or standard tube, depth of diamond tails, face-sampling bit or other type, whether core is oriented and if so, by what method, etc). |
· Diamond drilling with a PQ3 diameter was used to drill wells LV01 and LV03 to a depth of 320 m. Below that depth, the drilling diameter was reduced to HQ3. · At wells LV02 and LV04, diamond drilling with a PQ3 diameter was used to their final depth. · For both diameters, a triple tube core barrel was used for the core recovery. · Except for drillhole LV04, custom-made packer bits provided by Big Bear were used to obtain brine samples. · Drillholes LV01, LV02 and LV04 were cased with 3" PVC and silica gravel. LV03 was not cased due to well collapse and tool entrapment. · Wells LV05 and LV06 were drilled using the flooded reverse drilling method with a 14 ¾ inch diameter to their final depths. Both wells were cased with 8-inch PVC and gravel pack. · Diamond drillholes LVM05a and LVM06c were drilled with a HQ3 diameter from surface to the final depth. LVM05b was drilled with Tricone 3 7/8" diameter from land surface to 41.5 m. · Diamond drillhole LV07 was drilled with PQ3 diameter from land surface to 300 m, and with HQ3 diameter from 300 to 650 m. · Diamond drillhole LV11 was drilled with PQ3 diameter from land surface to 254 m with no recovery in the first 50 meters, and it was drilled with HQ3 diameter from 254 to 412.85 m. Development operations · After PVC casing and silica gravel installation took place at the exploration wells, a development process was undertaken to ensure clean aquifer water was available during sampling. The well development included injection of a hypochlorite solution to break the drilling additives, and purging via airlifting of a minimum three well volumes was undertaken to clean the cased well from drilling mud. · The developing process was made using a small rig, a high-pressure compressor and 2-inch threaded PVC that can be coupled to reach any depth. The purging/cleaning operation was made from top to bottom, injecting air with a hose inside the 2-inch PVC and "suctioning" the water to emulate a reverse circulation (airlift) system. |
|
Drill sample recovery |
· Method of recording and assessing core and chip sample recoveries and results assessed. · Measures taken to maximise sample recovery and ensure representative nature of the samples. · Whether a relationship exists between sample recovery and grade and whether sample bias may have occurred due to preferential loss/gain of fine/coarse material. |
· Diamond core recovery was ensured by direct supervision and continuous geological logging in the field. · For wells drilled using the flooded reverse drilling method, drill cuttings were collected in 10 kg sample bags for geological logging and tests purposes. Direct supervision and continuous geological logging were applied to ensure reliable recovery and descriptions |
|
Logging |
· Whether core and chip samples have been geologically and geotechnically logged to a level of detail to support appropriate Mineral Resource estimation, mining studies and metallurgical studies. · Whether logging is qualitative or quantitative in nature. Core (or costean, channel, etc) photography. · The total length and percentage of the relevant intersections logged. |
· Geological logging took place continuously during drilling in the field. Descriptions were done by CleanTech and M&A. · Logging forms were prepared prior to field work and were used to ensure the same information and style was used regardless of the field geologist. |
|
Sub-sampling techniques and sample preparation |
· If core, whether cut or sawn and whether quarter, half or all core taken. · If non-core, whether riffled, tube sampled, rotary split, etc and whether sampled wet or dry. · For all sample types, the nature, quality and appropriateness of the sample preparation technique. · Quality control procedures adopted for all sub-sampling stages to maximise representivity of samples. · Measures taken to ensure that the sampling is representative of the in situ material collected, including for instance results for field duplicate/second-half sampling. · Whether sample sizes are appropriate to the grain size of the material being sampled. |
· During the brine batch preparation process, the samples were transferred to new sampling bottles. Quality control samples, including standards (internal standards composed of a known stable brine), duplicates, and blank samples (distilled water) were randomly included in the batch. After quality control sample insertion, all samples were re-numbered before submitting to laboratory. Before transferring each sample, the materials used for the transfer were flushed with distilled water and were then shaken to remove water excess, avoiding contamination. |
|
Quality of assay data and laboratory tests |
· The nature, quality and appropriateness of the assaying and laboratory procedures used and whether the technique is considered partial or total. · For geophysical tools, spectrometers, handheld XRF instruments, etc, the parameters used in determining the analysis including instrument make and model, reading times, calibrations factors applied and their derivation, etc. · Nature of quality control procedures adopted (eg standards, blanks, duplicates, external laboratory checks) and whether acceptable levels of accuracy (ie lack of bias) and precision have been established. |
· Brine samples were assayed by ALS Life Science Chile laboratory (ALS), for Li, K, B, Mg, Ca, Cu, and Na using the ICP-OES method described on QWI-IO-ICP-OES- 01 Edition A, Modification 0 EPA 3005A; EPA 200.2. · For density measurements, the method described by Thompson and Troeh Y "Los suelos y su fertilidad." 2002. Editorial Reverté S.A. Cuarta Edición. Págs.75-85, was used. · Chlorine determination was done based on Standard Methods for the Examination of Water and Wastewater, 23rd Edition 2017. Método 4500-Cl-B QWI-IO-Cl-01 Emisión B, mod. 1. SM 4500-Cl- B, 22nd Edition 2012. · Total Dissolved Solid (TDS) determination was done using the method described on INN/SMA SM 2540 C Ed 22, 2012. · Sulfate was analyzed according to the method described in INN/SMA SM 4500 SO4-D Ed 22, 2012. · Duplicates were obtained randomly during brine sampling. Also, blanks (distilled water) and standards were randomly inserted during the laboratory batch preparation. · The 2022 standards were prepared by the Universidad Católica del Norte, Chile using a known stable brine. Standard nominal grade was calculated in a round-robin process that included four laboratories. The ALS laboratory was validated during the round-robin process. · Check samples composed by standards, duplicates, and blanks were inserted at a rate of one for each 20 original samples during the year 2022. · After the year 2023, quality control samples were inserted at a rate of one every 10 original samples. For the 2023 QA/QC process, a new set of standards was internally prepared using 200 liters of brine obtained from well LV02 during the development process. Standard nominal lithium grade was calculated in a round-robin process that included four laboratories. · For the 2024 sampling campaign, duplicates, standards, and blanks were utilized during brine sampling and were submitted for analysis. Standards for the 2024 campaign were prepared in the University of Antofagasta. Quality control samples were inserted at a rate of approximately one every 10 original samples. Geophysics: · To measure the lake bathymetry, a Garmin Echomap CV44 and Eco Probe CV20-TM Garmin were used. The equipment has a resolution of 0.3 ft and maximum depth measurement of 2,900 ft. The bathymetry data was calibrated using a density of 1.14 g/cm3. · For the TEM geophysical survey, a Zonge multipurpose digital receiver model GDP-32 and TEM transmitter model ZT-30 were used. · For the first survey campaign in May 2021, a coincident transmission/reception loop was utilized with 11 lines and a 400 m separation. 167 stations were designated with a 100x100 m2 loop and four stations with a 200x200 m2 loop; a survey depth of 300 m and 400 m was reached, respectively. · For the second TEM geophysical survey in March 2022, 32 TEM stations were surveyed which utilized six lines and a 400 m separation. A coincident loop Tx=Rx of 200 x 200 m2 allowed for the investigation to a depth of 400 m. · For the third TEM geophysical survey in January 2023, 14 TEM stations were surveyed with two lines and a 400 m separation. A coincident loop Tx=Rx of 200x200 m2 allowed for investigation to a depth of 400 m. · The equipment used for the gravity survey was a Scintrex portable digital model CG-5 Autograv, "microgravity meter", with a 0.001 mGal resolution as well as a tidal, temperature, pressure, and automatic level correction system. · The topographic data measured during the gravity survey was acquired with a double frequency differential positioning equipment, brand CHC NAV, model I-80 GNSS, that consists of two synchronized instruments, the first of which was fixed at a known topographic station, and the other that is mobile through the surveyed gravimetric stations. · In January 2023, a gravity survey was made consisting of 111 stations, with a separation of 200 m to 300 m, and arrangement through four lines around the lagoon area. |
|
Verification of sampling and assaying |
· The verification of significant intersections by either independent or alternative company personnel. · The use of twinned holes. · Documentation of primary data, data entry procedures, data verification, data storage (physical and electronic) protocols. · Discuss any adjustment to assay data. |
· The assay data was verified by M&A and C. Feddersen based on the assay certificates. · Data from bathymetry and geophysics was used as delivered by Servicios Geológicos Geodatos SAIC. · Geological logs were managed by the geology contractor GEOMIN and were checked by the Competent Persons. · Brine samples batches were prepared personally by the competent person, JCP Ltda., Geomin SpA or according to Competent Person's instructions. All data was stored in Excel files. |
|
Location of data points |
· Accuracy and quality of surveys used to locate drill holes (collar and down-hole surveys), trenches, mine workings and other locations used in Mineral Resource estimation. · Specification of the grid system used. · Quality and adequacy of topographic control. |
· Sample coordinates were obtained with a non-differential hand-held GPS unit. · The bathymetry coordinates in Laguna Verde were obtained by a Thales Navigation differential GPS system, which consists of two GPS ProMark3 devices designed to work in geodesic, cinematic, and static modes of high precision, where one of the instruments was installed as a base station and the other on board of the craft. · The TEM geophysical survey coordinates were obtained with a non-differential hand-held GPS unit. · Drillhole collars were obtained with a non-differential hand-held GPS unit. Positions were verified by the mining concession field markings. · Gravity stations were located with a double frequency differential positioning equipment, brand CHC NAV, model I-80 GNSS, that consists of two synchronized pieces of equipment, one fixed at a known topographic station, and the other mobile at the surveyed gravimetric stations. · The coordinate system is UTM, Datum WGS84 Zone 19J. · Topographic control is not considered critical as the lagoon and its surroundings are generally flat lying and the samples were definitively obtained from the lagoon. |
|
Data spacing and distribution |
· Data spacing for reporting of Exploration Results. · Whether the data spacing and distribution is sufficient to establish the degree of geological and grade continuity appropriate for the Mineral Resource and Ore Reserve estimation procedure(s) and classifications applied. · Whether sample compositing has been applied. |
· The geochemical lagoon sample spacing was approximately 800 m, covering the entire lagoon area. · Packer brine samples were taken vertically every 18 m. · PVC bailer samples (disposable and electric) were taken vertically every 6 m. · For bathymetry, two grids were used, one of 400 m and the other of 200 m in areas where the perimeter has more curves. · For TEM geophysical surveys, the distance between stations was 400 m. · For the gravimetric survey, the distance between stations was 200 - 300 m. · The author believes that the data spacing and distribution are sufficient to establish the degree of geological and grade continuity appropriate for the resource estimate. |
|
Orientation of data in relation to geological structure |
· Whether the orientation of sampling achieves unbiased sampling of possible structures and the extent to which this is known, considering the deposit type. · If the relationship between the drilling orientation and the orientation of key mineralised structures is considered to have introduced a sampling bias, this should be assessed and reported if material. |
· The lagoon in Laguna Verde is a free water body, and no mineralized structures are expected in the sub-surface deposits. |
|
Sample security |
· The measures taken to ensure sample security. |
· All brine samples were marked and kept on site before transporting them to the Copiapó warehouse where the laboratory sample batch was prepared and stored in sealed plastic boxes. Subsequently, the Laguna Verde samples were sent via courier to the ALS laboratory in Antofagasta. The transport of samples was directly supervised by the Competent Person. · ALS laboratory personnel reported that the samples were received without any problem or disturbance. |
|
Audits or reviews |
· The results of any audits or reviews of sampling techniques and data. |
· The assay data was verified by M&A and C. Feddersen against the laboratory certificates. · The July 2021 JORC technical report was reviewed by Montgomery & Associates Vice President and CP Michael Rosko, MS PG, SME Registered Member #4064687. In the report, he concludes that "The bulk of the information for the Laguna Verde exploration work and resulting initial lithium resource estimate was summarized Feddersen (2021). Overall, the CP agrees that industry-standard methods were used, and that the initial lithium resource estimate is reasonable based on the information available". · The September 2022 JORC Report Laguna Verde Updated Resource Estimation Report, and data acquisition and QA/QC protocols were audited in October 2022 by Don Hains, P. Geo. from Hains Engineering Company Limited (D. Hains October 2022 QA/QC Procedures, Review, Site Visit Report). · Hains concluded that "The overall QA/QC procedures employed by CleanTech are well documented and the exploration data collected and analysed in a comprehensive manner. There are no significant short comings in the overall programme." · With respect to the exploration program, Hains stated that "the overall exploration program has been well designed and well executed. Field work appears to have been well managed, with excellent data collection. The drill pads have been restored to a very high standard. The TEM geophysical work has been useful in defining the extensional limits of the salar at Laguna Verde". · With respect to specific yield, Hains stated that "RBRC test work at Danial B. Stevens Associates has been well done. It is recommended obtaining specific yield data using a second method such as centrifuge, nitrogen permeation or NMR. The available RBRC data indicates an average Sy value of 5.6%. This is a significant decrease from the previously estimated value of approximately 11%. The implications of the lower RBRC value in terms of the overall resource estimate should be carefully evaluated". · Several recommendations were made by Mr. Hains in his report to improve the QA/QC protocols, data acquisition, assays, presentation, and storage. His recommendations have been considered and included in the exploration work schedule since October 2022. |
Section 2 Reporting of Exploration Results
(Criteria listed in the preceding section also apply to this section.)
|
Criteria |
JORC Code explanation |
Commentary |
|
Mineral tenement and land tenure status |
· Type, reference name/number, location and ownership including agreements or material issues with third parties such as joint ventures, partnerships, overriding royalties, native title interests, historical sites, wilderness or national park and environmental settings. · The security of the tenure held at the time of reporting along with any known impediments to obtaining a licence to operate in the area. |
· In Laguna Verde, CleanTech, through Atacama Salt Lakes SpA, has 88 pedimentos constituidos which cover an area of 22,800 hectares, 8 solicitudes de mensura which cover an area of 1,332 hectares, and 61 pertenencias which cover an area of 9,758 hectares. CleanTech also has additional pedimentos en trámite. Drilling and sampling for lithium can occur where the CleanTech has preferential licenses, which covers a majority of their concessions. · In Laguna Verde, CleanTech is also in the application process for a Contrato Especial de Operation de Litio (CEOL) from the Chilean Government, which would grant them the sole right to explore and exploit lithium in the basin. |
|
Exploration done by other parties |
· Acknowledgment and appraisal of exploration by other parties. |
· In Laguna Verde, exploration work has also been done by Pan American Lithium and Wealth Minerals Ltda. |
|
Geology |
· Deposit type, geological setting and style of mineralization. |
· Laguna Verde is a hypersaline lagoon that is classified as an immature clastic salar. The deposit is composed of a surface brine resource, including the brine volume of the surface lagoon. The sub-surface resource formed by brine water hosted in volcano-clastic sediments that lie beneath the lagoon. |
|
Drill hole Information |
· A summary of all information material to the understanding of the exploration results including a tabulation of the following information for all Material drill holes: o easting and northing of the drill hole collar o elevation or RL (Reduced Level - elevation above sea level in metres) of the drill hole collar o dip and azimuth of the hole o down hole length and interception depth o hole length. · If the exclusion of this information is justified on the basis that the information is not Material and this exclusion does not detract from the understanding of the report, the Competent Person should clearly explain why this is the case. |
· The following drillhole are in the WGS84 zone 19S coordinate system: · LV01 E549,432 N7,027,088 ELEV 4,429 m a.s.l. · LV02 E 553,992 N 7,024,396 ELEV 4,354 m a.s.l. · LV03 E 549,980 N 7,028,434 ELEV 4,402 m a.s.l. · LV04 E 556,826 N 7,024,390 ELEV 4,350 m a.s.l. · LV05 E 550,972 N 7,027,908 ELEV 4,355 m a.s.l. · LV06 E 555,912 N 7,026,004 ELEV 4,335 m a.s.l. · LVM05a E 550,921 N 7,027,908 ELEV 4,355 m a.s.l. · LVM05b E 550,946 N 7,027,951 ELEV 4,355 m a.s.l. · LVM06c E 555,959 N 7,026,032 ELEV 4,335 m a.s.l. · LV07 E 552,561 N 7,025,296 ELEV 4,345 m a.s.l. · LV11 E 555,582 N 7,024,793 ELEV 4,345 m a.s.l. |
|
Data aggregation methods |
· In reporting Exploration Results, weighting averaging techniques, maximum and/or minimum grade truncations (eg cutting of high grades) and cut-off grades are usually Material and should be stated. · Where aggregate intercepts incorporate short lengths of high grade results and longer lengths of low grade results, the procedure used for such aggregation should be stated and some typical examples of such aggregations should be shown in detail. · The assumptions used for any reporting of metal equivalent values should be clearly stated. |
· For the surface brine resource, no low-grade cut-off or high-grade capping has been implemented due to the consistent nature of the brine assay data. · For the sub-surface resource, no low-grade cut-off or high-grade capping has been implemented. |
|
Relationship between mineralization widths and intercept lengths |
· These relationships are particularly important in the reporting of Exploration Results. · If the geometry of the mineralisation with respect to the drill hole angle is known, its nature should be reported. · If it is not known and only the down hole lengths are reported, there should be a clear statement to this effect (eg 'down hole length, true width not known'). |
· In Laguna Verde, the relationship between aquifer widths and intercept lengths are direct with vertical wells, however LV03 was inclined with a dip of -60°. |
|
Diagrams |
· Appropriate maps and sections (with scales) and tabulations of intercepts should be included for any significant discovery being reported These should include, but not be limited to a plan view of drill hole collar locations and appropriate sectional views. |
· Locations of the Laguna Verde Exploration Drillholes · Generalized Stratigraphic Column for Laguna Verde Area (based on wells LV01 to LV06) |
|
Balanced reporting |
· Where comprehensive reporting of all Exploration Results is not practicable, representative reporting of both low and high grades and/or widths should be practiced to avoid misleading reporting of Exploration Results. |
· Reported results have not been filtered based on the exclusion of low or high grades. |
|
|
· Other exploration data, if meaningful and material, should be reported including (but not limited to): geological observations; geophysical survey results; geochemical survey results; bulk samples - size and method of treatment; metallurgical test results; bulk density, groundwater, geotechnical and rock characteristics; potential deleterious or contaminating substances. |
· Pumping tests were conducted at wells LV05 and LV06. · A 50 hp submergible electric pump, and piping with flowmeters were used for the pump tests. The tests consisted of a variable rate pumping to verify the aquifer and pump capacity, as well as subsequently constant rate (48-hour to 7-day) pumping tests to obtain aquifer parameters and monitor observed water levels and the extracted brine chemistry. · In LV05, the pump was installed at 156 m and in LV06, at 150 m. |
|
Further work |
· The nature and scale of planned further work (eg tests for lateral extensions or depth extensions or large-scale step-out drilling). · Diagrams clearly highlighting the areas of possible extensions, including the main geological interpretations and future drilling areas, provided this information is not commercially sensitive. |
· Exploration drilling and testing will continue in the next project phase. Areas of additional exploration will include the western and northern/northeastern portion of the current property concessions. A future long-term pumping and reinjection test is also planned. |
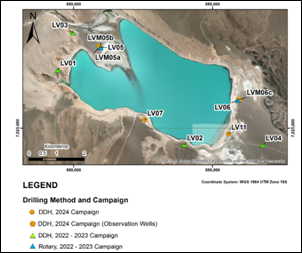
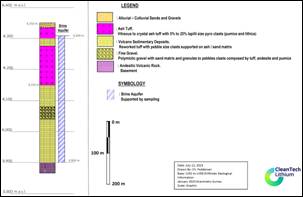
Section 3 Estimation and Reporting of Mineral Resources
(Criteria listed in section 1, and where relevant in section 2, also apply to this section.)
|
Criteria |
JORC Code explanation |
Commentary |
|
Database integrity |
· Measures taken to ensure that data has not been corrupted by, for example, transcription or keying errors, between its initial collection and its use for Mineral Resource estimation purposes. · Data validation procedures used. |
· For the previous resource estimate (Feddersen, 2023), all databases were built from original data by Competent Person C. Feddersen and were checked by project personnel. · For the resource estimate detailed in this report and the previous resource report (M&A, 2025), databases were reviewed by M&A staff and the CPs. |
|
Site visits |
· Comment on any site visits undertaken by the Competent Person and the outcome of those visits. · If no site visits have been undertaken indicate why this is the case. |
· A site visit was undertaken by Competent Person C. Feddersen from June 2nd to June 4th, 2021. The outcome of the visit was a general geological review and the lagoon water brine geochemical sampling that led to the July 2021 JORC Technical Report. · Competent Person M. Rosko conducted a site visit in October 2021 to review the exploration activities. · The January to May 2022 drilling campaign was continually supervised by the Competent Person C. Feddersen, that led to the September 2022 updated JORC Technical Report. · The October 2022 to May 2023 drilling campaign was also supervised by Competent Person C. Feddersen. · The 2024 campaign was supervised by M&A Competent Persons and staff. |
|
Geological interpretation |
· Confidence in (or conversely, the uncertainty of ) the geological interpretation of the mineral deposit. · Nature of the data used and of any assumptions made. · The effect, if any, of alternative interpretations on Mineral Resource estimation. · The use of geology in guiding and controlling Mineral Resource estimation. · The factors affecting continuity both of grade and geology. |
· For the surface brine resource, an average lithium grade was used for the entire surface water body based on the consistent values obtained; thus, there is a high certainty. · For the sub-surface resource, the geological interpretation was made based on the TEM and gravity surveys conducted by Geodatos. The lithological interpretation was confirmed by the January - May 2022 diamond drillhole campaign (LV01 to LV04), December 2022 - May 2023 drillhole campaign (LV05 & LV06), and 2024 campaign (LV07 & LV11). · Low resistivities are associated with volcaniclastic sediments saturated in brines, but also with tuff, very fine sediments, or clays. The direct relationship between the low resistivity layer with the overlying hypersaline lagoon raises the confidence that the low resistivities are associated with brines. · Drillholes confirm the geological interpretations. |
|
Dimensions |
· The extent and variability of the Mineral Resource expressed as length (along strike or otherwise), plan width, and depth below surface to the upper and lower limits of the Mineral Resource. |
· For the surface brine resource, the lagoon dimensions are 14,682,408 m2 of area with depths ranging from 0 m to 7.18m with an average depth of 4.05 m. · The sub-surface brine resource is a horizontal lens closely restricted to the lagoon perimeter with an area of approximately 55 km2 and depths of more than 400 m, from approximately 4,309 m a.s.l. to the deepest exploration well (LV07; 650 m deep). |
|
|
· The nature and appropriateness of the estimation technique(s) applied and key assumptions, including treatment of extreme grade values, domaining, interpolation parameters and maximum distance of extrapolation from data points. If a computer assisted estimation method was chosen include a description of computer software and parameters used. · The availability of check estimates, previous estimates and/or mine production records and whether the Mineral Resource estimate takes appropriate account of such data. · The assumptions made regarding recovery of by-products. · Estimation of deleterious elements or other non-grade variables of economic significance (eg sulphur for acid mine drainage characterisation). · In the case of block model interpolation, the block size in relation to the average sample spacing and the search employed. · Any assumptions behind modelling of selective mining units. · Any assumptions about correlation between variables. · Description of how the geological interpretation was used to control the resource estimates. · Discussion of basis for using or not using grade cutting or capping. · The process of validation, the checking process used, the comparison of model data to drill hole data, and use of reconciliation data if available. |
· For the surface brine resource, the surface lake brine water volume is directly obtained by the bathymetry study detailed on Section 4.2. · Lithium sample values are in general homogeneously distributed along the lagoon, thus the lithium content in the lake was not estimated via kriging or another geostatistical method. The average lithium value of 246 mg/L was used for the surface brine resource estimate. · The subsurface resource was updated using a block model in the Leapfrog software (Seequent, 2023). During the resource estimation process, the CPs considered the Canadian Institute of Mining (CIM, 2012) Best Practice for Reporting of Lithium Brine Resources and Reserves as well as the Houston et al. (2011) guidelines for brine deposits. · Leapfrog is an industry-standard software program which uses a 3-D implicit modelling approach (Seequent, 2023); with Leapfrog Geo, the geological model was created, and subsequently, the resource block model construction and mass calculations were undertaken using the Edge extension. Considering the horizontal and vertical spacing of obtained field samples, the block model discretization was 150 m by 150 m (horizontal spacing), with a vertical spacing of 5 m, and the total number of blocks corresponds to 1,926,123. · Lithium brine concentration results obtained from sampling were utilized as an input for the resource block model; original ALS results from a variety of sampling methods (including packer, airlift, and pumping tests) were used for a majority of the wells. Packer samples were prioritized for the resource estimate, as they result in depth-specific concentrations, and other methods were used where packer samples were not available. · Drainable porosity values for the hydrogeologic units in Laguna Verde were estimated based on the results of Daniel B. Stephens & Associates, Inc. (DBS&A) laboratory (LV01, LV02, LV03 and LV04) and GSA Laboratory (LV07 and LV11) testing, and their reasonableness was confirmed based on lithology of the unit. · Prior to the resource block modelling, an exploratory data analysis (EDA) phase was undertaken for lithium concentrations to identify trends such as univariate statistics and histograms, box plots, and spatial correlations. · Ordinary kriging was employed for the interpolation of lithium concentrations within the subsurface block model. · The resource block model was validated by visual inspection and comparison of the measured and block model concentrations. Swath plots were also utilized. |
|
Moisture |
· Whether the tonnages are estimated on a dry basis or with natural moisture, and the method of determination of the moisture content. |
· Moisture content is not relevant for the estimation of brine resources. |
|
Cut-off parameters |
· The basis of the adopted cut-off grade(s) or quality parameters applied. |
· A lithium cut-off grade of 100 mg/L was applied to the resource estimate based on the chosen DLE processing method, as Lanshen has reportedly recovered lithium content as low as 80 mg/L from raw brine. Furthermore, the applied cut-off grade of 100 mg/L is conservative based on a projected LCE price of US$22,500, as well as a capital expenditure of US$748 million and operating expenses of US$5,768 per tonne of LCE. Only blocks with interpolated lithium grades equal to or greater than the applied cut-off grade (100 mg/L) were considered for the resource estimate. |
|
Mining factors or assumptions |
· Assumptions made regarding possible mining methods, minimum mining dimensions and internal (or, if applicable, external) mining dilution. It is always necessary as part of the process of determining reasonable prospects for eventual economic extraction to consider potential mining methods, but the assumptions made regarding mining methods and parameters when estimating Mineral Resources may not always be rigorous. Where this is the case, this should be reported with an explanation of the basis of the mining assumptions made. |
· Mining will be undertaken by pumping brine from vertical production wells and re-injection of spent brine will subsequently occur back in the aquifer. · Pumping tests conducted to date support individual well flow rates of up to 15 L/s. |
|
Metallurgical factors or assumptions |
· The basis for assumptions or predictions regarding metallurgical amenability. It is always necessary as part of the process of determining reasonable prospects for eventual economic extraction to consider potential metallurgical methods, but the assumptions regarding metallurgical treatment processes and parameters made when reporting Mineral Resources may not always be rigorous. Where this is the case, this should be reported with an explanation of the basis of the metallurgical assumptions made. |
· Based on pilot testing, the metallurgical capacity of lithium recovery in the process has been estimated at 90% to obtain battery grade lithium carbonate. · The planned process for obtaining lithium carbonate considers the following stages: o The lithium is obtained using selective adsorption of lithium-ion from Laguna Verde brine using the DLE process. o The spent solution (without lithium) will be reinjected back into the Laguna Verde aquifer. o The DLE process allows impurity removal waste to be minimal. o The diluted lithium solution recovered from the DLE process is concentrated using reverse osmosis water removal. The removed water is recovered and returned to the process to minimize the water consumption requirements. o Ion exchange stages remove minor impurities such as magnesium, calcium, and boron to obtain a clean lithium solution. o Lithium carbonate is obtained with a saturated soda ash solution to precipitate it in the carbonation stage. o The lithium carbonate obtained is washed with ultra-pure water to obtain battery grade product with minimum impurities. o From the carbonation process, a remaining solution (mother liquor) is obtained, which is treated to concentration utilizing evaporators to recirculate in the carbonation process and ensure the greatest possible recovery of lithium. The removed water is recovered and reintegrated into the process. · The selected DLE process has been tested by Beyond Lithium LLC at its facilities in the city of Salta, Argentina. The stages of removal of impurities and carbonation have been tested, obtaining a representative sample. The sample was analyzed in Germany by the laboratory Dorfner Anzaplan showing 99.9% pure Li2CO3. · The process has been modelled by Ad infinitum using the SysCAD simulation platform and their AQSOL thermodynamic property package. With the model, simulations of the process were made to obtain the appropriate mass balances. |
|
Environmen-tal factors or assumptions |
· Assumptions made regarding possible waste and process residue disposal options. It is always necessary as part of the process of determining reasonable prospects for eventual economic extraction to consider the potential environmental impacts of the mining and processing operation. While at this stage the determination of potential environmental impacts, particularly for a greenfields project, may not always be well advanced, the status of early consideration of these potential environmental impacts should be reported. Where these aspects have not been considered this should be reported with an explanation of the environmental assumptions made. |
· The main environmental impact that could occur at Laguna Verde is a reduction of the surface water features due to brine pumping; however, reinjection will be aimed to sustain the surface water features and limit impacts from production pumping. Other potential environmental factors may be associated with the main plant installation. |
|
Bulk density |
· Whether assumed or determined. If assumed, the basis for the assumptions. If determined, the method used, whether wet or dry, the frequency of the measurements, the nature, size and representativeness of the samples. · The bulk density for bulk material must have been measured by methods that adequately account for void spaces (vugs, porosity, etc), moisture and differences between rock and alteration zones within the deposit. · Discuss assumptions for bulk density estimates used in the evaluation process of the different materials. |
· Bulk density is not relevant to brine resource estimation. |
|
Classification |
· The basis for the classification of the Mineral Resources into varying confidence categories. · Whether appropriate account has been taken of all relevant factors (ie relative confidence in tonnage/grade estimations, reliability of input data, confidence in continuity of geology and metal values, quality, quantity and distribution of the data). · Whether the result appropriately reflects the Competent Person's view of the deposit. |
· The preferential concession area used for the resource calculation, which corresponds to licenses held by CleanTech as the preferential holder (with no conflicting applications or concessions from other mining companies). The area outside the preferential licenses that could be converted to CleanTech's control (based on the Government CEOL polygon) was considered as potential upside. · The areal extent of the resource categories was largely based on the suggestions of Houston et al. (2011) for immature salt flats: o Measured resources were limited to within 1.25 km from the exploration well o Indicated resources were limited to within 2.5 km from the exploration well o Inferred resources were limited to within 5 km from the exploration well · The determination of the Indicated resource areas was dependent on the availability of depth-specific brine analyses, drainable porosity measurements and QA/QC. Differentiation between these areas and Measured areas was largely dependent on the well spacing, amount and reliability of field data, pumping test results, and overall lithologic and grade continuity between wells. · An extension of the Inferred resources to 5 km is supported by the conducted geophysics which indicates probable brine in sediments underlying the young volcanic outcrops surrounding the lake. Furthermore, inclusion of the lower volcanic rock unit is supported by the following: (i) it was possible to obtain packer samples in the deepest portion of LV07; (ii) the density contrast used to set the upper contact of the lower volcanic rock (-0.35 gr/cc) was intermediate and not the deepest density contrast; (iii) conceptually, Laguna Verde is found in a tectonically active region with fractures in the host rock, as indicated by hydrothermal activity along the eastern side of the lake. |
|
Audits or reviews |
· The results of any audits or reviews of Mineral Resource estimates. |
· The July 2021 JORC technical report were reviewed by Montgomery & Associates Vice President Michael Rosko, MS PG SME Registered Member #4064687. · In the report he concludes that "The bulk of the information for the Laguna Verde exploration work and resulting initial lithium resource estimate was summarized by Feddersen (2021). Overall, the CP agrees that industry-standard methods were used, and that the initial lithium resource estimate is reasonable based on the information available". · The September 2022 JORC Report Laguna Verde Updated Resource Estimate, and data acquisition and QA/QC protocols were audited in October 2022 by Don Hains, P. Geo. from Hains Engineering Company Limited (D. Hains October 2022 QA/QC Procedures, Review, Site Visit Report). · In the report, Hains concludes that "The overall QA/QC procedures employed by CleanTech are well documented and the exploration data collected and analysed in a comprehensive manner. There are no significant short comings in the overall programme". · With respect to the exploration program Hains' comments are "The overall exploration program has been well designed and well executed. Field work appears to have been well managed, with excellent data collection. The drill pads have been restored to a very high standard. The TEM geophysical work has been useful in defining the extensional limits of the salar at Laguna Verde". · With respect to the specific yield estimates, Hains' comments are "RBRC test work at Daniel B. Stevens Associates has been well done. It is recommended obtaining specific yield data using a second method such as centrifuge, nitrogen permeation or NMR. The available RBRC data indicates an average Sy value of 5.6%. This is a significant decrease from the previously estimated value of approximately 11%. The implications of the lower RBRC value in terms of the overall resource estimate should be carefully evaluated". · Several recommendations were made by Mr. Hains in his report to improve the QA/QC protocols, data acquisition, assays, presentation and storage. His recommendations have been considered and included in the exploration work schedule since October 2022. |
|
Discussion of relative accuracy/ confidence |
· Where appropriate a statement of the relative accuracy and confidence level in the Mineral Resource estimate using an approach or procedure deemed appropriate by the Competent Person. For example, the application of statistical or geostatistical procedures to quantify the relative accuracy of the resource within stated confidence limits, or, if such an approach is not deemed appropriate, a qualitative discussion of the factors that could affect the relative accuracy and confidence of the estimate. · The statement should specify whether it relates to global or local estimates, and, if local, state the relevant tonnages, which should be relevant to technical and economic evaluation. Documentation should include assumptions made and the procedures used. · These statements of relative accuracy and confidence of the estimate should be compared with production data, where available. |
· The estimated tonnage represents the in-situ brine with no recovery factor applied. It will not be possible to extract all the contained brine by pumping from production wells. The amount which can be extracted depends on many factors including the permeability of the sediments, the specific yield, and the recharge dynamics of the aquifers. · No production data is available yet for comparison. · Potential sources of uncertainty related the resource estimate include: · Potential permitting restrictions, including the approval of the CEOL and environmental limitations related to eventual extraction of the surface brine resource in the lake. · The modeled concentration distribution and lower lithium grades associated with hydrothermal upwelling to the east of Laguna Verde. · The assigned drainable porosity of the lower volcanic rock (1%), which is based on limited core testing of that unit; additional deep exploration and sampling would help resolve uncertainty regarding the Inferred Resource at depth. |
Section 4 Estimation and Reporting of Ore Reserves
(Criteria listed in section 1, and where relevant in sections 2 and 3, also apply to this section.)
|
Criteria |
JORC Code explanation |
Commentary |
|
Mineral Resource estimate for conversion to Ore Reserves |
· Description of the Mineral Resource estimate used as a basis for the conversion to an Ore Reserve. · Clear statement as to whether the Mineral Resources are reported additional to, or inclusive of, the Ore Reserves. |
· The lithium resource estimate consists of Measured, Indicated and Inferred resources. A detailed geological and resource block model was created in Leapfrog (Seequent, 2023) using obtained well lithologies, discrete-depth values for brine chemistry, drainable porosity values, and geophysical profiles. Lithium concentrations were interpolated using ordinary kriging, specific yield was assigned to each hydrogeological unit, and the mass calculations within the resource block model were undertaken using the Leapfrog Edge extension. · In accordance with the Canadian Institute of Mining (CIM) Best Practice for Reporting of Lithium Brine Resources and Reserves (CIM, 2012), a calibrated groundwater flow and solute transport model was used to estimate the lithium reserve because brine extraction is based on physical pumping from a wellfield. Projected production locations were based on the following criteria: (i) all production wells and screened intervals are located within Measured and Indicated Resource zones at depth; (ii) extraction wells are found within the proposed CEOL polygon (outside of the exclusion zone) and within CleanTech's preferential licenses; (iii) extraction wells were placed in areas with previous aquifer testing. · The lithium reserve was estimated for the Laguna Verde Project considering the modifying factors for converting Mineral Resources to Mineral Reserves, including the production wellfield design and simulated dilution during the projected mine life. Metallurgical losses were also considered as a modifying factor. · Mineral resources are reported inclusive of mineral reserves. |
|
Site visits |
· Comment on any site visits undertaken by the Competent Person and the outcome of those visits. · If no site visits have been undertaken indicate why this is the case. |
· Competent Person M. Rosko conducted a site visit in October 2021 to review the exploration activities. · The 2024 campaign was supervised by M&A Competent Persons and staff. |
|
Study status |
· The type and level of study undertaken to enable Mineral Resources to be converted to Ore Reserves. · The Code requires that a study to at least Pre-Feasibility Study level has been undertaken to convert Mineral Resources to Ore Reserves. Such studies will have been carried out and will have determined a mine plan that is technically achievable and economically viable, and that material Modifying Factors have been considered. |
· The current study level is Pre-Feasibility, with preliminary options related to the mine design, mineral processing, and permitting (CRIRSCO, 2019). A future update at the Feasibility level will include a more confident mine plan and schedule, confident management of spent brine, as well as optimized mineral processing. · A Probable Reserve was estimated at the Pre-Feasibility Study level considering the modifying factors for converting Mineral Resources to Mineral Reserves. The modifying factors for lithium brine deposits include but are not limited to the production wellfield design, future dilution over the projected mine life, and recovery of lithium during the processing phase. |
|
Cut-off parameters |
· The basis of the cut-off grade(s) or quality parameters applied. |
· A lithium cut-off grade of 100 mg/L was applied to the reserve estimate based on the chosen direct lithium extraction (DLE) processing method, as Lanshen has reportedly recovered lithium content as low as 80 mg/L from raw brine. Furthermore, the applied cut-off grade of 100 mg/L is conservative based on a projected LCE price of US$22,500, as well as a capital expenditure of US$748 million and operating expenses of US$5,768 per tonne of LCE. · Pumped brine is ultimately stored in a collection pond and transferred to the receiving ponds near the DLE plant. Thus, a composite grade is present prior to processing. During the 25-year reserve simulation, the average extracted lithium grades vary from approximately 188 and 184 mg/L over the LOM, and the average lithium grade of Probable Reserves corresponds to 186 mg/L. Average extracted grades are above the 100 mg/L cut-off grade, demonstrating that production is projected to economically viable at the current study level. |
|
Mining factors or assumptions |
· The method and assumptions used as reported in the Pre-Feasibility or Feasibility Study to convert the Mineral Resource to an Ore Reserve (i.e. either by application of appropriate factors by optimisation or by preliminary or detailed design). · The choice, nature and appropriateness of the selected mining method(s) and other mining parameters including associated design issues such as pre-strip, access, etc. · The assumptions made regarding geotechnical parameters (eg pit slopes, stope sizes, etc), grade control and pre-production drilling. · The major assumptions made and Mineral Resource model used for pit and stope optimisation (if appropriate). · The mining dilution factors used. · The mining recovery factors used. · Any minimum mining widths used. · The manner in which Inferred Mineral Resources are utilised in mining studies and the sensitivity of the outcome to their inclusion. · The infrastructure requirements of the selected mining methods. |
· The LCE production process for the Laguna Verde Project will operate through vertical brine extraction wells. Based on the results available to date from conducted pumping tests, it has been determined that brine extraction will be carried out through the installation and operation of a conventional brine production wellfield. It is anticipated that extracted brine from each production well will be stored in a collection/transfer pond, from where it will be pumped through a main pipeline directly to the receiving ponds located near the DLE plant in Laguna Verde. · The considerations adopted for the estimation of the production plan are the following: o A Life-of-Mine (LOM) duration of 25 years. o A ramp-up period during the first year of production, followed by full-scale production of 15,000 tonnes of LCE per year (below). o 70% production capacity in the first two months of year 1. o 85% production capacity in the third month of year 1. o 90% production in the fourth and fifth months of year 1. o Full-scale production from month 6 of year 1 though year 25. o A process efficiency factor of 90% is assumed between the production wellheads and generation of LCE product based on pilot testing results. · Geotechnical parameters are not directly relevant for lithium brine deposits. · Future dilution over the projected mine life was modelled with production pumping. · It is anticipated that the production wells will be completed with 10-inch diameter stainless steel casing, and they will be equipped with an 8-inch submersible pump. Permanent power will be supplied to the production area through electric generators connected to each well. Pumped brine from the wells will be delivered to the raw brine receiving pond located in the southern sector of the well field via 8" High Density Polyethylene (HDPE) pipelines, from where it will be pumped through a main pipeline directly to the receiving ponds near the DLE plant. |
|
Metallurgical factors or assumptions |
· The metallurgical process proposed and the appropriateness of that process to the style of mineralisation. · Whether the metallurgical process is well-tested technology or novel in nature. · The nature, amount and representativeness of metallurgical test work undertaken, the nature of the metallurgical domaining applied and the corresponding metallurgical recovery factors applied. · Any assumptions or allowances made for deleterious elements. · The existence of any bulk sample or pilot scale test work and the degree to which such samples are considered representative of the orebody as a whole. · For minerals that are defined by a specification, has the ore reserve estimation been based on the appropriate mineralogy to meet the specifications? |
Selected process: The recovery process assumed for the Laguna Verde Project is a two-stage integrated flowsheet designed and supplied by Lanshent: • Stage 1 - Laguna Verde site (>4,300 m.a.s.l.): Direct Lithium Extraction (DLE) using selective Li-201 adsorbent in a 30-column rotary carousel, preceded by multimedia brine pre-filtration, followed by a sequential membrane train (NF → RO → HPRO), Electrodialysis (ED), Ion Exchange (IX) resins for Ca²⁺, Mg²⁺ and B removal, and Mechanical Vapour Recompression (MVR) evaporation, to produce a 5.88% w/w LiCl solution. • Stage 2 - Copiapó plant (industrial site): Conversion of the concentrated LiCl solution to battery-grade Li₂CO₃ by carbonation with Na₂CO₃ at 85°C, centrifugation, hot washing, drying, micronisation, and mother-liquor lithium recovery circuit. Design capacity: 15,000 tonnes per year Li₂CO₃ (LCE basis). Recoveries confirmed by test work: • DLE (adsorption + desorption): 88% - confirmed by semi-industrial pilot trial in Copiapó (Mar-Jun 2024): 14 cycles, 1,196 m³ of actual Laguna Verde brine, 384 continuous hours of operation. Adsorption recovery: 95%; desorption recovery: 93%; total production: 1.085 tonnes LCE. • Membrane system + IX (NF/RO/HPRO/ED): 98.4% - based on Lanshent supplier specifications and pilot testwork results. • LiCl Plant total recovery (Laguna Verde): 88.6% - consolidated from testwork and process mass balance. • Carbonation recovery (Copiapó, excluding mother-liquor circuit): 87.2% - Conductive Energy trials, Chicago/Dallas, USA (Nov-Dec 2024). • Mother-liquor recovery circuit: +9.3 percentage points of additional lithium recovery. • Li₂CO₃ Plant total recovery (Copiapó): 96.5% - combining carbonation and mother-liquor recovery circuit. • Global LCE recovery (Laguna Verde × Copiapó): 88.6% × 96.5% = 85.5%. Hierarchy of evidence used: • Semi-industrial pilot trial - Copiapó, Chile (2024): 1,196 m³ of actual Laguna Verde brine, 384 continuous operating hours, 14 complete DLE cycles. This represents the highest-weight experimental evidence supporting the DLE assumptions. • Laboratory-scale trial - Santiago, Chile (2024): 7.8 m³ of actual brine, 10 cycles on a Lanshen laboratory carousel unit. Basis for the optimistic recovery scenario (~90% global). • Li₂CO₃ conversion trial - Conductive Energy, Chicago/Dallas, USA (Nov-Dec 2024): 88 m³ of concentrated eluate (4 shipments). Production of ~50 kg Li₂CO₃ at pilot scale. Basis for carbonation stage assumptions. • Supplier specifications (Lanshen): Li-201 adsorbent design parameters, impurity rejection rates, loading capacity (3.5 g Li/kg measured; target 4.6 g Li/kg), carousel configuration and mass balances. • Analogous commercial reference: Lanshen DLE carousel units in commercial operation in China, in a configuration similar to the Laguna Verde design. |
|
Environmen-tal |
· The status of studies of potential environmental impacts of the mining and processing operation. Details of waste rock characterisation and the consideration of potential sites, status of design options considered and, where applicable, the status of approvals for process residue storage and waste dumps should be reported. |
· This subsection summarizes the environmental baseline, permitting pathway, water and energy management strategy, and community engagement framework for the Laguna Verde Project. Baseline investigations are ongoing to support submission of an Environmental Impact Assessment (EIA) currently targeted for 2026-2027, subject to CEOL timing. · The environmental and social assessment is aligned with Chilean regulatory requirements and reflects the Project's development stage at Pre-Feasibility Study (PFS) level. · The Project strategy is based on adsorption-based Direct Lithium Extraction (DLE), which differs materially from conventional solar evaporation pond operations. Key environmental design features include: • No evaporation ponds; • Reinjection of depleted brine into the aquifer; • Extraction of lithium directly from unconcentrated brine; • Higher lithium recovery relative to evaporation methods. · Baseline environmental studies have been underway since mid-2022 and will continue through the EIA phase. A formal partnership agreement with nearby Indigenous communities (December 2024) supports baseline work and EIA participation through a joint working group. · Baseline data integrates: • MYMA site-specific environmental studies (2022-2023); • Review of historical reports; • Public datasets and desk-based research. · Further seasonal baseline campaigns are planned beginning Q2 2026 as part of the EIA submission process. · The Project will be submitted to Chile's EIA system (Law 19,300) prior to exploitation and processing within the CEOL polygon. · EIA schedule is dependent on CEOL grant. Typical timelines after CEOL is granted are: • ~12 months for EIA preparation; • ≥18 months for regulatory processing. · The Company will measure, monitor and mitigate against key environmental metrics and ensure that project development, production, and project closure meet the required standards and regulations. |
|
Infrastructure |
· The existence of appropriate infrastructure: availability of land for plant development, power, water, transportation (particularly for bulk commodities), labour, accommodation; or the ease with which the infrastructure can be provided, or accessed. |
· Areas for the locating of plant and associated infrastructure have been appropriately studied at the project site, where the Lithium Chloride plant is planned to be located, and in the regional mining centre of Copiapó, where the Lithium carbonate plant is planned to be located · The project site is connected to Copiapó via a paved highway providing a well-established transport route between the projects two key infrastructure sites · Power and water supply options have been studied in detail and assessed at a PFS level · Infrastructure for storage of bulk commodities and the provision of suitable labour and accommodation, have been assessed at a PFS level, with the project benefiting from locating the carbonation plant, which forms approximately 70% of the operations labour requirement, in Copiapó which has an established skilled workforce |
|
Costs |
· The derivation of, or assumptions made, regarding projected capital costs in the study. · The methodology used to estimate operating costs. · Allowances made for the content of deleterious elements. · The source of exchange rates used in the study. · Derivation of transportation charges. · The basis for forecasting or source of treatment and refining charges, penalties for failure to meet specification, etc. · The allowances made for royalties payable, both Government and private. |
· The capital cost estimate has been prepared to support a Pre-Feasibility Study (PFS) for the Laguna Verde Project, with an effective date of 1 March 2026. The estimate has been developed to align with the disclosure expectations of the JORC Code (2012 Edition) and, where applicable, NI 43-101 style reporting structure, while maintaining consistency with international cost estimation standards. · The estimate includes: • Direct costs (equipment supply, construction and installation labour, bulk materials, construction equipment, and contractor overhead and profit); • Indirect costs (engineering, procurement and construction management support, temporary facilities, commissioning support and related services); • Owner's costs; and • Contingency appropriate to a PFS-level estimate. · Costs explicitly excluded from the estimate include financing costs, interest during construction, escalation beyond the pricing basis, closure and rehabilitation costs, sustaining capital, and foreign exchange impacts. The estimate has been prepared on a full equity basis. · The capital estimate corresponds to an AACE Class 4 level of definition, consistent with a PFS. The expected accuracy range is approximately -30% to +45%, reflecting the current level of engineering maturity. Pricing is based on Q4 2025 US dollar values in constant terms, with no escalation applied. · The operating cost estimate has been prepared at Pre-Feasibility Study (PFS) level, primarily based on Worley's OPEX Report. The estimate integrates process definitions, mass balances, and reagent and consumable consumption data provided by CTL and Lanshen, combined with Worley's cost databases and prevailing Chilean and international pricing for labour, energy, reagents, consumables and logistics. · The operating model assumes steady-state production of 15,000 tonnes per annum (tpa) of battery-grade Li₂CO₃, with continuous operation across both the Laguna Verde salar facilities and the Copiapó lithium carbonate plant. The basis assumes approximately 8,000 operating hours per year. · The estimate excludes escalation, financing costs, corporate overhead beyond the Project General Manager level, technology licensing fees, and government royalties (which are incorporated separately in the economic model). · Operating costs are classified into direct and indirect components, consistent with Worley's PFS methodology. |
|
Revenue factors |
· The derivation of, or assumptions made regarding revenue factors including head grade, metal or commodity price(s) exchange rates, transportation and treatment charges, penalties, net smelter returns, etc. · The derivation of assumptions made of metal or commodity price(s), for the principal metals, minerals and co-products. |
· Revenues are generated from the sale of lithium carbonate products and are calculated based on the applicable pricing assumptions and annual production volumes. Revenue projections reflect the product mix during the ramp-up period and steady-state operations and apply constant real pricing assumptions over the Project life. · The information regarding lithium market research was provided to CleanTech Lithium by Benchmark Minerals Intelligence (Benchmark) in a report dated July 2025. · For long-term lithium carbonate price forecast used in the project's financial modelling more up to date information is used based on forecasts from Canaccord Genuity provided in November 2025. · Based on data current as of November 2025, Canaccord forecast a long-term lithium carbonate price of US$22,500 per tonne of battery grade lithium from 2030 onwards. This price forecast was used for determining the forecast revenues in the project economic modelling with sensitivities being run around this of +/- 20%. · As the Canaccord projection extends only to 2030, prices have been assumed to remain constant, in real terms, at the 2030 level for the remainder of the evaluation period. · Prices are treated as real, constant-dollar values and are applied consistently throughout the life of the project. · During the production ramp-up period, a portion of product is assumed to be sold as technical-grade lithium carbonate, with the balance sold as battery-grade material. The former commands a slightly lower price in the international market. Once steady-state production is achieved, the product mix stabilizes at 100% battery grade. |
|
Market assessment |
· The demand, supply and stock situation for the particular commodity, consumption trends and factors likely to affect supply and demand into the future. · A customer and competitor analysis along with the identification of likely market windows for the product. · Price and volume forecasts and the basis for these forecasts. · For industrial minerals the customer specification, testing and acceptance requirements prior to a supply contract. |
· Lithium is a specialty chemical product that is central to the energy transition. Lithium ion is the dominant battery cathode chemistry for electric vehicles and battery energy storage systems. Battery-quality lithium carbonate is not a fungible product; specifications vary by producer. Most buyers require rigorous qualification testing before accepting a new supplier. · The information regarding lithium market research was provided to CleanTech Lithium by Benchmark Minerals Intelligence (Benchmark) in a report dated July 2025. This included future supply and demand forecasts through to 2040. · For long-term price forecast used in the project's financial modelling more up to date information is used based on forecasts from Canaccord Genuity provided in November 2025. · Based on data current as of November 2025, Canaccord forecast a long-term lithium carbonate price of US$22,500 per tonne of battery grade lithium from 2030 onwards. This price forecast was used for determining the forecast revenues in the project economic modelling with sensitivities being run around this of +/- 120%. |
|
Economic |
· The inputs to the economic analysis to produce the net present value (NPV) in the study, the source and confidence of these economic inputs including estimated inflation, discount rate, etc. · NPV ranges and sensitivity to variations in the significant assumptions and inputs. |
· The economic analysis has been prepared in support of a Pre- Feasibility Study (PFS) completed in accordance with the JORC Code and written to be consistent with the disclosure requirements of NI 43-101. · The effective date of this economic analysis is March 1, 2026. · The evaluation is based on a discounted cash flow (DCF) model developed by Worley. Inputs to the model include capital and operating cost estimates summarized in Section 21, the production schedule derived from hydrogeological and process design work carried out by Montgomery, and long-term lithium carbonate pricing assumptions obtained from a Canaccord Genuity publication dated November 2025. The model produces annual cash flows from which Net Present Value (NPV), Internal Rate of Return (IRR), and payback period are calculated, on both a before-tax and after-tax basis. · An economic model was developed to estimate annual pre-tax and post-tax cash flows over the full evaluation period, comprising approximately two years of pre-production construction followed by 25 years of operations based on the current mine plan and production schedule. · The economic analysis has been prepared on a real (constant-dollar), non-escalated basis in 2026 United States dollars. No inflation escalation has been applied to costs or revenues. Capital and operating cost estimates were developed specifically for the Project and are expressed in constant 2026 US dollars. · Projected annual net cash flows are discounted at an 8% real discount rate to reflect the time value of money. The 8% real discount rate is considered appropriate for a project of this type and development stage, taking into account commodity exposure, technical considerations, jurisdictional setting, and overall project risk. · All Net Present Values (NPVs), including the primary economic indicator of NPV at an 8% real discount rate, are calculated as of the beginning of Project construction in 2029. Cash flows are discounted to this 2029 construction start date, which represents the commencement of capital deployment and project execution. NPVs at additional discount rates have also been calculated for reference and sensitivity purposes. · The analysis has been conducted on a 100% equity-funded (unlevered) basis. No debt financing, leverage, or financing costs have been included. All capital expenditures, including pre-production capital and working capital, are assumed to be funded by CTL equity. · The financial evaluation covers the period from the commencement of construction in 2029 through the end of the operating life supported by the defined production assumptions. · Post-tax cash flows incorporate applicable fiscal obligations and tax assumptions based on the current regulatory framework. Tax calculations are inherently subject to variability and may differ from actual outcomes during operations. Accordingly, post-tax results represent model-based estimates derived from currently available information. · For clarity, the cash flow analysis and reported economic results do not incorporate the potential impact of Chilean dividend withholding taxes that may apply in the event that distributable earnings are remitted to the Company's parent entity in the United Kingdom or other foreign jurisdictions. The economic model reflects project-level taxation within Chile only and does not consider shareholder-level taxation or cross-border tax effects. Any withholding taxes applicable upon distribution of dividends would be determined based on the prevailing Chilean tax regime and applicable international tax treaties at the time of distribution and are therefore outside the scope of this Project-level evaluation. |
|
Social |
· The status of agreements with key stakeholders and matters leading to social licence to operate. |
· On December 18, 2025, through Exempt Resolution No. 2826 of the Ministry of Mining, the publication of the administrative act entitled "Establishes internal procedure for the submission and processing of applications for Special Operating Contracts for the Exploration, Exploitation and Processing of Lithium (CEOL) in the Laguna Verde sector" (hereinafter, "Resolution No. 2826/2025") was ordered. This act establishes, among other requirements, the obligation to consider the existing registry of mining concessions, the number of concessions held by a given holder, and the area covered by said concessions with respect to the CEOL polygon, requiring for these purposes the maintenance of at least eighty percent (80%) or more of the preferred area. · The Company filed its application for the Laguna Verde CEOL on 29 December 2025, evidencing that it held well in excess of the 80% of the preferred CEOL polygon, and CleanTech Lithium was able to announce on 10 March 2026 that the terms for that CEOL had been agreed between the Company and the Chilean Mining Ministry. With a term of 40 years, the CEOL will start from the date on which the administrative act (the "Decree") issued by the Ministry of Mining approving the CEOL has been reviewed and approved by the Comptroller General's Office. Consistent with all other decrees in Chile, a final review is required by the Comptroller to ensure the Decree complies with the Constitution and laws of Chile. CleanTech Lithium anticipates ratification will take place in Q2 2026. · CleanTech Lithium is committed to respect the rights of indigenous peoples and will protect those rights. In this sense, the Company has designed an early engagement process that aims to manage its social and environmental impact in a participatory manner, emphasizing the need and commitment to promote community participation in proactive and timely information about the Project in all its phases and decision making. · The Company will ensure that information is accessible to all and that participation channels are appropriate and designed in conjunction with the community. This recognizes the value of the community's knowledge and leadership, traditions and history in the territory. · This commitment will establish a permanent, proactive, transparent and open dialogue that will guide free, prior and informed consultation and participation. Early conversations about protocols, involvement, impacts, investments, social employment, follow-up of initiatives, etc., can make the difference between generating dependence and promoting autonomy and acceptance of the Project. · This is evidenced by the multiple engagement activities the Company has undertaken to involve community members, such as organizing visits to the DLE pilot plant, drilling campaigns and numerous consultation meetings. · Guided by international standards, the Company takes an approach that adopts free, prior and informed consent before project activities. CTL is also a signatory of the UN Global Compact and adheres to the 10 guiding principles · The Company also has an agreement with the local university to support students in their academic development by loaning equipment for research projects and fostering a culture of collaboration. |
|
Other |
· To the extent relevant, the impact of the following on the project and/or on the estimation and classification of the Ore Reserves: · Any identified material naturally occurring risks. · The status of material legal agreements and marketing arrangements. · The status of governmental agreements and approvals critical to the viability of the project, such as mineral tenement status, and government and statutory approvals. There must be reasonable grounds to expect that all necessary Government approvals will be received within the timeframes anticipated in the Pre-Feasibility or Feasibility study. Highlight and discuss the materiality of any unresolved matter that is dependent on a third party on which extraction of the reserve is contingent. |
· The Company filed its application for the Laguna Verde CEOL on 29 December 2025, evidencing that it held well in excess of the 80% of the preferred CEOL polygon, and CleanTech Lithium was able to announce on 10 March 2026 that the terms for that CEOL had been agreed between the Company and the Chilean Mining Ministry. With a term of 40 years, the CEOL will start from the date on which the administrative act (the "Decree") issued by the Ministry of Mining approving the CEOL has been reviewed and approved by the Comptroller General's Office. Consistent with all other decrees in Chile, a final review is required by the Comptroller to ensure the Decree complies with the Constitution and laws of Chile. CleanTech Lithium anticipates ratification will take place in Q2 2026. · The Company does not have any marketing arrangements at present and will look to establish such arrangements in future. · Water use is governed by Chile's Water Code. Groundwater abstraction requires authorization from the General Water Directorate (DGA). Freshwater permitting and the purchase of water rights from third parties are being explored, and some water supply alternatives will depend on the CEOL award. The Project may also source operational water from wells located at the edge of the salar, incorporating reuse, recycling, and reinjection strategies to minimize net freshwater consumption. · The Project will require submission to Chile's Environmental Impact Assessment System (SEIA) and approval of a Resolution of Environmental Qualification (RCA) prior to construction. · The Project is not located within SNASPE protected areas but lies within a Zone of Tourist Interest (ZOIT). Exploration activities have been designed to minimize impacts. · Lithium production and commercialization require authorization from CCHEN following CEOL grant. Once the CEOL is ratified, the Company intends to apply for the regulatory license to produce, market and export lithium products from the Laguna Verde Salar, following the JORC resource estimate of 312,000 tonnes of Lithium Carbonate Equivalent (LCE) in the Measured category, which excludes the surface resource, and 445,000 tonnes of LCE in the Indicated category. The extension of the CCHEN license to produce the indicated initial quantity of LCE will be for a period in years that the entity estimates. |
|
Classification |
· The basis for the classification of the Ore Reserves into varying confidence categories. · Whether the result appropriately reflects the Competent Person's view of the deposit. · The proportion of Probable Ore Reserves that have been derived from Measured Mineral Resources (if any). |
· The Mineral Reserve was classified by the Competent Person (CP) based on industry standards, potential future factors that could affect the estimation, and the confidence of the model predictions. The CP classified all mineral reserves as Probable Reserves for the following reasons: o The Special Operating Contract for Lithium (Spanish abbreviation: CEOL) required for lithium production in Chile has not yet been fully granted to CleanTech. o Only one long-term pumping test has been conducted to date (LV06). Additional long-term testing will aid in understanding the feasibility of longer pumping durations in other areas of CleanTech's mine concessions and it will also improve the numerical model calibration. Additional brine sampling is required from long-term pumping tests to understand potential differences between previous depth-specific sampling. o Reinjection testing in the field has not yet occurred, and it is uncertain if there will be environmental restrictions related to spent brine reinjection in Laguna Verde. o Freshwater permitting and the purchase of water rights from third parties are being explored, and some water supply alternatives will depend on the CEOL award. Expected average freshwater demand for the processing plant is approximately 5.6 L/s for full-scale production. As of the effective date of the reserve estimate, freshwater pumping has not been simulated in the numerical model. o The current study level is Pre-Feasibility, with preliminary options related to the mine design, mineral processing, and permitting (CRIRSCO, 2019). A future update at the Feasibility level will include a more confident mine plan and schedule, confident management of spent brine, as well as optimized mineral processing. · Despite uncertainties, in the opinion of the CP, each phase was conducted in a logical manner, and results are supportable for Probable Reserves at the current study level. · Most projected production wells were placed and screened in Measured Resource zones; thus a majority of the extracted brine is sourced from Measured Mineral Resources. |
|
Audits or reviews |
· The results of any audits or reviews of Ore Reserve estimates. |
· No audits of the Ore Reserve estimate have been undertaken to date. |
|
Discussion of relative accuracy/ confidence |
· Where appropriate a statement of the relative accuracy and confidence level in the Ore Reserve estimate using an approach or procedure deemed appropriate by the Competent Person. For example, the application of statistical or geostatistical procedures to quantify the relative accuracy of the reserve within stated confidence limits, or, if such an approach is not deemed appropriate, a qualitative discussion of the factors which could affect the relative accuracy and confidence of the estimate. · The statement should specify whether it relates to global or local estimates, and, if local, state the relevant tonnages, which should be relevant to technical and economic evaluation. Documentation should include assumptions made and the procedures used. · Accuracy and confidence discussions should extend to specific discussions of any applied Modifying Factors that may have a material impact on Ore Reserve viability, or for which there are remaining areas of uncertainty at the current study stage. · It is recognised that this may not be possible or appropriate in all circumstances. These statements of relative accuracy and confidence of the estimate should be compared with production data, where available. |
· The reserve estimate could be affected by the following sources of uncertainty: o Assumptions regarding assignment of aquifer parameters where empirical data does not exist. o The lack of a long-term pumping test in the western portion of the project concessions to strengthen the model calibration and projections in that area. o Differences between measured and simulated lithium concentrations during the LV05 and LV06 pumping tests; regardless, depth-specific brine sample results (Fedderson, 2023) are consistent with the simulated extracted concentrations, and differences could be resolved with additional sampling and analysis. o The linear fit between TDS and water density, and extrapolation outside of the measured data. o The numerical model grid discretization, which could affect transport results. · Despite these sources of uncertainty, a steady-state and transient calibration was conducted with the current data to support a Probable Reserve estimate at the current study level. Future calibration efforts and numerical model improvements will strengthen subsequent projections. · No production data is available yet for comparison. |