
17 January 2023
Ramsdens Holdings PLC
("Ramsdens", the "Group", the "Company")
Annual Results for the year ended 30 September 2022
Excellent recovery post pandemic
Ramsdens, the diversified financial services provider and retailer, today announces its Annual Results for the year ended 30 September 2022 (the "Period").
The financial results for FY22 are significantly ahead of FY21 as the Group recovers from the impact of the Covid-19 pandemic.
|
FY22 |
FY21 |
|
|
Revenue |
£66.1m |
£40.7m |
|
Gross Profit |
£38.2m |
£22.3m |
|
Profit before tax |
£8.3m |
£0.6m |
|
Net Assets |
£41.8m |
£36.1m |
|
EPS |
20.9p |
1.2p |
|
Final dividend |
6.3p |
1.2p |
|
Full year dividend |
9.0p |
1.2p |
Highlights:
· FY22 profit for the Group has been driven primarily by the strong recovery in foreign currency gross profit to £12.6m (FY21: 3.3m) as international travel returned to a reasonable level.
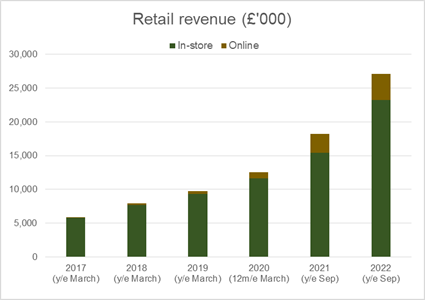
· Revenue generated by the Group's jewellery retail segment increased by almost 50% to £27.1m (FY21: 18.3m), supported by strategic investments in stock, merchandising and the website.
· Demand for the Group's pawnbroking loans grew during the year as a result of customer spending habits returning to normal following the easing of restrictions related to Covid-19 and fewer alternative options for small sum short term credit being available. As at 30 September 2022, the loan book had increased by over 40% to 8.6m (FY21: 6.1m).
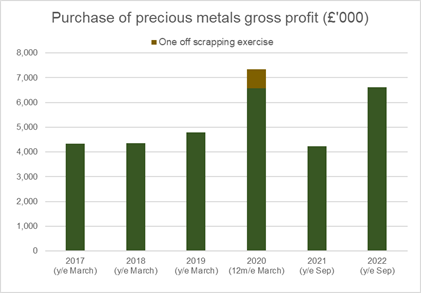
· Precious metal buying volumes increased throughout the summer, aided by the high gold price and increased footfall. Revenue across this segment increased more than 50% to approximately £16.0m (FY21: £10.3m).
· The Board has recommended a final dividend of 6.3p per share for approval at the forthcoming AGM taking the total dividend for the Period to 9.0p per share (FY21: 1.2p), representing a return to the Group's progressive dividend policy.
Current Trading:
The Board is pleased to provide an update on Q1 FY23 trading (October to December 2022).
· Jewellery retail gross profit increased by over 15% primarily as a result of strong premium watch sales both instore and online.
· Q1 volumes of foreign currency exchange remained at approximately 70% of pre pandemic levels.
· The pawnbroking loan book has grown further from the year-end balance of £8.6m to £9.1m.
· The purchase of precious metal volumes and our other services have continued to perform in line with expectations.
· Following the year end, new stores have been opened in Bootle, Basildon, Croydon and a second store in Bradford, taking the store estate to 158 stores (including two franchised stores).
Peter Kenyon, Chief Executive, commented:
"Ramsdens delivered a very strong performance in FY22, once again reflecting the strength of our diversified income streams. The strong rebound in our foreign currency exchange volumes, coupled with increased demand for our excellent quality and value for money jewellery, has enabled the Group to deliver significantly increased profitability.
This momentum continued through Q1, with strong jewellery sales during December driven by continued consumer demand for premium watches.
Our team of committed staff have once again been central to our success. They continue to deliver outstanding service to our growing customer base, for which I am hugely grateful, and I would like to take this opportunity to publicly thank them all for their commitment. We continue to invest in attracting, retaining and rewarding our staff as we develop what I believe to be the best team in the industry.
While fully aware of the economic challenges that lie ahead, with our trusted brand and proven, well invested and diversified business model, I remain very optimistic about Ramsdens' future prospects."
Availability of Report and Accounts
The Company confirms that the Annual Report and Financial Statements for the year ended 30 September 2022, together with notice of the Company's 2022 annual general meeting, will be published and posted to shareholders shortly and will be available to view on the Company's investor relations website: https://www.ramsdensplc.com/investor-relations/reports-and-presentations , in accordance with AIM Rule 20.
The information contained within this announcement is deemed by the Group to constitute inside information as stipulated under the Market Abuse Regulation (EU) No. 596/2014 as amended by The Market Abuse (Amendment) (EU Exit) Regulations 2019. The person responsible for making this announcement on behalf of the Company is Peter Kenyon.
ENDS
Enquiries:
Ramsdens Holdings PLC Tel: +44 (0) 1642 579957
Peter Kenyon, CEO
Martin Clyburn, CFO
Liberum Capital Limited (Nominated Adviser) Tel: +44 (0) 20 3100 2000
Richard Crawley
Lauren Kettle
Hudson Sandler (Financial PR) Tel: +44 (0) 20 7796 4133
Alex Brennan
Emily Brooker
About Ramsdens
Ramsdens is a growing, diversified, financial services provider and retailer, operating in the four core business segments of foreign currency exchange, pawnbroking loans, precious metals buying and selling and retailing of second-hand and new jewellery. Ramsdens does not offer unsecured high-cost short term credit.
Headquartered in Middlesbrough, the Group operates from 158 stores within the UK (including 2 franchised stores) and has a growing online presence.
Ramsdens is FCA authorised for its pawnbroking and credit broking activities.
CHAIRMAN'S STATEMENT
I had every confidence that Ramsdens, underpinned by the strength of its diversified business model and value-for-money proposition, would emerge from the Covid-19 pandemic well-positioned for continued growth. I am pleased to say this is the position we are now in.
This Annual Report covers the 12-month period to 30 September 2022 (FY22).
The financial results for FY22 are significantly ahead of FY21 as the latter were severely impacted by retail closures and reduced international travel resulting from the pandemic.
FY22 brought the challenges of the Covid-19 Omicron variant in H1, which impacted retail, particularly in the weeks prior to Christmas 2021, and also caused disruption to international travel. While these challenges eased in H2, the trading conditions did not return to those seen prior to the onset of the pandemic. Despite these challenges, I am pleased to report that the Group has had an excellent recovery.
FINANCIAL RESULTS & DIVIDEND
The below table highlights the financial results:
|
£000's |
FY22 |
FY21 |
|
Revenue |
£66,101 |
£40,677 |
|
Gross Profit |
£38,219 |
£22,262 |
|
Profit Before Tax |
£8,269 |
£564 |
|
Net Assets |
£41,843 |
£36,143 |
|
Net Cash* |
£8,835 |
£13,032 |
|
EPS |
20.9p |
1.2p |
|
Final dividend |
6.3p |
1.2p |
|
Full year dividend |
9.0p |
1.2p |
*cash minus bank borrowings
The Group achieved revenue of £66.1m (FY21: £40.7m) and Profit Before Tax of £8.3m (FY21: £0.6m). The Strategic Report and Financial Review that follow provide a more in-depth analysis of the Group's trading performance and financial results.
The Board has recommended a final dividend of 6.3p (FY21: 1.2p) for approval at the forthcoming AGM. The full year dividend, of 9.0p (FY21: 1.2p) assuming approval at the AGM, would represent 43% of the earnings per share. This payment recommences the Group's progressive dividend policy of paying approximately 50% of post-tax profits to shareholders, always subject to executing on the Group's growth opportunities. Subject to approval at the AGM, the final dividend is expected to be paid on 10 March 2023 for those shareholders on the register on 3 February 2023. The ex-dividend date will be 2 February 2023.
LOOKING AHEAD
The Board believes Ramsdens' diversified income streams provide defensive qualities against the macroeconomic challenges that lie ahead. The uncertainty caused by energy cost increases, general inflationary pressures and higher interest rates will prove a challenge to many businesses, and Ramsdens is no different.
However, we also see opportunities. We would hope that after three years of disruption to summer holidays, 2023 may see the level of holidays taken by consumers return to 2019 levels, although it is always possible that economic conditions may delay that.
Tougher economic conditions will no doubt lead to increased and sometimes unexpected bills for our customers. As an asset-backed loan, pawnbroking provides a solution to an immediate borrowing need and allows customers six months to repay their loans or to make longer term financial arrangements. We have seen the continued demand for this simple solution as the Ramsdens pawnbroking loan book finished the year end at a record high. Due to global economic uncertainty, the gold price is also expected to remain higher than long term averages, which will benefit both our pawnbroking and precious metals buying business segments. While there is greater uncertainty for the outlook on retail, as jewellery is often a discretionary spend, Ramsdens has been investing heavily in upskilling staff, building appropriate stock levels, stock presentation and replenishment systems and it is expected that the significant momentum we have seen during FY22 will support a continued strong performance in FY23.
Of course, the Group is not immune from rising costs. While energy prices for the vast majority of our stores are fixed until February 2024, stores opened since February 2021 are not part of that contract and have been subject to higher energy costs. The biggest cost to the business is also our most important asset: our people. We have a duty to look after our people and, in addition to professional development initiatives, opportunities for career progression and welfare programmes, we also want to reward our staff well. In addition to a one off 'thank you' bonus, our January 2023 pay review will again ensure that our staff are paid at least the Real Living Wage with the potential to earn more through attractive bonus schemes.
I am extremely proud of the Ramsdens team's skills and their continued commitment to our customers and the communities in which we operate. I would personally like to thank each and every one of my colleagues for their continued dedication.
During the year, Steve Smith took the decision to retire from Ramsdens prior to the 2023 AGM. The Nominations Committee undertook a recruitment process and I am pleased to report that Karen Ingham joined the Board on 1 November 2022. I would like to thank Steve for his contribution to Ramsdens and wish him all the best for the future and welcome Karen to our board.
Andrew Meehan
Non-Executive Chairman
16 January 2023
CHIEF EXECUTIVE'S REVIEW
Despite the challenges faced during the year, I am pleased that our diversified income streams have performed extremely well to deliver strong annual profits, in line with those achieved prior to the onset of the pandemic.
We started the year with optimism. We knew consumers had saved significant sums and paid down debts through the pandemic and that as restrictions were removed, normalised spending habits would resume, and as a result there would be a greater need to borrow. The Covid-19 Omicron variant slowed down the return to more normalised trading conditions until after Christmas 2021. In early 2022, we saw the end of the red and green 'traffic light' destination lists and constraints on international travel reduced, most notably the uncertainty of a pre-departure Covid-19 test. However, it soon became clear that many airlines and airports were unable to manage the increased volume of consumers travelling during peak holiday months which led to a reduced number of international flights. As a result, our opportunity to sell foreign currency was more limited than we initially expected.
The war in Ukraine and the resulting energy crisis combined with other inflationary pressures has impacted on both our business and customers. However, the Group has fixed energy pricing across the majority of its estate until February 2024 which provides mitigation in the short term.
Our staff have once again delivered outstanding service to our growing customer base during the year for which I'm hugely grateful. I would like to take this opportunity to publicly thank them all for their commitment. We continue to invest in attracting, retaining and rewarding our staff as we develop what I believe to be the best team in the industry.
I remain very optimistic for the future of Ramsdens given our diversified income streams, robust business model and strong balance sheet.
BUSINESS REVIEW
Despite the external challenges faced during recent period, the Group has remained committed to its growth strategy.
Our continuous improvement ethos has led to the core store estate delivering growth across all income streams and gives us momentum as we move forward. Within the core estate, we have relocated four stores, namely Carlisle, Kilmarnock, Newcastle and Manchester. We opened new stores in Bolton and Glasgow and successfully expanded into the South East of England with a new store opening in Chatham. We acquired a further store on the South coast at Boscombe. All of the new stores and relocations have performed well.
Two stores have been closed and merged locally in line with our approach of regularly appraising individual store performance, new opportunities and return on investment, and we ended the financial year with 152 stores and two franchised locations.
Our online activities continue to grow. We commenced a project to refresh the retail jewellery website to improve the search facility for customers and for organic reach. The refreshed website went live in Q1 FY23. In H1 2023, we will have individual websites for our four key income streams, further improving the online customer journey.
During the year we acquired the freehold of our head office premises. This will allow us to expand this bespoke building to support our long-term growth plans as well as introduce a greener energy solution.
The performance of each of the Group's key income streams is discussed in greater detail below.
OUR DIVERSIFIED BUSINESS MODEL: PRODUCT OFFERING
Ramsdens operates in the four core business segments of: foreign currency exchange; pawnbroking ; jewellery retail; and purchase of precious metals.
Foreign Currency Exchange
The foreign currency exchange (FX) segment primarily comprises the sale and purchase of foreign currency notes to holidaymakers. Ramsdens also offers international bank-to-bank payments through a third-party arrangement.
|
FY22 |
FY21 |
|
|
Total Currency exchanged |
£364m |
£77m |
|
Gross profit |
£12.7m |
£3.3m |
|
Online click and collect orders |
£38.7m |
£6.9m |
|
Percentage of FX online |
11% |
9% |
|
Percentage of Group gross profit |
33% |
15% |
October 2021 volumes were approximately 30% of pre-pandemic levels, rising to over 80% in May 2022 before settling through the summer at circa 70% of pre-pandemic levels.
During this period of supressed volumes, the industry has widened margins, and Ramsdens has benefited from this while still offering attractive and competitive exchange rates to our customers. The overall margin achieved on all foreign currency exchanged was 3.5%, down from 4.2% due to the changes in mix of foreign currency sales and purchases.
The average foreign currency sale transaction value (ATV) was £469, an increase on the pre pandemic level of £401. We continue to have confidence that UK travellers will continue to take cash abroad for both convenience and to assist with budgeting whilst on holiday.
In line with our multi-channel strategy, the Group is refreshing its currency travel card proposition with a new multi-currency card due to be launched in 2023.
International payments income continues to be relatively small in comparison to total foreign currency commission but we have a loyal repeat customer base using the service.
We strongly believe that customers' desire to go on holiday abroad remains high, especially after three summers of disruption. We are optimistic that more holiday makers will travel during summer 2023 than did during 2022, and that numbers may return to 2019 levels. However, it is also possible that economic conditions may delay the return to pre-pandemic levels.
Pawnbroking
Pawnbroking is a small subset of the consumer credit market in the UK and a simple form of asset backed lending dating back to the foundations of banking. In a pawnbroking transaction an item of value, known as a pledge, (in Ramsdens' case, jewellery and watches), is held by the pawnbroker as security against a six-month loan. Customers who repay the capital sum borrowed plus interest receive their pledged item back. If a customer fails to repay the loan, the pawnbroker sells the pledged item to repay the amount owed and returns any surplus funds to the customer. Pawnbroking is regulated by the FCA in the UK and Ramsdens is fully FCA authorised.
|
000's |
FY22 |
FY21 |
|
Gross profit |
£7,533 |
£6,678 |
|
Total loan book* (capital value) |
£8,648 |
£6,137 |
|
Past due (capital value) |
£721 |
£536 |
|
In date loan book* (capital value) |
£7,927 |
£5,601 |
|
Percentage of Group gross profit |
20% |
30% |
*excludes loans in the course of realisation
As Covid-19 restrictions eased, as expected, consumers started to spend more which resulted in an increase in some customers' short-term requirements for financial assistance. This occurred across both mainstream consumer credit, such as credit cards where card balances increased in the last 12 months, as well as across the consumer base using a pawnbroker. At the same time, the number of small sum short term credit providers in the market reduced. As a consequence, demand for pawnbroking loans has increased and the loan book at the year-end was at a record high of £8.6m (FY21 £6.1m).
The average loan value as at 30 September 2022 was £303, up from £264 as at 30 September 2021. Our lending remains conservative in line with our long-term policy.
We predict that increased energy bills, high inflation and higher interest rates will squeeze household incomes in FY23 leading to an increased demand for consumer borrowing. If consumers have assets to pledge, pawnbroking can provide a short-term solution and therefore our loan book is expected to increase during FY23.
Jewellery Retail
The Group offers new and second-hand jewellery, including premium watches, for sale. The Board continues to believe there is significant growth potential in this segment by leveraging Ramsdens' retail store estate and ecommerce operations. The Group aims to cross-sell its retail proposition to existing customers of the Group's other services as well as attracting new customers.
The retailing of new jewellery products complements the Group's second-hand offering to give our customers greater choice in breadth of products and price points. In addition, new jewellery retailing enables the Group to attract customers who prefer not to buy second-hand.
|
000's |
FY22 |
FY21 |
|
Revenue |
£27,107 |
£18,252 |
|
Gross Profit |
£10,263 |
£6,965 |
|
Margin % |
38% |
38% |
|
Jewellery retail stock |
£19,683 |
£13,979 |
|
Online sales |
£3,904 |
£2,822 |
|
Percentage of sales online |
14% |
15% |
|
Percentage of Group gross profit |
27% |
31% |
The Group's retail performance is at a record high and continues to perform well following investments in stock levels, stock presentation, replenishment systems, staff training and our retail website over recent years.
Retail revenue is now approximately equally spread across three key categories of premium watches, new jewellery and preowned jewellery. Margins by product category have remained consistent as has the overall gross margin as all product categories have performed well.
Online growth remains strong with revenue increasing to £3.9m, up 38% for the year. Online sales represented 14% of all jewellery items sold.
As well as a profitable sales channel, the jewellery website also serves as a catalogue for our branches, assisting our staff with serving customers where stock choice in a branch may be limited. For example, our top watch sales branches have circa 60 watches in store but there are now over 1,800 watches available on our website for customers to browse, choose from and buy.
We believe there is an ongoing opportunity, instore and online, across our product categories, to develop and grow our jewellery retail business.
Purchase of precious metals
Through our precious metals buying and selling service, Ramsdens buys unwanted jewellery, gold and other precious metals from customers. Typically, a customer brings unwanted jewellery into a Ramsdens store and a price is agreed with the customer depending upon the retail potential, weight or carat of the jewellery. Ramsdens has various second-hand dealer licences and other permissions and adheres to the Police approved "gold standard" for buying precious metals.
Once jewellery has been bought from the customer, the Group's dedicated jewellery department decides whether or not to retail the item through the store network or online. Income derived from jewellery, which is purchased and then retailed, is reflected in jewellery retail income and profits. If the items are not retailed, they are smelted and sold to a bullion dealer for their intrinsic value and the proceeds are reflected in the Group's accounts as precious metals buying income.
|
000's |
FY22 |
FY21 |
|
Revenue |
£15,847 |
£10,369 |
|
Gross Profit |
£6,626 |
£4,240 |
|
Percentage of Group gross profit |
17% |
19% |
The Sterling price for 9ct gold has remained high in comparison to long run averages, at an average of £17.15 per gram during the year (FY21: £16.05).
While in the first half of the year the weight of gold purchased was subdued in line with reduced footfall, during the second half year, the weight purchased has returned to pre-pandemic levels.
Given the wider global political and economic situation, we believe the gold price will remain high in the short to medium term, supporting the Group's margins.
Other services
In addition to the four core business segments, the Group also provides additional services in cheque cashing, Western Union money transfer, credit broking and receives franchise fees.
|
000's |
FY22 |
FY21 |
|
Revenue |
£1,114 |
£1,122 |
|
Gross Profit |
£1,114 |
£1,122 |
|
Percentage of Group gross profit |
3% |
5% |
This remains a steady source of income albeit we believe that cheque cashing will continue to decline over the medium term.
STRATEGY
Following an extensive review, the Board believes that its existing strategy, communicated over the last few years, remains the right course for growing our business and delivering value for all our stakeholders in a sustainable manner. Our staff and their development are a core component of achieving our aims.
We continue to concentrate on:
1. Improving the performance of our existing store estate
2. Expanding the Ramsdens branch footprint in the UK
3. Developing our online proposition
4. Appraising market opportunities presented by operating in challenging markets.
5. Focusing on sustainability through our ESG policies
1. Improving the performance of the existing store estate
All income segments have shown significant growth over FY21 levels, as the Group has recovered from the pandemic restrictions.
The strategic focus we have placed on attracting new customers and driving a higher wallet share from our repeat customers has led to a record pawnbroking loan book and record jewellery retail revenue. Our focus remains the same across the existing store estate.
Our costs are well controlled, with our largest cost being our staff. We fully understand the important role our staff play in achieving our strategic objectives and as a result we have budgeted for a positive pay review which has been brought forward to January 2023 from April. We are committed to ensuring that our staff remain not only productive but also feel rewarded in their careers at Ramsdens.
Rents continue to be negotiated downwards where there is an opportunity to do so, balanced with a desire for flexibility with lease expiry and break dates, especially if the town has some demographic challenges. In recognising this high street challenge, where the return on capital justifies a relocation, we will actively move a store to improve our footfall-reliant services of foreign currency exchange and jewellery retail while potentially reducing operating costs at the same time.
We believe our store estate performance is complemented by a strong online proposition. By investing in our retail jewellery website in recent years we have improved each store's access to a wider range of jewellery which has improved customer service levels and resulted in increased in-store sales.
In addition, we continually aim to improve the performance of our key income streams:
Foreign currency:
· The three key drivers for foreign currency remain trust, convenience and price. Having available stock and transparent pricing continues to build trust among consumers.
· By having branches conveniently located on high streets and in shopping centres, we will continue to attract consumers wanting foreign exchange services.
· By having competitive exchange rates, we will attract new and retain existing customers whilst continuing to manage margins closely, with due regard to local market conditions.
· By improving the frequency of contact we have with our foreign currency customers, we will stay in our customers' thoughts when they next need foreign currency.
· By developing a market-leading multi-currency travel card, we will seek to capture more of the customer's holiday spend while abroad.
Pawnbroking:
· We have fully embraced the FCAs New Consumer Duty initiative. We have always had the consumer at the heart of what we do and this has been demonstrated by our loyal customer base. We will continue doing what we believe are the right things for our customers - this includes reducing interest rates for customers needing longer to pay and, if a customer defaults, by continuing to obtain the best price possible for them by selling by private treaty and not using an auction process which we believe disadvantages customers.
· We will continue to have prudent lending policies while examining opportunities to lend more when the customer's borrowing history suggests greater capacity to repay and where the pledged assets are more desirable and readily saleable. Our improvement in our retail jewellery operations gives the Group confidence that it is able to lend more on higher value jewellery items.
· We will continue to build upon the trust and high repeat customer volumes earned by giving a great service and grow the customer base through word-of-mouth recommendation.
Jewellery retail:
· Stock levels have significantly increased over the last 18 months. This has been a deliberate strategy to give our customers more choice in-store and online and enable improved replenishment capabilities. This investment continues with the benefit of lessons learned during recent years and with the belief there is room for further improvement across both jewellery and premium watches.
· We are continuing to work on the display of our products to create more customer appeal as well as continuing to invest in our retail website which also acts as a stock catalogue for our branches to facilitate further in store sales.
·
Where appropriate, we will relocate to higher footfall locations to improve the jewellery offer with larger window display areas, often at similar rents to current locations.
Purchase of precious metals:
·
We are increasing the awareness amongst our existing customer base, primarily foreign currency exchange customers who are unaware of the service or the value held in damaged or simply unwanted or unworn jewellery.
2. Expanding the branch footprint in the UK
The Group has a successful branch-based model. With diversified income streams, stores generate a good return on capital while leveraging the head office cost base. We have successful stores in small towns and large cities which gives us confidence that we can be successful on most high streets that have a nucleus of returning shoppers.
As at 30 September 2022, we had 152 stores plus two franchised stores.
During the year, we opened three greenfield sites and acquired a pawnbroker in Boscombe. We closed stores in Middlesbrough (secondary foreign currency kiosk) and Ripon; both of these stores were merged with other local Ramsdens stores.
The year also saw the first new store opened in the South East of England in Chatham, Kent. This store has had a good first year, well ahead of expectations, and we plan to open up to another seven stores in the South East in FY23.
Overall, we have targeted 12 locations to open in FY23. In Q1, we have now opened stores in Bootle in the North West, a second store in Bradford in Yorkshire, and Basildon in Essex. . In Q2 we have stores scheduled to open in Croydon in Greater London, Maidstone in Kent and additional stores in Yorkshire and the North West of England.
3. Developing our online proposition
Jewellery retail website
We continue to make good progress with the online sales of jewellery items. Sales have increased to £3.9m, up 38% from £2.8m in FY21. This performance excludes jewellery sales in branches which used the in-store digital facility to access the website as a catalogue of stock.
As part of our ongoing review of performance, the retail website was refreshed in Q1 FY23. This review improved the website layout and should significantly increase the success rates of our search and filter functions. Together with improved search engine visibility, investment in pay per click advertising, social media and affiliate advertising, use of differing payment options, improved photography and descriptions and learning from integrated AI, this should drive ongoing retail jewellery sales growth.
We see the development of our online retail jewellery website as complementary to our store estate and both will benefit as the store estate expands and the website generates increased brand recognition.
Website strategy - other key income streams
The ramsdensforcash website is currently being updated to create a portal to individual websites for each of our four key income streams.
Three new websites for foreign currency exchange, gold buying and pawnbroking will launch early in 2023 and will be supported by investment in search engine optimisation. By having this broadened online offering we hope to enhance our online channel revenues and profitability as well as support the performance of the branch estate in these segments.
4. Appraising opportunities presented by operating in challenging markets
The high street retail landscape has been challenging for a number of years. Following on from the impact of the pandemic, retailers are more likely to have higher debt burdens and now face increased energy costs and increased staff costs at a time when consumer income is being squeezed by high levels of inflation and increasing interest rates. This will impact some travel agents and jewellers who may leave the high street or indeed the market altogether, presenting opportunities for Ramsdens to attract new customers, takeover prime retail locations or acquire businesses.
Our estimate of the number of pawnbroking outlets in the UK remains at approximately 870 - operated by circa 130 pawnbroking businesses. The Ramsdens operating board are well networked within the industry and should a pawnbroking business come up for sale in the UK, we would expect to hear of it and then evaluate the opportunity against our target rate of return. This was evidenced by the purchase of Geo A Payne & Sons pawnbrokers in Boscombe in February 2022. This business has performed well and in line with expectations since acquisition.
While most pawnbrokers have seen increased lending levels in the last 12 months and have optimism for future lending given the macroeconomic conditions, the administration and cost burden of increased regulation may mean some participants seek to exit the industry, which may present further acquisition and expansion opportunities.
The South East has the highest concentration of pawnbroking outlets in the UK and presents a compelling expansion opportunity for the Group. Our continued expansion into the South East is aimed at creating a nucleus of Ramsdens stores that build brand recognition and then, as opportunities arise, acquiring further pawnbroking outlets or loan books to supplement our organic growth.
We continue to hope for a full reform of the non-domestic rates system which may encourage more retailers to open stores and recreate vibrant high streets. Without reform, we fear some towns and high streets may suffer further decline and more empty shops. Our property portfolio has been purposefully managed to be as flexible as possible to provide a defensive quality in case any of our stores become isolated and performance deteriorates.
When looking at new town and relocation opportunities, investments will only be made in new stores after significant research of footfall and adjacent retailer quality. The demise of certain retailers in a town can however provide an opportunity to obtain reductions in rental levels in certain towns while not compromising on location.
5. Focusing on sustainability through our ESG policies
Our ESG policies are detailed on page 24.
Our long-term strategic aims will only be delivered if we have good foundations.
We remain:
· conscious of the impact of our activities on the environment and aim to reduce our energy use and recycle where we can;
· focused on our place in the communities in which we operate; how we look after our staff; how we play a wider societal role with respect to our customers, suppliers and charitable organisations; and
· committed to having the highest standards of governance throughout the business.
LOOKING AHEAD
With the gradual removal of restrictions put in place during the pandemic, FY22 saw the Group recommence the growth journey which it had been on since its IPO in February 2017.
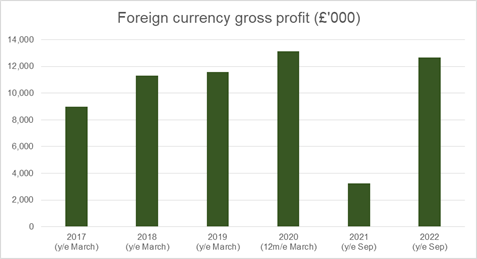
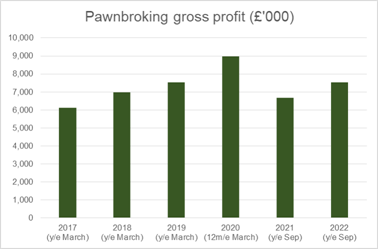
The graphs below set out the Group's performance in adjusted profit before tax and in each of the four main income streams since the IPO.
To enhance comparability, the profit before tax below, has been adjusted in 2017 by adding back the IPO fees and in 2020 by removing the one-off profit from scrapping of aged stock. In addition, the six-month period from April to September 2020, which was the period severely impacted by the pandemic including the closure of all stores and furloughing of 692 colleagues, has been excluded from the graphs.
The graphs show the adjusted profit before tax, pawnbroking gross profit, purchase of precious metals gross profit and foreign currency exchange gross profit trajectories being interrupted by the pandemic and the growth in jewellery retail revenue throughout the time period as a result of the ongoing self-help investments.
Adjusted profit before tax
The graph below demonstrates the growth in profit before tax over the period and shows that profitability has now returned to pre-Covid levels, despite performance in the first six months of FY22 being impacted by Covid-related restrictions.
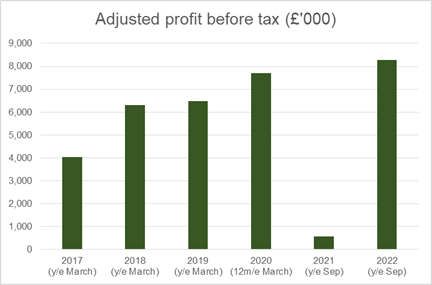
The adjustments are (1) adding back IPO fees in 2017 and (2) removing the one-off profit from scrapping of aged stock in 2020.
Foreign Currency Exchange
The expected number of international travellers in FY23 is subject to some debate given the squeeze on household incomes, but with disrupted holiday travel over the past three years it is anticipated that summer 2023 will bring normalised levels of demand. Due to rising costs for bureau de change operators, we believe that the margins will remain higher than pre-pandemic levels.
Pawnbroking
It is reasonable to expect that the demand for pawnbroking loans may continue to be high in FY23 due to the cost-of-living increases and the squeeze on household incomes at a time when there are fewer providers of short-term loans. There is potentially a greater risk of default on the repayment of loans but the pawnbroker is secured and would sell the jewellery to repay the loan, potentially at a value which can return surplus funds to borrowers.
Jewellery Retail
Our jewellery retail segment may experience the greatest headwinds in FY23 as a result of the inflationary environment and rising cost of living, but we are pleased to be starting from a strong position. This will be enhanced by several 'self-help' initiatives - higher stock levels, staff training, improved window displays and a website refresh, which means we have momentum to navigate those headwinds and the confidence to continue to grow.
Purchase of precious metals
We believe the gold price will remain high and with increasing footfall over recent years our ability to cross sell should enable gold purchases to remain strong in FY23.
SUMMARY
Our diversified income streams and our strong financial base have allowed the Group to trade through the pandemic successfully. We believe we have made good progress as a business since the Group's IPO in 2017 and are well positioned for the future particularly with regards to our well-invested staff development and our pipeline of new stores.
The Board has continued optimism for the future and confidence in our ability to deliver on our growth strategy for the long-term benefit of all our stakeholders.
Peter Kenyon
Chief Executive Officer
16 January 2023
FINANCIAL DIRECTOR'S REVIEW
FINANCIAL RESULTS
For the year ended 30 September 2022, the Group's reported Revenue increased by 63% to £66.1m (FY21: £40.7m) with growth across each of the four key income streams. Gross profit increased by £16.0m (72%) to £38.2m (FY21: £22.3m).
The Group's administrative expenses increased by £7.9m (37%) to £29.4m (FY21: £21.5m), reflecting an increase in staff costs as the business returned to more normalised trading operating levels. Finance costs remained low reflecting the seasonal use of the Group's revolving credit facility during peak holiday periods.
Profit before tax increased to £8.3m (FY21: £0.6m) as the Group benefited from improved trading conditions.
The Group's cash position remains strong with £8.8m net cash at the year-end (FY21: £13.0m), with the reduction in the period reflecting increased investment into jewellery stock and the recovery of the pawnbroking loan book.
The table below shows the headline financial results:
|
£000's |
FY22 |
FY21 |
|
Revenue |
£66,101 |
£40,677 |
|
Gross Profit |
£38,219 |
£22,262 |
|
Profit Before Tax |
£8,269 |
£564 |
|
Net Assets |
£41,843 |
£36,143 |
|
Net Cash* |
£8,835 |
£13,032 |
|
EPS |
20.9p |
1.2p |
*Cash less bank borrowings
EARNINGS PER SHARE AND DIVIDEND
The statutory basic earnings per share for FY22 was 20.9p, up from 1.2p in the previous year.
The Board is recommending a final dividend of 6.3p in respect of FY22 (FY21: 1.2p). Subject to approval at the AGM, the final dividend is expected to be paid on 10 March 2023 for those shareholders on the register on 3 February 2023. The ex-dividend date will be 2 February 2023. This brings the total dividend for FY22 to 9.0p (FY21: 1.2p). This dividend is in line with the Board's progressive dividend policy reflecting the cash flow generation and earnings potential of the Group.
This dividend represents a 43% pay-out ratio of FY22 EPS. The FY22 ratio is mindful of the forthcoming changes to the rate of corporation tax and allows for future dividends to be increased incrementally in line with profits generated and our stated policy of approximately 50% of post-tax profits being distributed.
Moving forward, the Board intends to pay interim dividends in October and final dividends in March in the approximate proportion of one third and two thirds respectively, subject always to the financial performance of the Group and growth opportunities.
FINANCIAL POSITION
At 30 September 2022, cash and cash equivalents amounted to £15.3m (FY21: £13.0m) and the Group had net assets of £41.8m (FY21: £36.1m).
CAPITAL EXPENDITURE
During the reporting period, the Group invested in the store estate by opening three new stores and relocating four existing stores. Capital expenditure for tangible and intangible assets was £2.8m which also included the purchase of the head office building for £0.5m. A business in Boscombe was acquired during the year for £0.9m which included its pawnbroking loan book and jewellery stock.
CASH FLOW
Working capital outflows in the year include the significant investment in stock of £7.2m, and the growth of the pawnbroking loan book which has resulted in trade and other receivables increasing by £2.6m. Trade and other payables increased by £1.1m mainly due to the increased currency creditor which was lower in the prior year due to the impact of Covid-19. The net cash flow from operating activities for the year was £2.9m (FY21: £1.1m)
Net cash at the period end was £8.8m (FY21: £13.0m).
T he Group continues to have access to its £10m revolving credit facility which expires in March 2024. The Group has one covenant of 1.5x cash cover. At 30 September 2022, this facility was £6.5m drawn to support the currency cash held. The cash position and headroom on the bank facility provide the Group with the funds required to continue to deliver its current stated strategy.
TAXATION
The tax charge for the period was £1.7m (FY21: £0.2m) representing an effective rate of 20% (FY21: 33%). The tax rate was higher than the standard UK rate of corporation tax mainly due to non-deductible expenses including the amortisation of certain customer lists. A full reconciliation of the tax charge is shown in note 10 of the financial statements.
SHARE BASED PAYMENTS
The share-based payment expense in the period was £314,000 (FY21: £254,000). This charge relates to the Long-Term Incentive Plans (LTIP) and Company Share Option Plans (CSOP). Both schemes are discretionary share incentive schemes under which the Remuneration Committee can grant options to purchase ordinary shares. The shares under option in the LTIP scheme can be purchased at a nominal 1p cost to Executive Directors and other senior management subject to certain performance and vesting conditions. The shares under option in the CSOP scheme can be purchased at their issue price of 200.5p.
During the year, the LTIP award from 2018 did not meet the performance criteria and therefore none of the share options vested. 250,000 share options, which vested in the 2017 LTIP scheme, were exercised during the year.
GOING CONCERN
The Board has conducted an extensive review of forecast earnings and cash over the next 12 months, considering various scenarios and sensitivities given the ongoing economic challenges and has concluded that it has adequate resources to continue in business for the foreseeable future. For this reason, the Board has been able to conclude the going concern basis is appropriate in preparing the financial statements.
Martin Clyburn
Chief Financial Officer
|
Consolidated statement of comprehensive income |
||||
|
For the year ended 30 September 2022 |
||||
|
2022 |
2021 |
|||
|
Notes |
||||
|
£'000 |
£'000 |
|||
|
Revenue |
5 |
66,101 |
40,677 |
|
|
Cost of sales |
(27,882) |
(18,415) |
||
|
Gross profit |
5 |
38,219 |
22,262 |
|
|
Other income |
7 |
1 |
284 |
|
|
Administrative expenses |
(29,392) |
(21,510) |
||
|
Operating profit |
8,828 |
1,036 |
||
|
Finance costs |
6 |
(559) |
(472) |
|
|
Profit before tax |
8,269 |
564 |
||
|
Income tax expense |
10 |
(1,683) |
(198) |
|
|
Profit for the year |
6,586 |
366 |
||
|
Other comprehensive income |
- |
- |
||
|
Total comprehensive income |
6,586 |
366 |
||
|
Earnings per share in pence |
8 |
20.9 |
1.2 |
|
|
Diluted earnings per share in pence |
8 |
20.7 |
1.2 |
|
|
Consolidated statement of financial position |
||||||||||
|
As at 30 September 2022 |
||||||||||
|
2022 |
2021 |
|||||||||
|
Assets |
Notes |
£'000 |
£'000 |
|||||||
|
Non-current assets |
||||||||||
|
Property, plant and equipment |
11 |
6,681 |
5,195 |
|||||||
|
Right of use of assets |
11 |
9,551 |
8,164 |
|||||||
|
Intangible assets |
12 |
779 |
714 |
|||||||
|
Investments |
13 |
- |
- |
|||||||
|
Deferred tax assets |
10 |
- |
80 |
|||||||
|
17,011 |
14,153 |
|||||||||
|
Current assets |
||||||||||
|
Inventories |
15 |
22,764 |
15,151 |
|||||||
|
Trade and other receivables |
16 |
13,264 |
10,379 |
|||||||
|
Cash and short-term deposits |
17 |
15,278 |
13,032 |
|||||||
|
51,306 |
38,562 |
|||||||||
|
Total assets |
68,317 |
52,715 |
||||||||
|
Current liabilities |
||||||||||
|
Trade and other payables |
18 |
8,905 |
7,673 |
|||||||
|
Interest bearing loans and borrowings |
18 |
6,443 |
- |
|||||||
|
Lease liabilities |
18 |
2,086 |
2,159 |
|||||||
|
Income tax payable |
18 |
932 |
61 |
|||||||
|
18,366 |
9,893 |
|||||||||
|
Net current assets |
32,940 |
28,669 |
||||||||
|
Non-current liabilities |
||||||||||
|
Lease liabilities |
19 |
7,871 |
6,442 |
|||||||
|
Contract liabilities |
19 |
88 |
119 |
|||||||
|
Deferred tax liabilities |
19 |
149 |
118 |
|||||||
|
8,108 |
6,679 |
|||||||||
|
Total liabilities |
26,474 |
16,572 |
||||||||
|
Net assets |
41,843 |
36,143 |
||||||||
|
Equity |
||||||||||
|
Issued capital |
21 |
316 |
314 |
|||||||
|
Share premium |
4,892 |
4,892 |
||||||||
|
Retained earnings |
36,635 |
30,937 |
||||||||
|
Total equity |
41,843 |
36,143 |
||||||||
|
The financial statements of Ramsdens Holdings PLC, registered number 08811656, were approved by the directors and authorised for issue on 16 January 2023 and signed on their behalf by: |
||||||||||
|
M A Clyburn |
||||||||||
|
Chief Financial Officer |
||||||||||
|
Consolidated statement of changes in equity |
|||||
|
For the year ended 30 September 2022 |
|||||
|
Issued capital |
Share premium |
Retained earnings |
Total |
||
|
Notes |
|||||
|
£'000 |
£'000 |
£'000 |
£'000 |
||
|
As at 1 October 2020 |
308 |
4,892 |
30,355 |
35,555 |
|
|
Profit for the year |
- |
- |
366 |
366 |
|
|
Total comprehensive income |
- |
- |
366 |
366 |
|
|
Transactions with owners: |
|||||
|
Dividends paid |
22 |
- |
- |
- |
- |
|
Issue of share capital |
6 |
- |
- |
6 |
|
|
Share based payments |
25 |
- |
- |
254 |
254 |
|
Deferred tax on share-based payments |
- |
- |
(38) |
(38) |
|
|
Total transactions with owners |
6 |
- |
216 |
222 |
|
|
As at 30 September 2021 |
|||||
|
314 |
4,892 |
30,937 |
36,143 |
||
|
As at 1 October 2021 |
314 |
4,892 |
30,937 |
36,143 |
|
|
Profit for the period |
- |
- |
6,586 |
6,586 |
|
|
Total comprehensive income |
- |
- |
6,586 |
6,586 |
|
|
Transactions with owners: |
|||||
|
Dividends paid |
22 |
- |
- |
(1,231) |
(1,231) |
|
Issue of share capital |
21 |
2 |
- |
- |
2 |
|
Share based payments |
25 |
- |
- |
314 |
314 |
|
Deferred tax on share-based payments |
- |
- |
29 |
29 |
|
|
Total transactions with owners |
2 |
- |
(888) |
(886) |
|
|
As at 30 September 2022 |
316 |
4,892 |
36,635 |
41,843 |
|
|
Consolidated statement of cash flows |
||||
|
For the year ended 30 September 2022 |
||||
|
2022 |
2021 |
|||
|
Operating activities |
Notes |
£'000 |
£'000 |
|
|
Profit before tax |
8,269 |
564 |
||
|
Adjustments to reconcile profit before tax to net cash flows: |
||||
|
Depreciation and impairment of property, plant |
||||
|
and equipment |
11 |
1,265 |
1,074 |
|
|
Depreciation and impairment of right of use assets |
11 |
2,261 |
2,223 |
|
|
Profit on disposal of right of use assets |
7 |
(81) |
(45) |
|
|
Amortisation and impairment of intangible assets |
12 |
163 |
218 |
|
|
Loss on disposal of property, plant and equipment |
7 |
78 |
140 |
|
|
Share based payments |
25 |
314 |
254 |
|
|
Finance costs |
6 |
559 |
472 |
|
|
Working capital adjustments: |
||||
|
Movement in trade and other receivables and prepayments |
(2,583) |
565 |
||
|
Movement in inventories |
(7,221) |
(3,992) |
||
|
Movement in trade and other payables |
1,144 |
1,217 |
||
|
4,168 |
2,690 |
|||
|
Interest paid |
(559) |
(472) |
||
|
Income tax paid |
(672) |
(1,135) |
||
|
Net cash flows from operating activities |
2,937 |
1,083 |
||
|
Investing activities |
||||
|
Proceeds from sale of property, plant and equipment |
3 |
10 |
||
|
Purchase of property, plant and equipment |
11 |
(2,817) |
(1,574) |
|
|
Purchase of intangible assets |
12 |
(28) |
(62) |
|
|
Payment for acquisition |
26 |
(909) |
- |
|
|
Net cash flows used in investing activities |
(3,751) |
(1,626) |
||
|
Financing activities |
||||
|
Issue of share capital |
21 |
2 |
6 |
|
|
Dividends paid |
22 |
(1,231) |
- |
|
|
Payment of principal portion of lease liabilities |
(2,211) |
(2,304) |
||
|
Bank loans drawn down |
8,000 |
- |
||
|
Repayment of bank borrowings |
(1,500) |
- |
||
|
Net cash flows from financing activities |
3,060 |
(2,298) |
||
|
Net increase / decrease in cash and cash equivalents |
2,246 |
(2,841) |
||
|
Cash and cash equivalents at 1 October |
13,032 |
15,873 |
||
|
Cash and cash equivalents at 30 September |
28 |
15,278 |
13,032 |
|
Notes to the consolidated financial statements
1. Corporate information
Ramsdens Holdings PLC (the "Company") is a public limited company incorporated and domiciled in England and Wales. The registered office of the Company is Unit 16, Parkway Shopping Centre, Coulby Newham, Middlesbrough, TS8 0TJ. The registered company number is 08811656. A list of the Company's subsidiaries is presented in note 13.
The principal activities of the Company and its subsidiaries (the "Group") are the supply of foreign exchange services, pawnbroking and related financial services, jewellery sales, and the purchase of gold jewellery from the general public.
2. Changes in accounting policies
There are no changes to accounting policies in the current year. There are no future changes in accounting standards which would materially impact the Group.
3. Significant accounting policies
3.1 Basis of preparation
The consolidated financial statements of the Group have been prepared in accordance with UK adopted international accounting standards.
The consolidated financial statements have been prepared on a historical cost basis. The consolidated financial statements are presented in pounds sterling which is the functional currency of the parent and presentational currency of the Group. All values are rounded to the nearest thousand (£000), except when otherwise indicated.
3.2 Basis of consolidation
The consolidated financial statements incorporate the financial statements of the Company and all of its subsidiary undertakings (as detailed above). The financial information of all Group companies is adjusted, where necessary, to ensure the use of consistent accounting policies. In line with IFRS10, an investor controls an investee when it is exposed, or has rights, to variable returns from its involvement with the investee and has the ability to affect those returns through its power over the investee.
3.3 Going Concern
The Group has prepared the financial statements on a going concern basis, with due consideration to the present economic situation.
The Board have conducted an extensive review of forecast earnings and cash for the period to 31 January 2024 considering various scenarios and sensitivities given the residual effects Covid-19 and the ongoing cost of living crisis and uncertainty it has produced around the future economic environment.
At 30 September 2022 the Group has significant cash balances of £15.3m, readily realisable stock of gold jewellery and access to the £3.5m unutilised element of a £10m revolving credit facility with an expiry date of March 2024. In the year ended 30 September 2022 the Group has traded profitably and generated cash from operations.
The Board have been able to conclude that they a reasonable expectation that the Group has adequate resources to continue in operational existence for the foreseeable future. Accordingly, the Group continues to adopt the going concern basis in preparing the financial statements. The going concern assessment covers the period to 31 January 2024.
3.4 Business combinations and goodwill
Business combinations are accounted for using the acquisition method. The cost of an acquisition is measured as the aggregate of the consideration transferred which represents the fair value of the assets transferred and liabilities incurred or assumed. Acquisition related costs are expensed as incurred and included in administrative expenses.
Goodwill is initially measured at cost, being the excess of the aggregate of the consideration transferred over the fair value of the identifiable assets acquired and liabilities assumed. If the fair value of the net assets acquired is in excess of the aggregate consideration transferred, the Group re-assesses whether it has correctly identified all of the assets acquired and all of the liabilities assumed and reviews the procedures used to measure the amounts to be recognised at the acquisition date. If the reassessment still results in an excess of the fair value of net assets acquired over the aggregate consideration transferred, then the gain is recognised in the statement of comprehensive income as a gain on bargain purchase.
After initial recognition, goodwill is measured at cost less any accumulated impairment losses. For the purpose of impairment testing, goodwill acquired in a business combination is, from the acquisition date, allocated to each of the Group's cash generating units (CGU) that are expected to benefit from the combination, irrespective of whether other assets or liabilities of the acquiree are assigned to those units.
3.5 Intangible assets
Intangible assets acquired separately are measured on initial recognition at cost. The cost of intangible assets acquired in a business combination is their fair value as at the date of acquisition. Following initial recognition, intangible assets are carried at cost less accumulated amortisation and accumulated impairment losses, if any. Internally generated intangible assets, excluding capitalised development costs, are not capitalised and expenditure is recognised in the statement of comprehensive income when it is incurred.
The useful lives of intangible assets are assessed as either finite or indefinite and at each date of the statement of financial position only goodwill assets are accorded an indefinite life.
Intangible assets with finite lives are amortised over their useful economic lives and assessed for impairment whenever there is an indication that the intangible asset may be impaired. The amortisation period and the amortisation method for an intangible asset with a finite useful life are reviewed at least at the end of each reporting period.
|
Amortisation is calculated over the estimated useful lives of the assets as follows: |
|
• Customer relationships - 40% reducing balance |
|
• Software - 20% straight line |
Changes in the expected useful life or the expected pattern of consumption of future economic benefits embodied in the asset are accounted for by changing the amortisation period or method, as appropriate, and are treated as changes in accounting estimates. The amortisation expense on intangible assets with finite lives is recognised in the statement of comprehensive income in the expense category consistent with the function of the intangible assets.
3.6 Property, plant and equipment
Property, plant and equipment are stated at cost, net of accumulated depreciation and accumulated impairment losses (if any). All other repair and maintenance costs are recognised in the statement of comprehensive income as incurred.
|
Depreciation is calculated over the estimated useful lives of the assets as follows: |
|
· Freehold property - 2% straight line · Leasehold improvements - straight line over the lease term |
|
· Fixtures & fittings - 20% & 33% reducing balance |
|
· Computer equipment - 25% & 33% reducing balance |
|
· Motor vehicles - 25% reducing balance |
An item of property, plant and equipment is derecognised upon disposal or when no future economic benefits are expected from its use or disposal. Any gain or loss arising on derecognition of the asset (calculated as the difference between the net disposal proceeds and the carrying amount of the asset) is included in the statement of comprehensive income when the asset is derecognised.
The residual values, useful lives and methods of depreciation of property, plant and equipment are reviewed at each financial year end and adjusted prospectively, if appropriate.
3.7 Impairment of non-financial assets
The Group assesses at each reporting date whether there is an indication that an asset may be impaired. If any indication exists, or when annual impairment testing for an asset is required, the Group estimates the asset's recoverable amount. An asset's recoverable amount is the higher of an asset's or CGU's fair value less costs of disposal and its value in use. It is determined for an individual asset, unless the asset does not generate cash inflows that are largely independent of those from other assets or groups of assets. Where the carrying amount of an asset or CGU exceeds its recoverable amount, the asset is considered impaired and is written down to its recoverable amount.
In assessing value in use, the estimated future cash flows are discounted to their present value using a pre-tax discount rate that reflects current market assessments of the time value of money and the risks specific to the asset. In determining fair value less costs of disposal, recent market transactions are taken into account. If no such transactions can be identified, an appropriate valuation model is used.
The Group bases its impairment calculation on detailed budgets and forecasts which are prepared separately for each of the Group's CGUs to which the individual assets are allocated, which is usually taken to be each individual branch store based on the independence of cash inflows. Central costs and assets are allocated to CGUs based on revenue. These budgets and forecast calculations are estimated for three years and extrapolated to cover a total period of ten years.
Impairment losses of continuing operations are recognised in the statement of comprehensive income in those expense categories consistent with the function of the impaired asset.
For assets excluding goodwill, an assessment is made at each reporting date as to whether there is any indication that previously recognised impairment losses may no longer exist or may have decreased. If such indication exists, the Group estimates the asset's or CGU's recoverable amount. A previously recognised impairment loss is reversed only if there has been a change in the assumptions used to determine the asset's recoverable amount since the last impairment loss was recognised.
The reversal is limited so that the carrying amount of the asset does not exceed its recoverable amount, nor exceed the carrying amount that would have been determined, net of depreciation or amortisation, had no impairment loss been recognised for the asset in prior years. Such reversal is recognised in the Statement of Comprehensive income unless the asset is carried at a revalued amount, in which case the reversal is treated as a revaluation increase.
Goodwill
Goodwill is tested for impairment at the end of each accounting period and when circumstances indicate that the carrying value may be impaired.
Impairment is determined for goodwill by assessing the recoverable amount of each CGU (or group of CGUs) to which the goodwill relates. Where the recoverable amount of the cash-generating unit is less than their carrying amount, an impairment loss is recognised. Impairment losses relating to goodwill cannot be reversed in future periods. Goodwill is allocated to CGUs based on the price paid of the relevant acquisition.
3.8 Inventories
Inventories comprise of retail jewellery and precious metals held to be scrapped and are valued at the lower of cost and net realisable value.
Cost represents the purchase price plus overheads directly related to bringing the inventory to its present location and condition.
When the Group takes title to pledged goods on default of pawnbroking loans up to the value of £75, cost represents the principal amount of the loan plus term interest.
Net realisable value is the estimated selling price in the ordinary course of business, less estimated costs of completion and estimated costs to sell.
3.9 Financial instruments
A financial instrument is any contract that gives rise to a financial asset of one entity and a financial liability or equity instrument of another entity.
Financial assets
Financial assets are all recognised and derecognised on a trade date basis. All recognised financial assets are measured and subsequently measured at amortised cost or fair value depending on the classification of the financial asset.
Classification of financial assets
Financial assets that meet the following criteria are measured at amortised cost:
· the financial asset is held within the business model whose objective is to hold financial assets in order to collect contractual cash flows; and
· the contractual terms of the financial asset give rise on specified dates to cash flows that are solely payments of principal and interest on the principal amount outstanding.
In accordance with IFRS 9 Financial Instruments the Group has classified its financial assets as amortised cost.
The amortised cost of a financial asset is the amount at which the financial asset is measured at initial recognition less the principal repayments, plus the cumulative amortisation using the effective interest method of any difference between that initial amount and the maturity amount, adjusted for any loss allowance. The gross carrying amount of a financial asset is the amortised cost of a financial asset before adjusting for any loss allowance.
Cash and cash equivalents
Cash and short-term deposits in the statement of financial position comprise cash at banks and on hand, foreign currency held for resale and short-term deposits held with banks with a maturity of three months or less from inception. Debit / credit card receipts are recognised as cash at point of transaction.
For the purpose of the consolidated statement of cash flows, cash and cash equivalents consist of cash, foreign currency held for resale and short-term deposits as defined above, net of outstanding bank overdrafts as they are considered an integral part of the Group's cash management.
Impairment of financial assets
The Group recognises a loss allowance for expected credit losses on financial assets that are measured at amortised cost. The amount of credit losses is updated at each reporting date to reflect changes in credit risk since initial recognition of the respective financial instrument.
The Group recognises lifetime expected credit losses when there has been a significant increase in credit risk since initial recognition. However, if the credit risk on the financial instrument has not increased significantly since initial recognition, the Group recognises the 12 month expected credit losses. As pawnbroking loans are typically over a six-month term the lifetime credit losses are usually the same as the 12 month expected credit losses.
In assessing whether the credit risk on a financial instrument has increased significantly since initial recognition, the Company compares the risk of a default occurring on the financial instrument at the reporting date with the risk of a default occurring on the financial instrument at the date of initial recognition. In making this assessment, the Company considers both quantitative and qualitative information that is reasonable and supportable including historical experience.
The measurement of expected credit losses is a function of the probability of default, and the loss (if any) on default. The assessment of the probability of default is based on historical data. The loss on default is based on the assets gross carrying amount less any realisable security held. The expected credit loss calculation considers both the interest income and the capital element of the pawnbroking loans. Interest on loans in default is accrued net of expected credit losses. Details of the key assumptions for pawnbroking expected credit losses are given in note 4.
Derecognition
The Group derecognises a financial asset only when the contractual rights to the cash flows from the asset expire, or when it transfers the financial asset to another entity. On derecognition of a financial asset measured at amortised cost, the difference between the assets carrying amount and the sum of the consideration received and receivable is recognised in the Statement of Comprehensive Income. Pawnbroking loans in the course of realisation continue to be recognised as loan receivables until the pledged items are realised.
Financial liabilities
Debt and equity instruments are classified as either financial liabilities or equity in accordance with the substance of the contractual arrangements and the definitions of a financial liability and equity instrument.
All financial liabilities are recognised initially at amortised cost or at fair value through profit and loss (FVTPL).
The Group's financial liabilities include trade and other payables, loans and borrowings including bank overdrafts, and derivative financial instruments.
After initial recognition, interest bearing loans and borrowings are subsequently measured at amortised cost using the effective interest rate method (EIR). Gains and losses are recognised in the Statement of Comprehensive Income when the liabilities are derecognised as well as through the (EIR) amortisation process.
Amortised cost is calculated by taking into account any discount or premium on acquisition and fees or costs that are an integral part of the EIR. The EIR amortisation is included in finance costs in the Statement of Comprehensive Income.
Only the Group's derivative financial instruments are classified as financial liabilities at fair value through profit or loss.
Financial liabilities at fair value through profit or loss are stated at fair value, with any resultant gain or loss recognised in the Statement of Comprehensive Income. The net gain or loss recognised in the Statement of Comprehensive Income incorporates any interest paid on the financial liability.
Derecognition
A financial liability is derecognised when the obligation under the liability is discharged or cancelled or expires. When an existing financial liability is replaced by another from the same lender on substantially different terms, or the terms of an existing liability are substantially modified, such an exchange or modification is treated as a derecognition of the original liability and the recognition of a new liability. The difference in the respective carrying amounts is recognised in the Statement of Comprehensive Income.
Offsetting of financial instruments
Financial assets and financial liabilities are offset with the net amount reported in the Statement of Financial Position only if there is a current enforceable legal right to offset the recognised amounts and intent to settle on a net basis, or to realise the assets and settle the liabilities simultaneously.
3.10 Fair value measurement
The Group measures financial instruments, such as derivatives, at fair value at the date of each statement of financial position.
Fair value is the price that would be received to sell an asset or paid to transfer a liability in an orderly transaction between market participants at the measurement date.
The fair value of an asset or a liability is measured using the assumptions that market participants would use when pricing the asset or liability, assuming that market participants act in their economic best interest.
The Group uses valuation techniques that are appropriate in the circumstances and for which sufficient data are available to measure fair value, maximising the use of relevant observable inputs and minimising the use of unobservable inputs.
All assets and liabilities for which fair value is measured or disclosed in the financial statements are categorised within the fair value hierarchy. This is described, as follows, based on the lowest level input that is significant to the fair value measurement as a whole:
• Level 1 - Quoted (unadjusted) market prices in active markets for identical assets or liabilities
• Level 2 - Valuation techniques for which the lowest level input that is significant to the fair value measurement is directly or indirectly observable
• Level 3 - Valuation techniques for which the lowest level input that is significant to the fair value measurement is unobservable
3.11 Taxation
Current tax
The tax currently payable is based on taxable profit for the year. Taxable profit differs from net profit as reported in the Consolidated Statement of Comprehensive Income because it excludes items of income or expense that are taxable or deductible in other years and it further excludes items that are never taxable or deductible. The Group's liability for current tax is calculated using tax rates and laws that have been enacted or substantively enacted by the date of the statement of financial position.
Deferred tax
Deferred tax is the tax expected to be payable or recoverable on differences between the carrying amounts of assets and liabilities in the financial statements and the corresponding tax bases used in the computation of taxable profit, and is accounted for using the balance sheet liability method. Deferred tax liabilities are generally recognised for all taxable temporary differences and deferred tax assets are recognised to the extent that it is probable that taxable profits will be available against which deductible temporary differences can be utilised. Such assets and liabilities are not recognised if the temporary difference arises from the initial recognition of goodwill or from the initial recognition (other than in a business combination) of other assets and liabilities in a transaction that affects neither the taxable profit nor the accounting profit.
The carrying amount of deferred tax assets is reviewed at the date of each statement of financial position and reduced to the extent that it is no longer probable that sufficient taxable profits will be available to allow all or part of the asset to be recovered.
Deferred tax is calculated at the tax rates and laws that are expected to apply in the period when the liability is settled or the asset is realised. Deferred tax is charged or credited in the Consolidated Statement of Comprehensive Income, except when it relates to items charged or credited directly to equity, in which case the deferred tax is also dealt with in equity. Deferred tax is recognised on an undiscounted basis.
Deferred tax assets and liabilities are offset when there is a legally enforceable right to set off current tax assets against current tax liabilities when they relate to income taxes levied by the same taxation authority and the Group intends to settle its current tax assets and liabilities on a net basis.
3.12 Leases
At inception of a contract, the Group assesses whether a contract is, or contains, a lease. A contract is, or contains, a lease if the contract conveys the right to control the use of an identified asset for a period of time in exchange for consideration. To assess whether a contract conveys the right to control the use of an identified asset, the Group assesses whether:
The contract involves the use of an identified asset - this may be specified explicitly or implicitly, and should be physically distinct or represent substantially all of the capacity of a physically distinct asset. If the supplier has a substantive substitution right, then the asset is not identified;
· The Group has the right to obtain substantially all of the economic benefits from use of the asset throughout the period of use; and
· The Group has the right to direct the use of the asset. The Group has this right when it has the decision-making rights that are most relevant to changing how and for what purpose the asset is used. In rare cases where the decision about how and for what purpose the asset is used is predetermined, the Group has the right to direct the use of the asset if either: The Group has the right to operate the asset; or
· The Group designed the asset in a way that predetermines how and for what purpose it will be used.
As a lessee
The Group recognises a right-of-use asset and a lease liability at the lease commencement date. The right-of-use asset is initially measured at cost, which comprises the initial amount of the lease liability adjusted for any lease payments made at or before the commencement date, plus any initial direct costs incurred and an estimate costs to dismantle and remove the underlying asset or to restore the underlying asset or the site on which it is located, less any lease incentives received.
The right-of-use asset is subsequently depreciated using the straight-line method from the commencement date to the earlier of the end of the useful life of the right-of-use asset or the end of the lease term. The estimated useful lives of the right-of-use assets are determined on the same basis as those of property and equipment. In addition, the right-of-use asset is periodically reduced by impairment losses, if any, and adjusted for certain remeasurements of the lease liability.
The lease liability initially measured at the present value of the lease payments that are not paid at the commencement date, discounted using the interest rate implicit in the lease or, if that rate cannot be readily determined, the Group's incremental borrowing rate. Generally, the Group uses its incremental borrowing rate as the discount rate.
Lease payments included in the measurement of the lease liability comprise the following:
· Fixed payments, including in-substance fixed payments;
· Variable lease payments that depend on an index or a rate, initially measured using the index or rate as at the commencement date;
· Amounts expected to be payable under a residual value guarantee; and
· The exercise price under a purchase option that the Group is reasonably certain to exercise, lease payments in an optional renewal period if the Group is reasonably certain to exercise an extension option, and penalties for early termination of a lease unless the Group is reasonably certain not to terminate early.
The lease liability is measured at amortised cost using the effective interest method. It is remeasured when there is a change in future lease payments arising from a change in an index or rate, if there is a change in the Group's estimate of the amount expected to be payable under a residual value guarantee, or if the Group changes its assessment of whether it will exercise a purchase, extension or termination option.
When the lease liability is remeasured in this way, a corresponding adjustment is made to the carrying amount of the right-of-use asset, or is recorded in profit or loss if the carrying amount of the right-of-use asset has been reduced to zero.
Short-term leases and leases of low-value assets
The Group has elected not to recognise right-of-use assets and lease liabilities for short-term leases of machinery that have a lease term of 12 months or less and leases of low-value assets, including IT equipment. The Group recognises the lease payments associated with these leases as an expense on a straight-line basis over the lease term.
3.13 Provisions
Provisions are recognised when the Group has a present obligation (legal or constructive) as a result of a past event, it is probable that an outflow of resources embodying economic benefits will be required to settle the obligation and a reliable estimate can be made of the amount of the obligation. Provisions are measured using the directors' best estimate of the expenditure required to settle the obligation at the date of each statement of financial position.
If the effect of the time value of money is material, provisions are discounted using a current pre-tax rate that reflects, when appropriate, the risks specific to the liability. When discounting is used, the increase in the provision due to the passage of time is recognised as a finance cost.
The majority of the Group's premises are leased and include an end of lease rectification clause to return the property to its original state. No provision is made until a board decision has been taken to exit the lease. Additionally, the group maintains stores to a high standard and completes any necessary repairs and maintenance on a timely basis using the in-house property department and external contractors. These costs are expensed as incurred.
3.14 Pensions and other post-employment benefits
The company operates a defined contribution pension scheme. The assets of the scheme are held and administered separately from those of the Group. Contributions payable for the year are charged in the statement of comprehensive income. Total contributions for the year are disclosed in note 9 to the accounts. Differences between contributions payable in the year and contributions actually paid are shown as either accruals or prepayments in the Statement of Financial Position.
3.15 Employee share incentive plans
The group grants equity settled share option rights to the parent entity's equity instruments to certain directors and senior staff members under a LTIP (Long term incentive Plan). The employee share options are measured at fair value at the date of grant by the use of either the Black- Scholes Model or a Monte Carle model depending on the vesting conditions attached to the share option. The fair value is expensed on a straight line basis over the vesting period based on an estimate of the number of options that will eventually vest. The expense is recognised in the entity in which the beneficiary is remunerated. Further details are provided in note 25.
3.16 Revenue recognition
The major sources of revenue come from the following:
· Pawnbroking
· Foreign currency exchange
· Purchase of precious metals
· Retail jewellery sales
· Income from other financial services
Pawnbroking revenue is recognised in accordance with IFRS 9, whereas revenue from other sources is recognised in accordance with IFRS 15.
Pawnbroking revenue
Revenue from pawnbroking loans comprises interest earned over time by reference to the principal outstanding and the effective rate applicable, which is the rate that discounts the estimated cash receipts through the expected life of the financial asset to that asset's net carrying value. When a customer defaults on a pawnbroking loan, the pledged goods held as security are sold to repay the customer debt. At the point the loan becomes overdue the loan is classified as in default and interest income is accrued net of expected credit losses. At the start of the realisation process the expected credit loss calculation is re-performed based on the expected cash flows of the retail process, with any increase in expected credit losses recognised as a cost of sale. Further details of the expected credit loss calculations are provided in note 4.1.
Foreign currency exchange income
Revenue is earned in respect of the provision of Bureau de Change facilities offered and represents the margin earned which is recognised at the point the currency is collected by the customer as this represents when the service provided under IFRS 15 has been delivered.
Sale of precious metals acquired via over the counter purchases
Revenue is recognised when control of the goods has transferred, being at the point the goods are received by the bullion dealer and a sell instruction has been issued. If a price has been fixed in advance of delivery, revenue is recognised at the point the goods are received by the bullion dealer.
Jewellery retail sales
Revenue is recognised at the point the goods are transferred to the customer and full payment has been received. Customers either pay in full at the time of the transaction and receive the goods, or pay in instalments and receive the goods once the sale is fully paid. Instalment payments are recognised as deferred income until the item is fully paid. The Company has a 7 day refund policy in store, and a 14 day refund policy online reflecting the distance selling regulations.
Other financial income
Other financial income comprises cheque cashing and other miscellaneous revenues. Cheque cashing revenue is recognised when the service is provided under IFRS 15 which includes making a payment to the customer.
3.17 Administrative expenses
Administrative expenses includes branch staff and establishment costs.
3.18 Government grants
Government grants that are a contribution to a specific administrative expense are recognised in the income statement as a reduction to administrative expenses in the period to which the expense relates. Other government grants are recognised as other income when there is reasonable assurance that the entity will comply with the conditions and the grants will be received.
The grants recognised in the financial statements all relate to Covid-19 support with job retention scheme support shown net of the wage cost in administrative expenses and retail grants shown as other income. There are no unfulfilled conditions and contingencies attaching to recognised grants.
|
2022 |
2021 |
|
|
£'000 |
£'000 |
|
|
Other income |
1 |
134 |
|
Administrative expenses |
- |
1,472 |
|
Total |
1 |
1,606 |
Any grants recognised in the Statement of Comprehensive Income but not received are included within the Statement of Financial position under Trade and other Receivables
4. Key sources of estimation uncertainty and significant accounting judgements
The preparation of the Group's consolidated financial statements requires management to make judgements, estimates and assumptions that affect the reported amounts of revenues, expenses, assets and liabilities, and the accompanying disclosures, and the disclosure of contingent liabilities. Uncertainty about these assumptions and estimates could result in outcomes that require a material adjustment to the carrying amount of assets or liabilities affected in future periods.
4.1 Key sources of estimation uncertainty
Pawnbroking loans interest and impairment
The group recognises interest on pawnbroking loans as disclosed in note 3.16.
For active pawnbroking loans (loans not in the course of realisation) the Group estimates the expected credit losses. An assessment is made on a pledge by pledge basis of the carrying value represented by original capital loaned plus accrued interest to date and its corresponding realisation value on sale of unredeemed pledges to identify any credit losses. The key estimates within the expected credit loss calculation are;
1. Non Redemption Rate
This is based upon current and historical data held in respect of non-redemption rates.
2. Realisation Value
This based upon either;
- The current price of the metal that will be received through the sale of the metal content via disposal through a bullion dealer.
- The expected resale value of those jewellery items within the pledge that can be retailed through the branch network.
For pawnbroking loans in the course of realisation the Group estimates the expected credit losses based on the expected outcome from selling the pledged goods. The key estimates within the expected credit loss calculation are;
1. Proceeds of sale
This is based upon the retail price the goods are offered for sale at.
2. Time to sell
This is based upon current and historical data in respect of the average time to sell.
See note 14 for further details on pawnbroking credit risk and provision values, including sensitivity
Impairment of property, plant and equipment, right-of-use assets and intangible assets estimate
Determining whether property, plant and equipment, right-of-use and intangibles are impaired requires an estimation of the value in use of the CGU to which the assets have been allocated. The value in use calculation requires the Group to estimate the future cash flows expected to arise from the CGU and selecting a suitable discount rate in order to calculate present value. The review is conducted annually, in the final quarter of the year. The impairment review is conducted at the level of each CGU, which is usually taken to be each individual branch store.
Management have determined that the key sources of estimation uncertainty, to which the impairment analysis of property plant and equipment, right-of-use assets and intangible assets is most sensitive, relate to the following assumptions:
1. The Group prepares pre-tax cash flow forecasts for each branch. Cash flows represent management's estimate of the revenue of the relevant CGU, based upon the specific characteristics of the branch and its stage of development.
2. The Group has discounted the forecast cash flows at a pre-tax, risk adjusted rate of 12%.
Whilst the impairment review has been conducted based on the best available estimates at the impairment review date, the Group notes that actual events may vary from management expectation. If outcomes within the next financial year are different from the assumptions made in relation to future cash flows, this could lead to a material adjustment to the carrying amount of the assets affected. The carrying amounts for tangible assets, right-of use assets and intangible assets are disclosed in notes 11 &12.
Where the recoverable amount of the CGU was estimated to be less than its carrying amount, the carrying amount of the CGU was reduced to the estimated recoverable amount.
4.2 Significant accounting judgements
In the process of applying the Group's accounting policies, management has made the following judgements, which have the most significant effect on the amounts recognised in the consolidated financial statements:
Lease term
For leases which contain a break clause an assessment is made on entering a lease on the likelihood that the lease break would be exercised. If the lease break is not expected to be exercised the break clause is ignored in establishing the lease term.
5. Segmental analysis
The group's revenue from external customers is shown by geographical location below:
|
2022 |
2021 |
|||
|
Revenue |
£'000 |
£'000 |
||
|
United Kingdom |
65,948 |
40,665 |
||
|
Other |
153 |
12 |
||
|
66,101 |
40,677 |
The Group's assets are located entirely in the United Kingdom therefore, no further geographical segments analysis is presented. The Group is organised into operating segments, identified based on key revenue streams, as detailed in the CEO's review.
The Group's revenue is analysed below between revenue from contracts with customers and other sources which comprises interest income earned on pawnbroking loans.
|
2022 |
2021 |
|||
|
Revenue |
£'000 |
£'000 |
||
|
Contracts with customers |
57,134 |
33,151 |
||
|
Pawnbroking interest income |
8,967 |
7,526 |
||
|
66,101 |
40,677 |
Pawnbroking interest income is recognised over time as each loan progresses whereas all other revenue is recognised at a point in time.
|
2021 |
2021 |
|||
|
Revenue |
£'000 |
£'000 |
||
|
Pawnbroking |
8,967 |
7,526 |
||
|
Purchases of precious metals |
15,847 |
10,369 |
||
|
Retail jewellery sales |
27,107 |
18,252 |
||
|
Foreign currency margin |
13,066 |
3,408 |
||
|
Income from other financial services |
1,114 |
1,122 |
||
|
Total revenue |
66,101 |
40,677 |
|
Gross profit |
||||
|
Pawnbroking |
7,533 |
6,678 |
||
|
Purchases of precious metals |
6,626 |
4,240 |
||
|
Retail jewellery sales |
10,263 |
6,965 |
||
|
Foreign currency margin |
12,683 |
3,257 |
||
|
Income from other financial services |
1,114 |
1,122 |
||
|
Total gross profit |
38,219 |
22,262 |
||
|
Other income |
1 |
284 |
||
|
Administrative expenses |
(29,392) |
(21,510) |
||
|
Finance costs |
(559) |
(472) |
||
|
Profit before tax |
8,269 |
564 |
Income from other financial services comprises of cheque cashing fees and agency commissions on miscellaneous financial products.
Revenue from the purchases of precious metals is currently from one bullion dealer. There is no reliance on key customers in other revenue streams.
The Group is unable to meaningfully allocate administrative expenses, or financing costs or income between the segments. Accordingly, the Group is unable to meaningfully disclose an allocation of items included in the Consolidated Statement of Comprehensive income below Gross profit, which represents the reported segmental results.
In addition to the segmental reporting on products and services the Group also manages each branch as a separate CGU and makes local decisions on that basis.
|
2022 |
2021 |
|||
|
Other information |
£'000 |
£'000 |
||
|
Tangible & intangible capital additions (*) |
3,060 |
1,636 |
||
|
Depreciation and amortisation (*) |
3,689 |
3,515 |
|
Assets |
||||
|
Pawnbroking |
11,853 |
9,173 |
||
|
Purchases of precious metals |
3,081 |
1,172 |
||
|
Retail jewellery sales |
20,125 |
14,306 |
||
|
Foreign currency margin |
10,123 |
5,314 |
||
|
Income from other financial services |
139 |
139 |
||
|
Unallocated (*) |
22,996 |
22,611 |
||
|
68,317 |
52,715 |
|
Liabilities |
||||
|
Pawnbroking |
613 |
492 |
||
|
Purchases of precious metals |
3 |
21 |
||
|
Retail jewellery sales |
2,012 |
3,433 |
||
|
Foreign currency margin |
2,042 |
1,335 |
||
|
Income from other financial services |
392 |
541 |
||
|
Unallocated (*) |
21,412 |
10,750 |
||
|
26,474 |
16,572 |
(*) The Group cannot meaningfully allocate this information by segment due to the fact that all segments operate from the same stores and the assets in use are common to all segments.
Fixed assets and sterling cash and cash equivalents are therefore included in the unallocated assets balance.
6. Finance costs
|
2022 |
2020 |
||
|
£'000 |
£'000 |
||
|
Interest on debts and borrowings |
163 |
84 |
|
|
Lease charges |
396 |
388 |
|
|
Total finance costs |
559 |
472 |
7. Profit before taxation has been arrived at after charging/(crediting)
|
2022 |
2021 |
|||
|
£'000 |
£'000 |
|||
|
Items reported within Other income - |
||||
|
Compensation for surrendering a lease |
- |
(150) |
||
|
Retail grants |
(1) |
(134) |
||
|
Items reported within Cost of sales - |
||||
|
Cost of inventories recognised as an expense |
26,065 |
17,416 |
||
|
Pawnbroking expected credit losses |
1,434 |
848 |
||
|
Items reported within Administrative expenses - |
||||
|
Depreciation of property, plant and equipment |
1,265 |
1,073 |
||
|
Impairment of property, plant and equipment |
- |
1 |
||
|
Depreciation of right of use of assets |
2,261 |
2,223 |
||
|
Profit on disposal of right of use assets |
(81) |
(45) |
||
|
Amortisation of intangible assets |
163 |
172 |
||
|
Impairment of intangible assets |
- |
46 |
||
|
Loss on disposal of property, plant and equipment |
78 |
140 |
||
|
Staff costs (see note 9) |
16,643 |
11,452 |
||
|
Foreign currency exchange losses/(gains) |
265 |
135 |
||
|
Auditor's remuneration |
145 |
140 |
||
|
Short term lease payments |
470 |
441 |
||
|
Share based payments (see note 25) |
314 |
254 |
||
The Company paid an additional £5,000 to the auditor in respect of non-audit services for a first half of the year review.
8. Earnings per share
|
2022 |
2021 |
||
|
£'000 |
£'000 |
||
|
Profit for the year |
6,586 |
366 |
|
|
Weighted average number of shares in issue |
31,559,874 |
31,161,726 |
|
|
Earnings per share (pence) |
20.9 |
1.2 |
|
|
Weighted average number of dilutive shares |
291,939 |
481,481 |
|
|
Effect of dilutive shares on earnings per share (pence) |
(0.2) |
(0.0) |
|
|
Fully Diluted earnings per share (pence) |
20.7 |
1.2 |
9. Information regarding directors and employees
Directors' emoluments (£'000)
|
2022 |
2021 |
|||||||
|
Emoluments |
Pension |
LTIP |
Total |
Emoluments |
Pension |
LTIP |
Total |
|
|
Executive |
||||||||
|
Peter Kenyon |
427 |
10 |
435 |
872 |
201 |
10 |
- |
211 |
|
Martin Clyburn |
295 |
12 |
- |
307 |
134 |
13 |
204 |
351 |
|
Non Executive |
||||||||
|
Andrew Meehan |
68 |
- |
- |
68 |
66 |
- |
- |
66 |
|
Simon Herrick |
49 |
- |
- |
49 |
48 |
- |
- |
48 |
|
Steve Smith |
41 |
- |
- |
41 |
40 |
- |
- |
40 |
|
Total |
880 |
22 |
435 |
1,337 |
489 |
23 |
204 |
716 |
|
2022 |
2021 |
||
|
£'000 |
£'000 |
||
|
Included in administrative expenses: |
|||
|
Wages and salaries |
14,890 |
10,011 |
|
|
Social security costs |
1,089 |
856 |
|
|
Share option scheme |
314 |
254 |
|
|
Pension costs |
350 |
331 |
|
|
Total employee benefits expense |
16,643 |
11,452 |
The average number of staff employed by the Group during the financial period amounted to:
|
2022 |
2021 |
||
|
No. |
No. |
||
|
Head office and management |
115 |
106 |
|
|
Branch counter staff |
578 |
586 |
|
|
693 |
692 |
10. Income tax
The major components of income tax expense are:
Consolidated statement of comprehensive income
|
2022 |
2021 |
||
|
£'000 |
£'000 |
||
|
Current income tax: |
|||
|
Current income tax charge |
1,552 |
32 |
|
|
Adjustments in respect of current income tax of previous year |
(9) |
7 |
|
|
1,543 |
39 |
Deferred tax:
|
Relating to origination and reversal of temporary differences |
140 |
159 |
|
|
Income tax expense reported in the statement of comprehensive income |
1,683 |
198 |
A reconciliation between tax expense and the product of accounting profit multiplied by the UK domestic tax rate is as follows:
|
2022 |
2021 |
||
|
£'000 |
£'000 |
||
|
Profit before income tax |
8,269 |
564 |
|
|
UK corporation tax rate at 19% (2021 19%) |
1,571 |
107 |
|
|
Expenses not deductible for tax purposes |
122 |
84 |
|
|
Prior period adjustment |
(10) |
7 |
|
|
Income tax reported in the statement of comprehensive income |
1,683 |
198 |
Deferred tax
Deferred tax relates to the following:
|
2022 |
2021 |
||
|
£'000 |
£'000 |
||
|
Deferred tax assets |
|||
|
Share based payments |
- |
80 |
|
|
Deferred tax assets |
- |
80 |
|
|
Deferred tax liabilities |
|||
|
Accelerated depreciation for tax purposes |
180 |
112 |
|
|
Other short-term differences |
(31) |
6 |
|
|
Deferred tax liabilities |
149 |
118 |
|
Reconciliation of deferred tax (asset) / liabilities net |
|||
|
2022 |
2021 |
||
|
£'000 |
£'000 |
||
|
Opening balance as of 1 October |
38 |
(159) |
|
|
Deferred tax recognised in the statement of comprehensive income |
140 |
159 |
|
|
Other deferred tax |
(29) |
38 |
|
|
Closing balance as at 30 September |
149 |
38 |
Factors affecting tax charge
The standard rate of UK corporation tax for the year was 19% (2021: 19%). An increase in the UK corporation tax rate from 19% to 25% (effective 1 April 2023) was substantively enacted on 24 May 2021.
11. Property, plant and equipment
|
Freehold property |
Leasehold improvements |
Fixtures & Fitting |
Computer equipment |
Motor vehicles |
Total |
|
|
£'000 |
£'000 |
£'000 |
£'000 |
£'000 |
£'000 |
|
|
Cost |
||||||
|
At 1 October 2021 |
210 |
6,356 |
3,629 |
840 |
53 |
11,088 |
|
Additions |
485 |
1,280 |
926 |
126 |
- |
2,817 |
|
Acquisition (note 26) |
- |
- |
15 |
- |
- |
15 |
|
Disposals |
- |
(623) |
(389) |
(370) |
- |
(1,382) |
|
At 30 September 2022 |
695 |
7,013 |
4,181 |
596 |
53 |
12,538 |
|
Depreciation |
||||||
|
At 1 October 2021 |
2 |
3,518 |
1,867 |
486 |
20 |
5,893 |
|
Depreciation charge for the year |
9 |
622 |
520 |
106 |
8 |
1,265 |
|
Disposals |
- |
(617) |
(341) |
(343) |
- |
(1,301) |
|
At 30 September 2022 |
11 |
3,523 |
2,046 |
249 |
28 |
5,857 |
|
Net book value |
||||||
|
At 30 September 2022 |
684 |
3,490 |
2,135 |
347 |
25 |
6,681 |
|
At 30 September 2021 |
208 |
2,838 |
1,762 |
354 |
33 |
5,195 |
Right of use of assets
|
Cost |
Leasehold Property |
Motor |
|
|
At 1 October 2021 |
12,919 |
174 |
13,093 |
|
Additions |
4,039 |
- |
4,039 |
|
Disposals |
(2,659) |
(129) |
(2,788) |
|
At 30 September 2022 |
14,299 |
45 |
14,344 |
|
Depreciation |
|||
|
At 1 October 2021 |
4,800 |
129 |
4,929 |
|
Depreciation Charge for the year |
2,221 |
40 |
2,261 |
|
Disposals |
(2,268) |
(129) |
(2,397) |
|
At 30 September 2022 |
4,753 |
40 |
4,793 |
|
Net Book Value |
|||
|
At 30 September 2022 |
9,546 |
5 |
9,551 |
|
At 30 September 2021 |
8,119 |
45 |
8,164 |
12. Intangible assets
|
Customer relationships |
Website |
Goodwill |
Total |
||
|
£'000 |
£'000 |
£'000 |
£'000 |
||
|
Cost |
|||||
|
At 1 October 2021 |
2,179 |
105 |
526 |
2,810 |
|
|
Additions |
28 |
- |
- |
28 |
|
|
Acquisition (note 26) |
200 |
- |
- |
200 |
|
|
At 30 September 2022 |
2,407 |
105 |
526 |
3,038 |
|
|
Amortisation |
|||||
|
At 1 October 2021 |
1,938 |
85 |
73 |
2,096 |
|
|
Amortisation charge for the year |
158 |
5 |
- |
163 |
|
|
Impairment |
- |
- |
- |
- |
|
|
At 30 September 2022 |
2,096 |
90 |
73 |
2,259 |
|
|
Net book value |
|||||
|
At 30 September 2022 |
311 |
15 |
453 |
779 |
|
|
At 30 September 2021 |
241 |
20 |
453 |
714 |
13. Investments
The Group has a minor holding in Big Screen Productions 5 LLP.
Big Screen Productions 5 LLP, whilst still trading, has wound down its operations and made a capital distribution equivalent to the value of the carrying value of the investment in 2015. The investment now has a £nil carrying value.
Group Investments
Details of the investments in which the group and company holds 20% or more of the nominal value of any class of share capital are as follows:
|
Name of company |
Holding |
Proportion of voting rights and shares held |
Activity |
|
Subsidiary undertaking |
|||
|
Ramsdens Financial Limited (Registered office: Unit 16 Parkway Centre, Coulby Newham, TS8 0TJ) |
Ordinary Shares |
100% |
Supply of foreign exchange services, pawnbroking, purchase of gold jewellery, jewellery retail and related financial services. |
14. Financial assets and financial liabilities
|
At 30 September 2022 |
Fair value through statement of comprehensive income |
Loans and receivables |
Financial liabilities at amortised cost |
Book value |
Fair value |
|
£'000 |
£'000 |
£'000 |
£'000 |
£'000 |
|
|
Financial assets |
|||||
|
Financial assets at amortised cost |
- |
12,683 |
- |
12,683 |
12,683 |
|
Cash and cash equivalents |
- |
15,278 |
- |
15,278 |
15,278 |
|
Financial liabilities |
|||||
|
Trade and other payables |
- |
- |
(8,700) |
(8,700) |
(8,700) |
|
Interest bearing loans and borrowings |
- |
- |
(6,443) |
(6,443) |
(6,443) |
|
Lease liabilities |
- |
- |
(9,957) |
(9,957) |
(9,957) |
|
Net financial assets/(liabilities) |
- |
27,961 |
(25,100) |
2,861 |
2,861 |
|
At 30 September 2021 |
Fair value through statement of comprehensive income |
Loans and receivables |
Financial liabilities at amortised cost |
Book value |
Fair value |
|
£'000 |
£'000 |
£'000 |
£'000 |
£'000 |
|
|
Financial assets |
|||||
|
Financial assets at amortised cost |
- |
9,723 |
9,723 |
9,723 |
|
|
Cash and cash equivalents |
- |
13,032 |
- |
13,032 |
13,032 |
|
Financial liabilities |
|||||
|
Trade and other payables |
- |
- |
(7,514) |
(7,514) |
(7,514) |
|
Lease liabilities |
- |
- |
(8,601) |
(8,601) |
(8,601) |
|
Net financial assets/(liabilities) |
- |
22,755 |
(16,115) |
6,440 |
6,440 |
Financial assets at amortised cost shown above comprises trade receivables, other receivables and pledge accrued income as disclosed in note 16.
Trade and other payables comprise of trade payables, other payables as disclosed in notes 18 & 19
Loans and receivables are non-derivatives financial assets carried at amortised cost which generate a fixed or variable interest income for the Group. The carrying value may be affected by changes in the credit risk of the counterparties.
Management have assessed that for cash and short-term deposits, trade receivables, trade payables, bank overdrafts and other current liabilities their fair values approximate to their carrying amounts largely due to the short-term maturities of these instruments. Book values are deemed to be a reasonable approximation of fair values.
Financial Risks
The Group monitors and manages the financial risks relating to the financial instruments held. The principal risks include credit risk on financial assets, and liquidity and interest rate risk on financial liability borrowings. The key risks are analysed below.
Credit risk
Pawnbroking loans
Pawnbroking loans are not credit impaired at origination as customers are expected to repay the capital plus interest due at the contractual term. The Group is exposed to credit risk through customers defaulting on their loans. The key mitigating factor to this risk is the requirement for the borrower to provide security (the pledge) in entering a pawnbroking contract. The security acts to minimise credit risk as the pledged item can be disposed of to realise the loan value on default.
The Group estimates that the current fair value of the security is equal to the current book value of pawnbroking receivables.
In addition to holding security, the Group further mitigates credit risk by:
1) Applying strict lending criteria to all pawnbroking loans. Pledges are rigorously tested and appropriately valued. In all cases where the Group lending policy is applied, the value of the pledged items is in excess of the pawn loan.
2) Seeking to improve redemption ratios. For existing customers, loan history and repayment profiles are factored into the loan making decision. The Group has a high customer retention ratio and all customers are offered high customer service levels.
3) The carrying value of every pledge comprising the pawnbroking loans is reviewed against its expected realisation proceeds should it not be redeemed and expected credit losses are provided for based on current and historical non redemption rates.
The Group continually monitors, at both store and at Board level, its internal controls to ensure the adequacy of the pledged items. The key aspects of this are:
- Appropriate details are kept on all customers the Group transacts with;
- All pawnbroking contracts comply with the Consumer Credit Act 2006;
- Appropriate physical security measures are in place to protect pledged items; and
- An internal audit department monitors compliance with policies at the Group's stores.
Expected Credit losses
The Group measures loss allowances for pawnbroking loans using IFRS 9 expected credit losses model. The Group's policy is to begin the disposal process one month after the loan expiry date unless circumstances exist indicating the loan may not be credit impaired.
2022 2021
|
Category |
Gross amount £'000 |
Loss allowance £'000 |
Net carrying amount £'000 |
Gross amount £'000 |
Loss allowance £'000 |
Net carrying amount £'000 |
|
Performing |
9,510 |
178 |
9,332 |
6,747 |
173 |
6,574 |
|
Default |
3,366 |
844 |
2,522 |
3,127 |
528 |
2,599 |
|
Total |
12,876 |
1,022 |
11,854 |
9,874 |
701 |
9,173 |
The pawnbroking expected credit losses which have been provided on the period end pawnbroking assets are:
|
Pawnbroking loans |
|||
|
£'000 |
|||
|
At 1 October 2020 |
1,521 |
||
|
Statement of comprehensive income charge |
847 |
||
|
Utilised in the period |
(1,667) |
||
|
At 30 September 2021 |
701 |
||
|
Statement of comprehensive income charge |
1,434 |
||
|
Utilised in period |
(1,113) |
||
|
Balance at 30 September 2022 |
1,022 |
||
A 1% increase/(decrease) in the Group's redemption ratio is a reasonably possible variance based on historical trends and would result in an impact on Group pre-tax profit of £6k/(£6k). A one month increase/(decrease) in the Group's time to sell assumption is a reasonably possible variance based on historical trends and would result in an impact on Group pre tax profit of (£100k)/£100k.
Cash and cash equivalents
The cash and cash equivalents balance comprise of both bank balances and cash floats at the stores. The bank balances are subject to very limited credit risk as they are held with banking institutions with high credit ratings assigned by international credit rating agencies. The cash floats are subject to risks similar to any retailer, namely theft or loss by employees or third parties. These risks are mitigated by the security systems, policies and procedures that the Group operates at each store, the Group recruitment and training policies and the internal audit function.
Market risk
Pawnbroking trade receivables
The collateral which protects the Group from credit risk on non-redemption of pawnbroking loans is principally comprised of gold, jewellery items and watches. The value of gold items held as security is directly linked to the price of gold. The Group is therefore exposed to adverse movements in the price of gold on the value of the security that would be attributable for sale in the event of default by the borrower.
The Group considers this risk to be limited for a number of reasons. First of all, the Group applies conservative lending policies in pawnbroking pledges reflected in the margin made on retail sales and scrap gold when contracts forfeit. The Group is also protected due to the short-term value of the pawnbroking contract. In the event of a significant drop in the price of gold, the Group could mitigate this risk by reducing its lending policy on pawnbroking pledges, by increasing the proportion of gold sold through retail sales or by entering gold hedging instruments. Management monitors the gold price on a constant basis.
Considering areas outside of those financial assets defined under IFRS 9, the Group is subject to higher degrees of pricing risk. The price of gold will affect the future profitability of the Group in three key ways:
i) A lower gold price will adversely affect the scrap disposition margins on existing inventory, whether generated by pledge book forfeits or direct purchasing. While scrap profits will be impacted immediately, retail margins may be less impacted in the short term.
ii) While the Group's lending rates do not track gold price movements in the short term, any sustained fall in the price of gold is likely to cause lending rates to fall in the longer term thus potentially reducing future profitability.
iii) A lower gold price may reduce the attractiveness of the Group's gold purchasing operations.
Conversely, a lower gold price may dampen competition as lower returns are available and hence this may assist in sustaining margins and volumes.
Financial assets
The Group is not exposed to significant interest rate risk on the financial assets, other than cash and cash equivalents, as these are lent at fixed rates, which reflect current market rates for similar types of secured or unsecured lending, and are held at amortised cost.
Cash and cash equivalents are exposed to interest rate risk as they are held at floating rates, although the risk is not significant as the interest receivable is not significant.
The foreign exchange cash held in store is exposed to the risks of currency fluctuations. The value exposed is mainly in Euro and US dollars. There is the daily risk of buying today, receiving the currency the next day, and subsequently selling it and being susceptible to movements in the exchange rate. The Company uses monthly forward contracts to hedge against adverse exchange rate movements in its two key currencies, Euros and US dollars. There are no contracts in place at the year end.
Liquidity risk
Cash and cash equivalents
Bank balances are held on short term / no notice terms to minimise liquidity risk.
Trade and other payables
Trade and other payables are non-interest bearing and are normally settled on 30 day terms, see note 18.
Borrowings
The maturity analysis of the cash flows from the group's borrowing arrangements that expose the group to liquidity risk are as follows:
|
As at 30 September 2022 |
<3 months £'000 |
3-12 months £'000 |
1-5 years £'000 |
>5 years £'000 |
Total £'000 |
|
Lease liabilities |
422 |
1,664 |
6,426 |
1,445 |
9,957 |
|
Trade payables |
4,870 |
- |
- |
- |
4,870 |
|
Interest bearing loans and borrowings |
6,443 |
- |
- |
- |
6,443 |
|
Total |
11,735 |
1,664 |
6,426 |
1,445 |
21,270 |
|
As at 30 September 2021 |
<3 months £'000 |
3-12 months £'000 |
1-5 years £'000 |
>5 years £'000 |
Total £'000 |
|
Lease liabilities |
621 |
1,757 |
5,388 |
2,579 |
10,345 |
|
Trade payables |
5,406 |
- |
- |
- |
5,406 |
|
Total |
6,027 |
1,757 |
5,388 |
2,579 |
15,751 |
The interest charged on bank borrowings is based on a fixed percentage above Bank of England base rate. There is therefore a cash flow risk should there be any upward movement in base rates. Assuming the £10million revolving credit facility was fully utilised then a 1% increase in the base rate would increase finance costs by £100,000 pre-tax and reduce post-tax profits by £81,000.
15. Inventories
|
2022 |
2021 |
|||
|
£'000 |
£'000 |
|||
|
New and second-hand inventory for resale (at lower of cost or net realisable value) |
22,764 |
15,151 |
16. Trade and other receivables
|
2022 |
2021 |
|||
|
£'000 |
£'000 |
|||
|
Trade receivables - Pawnbroking |
11,854 |
9,173 |
||
|
Trade receivables - other |
601 |
489 |
||
|
Other receivables |
228 |
61 |
||
|
Prepayments |
581 |
656 |
||
|
13,264 |
10,379 |
Trade receivables - Pawnbroking is disclosed net of expected credit losses, details of which are shown in note 14.
17. Cash and cash equivalents
|
2022 |
2021 |
|||
|
£'000 |
£'000 |
|||
|
Cash and cash equivalents |
15,278 |
13,032 |
Cash and cash equivalents comprise cash held by the Group and short-term bank deposits.
Further details on financial instruments, including the associated risks to the Group and allowances for expected credit losses is provided in note 14.
18. Trade and other payables (current)
|
2022 |
2021 |
|||
|
£'000 |
£'000 |
|||
|
Trade payables |
4,870 |
5,406 |
||
|
Other payables |
844 |
767 |
||
|
Other taxes and social security |
293 |
277 |
||
|
Accruals |
2,858 |
1,170 |
||
|
Contract liabilities |
40 |
53 |
||
|
Subtotal |
8,905 |
7,673 |
||
|
Lease liabilities (note 20) |
2,086 |
2,159 |
||
|
Interest bearing loans and borrowings |
6,443 |
- |
||
|
Income tax liabilities |
932 |
61 |
||
|
18,366 |
9,893 |
Terms and conditions of the above financial liabilities:
· Trade and other payables are non-interest bearing and are normally settled on up to 60-day terms
For explanations on the Group's liquidity risk management processes, refer to note 14.
Bank borrowings
Details of the RCF facility are as follows:
|
Key Term |
Description |
|||||
|
Facility |
Revolving Credit Facility with Clydesdale Bank Plc (trading as Yorkshire Bank) |
|||||
|
Total facility size |
£10m |
|||||
|
Termination date |
March 2024. |
|||||
|
Utilisation |
The £10m facility is available subject to the ratio of cash at bank in hand (inclusive of currency balances) to the RCF borrowing exceeding 1.5 as stipulated in the banking agreement. |
|||||
|
Interest |
Interest is charged on the amount drawn down at 2.4% above base rate when the initial drawdown is made and for unutilised funds interest is charged at 0.84% from the date when the facility was made available. The base rate is reset to the prevailing rate at every interest period which is typically one and three months. |
|||||
|
Interest Payable |
Interest is payable at the end of a drawdown period which is typically between one and three months. |
|||||
|
Repayments |
The facility can be repaid at any point during its term and re-borrowed. |
|||||
|
Security |
The facility is secured by a debenture over all the assets of Ramsdens Financial Ltd and cross guarantees and debentures have been given by Ramsdens Holdings PLC. |
|||||
|
Undrawn facilities |
At 30 September 2022 the group had available £3.5m of undrawn committed facilities. |
|||||
19. Non-current liabilities
|
2022 |
2021 |
|||
|
£'000 |
£'000 |
|||
|
Lease liabilities (note 20) |
7,871 |
6,442 |
||
|
Contract liabilities |
88 |
119 |
||
|
Deferred tax (note 10) |
149 |
118 |
||
|
8,108 |
6,679 |
20. Lease Liability
|
2022 |
2021 |
|||
|
£'000 |
£'000 |
|||
|
Lease Liabilities as at 1 October |
8,601 |
9,099 |
||
|
Additions |
4,039 |
2,506 |
||
|
Disposals |
(472) |
(700) |
||
|
Interest |
396 |
388 |
||
|
Payments |
(2,607) |
(2,692) |
||
|
As at 30 September |
9,957 |
8,601 |
||
|
Current lease liability |
2,086 |
2,159 |
||
|
Non-current lease liability |
7,871 |
6,442 |
The cash flows relating to financing activities for repayment of lease principal amounts is £2,211,000 (2021: £2,304,000). Amounts repaid in the year are shown in the consolidated Statement of Cash Flows.
Short term lease payments recognised in administrative expenses in the year total £470,000 (2021: £441,000). The maturity analysis of lease liabilities is disclosed in note 14, the finance cost associated with lease liabilities is disclosed in note 6, and the depreciation and impairment of right-of-use assets associated with lease liabilities are disclosed is note 11.
21. Issued capital and reserves
|
Ordinary shares issued and fully paid |
No. |
£'000 |
||
|
At 30 September 2021 |
31,393,207 |
314 |
||
|
Issued during the year |
250,000 |
2 |
||
|
At 30 September 2022 |
31,643,207 |
316 |
||
Capital risk management
The Group manages its capital to ensure that entities in the Group will be able to continue as going concerns while maximising the return to stakeholders through the optimisation of the debt and equity balance. The capital structure of the Group consists of cash and cash equivalents and equity attributable to the equity holders of the parent, comprising issued capital, reserves and retained earnings. The Group has a debt facility as disclosed in note 18.
22. Dividends
Amounts recognised as distributions to equity holders in the year:
|
2022 £'000 |
2021 £'000 |
|
|
Final dividend for the year ended 30 September 2021 of 1.2p per share |
377 |
- |
|
Interim dividend for the period ended 30 September 2022 of 2.7p per share (30 September 2020 Nil) |
854 |
- |
|
1,231 |
- |
|
|
Amounts proposed and not recognised: |
||
|
Final dividend for the year ended 30 September 2022 of 6.3p per share (Final dividend for 30 September 2021 of 1.2p per share) |
1,994 |
377 |
The proposed final dividend is subject to approval at the Annual General Meeting and accordingly has not been included as a liability in these financial statements.
23. Pensions
The company operates a defined contribution scheme for its directors and employees. The assets of the scheme are held separately from those of the company in an independently administered fund.
The outstanding pension contributions at 30 September 2022 are £62,000 (2021: £57,000)
24. Related party disclosures
Ultimate controlling party
The Company has no controlling party.
Transactions with related parties
Transactions between the Company and its subsidiaries, which are related parties, have been eliminated on consolidation and are not disclosed in this note.
Transactions with key management personnel
The remuneration of the directors of the Company, who are the key management personnel of the Group, is set out below in aggregate:
|
2022 |
2021 |
|||
|
£'000 |
£'000 |
|||
|
Short term employee benefits |
880 |
688 |
||
|
Post employment benefits |
22 |
39 |
||
|
Share based payments |
136 |
139 |
||
|
1,038 |
866 |
25. Share based payments
The Company operates a Long-term Incentive Plan (LTIP). The charge for the year in respect of the scheme was:
|
2022 |
2021 |
|||
|
£'000 |
£'000 |
|||
|
LTIP |
314 |
254 |
The LTIP is a discretionary share incentive scheme under which the Remuneration Committee of Ramsdens Holdings PLC can grant options to purchase ordinary shares at nominal 1p per share cost to Executive Directors and other senior management. A reconciliation of LTIP options is set out below:
|
Number of conditional Shares |
Weighted average exercise price in pence |
||
|
Outstanding at the beginning of the year |
1,126,500 |
- |
|
|
Granted during the year |
338,000 |
- |
|
|
Forfeited during the year |
(220,000) |
- |
|
|
Exercised during the year |
(250,000) |
1 |
|
|
Outstanding at the end of the year |
994,500 |
The options vest according to the achievement against two criteria
Total Shareholder Return - TSR - 50% of options awarded
Earnings per Share - EPS - 50% of options awarded
The Fair value of services received in return for share options granted is based on the fair value of share options granted and are measured using the Monte Carlo method for TSR performance condition as this is classified as a market condition under IFRS2 and using the Black Scholes method for the EPS performance condition which is classified as a non- market condition under IFRS2. The fair values have been computed by an external specialist and the key inputs to the valuation model were:
|
TSR Condition |
EPS Condition |
TSR Condition |
EPS Condition |
TSR Condition |
EPS Condition |
|
|
Model |
Monte Carlo |
Black Scholes |
Monte Carlo |
Black Scholes |
Monte Carlo |
Black Scholes |
|
Grant Date |
17/03/22 |
17/03/22 |
08/02/2021 |
08/02/2021 |
16/07/2019 |
16/07/2019 |
|
Share Price |
£1.67 |
£1.67 |
£1.48 |
£1.48 |
£1.88 |
£1.88 |
|
Exercise Price |
£0.01 |
£0.01 |
£0.01 |
£0.01 |
£0.01 |
£0.01 |
|
Vesting period |
2.5 years |
2.5 years |
2.64 years |
2.64 years |
2.71 years |
2.71 years |
|
Risk Free return |
1.4% |
1.4% |
0.01% |
0.01% |
0.5% |
0.5% |
|
Volatility |
53% |
53% |
51% |
51% |
26% |
26% |
|
Dividend Yield |
3.5% |
3.5% |
0.0% |
0.0% |
3.9% |
3.9% |
|
Fair value of Option (£) |
0.77 |
1.51 |
0.64 |
1.47 |
0.52 |
1.68 |
Early exercise of the options is permitted if a share award holder ceases to be employed by reason of death, injury, disability, or sale of the Company. The maximum term of the share options is 10 years.
26. Fair value of acquisition
On the 14th February 2022 the company purchased the trade and certain assets of Geo A Payne & Son Limited for a total consideration of £909,000, which was fully paid in cash. The fair value of the assets acquired were as follows:
|
£'000 |
||||
|
Tangible fixed assets (fixtures and fittings |
15 |
|||
|
Intangible assets (customer relationships) |
200 |
|||
|
Trade receivables - Pawnbroking |
302 |
|||
|
Inventories |
392 |
|||
|
Net assets acquired |
909 |
27. Post Balance Sheet Events
There were no post balance sheets events that require further disclosure in the financial statements.
28. Cash and cash equivalents
|
30 September |
30 September |
|||
|
2022 |
2021 |
|||
|
£'000 |
£'000 |
|||
|
Sterling cash and cash equivalents |
5,190 |
7,747 |
||
|
Other currency cash and cash equivalents |
10,088 |
5,285 |
||
|
15,278 |
13,032 |
|
Parent Company Statement of Financial Position As at 30 September 2022 |
|||||
|
2022 |
2021 |
||||
|
Notes |
|||||
|
Assets |
£'000 |
£'000 |
|||
|
Non-current assets |
|||||
|
Investments |
D |
8,383 |
8,205 |
||
|
Deferred tax |
E |
37 |
80 |
||
|
8,420 |
8,285 |
||||
|
Current assets |
|||||
|
Receivables |
F |
3,683 |
450 |
||
|
Cash and short-term deposits |
1 |
3,968 |
|||
|
3,684 |
4,418 |
||||
|
Total assets |
12,104 |
12,703 |
|||
|
Current liabilities |
|||||
|
Trade and other payables |
G |
409 |
94 |
||
|
409 |
94 |
||||
|
Net current assets |
3,275 |
4,324 |
|||
|
Total assets less current liabilities |
11,695 |
12,609 |
|||
|
Net assets |
11,695 |
12,609 |
|||
|
Equity |
|||||
|
Issued capital |
H |
316 |
314 |
||
|
Share Premium |
4,892 |
4,892 |
|||
|
Retained earnings |
6,487 |
7,403 |
|||
|
Total equity |
11,695 |
12,609 |
|||
|
The loss after tax for the Company for the year ended 30 September 2022 was £9,000 (2021: Profit £55,000) These financial statements were approved by the directors and authorised for issue on 16 January 2023 and signed on their behalf by: |
|||||
|
M A Clyburn |
|||||
|
Chief Financial Officer |
|||||
|
Company Registration Number: 8811656 |
|||||
|
Parent Company statement of changes in equity |
||||
|
For the year ended 30 September 2022 |
||||
|
Share Capital |
Share premium |
Retained earnings |
Total |
|
|
£'000 |
£'000 |
£'000 |
£'000 |
|
|
As at 1 October 2020 |
308 |
4,892 |
7,180 |
12,380 |
|
Profit for the year |
- |
- |
55 |
55 |
|
Total comprehensive income |
- |
- |
55 |
55 |
|
Transactions with owners: |
||||
|
Issue of share capital |
6 |
- |
- |
6 |
|
Share based payments |
- |
- |
254 |
254 |
|
Deferred tax on share based payments |
- |
- |
(86) |
(86) |
|
Total transactions with owners |
6 |
- |
168 |
174 |
|
As at 30 September 2021 |
314 |
4,892 |
7,403 |
12,609 |
|
As at 1 October 2021 |
314 |
4,892 |
7,403 |
12,609 |
|
Loss for the period |
- |
- |
(9) |
(9) |
|
Total comprehensive income |
- |
- |
(9) |
(9) |
|
Transactions with owners: |
||||
|
Issue of share capital |
2 |
- |
- |
2 |
|
Dividends paid (note I) |
- |
- |
(1,231) |
(1,231) |
|
Share based payments |
- |
- |
314 |
314 |
|
Deferred tax on share based payments |
- |
- |
10 |
10 |
|
Total transactions with owners |
2 |
- |
(907) |
(905) |
|
As at 30 September 2022 |
316 |
4,892 |
6,487 |
11,695 |
Notes to the parent company financial statements
A. ACCOUNTING POLICIES
BASIS OF PREPARATION
Ramsdens Holdings PLC (the "Company") is a public limited company incorporated and domiciled in England and Wales. The registered office of the Company is Unit 16, Parkway Shopping Centre, Coulby Newham, Middlesbrough, TS8 0TJ. The registered company number is 08811656. A list of the Company's subsidiaries is presented in note D.
The principal activities of the Company and its subsidiaries (the "Group") are the supply of foreign exchange services, pawnbroking and related financial services, jewellery sales, and the purchase of gold jewellery from the general public.
The separate financial statements of the Company are presented as required by the Companies Act 2006. The Company meets the definition of a qualifying entity under FRS 100 (Financial Reporting Standard 100) issued by the Financial Reporting Council. Accordingly, the financial statements have been prepared in accordance with FRS 101 (Financial Reporting Standard 101) 'Reduced disclosure Framework' as issued by the FRC in July 2015 and July 2016
The financial statements have been prepared on the historical cost basis.
As permitted by FRS 101, the Company has taken advantage of the disclosure exemptions available under that standard in relation to business combinations, share-based payment, non-current assets held for sale, financial instruments, capital management, presentation of comparative information in respect of certain assets, presentation of a cash-flow statement, standards not yet effective, impairment of assets and related party transactions.
Where required, equivalent disclosures are given in the Group financial statements of Ramsdens Holdings PLC. The Group financial statements of Ramsdens Holdings PLC are available to the public.
The financial statements have been prepared on a going concern basis as discussed in the Directors' Report.
The particular accounting policies adopted are described below.
TAXATION
Current tax
The tax currently payable is based on taxable profit for the year. The Company's liability for current tax is calculated using tax rates and laws that have been enacted or substantively enacted by the date of the statement of financial position.
Deferred tax
Deferred tax is the tax expected to be payable or recoverable on differences between the carrying amounts of assets and liabilities in the financial statements and the corresponding tax bases used in the computation of taxable profit, and is accounted for using the balance sheet liability method. Deferred tax liabilities are generally recognised for all taxable temporary differences and deferred tax assets are recognised to the extent that it is probable that taxable profits will be available against which deductible temporary differences can be utilised. Such assets and liabilities are not recognised if the temporary difference arises from the initial recognition of goodwill or from the initial recognition (other than in a business combination) of other assets and liabilities in a transaction that affects neither the taxable profit nor the accounting profit.
INVESTMENTS
Fixed assets investments are shown at cost less provision for impairment.
FINANCIAL LIABILITIES AND EQUITY
Financial liabilities and equity instruments are classified according to the substance of the contractual arrangements entered into. An equity instrument is any contract that evidences a residual interest in the assets of the company after deducting liabilities
Equity instruments issued are recorded at the proceeds received, net of direct issue costs.
DIVIDENDS
Dividends receivable from subsidiary undertakings are recorded in the statement of comprehensive income on the date that the dividend becomes a binding liability on the subsidiary company.
Dividends payable are recorded as a distribution from retained earnings in the period in which they become a binding liability on the Company.
Employee Share Incentive Plans
Ramsdens Holdings PLC grants equity settled share option rights to the parent entity's equity instruments to certain directors and senior staff members under a LTIP (Long term incentive Plan). The employee share options are measured at fair value at the date of grant by the use either the Black- Scholes Model or a Monte Carle model depending on the vesting conditions attached to the share option. The fair value is expensed on a straight line basis over the vesting period based on an estimate of the number of options that will eventually vest. The expense is recognised in the entity in which the beneficiary is remunerated. The share based payment expense in the period which relates to subsidiaries increases the carrying value of the investment held.
B. COMPANY STATEMENT OF COMPREHENSIVE INCOME
As permitted by s408 of the Companies Act 2006 the Company has elected not to present its statement of comprehensive income for the year.
The auditor's remuneration for the current and preceding financial years is borne by a subsidiary undertaking, Ramsdens Financial Limited. Note 7 to the Group financial statements discloses the amount paid.
C. STAFF AND KEY PERSONNEL COSTS
Other than the Directors who are the key personnel, the Company has no employees, details of their remuneration are set out below
|
2022 |
2021 |
|
|
£'000 |
£'000 |
|
|
Remuneration receivable |
880 |
489 |
|
Social security cost |
65 |
90 |
|
Value of company pension contributions to money purchase schemes |
22 |
23 |
|
Share based payments |
136 |
95 |
|
1,103 |
697 |
Some of the directors of the Company are also directors of Ramsdens Financial Ltd. These directors did not receive remuneration from Ramsdens Financial Limited and amounts paid through the Company were £947,000 (2021: £519,000). The directors do not believe it is practicable to apportion this amount between their services as directors of the Company and other group companies.
Remuneration of the highest paid director:
|
2022 |
2021 |
|
|
£'000 |
£'000 |
|
|
Remuneration receivable |
427 |
201 |
|
Value of company pension contributions to money purchase schemes |
10 |
10 |
|
Share Based Payments |
82 |
60 |
|
519 |
271 |
The number of directors accruing retirement benefits under the money purchase scheme is 2 (2020: 2)
D. INVESTMENTS
|
Shares in subsidiary undertakings |
2022 |
2021 |
|
£'000 |
£'000 |
|
|
Cost |
||
|
Cost brought forward |
8,205 |
8,046 |
|
Additions - Share based payments |
178 |
159 |
|
Cost carried forward |
8,383 |
8,205 |
Additions represent share based payment expense recognised in Ramsdens Financial Limited.
The Investments in Group Companies which are included in the consolidated statements are as follows
|
Name of company |
Holding |
Proportion of voting rights and shares held |
Activity |
|
Subsidiary undertakings |
|||
|
Ramsdens Financial Limited (Registered office: Unit 16 Parkway Centre, Coulby Newham, TS8 0TJ) |
Ordinary Shares |
100% |
Supply of foreign exchange services, pawnbroking, purchase of gold jewellery, jewellery retail and related financial services. |
E. DEFERRED TAX
Deferred tax relates to the following:
|
2022 £'000 |
2021 £'000 |
|||
|
Deferred tax assets |
||||
|
Share based payments |
37 |
80 |
||
|
37 |
80 |
|
Reconciliation of deferred tax assets |
|||
|
2022 |
2021 |
||
|
£'000 |
£'000 |
||
|
Opening balance as of 1 October / 1 April |
80 |
182 |
|
|
Deferred tax credit recognised in the statement of comprehensive income |
(53) |
(64) |
|
|
Other deferred tax |
10 |
(38) |
|
|
Closing balance as at 30 September |
37 |
80 |
F. RECEIVABLES
|
2022 |
2021 |
|
|
£'000 |
£'000 |
|
|
Amounts owed by subsidiary companies |
3,671 |
439 |
|
Prepayments |
12 |
11 |
|
3,683 |
450 |
Amounts owed by subsidiary companies is payable on demand and no interest is charged.
G LIABILITIES: AMOUNTS FALLING DUE WITHIN ONE YEAR
|
2022 |
2021 |
|
|
£'000 |
£'000 |
|
|
Trade Payables |
10 |
10 |
|
Other Creditors |
379 |
63 |
|
Other taxes and Social Security |
20 |
21 |
|
Current tax liabilities |
- |
- |
|
409 |
94 |
H. CALLED UP SHARE CAPITAL
Details of the called up share capital including share shares issued during the year can be found in note 21 within the Group financial statements of Ramsdens Holdings PLC.
I. Dividends
Amounts recognised as distributions to equity holders in the year:
|
2022 £'000 |
2021 £'000 |
|
|
Final dividend for the year ended 30 September 2021 of 1.2p per share |
377 |
- |
|
Interim dividend for the period ended 30 September 2022 of 2.7p per share (30 September 2020 Nil) |
854 |
- |
|
1,231 |
- |
|
|
Amounts proposed and not recognised: |
||
|
Final dividend for the year ended 30 September 2022 of 6.3p per share (Final dividend for 30 September 2021 of 1.2p per share) |
1,994 |
377 |
The proposed final dividend is subject to approval at the Annual General Meeting and accordingly has not been included as a liability in these financial statements.
J. POST BALANCE SHEET EVENTS
There were no post balance sheets events that require further disclosure in the financial statements.