
4 September 2025
BROOKS MACDONALD GROUP PLC
2025 Full-year results
Brooks Macdonald Group plc ("Brooks Macdonald" or the "Group") today announces full-year results for the financial year ended 30 June 2025.
Andrea Montague, CEO of Brooks Macdonald, commented:
"This year we have focused on the execution of our strategy to Reignite Growth.
We are now a UK-focused wealth manager. We have created a scalable financial planning business. We have launched a suite of Retirement Strategies that meet a growing client need and continue to deliver strong investment performance.
We are building momentum and creating the conditions for success. I am confident in the outlook for the current financial year and beyond."
Financial highlights1
· Total funds under management and advice ("FUMA") increased by 17.3% to £19.2 billion (30 June 2024: £16.4 billion). Of this, funds under management ("FUM") was £16.6 billion and advised only assets were £2.6 billion.
· Full-year net outflows of £0.4 billion, with a marked improvement in the second half of the financial year (H2 2025 net outflows £0.1 billion, H1 2025 net outflows £0.3 billion).
· Revenue increased 4.6% to £111.6 million, supported by higher financial planning income following the acquisitions, partly offset by lower interest income and lower fee income.
· Underlying costs, excluding acquisitions, remained flat compared with the prior year, reflecting strict cost discipline. Total underlying costs, including acquisitions and net finance income, increased by 8.2% to £82.7 million.
· Underlying profit before tax ("PBT") reduced by 4.6% to £28.9 million, representing a margin of 25.9%.
· Statutory PBT reduced to £17.5 million (2024: profit of £24.6 million) largely due to higher acquisition and integration costs, and profit after tax from discontinued operations was £9.4 million (2024: loss of £13.9 million). Total comprehensive income for the year was £21.0 million (2024: £6.5 million).
· Proposed final dividend of 51.0 pence per share, resulting in a full-year dividend of 81.0 pence per share, an increase of 3.8% vs prior year and the 20th consecutive year of dividend growth.
· Completed £8.1 million share buyback, acquiring and cancelling 538,000 shares to date.
Strategic highlights
· Our strategy to 'Reignite Growth' is delivering.
· Sold Brooks Macdonald International ("BMI") and re-shaped the Group to be a UK-focused wealth manager.
· Completed three financial planning acquisitions and successfully launched Brooks Financial.
· New experienced leadership, executing at pace.
· Significant increase in client engagement over the year, and improved brand awareness.
· Strong investment performance, with all five risk profiles across our BPS offering exceeding their respective ARC peer group comparator over one-, three-, five- and 10-year horizons.
· Expanded product offering with the launch of Global MPS and new suite of Retirement Strategies, including a solution available on third-party platforms.
· Moved from AIM to the Main market of the London Stock Exchange ("LSE").
· Defaqto Gold award for Discretionary Fund Management Service for fourth consecutive year.
Key financials
|
£ millions unless stated otherwise |
2025 |
20241 |
Change |
|
Revenue |
111.6 |
106.7 |
4.6% |
|
Underlying operating expenses2 3 |
82.7 |
76.4 |
8.2% |
|
Underlying operating PBT3 |
28.9 |
30.3 |
(4.6)% |
|
Underlying operating profit margin3 |
25.9% |
28.4% |
2.5ppts |
|
Statutory PBT |
17.5 |
24.6 |
(28.9)% |
|
Underlying diluted earnings per share3 |
130.4p |
150.9p |
(13.6)% |
|
Statutory diluted earnings per share |
71.4p |
124.5p |
(42.7)% |
|
Dividend per share |
81.0p |
78.0p |
3.8% |
Outlook
We remain focused on delivering our Reignite Growth strategy. This includes continued organic investment to expand our technology and AI enablement, enhancing client service and our efficiency, as well as evaluating M&A opportunities, that align with our strategy.
Regular client engagement remains the key priority. We will be evolving our product offering, to ensure we can continue to meet the needs of our clients, throughout their financial lifecycle.
We are creating the conditions for success and see exciting growth opportunities in front of us in the year ahead.
2025 full-year results presentation
A presentation to investors and financial analysts, including a recorded webcast will be published on our website shortly, and can be found on: https://www.brooksmacdonald.com/investor-relations/results-centre
A Q&A session with Andrea Montague, CEO, and Katherine Jones, CFO, will be held at 9.00am BST on 4 September 2025, via a live webcast, or by dialling in using the conference call details below. Registration for the webcast is required and can be accessed via a link: https://brrmedia.news/BrooksMacdonaldFYResults2025
Dial in numbers:
UK-wide: +44 (0) 33 0551 0200
UK toll free: +44 (0) 808 109 0700
Password (if prompted): Quote 'Brooks Macdonald - FY Results'
Investor enquiries
Brooks Macdonald
Andrea Montague, CEO
Katherine Jones, CFO
Eva Hatfield, Director of Investor Relations +44 (0) 7418 923 061
Email: eva.hatfield@brooksmacdonald.com
Media enquiries
Misha Bayliss +44 (0) 20 74275465
Oscar Burnett +44 (0) 20 74275435
Email: brooksmacdonald@teneo.com
About Brooks Macdonald
Brooks Macdonald Group plc is a leading UK-focused wealth manager.
Proudly serving IFAs and clients since 1991, Brooks Macdonald is independent, financially strong, and aims to deliver strong and consistent investment performance for clients to meet their financial objectives. Brooks Macdonald provides innovative investment solutions to support IFAs and their clients throughout their entire lives as needs and circumstances change. The company is recognised as an innovator in the industry having been one of the first to develop and launch key products such as Managed Portfolio Service.
Realising Ambitions. Securing Futures. We are Brooks Macdonald.
Notes:
Numbers are subject to rounding.
1. The prior financial year has been restated to separate the results of discontinued operations, consistent with the presentation in the current financial year.
2. Includes net finance income of £2.5 million (2024: £2.4 million).
3. A reconciliation between the underlying measure and its closest IFRS equivalent can be found in the Financial Review section of this announcement.
Forward-looking statements
This announcement may include statements, beliefs or opinions that are, or may be deemed to be, "forward-looking statements". These forward-looking statements may be identified by the use of forward-looking terminology, including the terms "believes", "estimates", "plans", "projects", "anticipates", "targets", "aims", "continues", "expects", "intends", "hopes", "may", "will", "would", "could" or "should" or, in each case, their negative or other variations or comparable terminology, or by discussions of strategy, plans, objectives, goals, future events or intentions. No representation or warranty is made that any of these statements or forecasts will come to pass or that any forecast results will be achieved. Forward-looking statements may and often do differ materially from actual results. Any forward-looking statements contained in the announcement speak only as of their respective dates, reflect Brooks Macdonald's current view with respect to future events and are subject to risks relating to future events and other risks, uncertainties and assumptions relating to Brooks Macdonald's business, results of operations, financial position, liquidity, prospects, growth and strategies.
Except as required by any applicable law or regulation, Brooks Macdonald expressly disclaims any obligation or undertaking to release publicly any updates or revisions to any forward-looking statements contained in this announcement or any other forward-looking statements it may make whether as a result of new information, future developments or otherwise.
CEO's statement
The year in review
I am pleased to present these results covering a year of change in the markets, for our sector and for our Company. Regulatory and government policy changes brought additional uncertainty and served to underline the need for trusted financial advice and wealth management now more than ever from Brooks Macdonald.
We have reshaped the business and are now a UK-focused wealth manager, positioned to invest in the growth opportunities across our market.
Our clients
Responding to feedback from our clients, we launched two new products in three months - Global Managed Portfolio Service and our innovative Retirement Strategies offering bespoke, tailored and modelled options to bring clients clarity, choice and confidence in their retirement planning.
Our Retirement Strategies launch builds on our experience in this key area of retirement planning. With the growth in defined contribution pension schemes, managing drawdown is a growing challenge for many more people as they approach retirement. We are one of the first companies to offer modelled solutions for income drawdown. Initial interest has been strong.
Our Centralised Investment Proposition ("CIP"), a competitive differentiator for Brooks Macdonald, delivered another year of strong performance. Our BPS investment strategies have outperformed their relevant ARC peer group indices over one, three, five, and 10 years across all risk profiles. Our diversified positioning across regions, sectors and styles ensures portfolios remain well-placed to capture opportunities and navigate the evolving macroeconomic landscape.
Our company
The sale of our international business focused Brooks Macdonald on the UK. The acquisition of three financial planning businesses scaled our financial advice business with new lines of business in mortgages, life insurance, benefits, sport and charities. Our business is about building trusted relationships, and this means we are spending more time with our valued IFAs and direct financial planning clients across the country. We continue to invest in our operating platform to provide quality client service.
In March, Brooks Macdonald moved from AIM to the Main Market of the LSE, broadening investor access.
Our performance
We reported FUMA of £19.2 billion (2024: £16.4 billion), driven by acquisitions and positive market and investment performance. FUM was up 7.0% in the year, with investment performance of £0.7 billion more than offsetting the impact of net outflows.
BPS outflows significantly improved in the second half along with strong inflows across our Platform MPS offering, especially in the final quarter, which delivered the best quarterly flow performance in two years with net outflows of £5 million. Our overall net outflows were at £396 million, with a notable improvement in the second half (H2 25: £134 million, H1 25: £262 million).
Revenue increased by 4.6% to £111.6 million (2024: £106.7 million), supported by higher financial planning revenue from acquired businesses, partially offset by lower interest and fee income. The underlying cost excluding acquisitions were flat on the prior year, demonstrating the strict cost control. The underlying profit before tax reduced to £28.9 million (2024: £30.3 million) and the underlying profit margin was 25.9% (2024: 28.4%). Statutory profit before tax fell to £17.5 million (2024: £24.6 million), primarily due to the acquisitions related costs.
Our people
As a wealth manager offering trusted financial advice, our people make the difference. We engage with our colleagues throughout the year through townhalls, small conversations and by visiting our offices. Our recent employee engagement survey has given valuable insight into views on career progression, learning and development, and our culture.
New appointments to our Executive Committee brought talent, expertise, diversity and experience. Together as a team, we have moved at pace to bring our strategy to life.
Looking ahead
In conclusion, it has been a busy year as we have refocused the Group, added new capabilities and strengthened our leadership team with new hires. We are changing the way we work to deliver excellent customer service, to extend our client reach and, as we grow, secure efficiencies. There is more to be done, and I am confident we are creating the conditions for success.
This coming year, we will continue to invest in growth, in technology and AI enablement to take our client service and efficiency to the next level. We will evolve our products so that they stand out in growth markets and continue to be relevant across all stages of our clients' financial lifecycle.
I want to thank all Brooks Macdonald colleagues for their contributions to our results and in the execution of our strategy and, most importantly, our clients for their support. Change brings opportunities and I remain confident in our future to live our purpose, to realise the ambitions and to secure the futures of our clients.
Andrea Montague
CEO
Financial Review
"I am pleased to report my first set of full-year results for Brooks Macdonald, delivering revenue growth alongside continued cost discipline. Following the acquisition of the three financial planning businesses, we have made good progress on integration and are well positioned as a UK-focused wealth manager to leverage our enhanced advice expertise and focus on driving and delivering our strategy to reignite growth."
Basis of presentation
During the 2025 financial year, we completed the sale of BMI, as well as the investment management contract of the SVS Brooks Macdonald Defensive Capital Fund ("DCF") (subsequently renamed SVS RM Defensive Capital Fund). As a result, the BMI operations and the DCF activities have been classified as discontinued operations in the 2025 results, and the prior year comparative financial information included in this report, has been restated in accordance with IFRS 5 'Non-current assets held for sale and discontinued operations'.
In addition, we completed three acquisitions during 2025 CST Wealth Limited ("CST Wealth"), Lucas Fettes (Holdings) Limited, with its wholly owned subsidiary, Lucas Fettes and Partners (Financial Services) Limited (together "Lucas Fettes"), and LIFT-Financial Group Limited and LIFT-Invest Limited (together "LIFT") (together "the acquisitions"). The financial results from the acquired businesses have been consolidated into the 2025 financial statements from their acquisition date, and so include eight months for CST Wealth, seven months for Lucas Fettes and five months for LIFT. Refer to note 14 of the consolidated financial statements for further information. The financial information is presented on a continuing basis, unless stated otherwise.
Financial results summary
The table below shows our financial performance for the years ended 30 June 2025 and 2024.
|
£ million (unless stated otherwise) |
2025 |
2024 restated1 |
|
Total FUMA (£'billion) |
19.2 |
16.4 |
|
Total FUM (£'billion) |
16.6 |
15.5 |
|
Net flows (£'billion) |
(0.4) |
(0.4) |
|
Fee income |
72.9 |
74.7 |
|
Financial planning income |
17.1 |
8.2 |
|
Transactional and FX income |
14.0 |
12.4 |
|
Interest income |
7.6 |
11.4 |
|
Total revenue |
111.6 |
106.7 |
|
Fixed staff costs |
(41.7) |
(37.2) |
|
Variable staff costs |
(10.3) |
(11.4) |
|
Total staff costs |
(52.0) |
(48.6) |
|
Non-staff costs |
(33.2) |
(30.2) |
|
Total underlying costs |
(85.2) |
(78.8) |
|
Net finance income |
2.5 |
2.4 |
|
Underlying profit before tax |
28.9 |
30.3 |
|
Underlying adjustments |
(11.4) |
(5.7) |
|
Statutory profit before tax |
17.5 |
24.6 |
|
Taxation |
(5.9) |
(4.2) |
|
Statutory profit after tax |
11.6 |
20.4 |
|
Result from discontinued operations |
9.4 |
(13.9) |
|
Total comprehensive income for the year |
21.0 |
6.5 |
1. The prior financial year has been restated to separate the results of discontinued operations, consistent with the presentation in the current financial year. Refer to note 13 for details of the results of discontinued operations. In addition, there has been an update to the results presented in the restated comparative period previously disclosed in the interim report and accounts for the six months ended 31 December 2024. Refer to the note 2 of the consolidated financial statements for further details.
Movements in FUMA, by service
|
£ million (unless stated otherwise) |
Opening assets 1 July 2024 restated1 |
Gross inflows |
Gross outflows |
Net flows |
Acquired |
Market and investment performance |
Closing assets 30 June 2025 |
Net flows growth |
FUM growth |
|
BPS |
8,880 |
649 |
(1,372) |
(723) |
- |
371 |
8,528 |
(8.1)% |
(4.0)% |
|
MPS Custody |
974 |
48 |
(157) |
(109) |
- |
41 |
906 |
(11.2)% |
(7.0)% |
|
MPS Platform |
4,367 |
1,682 |
(1,081) |
601 |
788 |
227 |
5,983 |
13.8% |
37.0% |
|
Total MPS |
5,341 |
1,730 |
(1,238) |
492 |
788 |
268 |
6,889 |
9.2% |
29.0% |
|
Funds |
1,323 |
210 |
(375) |
(165) |
- |
50 |
1,208 |
(12.5)% |
(8.7)% |
|
Total FUM |
15,544 |
2,589 |
(2,985) |
(396) |
788 |
689 |
16,625 |
(2.5)% |
7.0% |
|
Advised only assets |
826 |
1,751 |
2,577 |
||||||
|
Total FUMA |
16,370 |
2,539 |
19,202 |
17.3% |
1. The prior financial year has been restated to separate the results of discontinued operations, consistent with the presentation in the current financial year.
Total FUMA increased 17.3% to £19.2 billion (30 June 2024: restated £16.4 billion), as a result of recent acquisitions contributing £2.5 billion, and positive market and investment performance. Closing FUMA comprises total FUM of £16.6 billion (30 June 2024 restated: £15.5 billion) and advised only assets of £2.6 billion (30 June 2024: £0.8 billion).
Growth in FUM was largely driven by acquisitions, as well as market and investment performance, which added £0.7 billion. Total net outflows of £0.4 billion were broadly in line with the prior year (2024 restated: outflows £0.4 billion), with a marked improvement in net flows in the second half of the financial year (H2 2025 net outflows £0.1 billion, H1 2025 net outflows £0.3 billion). This reflects the benefit of management actions taken over the year, including extensive IFA roadshows and targeted meetings with clients. As a result, in the final quarter, we reported the best quarterly net flow performance in two years (net outflows of £5 million).
Net outflows across our BPS offering totalled £723 million (2024: outflows £558 million), with significant improvement in H2, driven by lower Core BPS outflows and higher inflows in our Retirement Strategies offering. This reflects the greater IFA outreach over the year, and key client engagement to promote our retirement offering. Overall, BPS FUM closed down 4.0% at £8.5 billion (30 June 2024: £8.9 billion).
MPS Platform reported net inflows of £601 million (2024: £467 million) representing growth of 13.8%. Of this total, MPS Platform saw organic net flows of £575 million and transfers from the acquired businesses contributed £26 million. Acquisitions added £0.8 billion of FUM and market and investment performance added a further £0.2 billion, leading to overall FUM growth of 37.0% to £6.0 billion (30 June 2024: £4.4 billion).
Advised only assets increased to £2.6 billion (30 June 2024: £0.8 billion) benefitting from £1.8 billion of acquired assets in the second half of the year. Over time, in line with our strategy and subject to client suitability, a greater proportion of these advised only assets may become managed and advised.
The market and investment performance of £0.7 billion represents 4.4% of opening FUM. Overall, we recorded a robust performance when compared to MSCI and ARC Benchmarks over the course of the financial year.
Revenue
Total revenue increased by 4.6% to £111.6 million (2024: £106.7 million). This was principally driven by financial planning income growing to £17.1 million (2024: £8.2 million), of which financial planning income from recent acquisitions contributed £8.2 million, and transactional and FX income of £14.0 million (2024: £12.4 million), which benefitted from increased trading volume in the financial year. This was partially offset by lower interest income, down 33.3% to £7.6 million (2024: £11.4 million), and fee income, which decreased by 2.4% to £72.9 million (2024: £74.7 million). The reduction in interest income was largely due to lower average interest rates over the year, while the reduction in fee income principally reflects mix effects, with stronger growth across lower margin MPS Platform offerings compared to the higher margin BPS offering, which experienced outflows.
Revenue, average FUM and yields
|
Revenue |
Average FUM |
Yields |
|||||||
|
2025 £m |
20241 £m |
Change % |
2025 £m |
20241 £m |
Change % |
2025 bps |
20241 bps |
Change bps |
|
|
BPS fees |
51.4 |
54.4 |
(5.6)% |
8,373 |
8,579 |
(2.4)% |
61.4 |
63.5 |
(2.1) |
|
BPS transactional and FX income |
14.0 |
12.2 |
14.7% |
16.7 |
14.2 |
2.5 |
|||
|
Total BPS |
65.4 |
66.6 |
(1.8)% |
8,373 |
8,579 |
(2.4)% |
78.1 |
77.7 |
0.4 |
|
MPS Custody |
5.4 |
5.8 |
(5.4)% |
929 |
972 |
(4.5)% |
58.6 |
59.2 |
(0.6) |
|
MPS Platform |
9.0 |
7.1 |
26.7% |
5,058 |
3,892 |
30.0% |
17.7 |
18.2 |
(0.5) |
|
Total MPS |
14.4 |
12.9 |
11.8% |
5,987 |
4,864 |
23.1% |
24.0 |
26.4 |
(2.4) |
|
Funds |
6.5 |
6.8 |
(3.7)% |
1,445 |
1,486 |
(2.8)% |
44.9 |
45.4 |
(0.5) |
|
Total (excluding interest income) |
86.3 |
86.3 |
0.0% |
15,805 |
14,929 |
5.9% |
54.6 |
57.8 |
(3.2) |
|
Interest income - BPS |
6.8 |
10.2 |
(33.0)% |
8.2 |
11.9 |
(3.7) |
|||
|
Interest income - MPS Custody |
0.8 |
1.2 |
(34.6)% |
8.2 |
11.9 |
(3.7) |
|||
|
Total FUM-related revenue |
93.9 |
97.7 |
(3.9)% |
15,805 |
14,929 |
5.9% |
59.4 |
65.4 |
(6.0) |
|
Financial planning |
17.1 |
8.2 |
108.8% |
45.4 |
34.6 |
10.8 |
|||
|
Other income |
0.6 |
0.8 |
(19.2)% |
||||||
|
Total non-FUM-related revenue |
17.7 |
9.0 |
97.7% |
||||||
|
Total revenue |
111.6 |
106.7 |
4.6% |
||||||
1. The prior financial year has been restated to separate the results of discontinued operations, consistent with the presentation in the current financial year.
During the year, the overall yield decreased by 6.0bps to 59.4bps (2024: 65.4bps). The yield on total BPS increased by 0.4bps to 78.1bps (2024: 77.7bps). This reflects higher transaction and FX income, offsetting the impact of lower fee and product mix. This was driven by the variation in fee rates on gross BPS outflows and rates achieved on new business within Core BPS and the product mix across the underlying BPS services, including the Gilts offering.
The yield on total MPS decreased by 2.4bps to 24.0bps (2024: 26.4bps), largely due to the increased proportion of FUM held within the lower-yielding MPS Platform compared to MPS Custody.
The yield on interest income, net of amounts paid to clients, decreased by 3.7bps to 8.2bps (2024: 11.9bps). The reduction reflects the fall in the Bank of England base rate over the year, combined with an increase in the proportion of interest income shared with clients.
Underlying costs
Excluding costs acquired with the Financial Planning businesses of £6.2 million (2024: nil), the underlying costs (including £2.5 million of finance income) were broadly flat at £76.5 million. This reflects inflationary and regulatory cost increases of 2.6% and investment in capability and capacity of 5.4% to support business growth, offset by 7.7% of cost savings due to management actions, including organisational restructuring, lower variable pay costs and more discipline around non-staff costs. Total underlying costs, including acquisitions and finance income, increased by 8.2% to £82.7 million (2024 restated: £76.4 million).
Underlying cost analysis (£m)
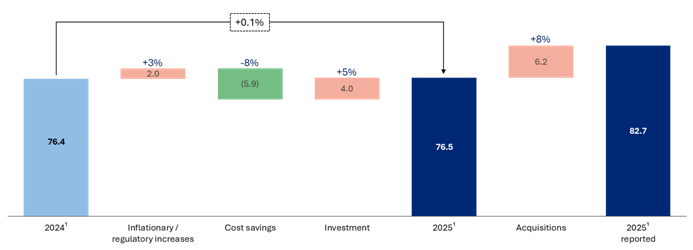
1. Includes net finance income of £2.5 million (2024: £2.4 million).
Excluding acquisitions, staff costs decreased by 3.3% to £47.0 million (2024 restated: £48.6 million), as a result of organisational restructuring and lower variable pay, which countered inflationary pressures and senior hires to support our 'Reignite Growth' strategy. Total staff costs increased by 7.0% to £52.0 million, primarily as a result of 171 employees joining the Group through the acquisitions made over the year, representing c.30% of the overall headcount at 30 June 2025.
Non-staff costs
Excluding acquisitions, non-staff costs increased by 5.6% to £31.9 million (2024 restated £30.2 million), driven by higher regulatory fees and levies, depreciation and amortisation charges from strategic investments, and property and distribution costs. The acquisitions added £1.3 million in non-staff costs, resulting in total non-staff costs of £33.2 million (2024: £30.2 million).
Profit before tax
Underlying profit before tax decreased by 4.6% to £28.9 million (2024 restated: £30.3 million), and the underlying profit margin was 25.9% (2024 restated: 28.4%).
On a statutory basis, the profit before tax was down 28.9% to £17.5 million (2024: £24.6 million), driven by non-recurring one-off items including acquisition and integration costs and organisational restructure costs.
The profit from discontinued operations, which is presented after tax, was £9.4 million (2024: loss of £13.9 million). This comprises the operating results generated by the DCF and BMI prior to their respective disposal dates (November 2024 and February 2025, respectively) and the gains on their disposal. Further information is provided in note 13 of the consolidated financial statements.
Reconciliation between underlying and statutory PBT
Underlying PBT is considered by the Board to be an appropriate reflection of the Group's performance when compared to the statutory results as this excludes income and expense categories, which are deemed to be of a non-recurring nature or non-operating items. The Non-IFRS financial information section includes a glossary of the Group's APMs and the criteria for how each are considered.
A reconciliation between underlying and statutory PBT for the year ended 30 June 2025, with comparative financial information is presented in the following table.
|
£ million (unless stated otherwise) |
2025 |
2024 |
|
Underlying profit before tax |
28.9 |
30.3 |
|
Acquisition and integration related costs |
(4.4) |
(0.4) |
|
Amortisation of acquired client relationships |
(4.0) |
(3.4) |
|
Organisational restructure |
(2.1) |
(2.1) |
|
Move to LSE Main Market costs |
(1.9) |
- |
|
Head office relocation |
(1.3) |
- |
|
Other non-operating items |
2.3 |
0.2 |
|
Total underlying adjustments |
(11.4) |
(5.7) |
|
Statutory profit before tax |
17.5 |
24.6 |
Acquisition and integration related costs (£4.4 million charge)
These represent costs incurred in relation to the Group's recent acquisitions, and include legal fees, fair value adjustments and finance costs in relation to the deferred contingent consideration. The prior financial year charge relates to the share-based payment for share options awarded to onboarded employees as part of the integration of a prior period acquisition. These costs are excluded from the underlying results in view of their one-off nature arising as part of an acquisition.
Amortisation of acquired client relationships (£4.0 million charge)
Intangible assets are recognised on the acquisition of new businesses and in the course of acquiring FUM and financial advice portfolios. These are amortised over their useful life, which has been assessed to range between six and 20 years. This amortisation charge has been excluded from underlying profit since it is a significant non-cash item. Refer to note 17 of the consolidated financial statements for more detail.
Organisational restructure (£2.1 million charge)
As part of the Group's strategy to ensure it operates in an efficient manner and delivers the best service to clients, further opportunities were identified to streamline and remove duplication from core processes, resulting in redundancy costs. These have been excluded from underlying earnings on the basis that they are in relation to business restructuring .
Move to LSE Main Market costs (£1.9 million charge)
In March 2025, the Group announced its successful admission to the LSE's Main Market, which the Board believes will further enhance the Group's corporate profile and extends the opportunity to own its ordinary shares to a broader group of investors. Costs incurred in this transaction have been excluded from underlying earnings due to their one-off nature.
Head office relocation (£1.3 million charge)
This primarily relates to the dual running costs whilst the Group relocates to the new head office in Q4 2025. These have been excluded from underlying earnings on the basis that they are non-recurring in nature.
Other non-operating items (£2.3 million credit)
This primarily relates to a refund from HMRC (£3.1 million) in respect of VAT arising on the Group's AIM Portfolio Services as it was confirmed this was exempt from VAT, covering the period from 1 October 2019 to 30 September 2024. This is partially offset by legacy legal costs and strategic and transformation reviews, conducted as a result of the significant business change following the acquisitions and BMI disposal. These items are excluded from underlying results in view of their non-recurring nature.
Taxation
The underlying tax charge increased to £7.7 million (2024 restated: £5.5 million), representing an effective tax rate ("ETR") of 26.5% (2024 restated: 18.2%). This is slightly higher than the corporation tax rate of 25.0% due to higher disallowable expenses, which include the corporate activity over the year, of £0.4 million (2024: £0.2 million).
The statutory tax charge was £5.9 million (2024 restated: £4.2 million), representing an ETR of 33.6% (2024 restated: 17.2%). The increase is driven by lower share option exercises and non-deductible expenses, including the impact of corporate activity over the year of £0.5 million and the move to the LSE's Main Market of £0.5 million. Refer to note 12 of the consolidated financial statements for further information.
Earnings per share ("EPS")
Underlying diluted EPS reduced by 13.6% to 130.4p (2024 restated: 150.9p), and statutory diluted EPS decreased by 42.7% to 71.4p (2024 restated: 124.5p), reflecting the combined effects of the movements in earnings and ETRs, and a diluted weighted average number of shares in issue of 16.3 million (2024: 16.4 million). Details on the basic and diluted EPS are provided in note 15 of the consolidated financial statements.
|
2025 |
2024 restated1 |
|
|
EPS from continuing operations |
||
|
Basic |
72.0p |
126.6p |
|
Diluted |
71.4p |
124.5p |
|
EPS from discontinued operations |
||
|
Basic |
57.9p |
(86.5)p |
|
Diluted |
57.4p |
(85.0)p |
|
Underlying EPS from continuing operations |
||
|
Basic |
131.5p |
153.5p |
|
Diluted |
130.4p |
150.9p |
1. There has been an update to the results presented in the restated comparative period previously disclosed in the interim report and accounts for the six months ended 31 December 2024. Refer to the note 2 of the consolidated financial statements for further details.
Financial position, capital, cash and dividend
|
£ million (unless stated otherwise) |
2025 |
2024 |
|
Net assets |
154.4 |
152.3 |
|
Excess capital after internal capital buffer1 |
15.6 |
47.1 |
|
Cash resources and liquid assets |
53.8 |
74.7 |
|
Final dividend |
51.0p |
49.0p |
|
Total dividend |
81.0p |
78.0p |
1. Excess capital after internal capital buffer is stated before payment of the final dividend.
Net assets and capital
Net assets increased by 1.4% to £154.4 million at 30 June 2025 (30 June 2024: £152.3 million). Total tangible net assets (net assets excluding intangibles) were £35.0 million at 30 June 2025 (30 June 2024: £69.1 million). As at 30 June 2025, the Group had regulatory capital resources of £45.2 million (30 June 2024: £75.7 million) excluding the impact of the final dividend payment of c.£8 million payable in November 2025. The reduction in capital resources was predominantly driven by organic investment and M&A activities of £13.7 million and £21.1 million, respectively, and the repurchase of shares through the share buyback programme of £7.0 million.
The total net assets and the regulatory capital resources consider the respective period's profits as these are deemed to be verified at the date of publication of the interim results. In applying its internal capital management approach, the Group seeks to maintain a capital buffer in addition to the regulatory minimum requirement. At 30 June 2025, after taking into account the regulatory minimum requirement and internal capital buffer, the excess capital was £15.6 million (30 June 2024: £47.1 million), excluding the impact of the final dividend payment.
Capital position (£m)
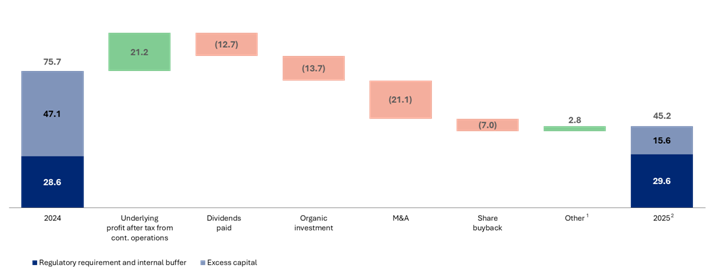
1. Other includes purchase of shares by the Employee Benefit Trust ("EBT"), head office relocation costs, a refund received from HMRC associated with VAT, and other movements in deferred tax and intangible assets.
2. 2025 excess capital stated before final dividend, payable in November 2025.
Liquidity
Total cash resources and liquid assets at 30 June 2025 were £53.8 million (30 June 2024: £74.7 million). The reduction on the prior year largely reflects the cash impacts of M&A consideration of £12.2 million and a share buyback of £7.0 million (30 June 2024: nil). During the year ended 30 June 2025, the Group also incurred capital expenditure of £9.3 million (2024: £1.8 million), including investment in technological transformation to deliver continued performance improvements, automation and process efficiencies and to enhance our clients' digital journeys, and property-related costs. A further £5.4 million was deployed on other strategic and transformational actions such as organisational restructuring, integration and the move from AIM to the Main Market.
Cash resources and liquid assets1 (£m)
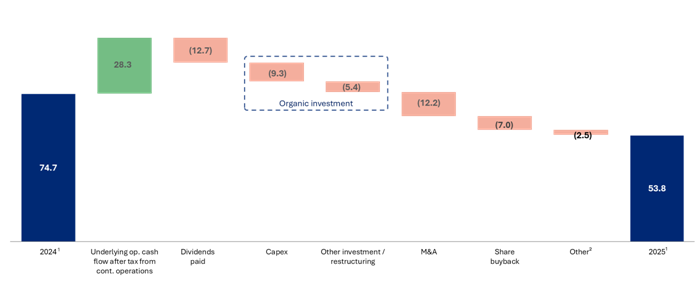
Note: Subject to rounding.
1. Group liquid assets are inclusive of UK government gilts and money market funds which are classified as a liquid resource in nature due to their ability to be easily translated into cash.
2. Other includes purchase of shares by the EBT, payment of lease liabilities and a refund received from HMRC associated with VAT.
Dividend
The Board recognises the importance of dividends to shareholders and the benefit of providing sustainable shareholder returns. In determining the level of dividend in any year, the Board considers a number of factors such as the level of retained earnings, future cash commitments, statutory profit cover, capital and liquidity requirements and the level of profit retention required to sustain the growth of the Group. The Board has declared a final dividend of 51.0 pence per share (2024: 49.0 pence). This represents an increase of 4.1% compared to the previous financial year and brings the total dividend for the full year to 81.0 pence per share (2024: 78.0 pence). Subject to shareholder approval, the final dividend will be paid on 4 November 2025 to shareholders recorded on the register on 19 September 2025.
Share buyback
In January 2025, the Group initiated its first ever share buyback programme of up to £10.0 million, consistent with its capital allocation priorities. At 30 June 2025, the Group had repurchased and cancelled 464,000 shares for a total consideration of £7.0 million. At the date of signing the Annual Report and Accounts, a further 74,000 shares were purchased and cancelled, for additional total consideration of £1.2 million. The Board will continue to deploy the remainder of the £10 million buyback in due course.
In summary
I look forward with confidence as we focus on delivering our 'Reignite Growth' strategy and achieving our medium-term targets of annualised net flows of 5% and keeping BAU cost growth below 5% per annum.
Katherine Jones
CFO
Consolidated statement of comprehensive income
For the year ended 30 June 2025
|
Note |
2025 £'000 |
2024 restated1 £'000 |
|
|
Revenue |
6 |
111,560 |
106,682 |
|
Administrative costs |
7 |
(99,282) |
(84,509) |
|
Gross profit |
12,278 |
22,173 |
|
|
Other (losses)/gains |
8 |
(272) |
83 |
|
Operating profit |
9 |
12,006 |
22,256 |
|
Finance income |
10 |
2,827 |
2,525 |
|
Finance costs |
10 |
(597) |
(166) |
|
Other non-operating income |
11 |
3,283 |
- |
|
Profit before tax |
17,519 |
24,615 |
|
|
Taxation |
12 |
(5,889) |
(4,236) |
|
Profit for the period attributable to equity holders of the Company |
11,630 |
20,379 |
|
|
Result from discontinued operations |
13 |
9,354 |
(13,922) |
|
Other comprehensive income |
- |
- |
|
|
Total comprehensive income for the year |
20,984 |
6,457 |
|
|
Earnings per share from continuing operations |
|||
|
Basic |
15 |
72.0p |
126.6p |
|
Diluted |
15 |
71.4p |
124.5p |
|
Earnings/(loss) per share from discontinued operations |
|||
|
Basic |
15 |
57.9p |
(86.5)p |
|
Diluted |
15 |
57.4p |
(85.0)p |
1 The prior financial year has been restated to separate the results of discontinued operations, consistent with the presentation in the current financial year. Refer to note 13 for details of the results of discontinued operations. In addition, there has been an update to the results presented in the restated comparative period previously disclosed in the interim report and accounts for the six months ended 31 December 2024. Refer to note 2 for further details.
The above consolidated statement of comprehensive income should be read in conjunction with the accompanying notes.
Consolidated statement of financial position
As at 30 June 2025
|
Note |
2025 £'000 |
20241,2 £'000 |
20232 £'000 |
|
|
Assets |
||||
|
Non-current assets |
||||
|
Intangible assets |
17 |
119,465 |
83,224 |
100,582 |
|
Property, plant and equipment |
18 |
3,418 |
1,350 |
2,123 |
|
Right-of-use assets |
19 |
12,790 |
3,225 |
4,329 |
|
Financial assets at amortised cost |
20 |
19,925 |
29,963 |
- |
|
Financial assets at fair value through other comprehensive income |
20 |
- |
500 |
500 |
|
Deferred contingent consideration receivable |
21 |
13,899 |
- |
- |
|
Total non-current assets |
169,497 |
118,262 |
107,534 |
|
|
Current assets |
||||
|
Financial assets at fair value through profit or loss |
20 |
1,095 |
905 |
825 |
|
Deferred contingent consideration receivable |
21 |
289 |
- |
- |
|
Trade and other receivables |
22 |
25,881 |
29,061 |
33,542 |
|
Cash and cash equivalents |
23 |
33,915 |
44,732 |
53,355 |
|
Total current assets |
61,180 |
74,698 |
87,722 |
|
|
Total assets |
230,677 |
192,960 |
195,256 |
|
|
Liabilities |
||||
|
Non-current liabilities |
||||
|
Lease liabilities |
24 |
14,218 |
1,645 |
3,181 |
|
Provisions |
25 |
773 |
378 |
322 |
|
Deferred contingent consideration payable |
26 |
1,929 |
- |
- |
|
Net deferred tax liabilities |
27 |
9,163 |
5,394 |
6,033 |
|
Other non-current liabilities |
28 |
1,044 |
587 |
783 |
|
Total non-current liabilities |
27,127 |
8,004 |
10,319 |
|
|
Current liabilities |
||||
|
Lease liabilities |
24 |
700 |
2,169 |
1,960 |
|
Provisions |
25 |
1,890 |
1,628 |
1,000 |
|
Deferred contingent consideration payable |
26 |
14,176 |
- |
1,467 |
|
Trade and other payables |
29 |
31,294 |
27,889 |
22,521 |
|
Current tax liabilities |
1,041 |
935 |
645 |
|
|
Total current liabilities |
49,101 |
32,621 |
27,593 |
|
|
Net assets |
154,449 |
152,335 |
157,344 |
|
|
Equity |
||||
|
Share capital |
30 |
160 |
165 |
164 |
|
Share premium account |
30 |
83,987 |
83,135 |
81,830 |
|
Other reserves |
31 |
197 |
192 |
192 |
|
Retained earnings |
31 |
70,105 |
68,843 |
75,158 |
|
Total equity |
154,449 |
152,335 |
157,344 |
1 The 30 June 2024 comparative statement of financial position includes discontinued operations.
2 Restated (refer to note 4(v)).
The consolidated financial statements were approved on 3 September 2025 by the Board of Directors and authorised for issue, and signed on their behalf by:
Andrea Montague Katherine Jones
CEO CFO
Company registration number: 04402058
The above consolidated statement of financial position should be read in conjunction with the accompanying notes.
Consolidated statement of changes in equity
For the year ended 30 June 2025
|
Note |
Share capital £'000 |
Share premium account £'000 |
Other reserves1 £'000 |
Retained earnings1 £'000 |
Total equity £'000 |
|
|
Balance at 1 July 2023 |
164 |
81,830 |
192 |
75,158 |
157,344 |
|
|
Comprehensive income |
||||||
|
Profit from continuing operations |
- |
- |
- |
20,379 |
20,379 |
|
|
Result from discontinued operations |
- |
- |
- |
(13,922) |
(13,922) |
|
|
Total comprehensive income |
- |
- |
- |
6,457 |
6,457 |
|
|
Transactions with owners |
||||||
|
Issue of ordinary shares |
30 |
1 |
1,305 |
- |
- |
1,306 |
|
Share-based payments |
- |
- |
- |
2,407 |
2,407 |
|
|
Purchase of own shares by Employee Benefit Trust |
- |
- |
- |
(2,150) |
(2,150) |
|
|
Tax on share options |
27 |
- |
- |
- |
(935) |
(935) |
|
Dividends paid |
16 |
- |
- |
- |
(12,094) |
(12,094) |
|
Total transactions with owners |
1 |
1,305 |
- |
(12,772) |
(11,466) |
|
|
Balance at 30 June 2024 |
165 |
83,135 |
192 |
68,843 |
152,335 |
|
|
Comprehensive income |
||||||
|
Profit from continuing operations |
- |
- |
- |
11,630 |
11,630 |
|
|
Result from discontinued operations |
- |
- |
- |
9,354 |
9,354 |
|
|
Total comprehensive income |
- |
- |
- |
20,984 |
20,984 |
|
|
Transactions with owners |
||||||
|
Issue of ordinary shares |
30 |
- |
852 |
- |
- |
852 |
|
Share-based payments |
- |
- |
- |
2,856 |
2,856 |
|
|
Purchase of own shares by Employee Benefit Trust |
- |
- |
- |
(2,566) |
(2,566) |
|
|
Shares repurchased in the share buyback programme |
30 |
(5) |
- |
5 |
(6,971) |
(6,971) |
|
Tax on share options |
27 |
- |
- |
- |
(346) |
(346) |
|
Dividends paid |
16 |
- |
- |
- |
(12,695) |
(12,695) |
|
Total transactions with owners |
(5) |
852 |
5 |
(19,722) |
(18,870) |
|
|
Balance at 30 June 2025 |
160 |
83,987 |
197 |
70,105 |
154,449 |
1 Restated (refer to note 4(v)).
The above consolidated statement of changes in equity should be read in conjunction with the accompanying notes.
Consolidated statement of cash flows
For the year ended 30 June 2025
|
Note |
2025 £'000 |
2024 restated1 £'000 |
|
|
Cash flows from operating activities |
|||
|
Cash generated from operations |
33 |
28,727 |
41,179 |
|
Corporation tax paid |
(7,064) |
(6,249) |
|
|
Other non-operating income |
11 |
3,073 |
- |
|
Net cash generated from operating activities |
24,736 |
34,930 |
|
|
Cash flows from investing activities |
|||
|
Purchase of computer software and system development costs |
(7,491) |
(1,734) |
|
|
Purchase of property, plant and equipment |
(1,852) |
(83) |
|
|
Consideration paid for acquisitions net of cash acquired |
14 |
(34,150) |
- |
|
Investment in financial assets at amortised cost |
20 |
- |
(29,978) |
|
Disposal of financial assets at amortised cost |
20 |
9,984 |
- |
|
Investment in financial assets at fair value through profit or loss |
20 |
(146) |
- |
|
Disposal of financial assets at fair value through other comprehensive income |
20 |
500 |
- |
|
Deferred contingent consideration paid |
26 |
- |
(852) |
|
Proceeds from disposal of International and DCF |
13 |
27,670 |
- |
|
Interest received |
1,232 |
2,715 |
|
|
Net cash used in investing activities |
(4,253) |
(29,932) |
|
|
Cash flows from financing activities |
|||
|
Issue of ordinary shares |
146 |
681 |
|
|
Purchase of shares in the share buyback programme |
(6,971) |
- |
|
|
Payment of lease liabilities - Principal |
(2,678) |
(2,015) |
|
|
Payment of lease liabilities - Interest |
(287) |
(171) |
|
|
Purchase of own shares by Employee Benefit Trust |
(2,566) |
(2,150) |
|
|
Dividends paid to shareholders |
16 |
(12,695) |
(12,094) |
|
Net cash used in financing activities |
(25,051) |
(15,749) |
|
|
Net decrease in cash and cash equivalents from continuing operations |
(4,568) |
(10,751) |
|
|
Net cash flows from discontinued operations |
13 |
(6,249) |
2,128 |
|
Cash and cash equivalents at beginning of year |
44,732 |
53,355 |
|
|
Cash and cash equivalents at end of year |
33,915 |
44,732 |
1 The prior financial year has been restated to show the results of continuing operations, consistent with the presentation in the current financial year. Refer to note 13 for details of the results of discontinued operations.
The above consolidated statement of cash flows should be read in conjunction with the accompanying notes.
Notes to the consolidated financial statements
For the year ended 30 June 2025
1. General information
Brooks Macdonald Group plc ("the Company"), a public limited company incorporated and registered in England and Wales and domiciled in the United Kingdom ("UK") under the Companies Act 2006, is the Parent Company of a group of companies (collectively the "Group") and offers wealth management and financial planning services in the UK. The Company is listed on the London Stock Exchange ("LSE").
The Company's registration number is 04402058. The address of the registered office is 21 Lombard Street, London, EC3V 9AH, England.
2. Basis of preparation
The Group's consolidated financial statements for the year ended 30 June 2025 have been prepared in accordance with UK-adopted International Accounting Standards ("IAS") and with the requirements of the Companies Act 2006 as applicable to companies reporting under those standards. These consolidated financial statements have been prepared on a historical cost basis, except for the revaluation of certain financial instruments that are measured at fair value. The principal accounting policies adopted are set out below. Unless otherwise stated, they have been applied consistently to all periods presented in the financial statements.
All amounts in the financial statements have been rounded to the nearest thousand unless otherwise indicated.
At the time of approving the financial statements, the Directors have a reasonable expectation that the Company and the Group have adequate resources to continue in operational existence for the foreseeable future. Accordingly, they continue to adopt the going concern basis in preparing the financial statements. There have been no post balance sheet events that have materially impacted the Group's liquidity headroom and going concern assessment.
There has been an update to the results presented in the restated year ended 2024 result previously disclosed in the interim report and accounts for the six months ended 31 December 2024, which relates to a reclassification of the tax charge between discontinued and continuing operations. This has resulted in a decrease of £957,000 in the tax charge for continuing operations and a corresponding increase in the tax charge for discontinued operations. The profit after tax and earnings per share for respective continuing and discontinued operations have also been restated accordingly.
Non-statutory accounts
The financial information set out within does not constitute the Group's statutory accounts for the year ended 30 June 2025 or 2024 but is derived from those accounts. Statutory accounts for 2024 have been delivered to the registrar of companies, and those for 2025 will be delivered in due course. The auditors have reported on those accounts; their report was (i) unqualified, (ii) did not include a reference to any matters to which the auditors drew attention by way of emphasis without qualifying their report and (iii) did not contain a statement under section 498 of the Companies Act 2006.
Basis of consolidation
The Group's financial statements are a consolidation of the financial statements of the Company and its subsidiaries.
The underlying financial statements of the subsidiaries are prepared for the same reporting period as the Company, using consistent accounting policies. Subsidiaries and structured entities are all entities controlled by the Company, deemed to exist where the Company is exposed to, or has rights to, variable returns from its involvement with the entity and has the ability to affect those returns through its power over the entity. The financial statements of the subsidiaries are included from the date on which control is transferred to the Group to the date that control ceases.
All intercompany transactions and balances between Group companies are eliminated on consolidation.
The Group has interests in structured entities, with one consolidated structured entity being the Brooks Macdonald Group Employee Benefit Trust (note 32). The Group has interests in other structured entities as a result of contractual arrangements arising from the management of assets on behalf of its clients but are not consolidated as the Group does not commit to financially support its funds, nor guarantee repayment of any borrowings (note 34).
3. New standards, amendments to standards and interpretations adopted by the Group in the year
In the year ended 30 June 2025, the Group did not adopt any new standards or amendments issued by the International Accounting Standards Board ("IASB") or interpretations by the International Financial Reporting Standards Interpretations Committee ("IFRS IC") that have had a material impact on the consolidated financial statements.
Certain new accounting standards, amendments to accounting standards and interpretations have been published that are not mandatory for the 30 June 2025 reporting periods and have not been early adopted by the Group.
|
Standard, amendment or interpretation |
Effective date |
|
Amendments to IAS 21 regarding lack of exchangeability |
1 January 2025 |
|
Amendments IFRS 9 and IFRS 7 regarding the classification and measurement of financial instruments |
1 January 2026 |
|
Annual Improvements to IFRS Accounting Standards - Volume 11 |
1 January 2026 |
|
IFRS 18 Presentation and Disclosures in Financial Statements |
1 January 2027 |
|
IFRS 19 Subsidiaries without Public Accountability: Disclosures |
1 January 2027 |
The Group is currently assessing the impact that the adoption of the above standards and amendments will have on the Group's results reported within the financial statements.
IFRS 18 Presentation and Disclosures in Financial Statements
IFRS 18 includes requirements for all entities applying IFRS for the presentation and disclosure of information in the financial statements. The standard aims to improve how companies communicate in their financial statements, with a focus on information about financial performance in the statement of comprehensive income. IFRS 18 replaces IAS 1 Presentation of Financial Statements, although the standard is not yet endorsed by the UK Endorsement Board.
IFRS 18 is expected to have a significant impact on the Group's financial statements, although it is only expected to have an impact on the presentation and disclosure of the financial statements and is not expected to have an impact on recognition and measurement.
IFRS 19 Subsidiaries without Public Accountability: Disclosures
IFRS 19 specifies the reduced disclosure requirements an eligible subsidiary is permitted to apply instead of the disclosure requirements in other IFRS standards. The standard is not yet endorsed by the UK Endorsement Board and is not expected to impact the Group's financial statements.
4. Material accounting policies
The accounting policies applied in the preparation of these financial statements are set out below. These policies have been applied consistently to all years presented, unless otherwise stated.
4(a) Critical accounting estimates and significant judgements
The preparation of financial information requires the use of assumptions, estimates and judgements about future conditions. Use of currently available information and application of judgement are inherent in the formation of estimates. Actual results in the future may differ from those reported. In this regard, the Directors believe that the areas where critical accounting estimations are used, relate to the measurement of intangible assets, assumptions used in the goodwill impairment reviews and the measurement of contingent deferred consideration receivable/payable. There are no areas of significant judgement that have been identified.
The consolidated financial statements include other areas of judgement and accounting estimates. Whilst these areas do not meet the definition under IAS 1 of significant accounting estimates or critical accounting judgements, the recognition and measurement of certain material assets and liabilities are based on assumptions and/or are subject to longer-term uncertainties.
The underlying assumptions and estimates are reviewed on an ongoing basis. Revisions to accounting estimates are recognised in the financial year in which the estimate is revised only if the revision affects both current and future periods.
Further information about critical accounting estimates and sources of estimation uncertainty are set out below.
Intangible assets - client relationship contracts and goodwill impairment reviews
The Group has acquired client relationships and the associated investment management and financial advice contracts as part of business combinations, through separate purchase or with newly employed teams of fund managers, as described in note 17. In assessing the fair value of these assets, the Group has estimated their finite life based on information about the typical length of existing client relationships. Acquired client relationship contracts are amortised on a straight-line basis over their estimated useful lives, ranging from six to twenty years.
If the useful economic lives of the client relationship intangible assets held by the Group at 30 June 2025 were to reduce by two years, the estimated charge would have increased by £1,263,000.
Goodwill recognised as part of a business combination is not amortised but instead reviewed annually for impairment, or when a change in circumstances indicates that it might be impaired. The recoverable amounts of cash-generating units ("CGUs") are determined by value-in-use calculations, which require the use of estimates to derive the projected future cash flows attributable to each unit. Details of the more significant assumptions and sensitivity analysis are given in note 17.
In assessing the value of client relationships and the associated investment management and financial advice contracts and goodwill, the Group prepares forecasts for the cash flows acquired and discounts to a net present value. The key assumptions in these forecasts are the pre-tax discount rate and projected revenue growth. The pre-tax discount rate is adjusted from a post-tax discount rate derived from the Group's weighted average cost of capital ("WACC"), adjusted for any specific risks for the relevant CGU. The Group uses the capital asset pricing model ("CAPM") to estimate the WACC, which is calculated at the point of acquisition for a business combination, or the relevant reporting period date. Key inputs include the risk-free rate, market risk premium, the Group's adjusted beta with reference to beta data from peer-listed companies, small company premium and any risk-adjusted premium for the relevant CGU. Further details on discount rates used for each CGU are provided in note 17.
Deferred contingent consideration receivable and payable
Deferred contingent consideration arose during the year in connection with the Group's acquisition and disposal activities. These amounts represent portions of the transaction price that are payable or receivable at a future date, subject to the achievement of specific conditions or milestones. These typically include performance targets, client retention thresholds, or other contractual criteria agreed between the parties.
Deferred contingent consideration payable and receivable is measured at fair value and recognised within net finance income in the consolidated statement of comprehensive income in each reporting period.
The fair values of deferred contingent consideration at both the acquisition and disposal dates were determined using discounted cash flow models. These models incorporate management's expectations regarding the likelihood of meeting specified performance targets and client retention criteria, and apply an appropriate discount rate. The valuation of contingent consideration represents a critical accounting estimate due to the inherent uncertainty in forecasting future outcomes. Changes in expected future cash flows could materially impact the fair value measurement.
As at the reporting date, the Group reassessed the fair value of all deferred contingent consideration arrangements. For acquired businesses, if performance exceeds the forecasts by 10%, an additional charge of £0.2 million would be recognised in the statement of comprehensive income. Conversely, if performance is 10% below forecast, a gain of £0.4 million would be recognised. Similarly, for disposed businesses, if achievement of performance targets exceeds the forecasts by 5%, this would result in an additional gain of £3.2 million. While a 5% under performance versus those targets would lead to a charge of £4.8 million.
These valuations are subject to estimation and uncertainty, and actual outcomes may differ from those assumed, potentially resulting in material adjustments in future periods.
4(b) Discontinued operations
The Group completed the sale of its International operations, which comprised Brooks Macdonald Asset Management (International) Limited and its wholly-owned subsidiaries ("BMI"), on 21 February 2025. In accordance with IFRS 5 'Non-current assets held for sale and discontinued operations', the results of BMI have been reclassified as discontinued operations in these consolidated financial statements.
Additionally, Brooks Macdonald Asset Management Limited resigned as investment manager to the SVS Brooks Macdonald Defensive Capital Fund ("DCF") (subsequently renamed SVS RM Defensive Capital Fund) on 31 October 2024 and accordingly, the results have also been reclassified as discontinued operations in these consolidated financial statements.
Consistent with IFRS 5 requirements, profit after tax attributable to the discontinued operations in 2025 has been shown in a single line in the income statement with 2024 comparatives being restated accordingly and includes the gain from the disposal, with further analysis provided in note 13. Related notes have also been prepared on this basis.
IFRS 5 does not permit the comparative 30 June 2024 and 1 July 2023 statement of financial position to be re-presented, as BMI and DCF were not reclassified as held for sale at these dates.
Profit from the discontinued operations up to the date of disposal is presented in the consolidated statement of comprehensive income after the elimination of intragroup transactions within continuing operations. The statement of cash flows is presented for continuing operations only, excluding intragroup cash flows with the discontinued operations up to the date disposal. The cash flow from discontinued operations is presented in note 13.
4(c) Business combinations
Business combinations are accounted for using the acquisition method. The cost of an acquisition is measured at the fair value of the aggregate amount of the consideration transferred at the acquisition date, irrespective of the extent of any minority interest. Acquisition and integration-related costs are charged to the consolidated statement of comprehensive income when incurred.
When the Group acquires a business, it assesses the assets and liabilities assumed for appropriate classification and designation in accordance with the contractual terms, economic circumstances and pertinent conditions at the acquisition date. If the business combination is achieved in stages, the fair value of the Group's previously held equity interest is remeasured at the acquisition date and the difference is credited or charged to the consolidated statement of comprehensive income. Identifiable assets and liabilities assumed on acquisition are recognised in the consolidated statement of financial position at their fair value at the date of acquisition.
Any deferred contingent consideration to be paid by the Group to the vendor is recognised at its fair value at the acquisition date, in accordance with IFRS 9. Subsequent changes based on the revised estimated fair value of deferred contingent consideration are recognised in accordance with IFRS 9 by revaluing the liability on the consolidated statement of financial position and the associated amount recognised in the consolidated statement of comprehensive income.
Goodwill is initially measured at cost, being the excess of the consideration transferred over the acquired company's net identifiable assets and liabilities assumed.
Impairment
Goodwill and other intangible assets with an indefinite life are tested annually or more frequently if events or changes in circumstances indicate that they might be impaired. For the purposes of impairment testing, goodwill acquired in a business combination is allocated to each of the Group's CGUs that are expected to benefit from the combination, irrespective of whether other assets or liabilities of the acquisition are assigned to those units. The carrying amount of each CGU is compared to its recoverable amount, which relates to the higher of an asset's fair value less costs of disposals and value in use. This is determined using a discounted future cash flow model.
Where goodwill forms part of a CGU and part of the operation within that unit is disposed of, the goodwill associated with the operation disposed of is included in the carrying amount of the operation when determining the gain or loss on disposal of the operation. Goodwill disposed of in this circumstance is measured based on the relative values of the operation disposed of and the portion of the CGU retained.
4(d) Revenue
Investment management fees
Revenue from investment management services is recognised over time as the services are provided. Fees are typically billed monthly or quarterly in arrears and are calculated based on a percentage of the portfolio value, either daily or at the billing date, depending on the underlying product. The performance obligation is satisfied continuously over the service period, and revenue is recognised accordingly. Revenue from investment management fees is only recognised as the performance obligation is satisfied. Amounts are presented net of any rebates or discounts provided to clients.
Fund management fees
Revenue from fund management services provided to open-ended investment companies ("OEICs") is recognised over time as the services are provided. Fees are billed monthly in arrears and are calculated daily based on a fixed percentage of each fund's net asset value. As such, fund management fees include variable consideration but there is no significant estimation or level of judgement involved. The performance obligation is satisfied continuously throughout the reporting period, and revenue is recognised accordingly. Amounts are presented net of any rebates or discounts provided to investors.
Financial planning
Financial planning income relates to fees for the provision of financial advice. Fees are charged to clients either using an hourly rate, by a fixed fee arrangement, or by a fund-based arrangement whereby fees are calculated based on a percentage of the value of the portfolio at the billing date. All fees are recognised over the period the service is provided.
Transactional income and foreign exchange trading
Transactional income is earned through dealing and administration charges levied on trades at the time a deal is placed for a client. Fees are calculated based on a percentage of the individual trade value or a flat charge per trade. Revenue is recognised at the point of the trade being placed.
Foreign exchange trading fees are charged on client trades placed in non-base currencies, which therefore require a foreign currency exchange to action the trade. Revenue is recognised at the point of the trade being placed.
Interest income
Interest income on client money is the revenue earned on uninvested cash deposits held by clients. The amount recognised correlates with fluctuations in underlying interest rates and is recognised over time, based on balances held in investment accounts under administration.
4(e) Cash and cash equivalents
Cash comprises cash in hand and call deposits held with banks. Cash equivalents comprise short-term, highly liquid investments that are subject to an insignificant risk of change in value and with a maturity of less than three months from the date of acquisition. Cash and cash equivalents are classified at amortised cost, as the business model of these assets is to hold to collect contractual cash flows, which consist solely of payments of principal and interest. They are initially recognised at fair value and subsequently measured at amortised cost using the effective interest rate ("EIR") method.
4(f) Share-based payments
The Group operates a number of share incentive plans for its employees. These involve an award of shares or options in the Group (share-based payments).
The fair value of the services received is measured by reference to the fair value of the shares or share options on the grant date. Fair value is measured using the Black-Scholes model.
The fair value determined at the grant date of the equity-settled share-based payments is expensed on a straight-line basis over the vesting period, based on the Group's estimate of shares that will eventually vest. At each reporting date, the Group revises its estimate of the number of equity instruments expected to vest as a result of the effect of non-market-based vesting conditions. The impact of the revision of the original estimates, if any, is recognised in the consolidated statement of comprehensive income, such that the cumulative expense reflects the revised estimate, with a corresponding adjustment to reserves.
4(g) Segmental reporting
The Group determines and presents operating segments based on the information that is provided internally to the Group Board of Directors, which is the Group's chief operating decision maker.
4(h) Fiduciary activities
The Group commonly acts as trustee and in other fiduciary capacities that result in the holding or placing of assets on behalf of individuals, trusts, retirement benefit plans and other institutions. These assets and income arising thereon are excluded from these financial statements, as they are not assets of the Group.
The Group holds money on behalf of some clients in accordance with the client money rules of the Financial Conduct Authority ("FCA"). Such monies and the corresponding liability to clients are not included within the consolidated statement of financial position as the Group is not beneficially entitled thereto.
4(i) Property, plant and equipment
All property, plant and equipment is included in the consolidated statement of financial position at historical cost less accumulated depreciation and impairment. Costs include the original purchase cost of the asset and the costs attributable to bringing the asset into a working condition for its intended use.
Provision is made for depreciation to write off the cost less estimated residual value of each asset, and is charged to administrative expenses in the consolidated statement of comprehensive income using a straight-line method, over its expected useful life as follows:
- Leasehold improvements - over the lease term
- Fixtures, fittings and office equipment - five years
- IT equipment - four or five years
The assets' residual values and useful economic lives are reviewed and adjusted, if appropriate, at the end of each reporting period. Gains and losses arising on disposal are determined by comparing the proceeds with the carrying amount. These are included in the consolidated statement of comprehensive income.
4(j) Intangible assets
Amortisation of intangible assets is charged to administrative expenses in the consolidated statement of comprehensive income on a straight-line basis over the estimated useful lives of the assets.
Acquired client relationship contracts
Intangible assets are recognised where client relationship contracts are either separately acquired or acquired with investment managers who are employed by the Group. These are initially recognised at cost and are subsequently amortised on a straight-line basis over their estimated useful economic life. Separately acquired client relationship contracts are amortised over six to twenty years. The intangible assets are reviewed annually to determine whether there exists an indicator of impairment or an indicator that the assumed useful economic life has changed.
Computer software
Costs incurred on internally developed computer software are initially recognised at cost, and when the software is available for use, the costs are amortised on a straight-line basis over an estimated useful life of either four years or the contract term ranging between three and eight years. Initial research and planning costs incurred prior to a decision to proceed with the software's development are recognised immediately in the consolidated statement of comprehensive income.
Goodwill
Goodwill arising as part of a business combination is initially measured at cost, being the excess of the fair value of the consideration transferred over the Group's interest in the net fair value of the separately identifiable assets, liabilities and contingent liabilities of the subsidiary at the date of acquisition. In accordance with IFRS 3 'Business Combinations', goodwill is not amortised but is reviewed annually for impairment and is therefore stated at cost less any provision for impairment of value. Any impairment is recognised immediately in the consolidated statement of comprehensive income and is not subsequently reversed. Gains and losses on the disposal of an entity include the carrying amount of goodwill relating to the entity sold. On acquisition, any goodwill acquired is allocated to CGUs for the purposes of impairment testing. If the cost of the acquisition is less than the fair value of the net assets of the subsidiary acquired, the difference is recognised directly in the consolidated statement of comprehensive income as a gain on bargain purchase.
4(k) Financial investments
The Group classifies financial assets in the following categories: fair value through profit or loss; fair value through other comprehensive income; and amortised cost. The classification is determined by management on initial recognition of the financial asset, which depends on the purpose for which it was acquired and the nature of the cash flows.
Fair value through profit or loss
Financial investments are classified as fair value through profit or loss if they are either held for trading or specifically designated in this category on initial recognition. Assets in this category are initially recognised at fair value and subsequently remeasured, with gains or losses arising from changes in fair value being recognised in the consolidated statement of comprehensive income.
Financial assets at fair value through profit or loss include investments in regulated OEICs, which are managed and evaluated on a fair value basis in line with the market value.
Fair value through other comprehensive income
Financial investments are classified as fair value through other comprehensive income if the objective of the business model is achieved by both collecting contractual cash flows and selling financial assets and if the asset's contractual cash flows represent solely payments of principal and interest. Assets in this category are initially recognised at fair value and subsequently remeasured, with gains or losses arising from changes in fair value being recognised in other comprehensive income.
Financial assets at fair value through other comprehensive income relates to an investment in redeemable preference shares, which satisfy the definition above due to being held to collect contractual cash flows via an annual fixed preferential dividend.
Amortised cost
Financial instruments are classified as amortised cost if the asset is held to collect contractual cash flows and the asset's contractual cash flows represent solely payments of principal and interest. Disposals of instruments held at amortised cost are not part of regular business practice, however one-off instances may occur due to significant events, although they do not alter the existing business model, which remains focused on collecting contractual cash flows. In assessing whether the 'held to collect' model remains appropriate, management considers the frequency and volume of disposals in relation to the total portfolio and disposals are disclosed in the financial statements, including the rationale for the transaction.
4(l) Foreign currency translation
The Group's functional and presentational currency is Pound Sterling ("£"). Foreign currency transactions are translated using the exchange rate prevailing at the transaction date. At the reporting date, monetary assets and liabilities that are denominated in foreign currencies are retranslated at the prevailing rates on that date. Foreign exchange gains and losses resulting from the settlement of such transactions, and from the translation of period-end monetary assets and liabilities, are recognised in the consolidated statement of comprehensive income.
4(m) Retirement benefit costs
Contributions in respect of the Group's defined contribution pension scheme are charged to the consolidated statement of comprehensive income as they fall due.
4(n) Taxation
Tax on the profit for the financial year comprises current and deferred tax. Current tax is the expected tax payable on the taxable income for the financial year, using tax rates enacted, or substantively enacted, at the reporting date, and any adjustment to tax payable in respect of previous years.
Deferred tax is provided in full, using the liability method, on temporary differences arising between the tax bases of assets and liabilities and their carrying amounts in the Group's Financial statements. Deferred tax assets and liabilities are measured at the tax rates that are expected to apply to the period when the asset is realised or the liability settled based on tax rates (and laws) that have been enacted, or substantively enacted, at the reporting date.
Deferred tax assets are only recognised to the extent that it is probable that future taxable profit will be available against which the temporary differences can be utilised.
Deferred tax balances are presented on the consolidated statement of financial position as the net deferred tax balance by each jurisdiction the Group operates within. The gross deferred tax assets and liabilities are disclosed within the deferred tax in note 27.
4(o) Trade receivables
Trade receivables represent amounts due for services performed in the ordinary course of business. They are recognised in trade and other receivables and, if collection is expected within one year, they are recognised as a current asset. If collection is expected in greater than one year, they are recognised as a non-current asset. Trade receivables are measured at amortised cost less any expected credit losses.
4(p) Right-of-use assets and lease liabilities
Right-of-use assets are initially recognised at cost which is measured at the initial amount of the lease liability, reduced for any lease incentives received and increased for lease payments made at or before commencement of the lease, initial direct costs incurred and the amount of any provision recognised where the Group is required to dismantle, remove or restore the asset. Additionally, they may be re-measured to reflect reassessment due to lease modifications.
The right-of-use asset is subsequently depreciated using the straight-line method from the commencement date to the end of the lease term. Additionally, the right-of-use asset is periodically reduced by impairment losses, if any, and adjusted for certain remeasurements of the lease liability.
The Group initially records a lease liability reflecting the present value of the future contractual cash flows to be made over the lease term, discounted using the Group's incremental borrowing rate. Interest is accrued on the lease liability using the effective interest rate method to give a constant rate of return over the life of the lease whilst the balance is reduced as lease payments are made.
If the Group revises its estimate of the term of any lease, it will adjust the carrying amount of the lease liability to reflect the payments to be made over the revised term, discounted at the revised discount rate. An equivalent adjustment is made to the carrying value of the right-of-use asset, with the revised carrying amount being amortised over the remaining (revised) lease term.
4(q) Trade payables
Trade payables are obligations to pay for goods or services that have been acquired in the ordinary course of business from suppliers. These are classified as current liabilities if payment is due within one year or less. Otherwise, they are presented as non-current liabilities in the consolidated statement of financial position.
Trade payables are initially recognised at fair value and subsequently measured at amortised cost using the effective interest method.
4(r) Employee Benefit Trust ("EBT")
The EBT is considered to be a structured entity, as defined in note 32. In substance, the activities of the trust are being conducted on behalf of the Group according to its specific business needs, to obtain benefits from its operation. On this basis, the assets held by the trust are consolidated into the Group's financial statements.
The Company provides finance to an EBT to purchase the Company's shares on the open market in order to meet its obligation to provide shares when an employee exercises certain options or awards made under the Group's share-based payment schemes. The administration and finance costs connected with the EBT are charged to the consolidated statement of comprehensive income. The cost of the shares held by the EBT is deducted from equity. A transfer is made between other reserves and retained earnings over the vesting periods of the related share options or awards to reflect the ultimate proceeds receivable from employees on exercise. The trustees have waived their rights to receive dividends on the shares held by the EBT.
4(s) Share capital
Ordinary share capital is classified as equity. Incremental costs directly attributable to the issue of new ordinary shares or options are shown in equity as a deduction, net of tax, from the proceeds.
Where the Company purchases its own equity share capital (treasury shares), the consideration paid, including any directly incremental costs (i.e. net of income taxes) is deducted from equity attributable to the Company's equity holders until the shares are cancelled or reissued. Where such ordinary shares are subsequently reissued, any consideration received (net of any directly attributable incremental transaction costs and the related income tax effects) is included within equity attributable to the Company's equity holders.
The share buyback programme, initiated during the financial year, repurchased shares on the open market and upon cancellation, the par value is transferred from the share capital to the capital redemption reserve of the Company, with the remaining amount reducing retained earnings. No gain or loss is recorded in the income statement as a result of this programme.
4(t) Dividend distribution
The dividend distribution to the Company's shareholders is recognised as a liability in the Group's financial statements in the period in which the dividend is authorised and no longer at the discretion of the Company. Final dividends are recognised when approved by the Company's shareholders at the Annual General Meeting and interim dividends are recognised when paid.
4(u) Other non-operating income
Other non-operating income is that which is material by size and/or irregular in nature and therefore requires separate disclosure within the consolidated statement of comprehensive income to assist the users of the consolidated financial statements in understanding the business performance of the Group.
4(v) Changes in accounting policy
During the financial year, the Group revised its accounting policy for the presentation of equity entries arising from share-based payment transactions. Previously, the credit entry for share-based payment charges was recognised in the share-based payment reserve. Under the revised policy, the Group now recognises this credit directly in retained earnings. The change was made to better reflect the nature of the expense as part of the Group's accumulated profits and losses, and to align with common industry practice. The change in policy has been applied retrospectively in accordance with IAS 8 Accounting Policies, Changes in Accounting Estimates and Errors. As a result, comparative figures have been restated, and an adjustment has been made to the opening balance of equity as at the beginning of the earliest comparative period.
5. Segmental information
During the financial year, the Group sold its International business ("BMI") and subsequently, this operating segment has been removed from the segmental reporting and reported within discontinued operations.
As a result, the Group has one reportable segment, consistent with the information that the Board of Directors, which is the Group's chief operating decision maker, uses internally for evaluating the performance of its Group, and is therefore not presenting a segmental analysis in accordance with IFRS 8 'Operating Segments'.
The required disclosures in accordance with IFRS 8, regarding revenues from major clients and geographical location, are disclosed in note 6.
6. Revenue
|
2025 £'000 |
2024 restated1 £'000 |
|
|
Investment management fees |
66,237 |
67,825 |
|
Fund management fees |
6,598 |
6,914 |
|
Financial planning income |
17,102 |
8,182 |
|
Transactional income and foreign exchange trading fees |
14,022 |
12,394 |
|
Interest income |
7,601 |
11,367 |
|
Total revenue |
111,560 |
106,682 |
1 The prior financial year has been restated to exclude the results of discontinued operations, consistent with the presentation in the current financial year. Refer to note 13 for details of the results of discontinued operations.
6(a) Geographic analysis
The Group's continuing operations are located in the United Kingdom; therefore all Group revenue is recognised in this jurisdiction. The Group's discontinued operations in relation to BMI are located in Jersey and Guernsey (refer to note 13).
6(b) Major clients
The Group is not reliant on any one client or group of connected clients for the generation of revenues.
7. Administrative costs
Administrative costs are recognised as the services are received. The largest component of the Group's administrative costs are employee costs as shown below. Other costs included in administrative costs are set out in note 9.
7(a) Employee costs
|
2025 £'000 |
2024 restated1 £'000 |
|
|
Wages and salaries |
40,420 |
40,338 |
|
Social security costs |
5,300 |
5,206 |
|
Other pension costs |
2,144 |
1,801 |
|
Share-based payments |
1,379 |
1,366 |
|
Redundancy costs |
1,792 |
1,588 |
|
Total employee costs |
51,035 |
50,299 |
1 The prior financial year has been restated to exclude the results of discontinued operations, consistent with the presentation in the current financial year. Refer to note 13 for details of the results of discontinued operations.
Pension costs relate entirely to a defined contribution scheme.
7(b) Average number of employees
The average number of persons employed by the Group during the financial year, including Directors, was as follows:
|
2025 Number of employees |
2024 restated1 Number of employees |
|
|
Business employees |
299 |
257 |
|
Functional employees |
174 |
156 |
|
Average number of persons employed |
473 |
413 |
1 The prior financial year has been restated to exclude the results of discontinued operations, consistent with the presentation in the current financial year. Refer to note 13 for details of the results of discontinued operations.
8. Other (losses)/gains
Other (losses)/gains represent the net changes in the fair value of the Group's financial instruments recognised in the consolidated statement of comprehensive income.
|
Note |
2025 £'000 |
2024 £'000 |
|
|
(Loss)/gain in fair value of deferred contingent consideration payable |
26 |
(341) |
3 |
|
Gain on redemption of assets held at amortised cost |
25 |
- |
|
|
Gain in fair value of financial assets at fair value through profit or loss |
20 |
44 |
80 |
|
Other (losses)/gains |
(272) |
83 |
9. Operating profit
Statutory profit is stated after charging for the following administrative costs:
|
Note |
2025 £'000 |
2024 restated1 £'000 |
|
|
Employee costs |
7 |
51,035 |
50,299 |
|
Acquisition and integration-related costs |
15 |
4,390 |
175 |
|
Amortisation of client relationships |
3,997 |
3,384 |
|
|
Amortisation of computer software |
2,294 |
1,376 |
|
|
Move to LSE's Main Market costs |
15 |
1,926 |
- |
|
Auditors' remuneration (see below) |
1,783 |
996 |
|
|
Depreciation of right-of-use assets |
1,661 |
1,577 |
|
|
Financial Services Compensation Scheme levy (see below) |
1,114 |
672 |
|
|
Depreciation of property, plant and equipment |
520 |
567 |
|
|
Impairment of right-of-use assets |
411 |
- |
1 The prior financial year has been restated to separate the results of discontinued operations, consistent with the presentation in the current financial year. Refer to note 13 for details of the results of discontinued operations.
Financial Services Compensation Scheme levies
Administrative costs for the year ended 30 June 2025 include a charge of £1,114,000 (2024: £672,000) in respect of the Financial Services Compensation Scheme ("FSCS") levy, all of which is in respect of the estimated levy for the 2025/26 scheme year.
A more detailed analysis of auditors' remuneration is provided below:
|
2025 £'000 |
2024 restated1 £'000 |
|
|
Fees payable to the Company's auditors for the audit of the consolidated Group and Parent Company financial statements |
610 |
356 |
|
Fees payable to the Company's auditors and its associates for other services: |
||
|
- Audit of the Company's subsidiaries pursuant to legislation |
184 |
177 |
|
- Audit-related assurance services |
530 |
462 |
|
- Non-audit-related services |
458 |
2 |
|
Total auditors' remuneration |
1,783 |
996 |
1 The prior financial year has been restated to separate the impact of discontinued operations on auditors' remuneration of £314,000, consistent with the presentation in the current financial year. Refer to note 13 for details of the results from discontinued operations.
10. Finance income and finance costs
|
Note |
2025 £'000 |
2024 restated1 £'000 |
|
|
Finance income |
|||
|
Dividends on preference shares |
20 |
28 |
|
|
Interest on assets held at amortised cost |
20 |
1,108 |
198 |
|
Finance income on deferred contingent consideration receivable |
21 |
273 |
- |
|
Bank interest on deposits |
1,426 |
2,299 |
|
|
Total finance income |
2,827 |
2,525 |
|
|
Finance costs |
|||
|
Finance cost of lease liabilities |
122 |
153 |
|
|
Finance cost of deferred contingent consideration payable |
26 |
426 |
13 |
|
Finance cost of retention liability |
49 |
- |
|
|
Total finance costs |
597 |
166 |
1 The prior financial year has been restated to separate the results of discontinued operations, consistent with the presentation in the current period. Refer to note 13 for details of the results from discontinued operations.
11. Other non-operating income
Other non-operating income mainly relates to a refund of VAT received from HM Revenue and Customs ("HMRC"). During the financial year, the Group received confirmation from HMRC that the supply of certain Group services was exempt from VAT. As a result, the Group received a refund in respect of VAT arising on those services during the period from 1 January 2020 to 30 September 2024. This has been treated as non-operating income in view of its non-recurring nature and given it is outside the ordinary course of business.
12. Taxation from continuing operations
The current tax expense for the year ended 30 June 2025 was calculated based on the Corporation Tax rate of 25.0% (2024: 25.0%).
|
2025 |
2024 restated1 |
|
|
£'000 |
£'000 |
|
|
UK Corporation Tax |
6,670 |
6,027 |
|
Under provision of current tax in prior years |
576 |
202 |
|
Total current tax expense |
7,246 |
6,229 |
|
Deferred tax credits |
(1,357) |
(1,705) |
|
Under provision of deferred tax in prior years |
- |
(288) |
|
Total income tax expense |
5,889 |
4,236 |
1 The prior financial year has been restated to separate the results of discontinued operations, consistent with the presentation in the current financial year. Refer to note 13 for details of the results of discontinued operations.
|
Year ended 30 June 2025 |
Underlying profit £'000 |
Underlying profit adjustments £'000 |
Statutory profit £'000 |
|
Profit before taxation from continuing operations |
28,905 |
(11,386) |
17,519 |
|
Profit multiplied by the standard rate of tax in the UK of 25.0% |
7,226 |
(2,847) |
4,379 |
|
Tax effect of amounts that are not deductible/(taxable) in calculating taxable income: |
|||
|
- Depreciation and amortisation |
(54) |
79 |
25 |
|
- Disallowable expenses |
381 |
983 |
1,364 |
|
- Share-based payments |
(470) |
15 |
(455) |
|
- Under provision in prior years |
576 |
- |
576 |
|
Total income tax expense |
7,659 |
(1,770) |
5,889 |
|
Effective tax rate |
26.5% |
N/A |
33.6% |
|
Year ended 30 June 2024 restated1 |
Underlying profit £'000 |
Underlying profit adjustments £'000 |
Statutory profit £'000 |
|
Profit before taxation from continuing operations |
30,302 |
(5,687) |
24,615 |
|
Profit multiplied by the standard rate of tax in the UK of 25.0% |
7,576 |
(1,422) |
6,154 |
|
Tax effect of amounts that are not deductible/(taxable) in calculating taxable income: |
|||
|
- Depreciation and amortisation |
(361) |
(47) |
(408) |
|
- Non-taxable income |
(20) |
- |
(20) |
|
- Disallowable expenses |
166 |
- |
166 |
|
- Share-based payments |
(1,676) |
106 |
(1,570) |
|
- Under provision in prior years |
(86) |
- |
(86) |
|
Total income tax expense |
5,599 |
(1,363) |
4,236 |
|
Effective tax rate |
18.5% |
N/A |
17.2% |
1 The prior financial year has been restated to separate the results of discontinued operations, consistent with the presentation in the current financial year. Refer to note 13 for details of the results of discontinued operations. In addition, there has been an update to the results presented in the restated comparative period previously disclosed in the interim report and accounts for the six months ended 31 December 2024. Refer to note 2 for further details.
The statutory rate of Corporation Tax applied to the taxable profit for the year ended 30 June 2025 is 25.0% (year ended 30 June 2024: 25.0%). Deferred tax assets and liabilities are calculated at the rate that is expected to be in force when the temporary differences unwind.
13. Result from discontinued operations
13(a) Summary financials
On 21 February 2025, the Group completed the sale of BMI, which made up the Group's previously reported International segment. As a result, the BMI-related operations have been reclassified as discontinued operations in these consolidated financial statements in accordance with IFRS 5 'Non-current assets held for sale and discontinued operations'.
Additionally, on 31 October 2024, Brooks Macdonald Asset Management Limited resigned as investment manager to DCF (subsequently renamed SVS RM Defensive Capital Fund) and accordingly, the related revenue and expenses have also been reclassified as discontinued operations in the consolidated statement of comprehensive income.
|
2025 £'000 |
2024 restated1 £'000 |
|
|
(Loss)/profit from discontinued operations before tax |
(382) |
158 |
|
Taxation expense on discontinued operations |
(199) |
(926) |
|
Gain/(loss) on disposal of International disposal group |
9,391 |
(1,513) |
|
Gain on disposal of DCF discontinued operations |
936 |
- |
|
Change in fair value of deferred consideration receivable |
(392) |
- |
|
Goodwill impairment on discontinued operations |
- |
(11,641) |
|
Result from discontinued operations |
9,354 |
(13,922) |
1 There has been an update to the results presented in the restated comparative period previously disclosed in the interim report and accounts for the six months ended 31 December 2024. Refer to note 2 for further details.
Cash flow statement of discontinued operations
The net cash flows generated by discontinued operations are as follows:
|
2025 £'000 |
2024 £'000 |
|
|
Net cash flows from operating activities |
1,432 |
1,963 |
|
Net cash flows from investing activities |
(25) |
516 |
|
Net cash flows from financing activities |
(254) |
(350) |
|
Cash disposed of |
(7,402) |
- |
|
Net cash flows from discontinued operations |
(6,249) |
2,129 |
13(b) International disposal group
Result
The results of discontinued operations for the International disposal group are shown below:
|
2025 £'000 |
2024 restated1 £'000 |
|
|
Revenue |
11,859 |
19,911 |
|
Administrative costs |
(12,563) |
(20,687) |
|
Operating loss |
(704) |
(776) |
|
Finance income |
283 |
516 |
|
Finance costs |
(14) |
(39) |
|
Loss before tax |
(435) |
(299) |
|
Taxation credit/(expense) |
12 |
(812) |
|
Loss after tax |
(423) |
(1,111) |
|
Gain/(loss) on disposal of International disposal group |
9,391 |
(1,513) |
|
Goodwill impairment on discontinued operations |
- |
(11,641) |
|
Result from discontinued operations |
8,968 |
(14,265) |
1 There has been an update to the results presented in the restated comparative period previously disclosed in the interim report and accounts for the six months ended 31 December 2024. Refer to note 2 for further details.
In the prior financial year the Group recognised an impairment loss of £11,641,000 against the International CGU. This followed an impairment review triggered by macroeconomic pressures, market volatility, and client fund withdrawals.
Gain/(loss) on disposal
|
2025 £'000 |
2024 £'000 |
|
|
Initial cash consideration |
27,147 |
- |
|
Fair value of deferred contingent consideration receivable |
13,649 |
- |
|
Amounts payable to buyer for employee retention |
(2,753) |
- |
|
Total consideration |
38,043 |
- |
|
Net assets disposed |
(25,017) |
- |
|
Costs to sell |
(3,635) |
(1,513) |
|
Gain/(loss) on disposal of International disposal group |
9,391 |
(1,513) |
On completion, the Group received initial cash consideration of £27,147,000. Deferred contingent consideration of up to £22,850,000 is receivable two years post-completion contingent on BMI reaching certain revenue targets on an actual and run-rate basis. On disposal, the estimated fair value of net deferred contingent consideration receivable was £13,649,000. The net assets disposed represent the net assets of BMI on the Group's balance sheet as at the completion date which includes client relationship intangible assets, goodwill and associated deferred tax liabilities attributable to BMI.
The costs to assist with the disposal of BMI relate to third-party consultancy spend and corporate advisory fees. £1,513,000 of these costs were incurred in the prior financial year, therefore the gain recognised in the current financial year excludes these costs.
This gain is presented within profit from discontinued operations in the consolidated statement of comprehensive income for the year ended 30 June 2025.
13(c) DCF
Result
The results of discontinued operations for DCF are shown below:
|
2025 £'000 |
2024 restated1 £'000 |
|
|
Revenue |
344 |
1,669 |
|
Administrative costs |
(292) |
(1,223) |
|
Operating profit |
52 |
446 |
|
Net finance income |
1 |
11 |
|
Profit before tax |
53 |
457 |
|
Taxation |
(13) |
(114) |
|
Profit after tax |
40 |
343 |
|
Gain on disposal of DCF discontinued operations |
936 |
- |
|
Change in fair value of deferred contingent consideration |
(392) |
- |
|
Taxation on gain on disposal of DCF discontinued operations |
(198) |
- |
|
Result from discontinued operations |
386 |
343 |
1 There has been an update to the results presented in the restated comparative period previously disclosed in the interim report and accounts for the six months ended 31 December 2024. Refer to note 2 for further details.
Gain on disposal
|
£'000 |
|
|
Initial cash consideration received |
523 |
|
Fair value of deferred contingent consideration receivable |
658 |
|
Total consideration |
1,181 |
|
Net assets disposed |
(245) |
|
Gain on disposal of DCF |
936 |
Initial cash consideration of £523,000 was received on completion, and additional cash consideration will be receivable, contingent on funds under management meeting certain targets over a three-year period post disposal. On disposal, the estimated fair value of deferred contingent consideration receivable was £658,000. Net assets disposed is the goodwill previously recognised by the Group attributable to DCF.
This gain on disposal is presented within profit from discontinued operations in the consolidated statement of comprehensive income for the year ended 30 June 2025.
14. Business combinations
On 29 October 2024, the Group acquired CST Wealth Management Limited ("CST"), a chartered financial planning firm based in Wales with assets under advice of c.£170 million and c.500 clients. The acquisition consisted of acquiring 100% of the issued share capital of CST.
On 29 November 2024, the Group completed the acquisition of Lucas Fettes (Holdings) Limited and its wholly-owned subsidiary Lucas Fettes and Partners (Financial Services) Limited (together "Lucas Fettes"), a Norwich-based financial planning provider with assets under advice of c.£890 million and c.300 corporate and employee benefit clients. The acquisition consists of acquiring 100% of the issued share capital of Lucas Fettes.
On 31 January 2025, the Group completed the acquisition of LIFT-Financial Group Limited and LIFT-Invest Limited (together, "LIFT"). The acquisition brings additional assets under advice of c.£1.6 billion and c.1,350 clients made up of private individuals, predominantly in financial services and professional sports, families and corporate clients. In addition to wealth management, LIFT offers mortgage and insurance services. The acquisition consists of acquiring 100% of the issued share capital of LIFT.
All three acquisitions were primarily funded through the Group's existing financial resources with a small portion of the purchase consideration settled via the issuance of ordinary shares. The acquisitions align with the Group's strategy to expand its client reach and accelerate growth in financial planning. The acquired businesses have been integrated into the Group's financial planning business and will enhance its existing financial planning capability. They bring a strong presence in geographical areas where there is opportunity to grow and complement those previously and newly acquired businesses.
The acquisitions have been accounted for using the acquisition method and details of the purchase consideration are as follows:
|
Notes |
CST £'000 |
Lucas Fettes £'000 |
LIFT £'000 |
Total £'000 |
|
|
Initial cash consideration |
1,250 |
4,294 |
30,131 |
35,675 |
|
|
Initial share consideration |
i |
500 |
206 |
- |
706 |
|
Cash consideration for excess net assets |
ii |
1,472 |
1,382 |
- |
2,854 |
|
Deferred contingent consideration at fair value |
iii |
1,378 |
4,281 |
8,899 |
14,558 |
|
Total purchase consideration |
4,600 |
10,163 |
39,030 |
53,793 |
i. The Group issued 42,673 ordinary shares to the previous shareholders at a price of £16.41 and £16.61 per share. The number of shares issued was based on the average 5-day mid-market share price at the completion date to provide the equivalent consideration value of £706,000.
ii. In accordance with the relevant sales purchase agreement ("SPA"), the Group was required to pay the difference between the available capital and the required regulatory capital.
iii. The total estimated fair value of deferred contingent cash consideration at the respective acquisition dates was £14,558,000, with deferred payments due to be made at either one or two years post-acquisition contingent on targets relating to client attrition and the underlying profitability of the acquired businesses. The maximum undiscounted deferred contingent consideration payable is £21,250,000.
14(a) Net assets acquired through business combinations
|
CST £'000 |
Lucas Fettes £'000 |
LIFT £'000 |
Total £'000 |
|
|
Tangible fixed assets |
- |
29 |
53 |
82 |
|
Trade and other receivables |
463 |
1,635 |
177 |
2,275 |
|
Cash at bank |
1,299 |
894 |
2,185 |
4,378 |
|
Trade and other payables |
(10) |
(568) |
(488) |
(1,066) |
|
Provisions |
- |
- |
(375) |
(375) |
|
Corporation tax (payable)/receivable |
(158) |
180 |
(422) |
(400) |
|
Total net assets recognised by acquired companies |
1,594 |
2,170 |
1,130 |
4,894 |
|
Fair value adjustments: |
||||
|
Client relationship contracts |
1,764 |
5,512 |
15,701 |
22,977 |
|
Deferred tax liabilities |
(441) |
(1,378) |
(3,925) |
(5,744) |
|
Net identifiable assets |
2,917 |
6,304 |
12,906 |
22,127 |
|
Goodwill |
1,683 |
3,859 |
26,124 |
31,666 |
|
Total purchase consideration |
4,600 |
10,163 |
39,030 |
53,793 |
The trade and other receivables were recognised at their fair value, being the gross contractual amounts, deemed fully recoverable.
Client relationship intangible assets of £22,977,000 were recognised on acquisition in respect of the expected cash inflows and economic benefit from the acquired business. An associated deferred tax liability of £5,744,000 was recognised in relation to the expected cash inflows on the acquired client relationship intangible asset. Goodwill of £31,666,000 was recognised on acquisition in respect of the expected growth in the acquired businesses and associated cash inflows. The fair value of the assets acquired were the gross contractual amounts and were all considered to be fully recoverable. The fair value of the identifiable assets and liabilities acquired, at the dates of acquisition, are detailed above.
14(b) Acquisition impact on reported results
In the period from acquisition to 30 June 2025, the consolidated statement of comprehensive income included revenue of £9,025,000 and statutory profit before tax of £2,797,000 from the acquired entities. Had the acquired entities been consolidated from 1 July 2024, the consolidated statement of comprehensive income would have included revenue of £19,188,000 and statutory profit before tax of £5,035,000.
14(c) Net cash outflow resulting from business combinations
|
CST £'000 |
Lucas Fettes £'000 |
LIFT £'000 |
Total £'000 |
|
|
Total purchase consideration |
4,600 |
10,163 |
39,030 |
53,793 |
|
Less shares issued as consideration |
(500) |
(206) |
- |
(706) |
|
Less deferred cash contingent consideration at fair value |
(1,378) |
(4,282) |
(8,899) |
(14,559) |
|
Cash paid for acquired businesses |
2,722 |
5,675 |
30,131 |
38,528 |
|
Less cash held by acquired entities |
(1,299) |
(894) |
(2,185) |
(4,378) |
|
Net cash outflow - investing activities |
1,423 |
4,781 |
27,946 |
34,150 |
15. Earnings per share
The Board of Directors considers that underlying earnings per share provides an appropriate reflection of the Group's performance in the financial year. Underlying earnings per share are calculated based on 'underlying earnings', which is defined as earnings after underlying adjustments listed below. The tax effect of these adjustments has also been considered. Underlying earnings is an alternative performance measure ("APM") used by the Group.
Earnings for the financial year used to calculate earnings per share as reported in these consolidated financial statements were as follows:
|
2025 |
2024 restated1 |
||
|
Note |
£'000 |
£'000 |
|
|
Earnings from continuing operations |
11,630 |
20,379 |
|
|
Earnings/(loss) from discontinued operations |
13 |
9,354 |
(13,922) |
|
Earnings after tax attributable to ordinary shareholders |
20,984 |
6,457 |
|
|
Acquisition and integration related costs |
4,390 |
433 |
|
|
Amortisation of acquired client relationships |
3,997 |
3,383 |
|
|
Organisational restructure |
2,084 |
2,129 |
|
|
Move to LSE's Main Market costs |
1,926 |
- |
|
|
Head office relocation |
1,278 |
- |
|
|
Other non-operating items |
(2,289) |
(258) |
|
|
Tax impact of underlying profit adjustments |
12 |
(1,770) |
(1,362) |
|
Less (earnings)/loss from discontinued operations |
13 |
(9,354) |
13,922 |
|
Underlying earnings attributable to ordinary shareholders from continuing operations |
21,246 |
24,704 |
1 The prior financial year has been restated to separate the results of discontinued operations, consistent with the presentation in the current financial year. Refer to note 13 for details of the results of discontinued operations. In addition, there has been an update to the results presented in the restated comparative period previously disclosed in the interim report and accounts for the six months ended 31 December 2024. Refer to note 2 for further details.
Other non-operating items primarily relates to a refund from HMRC (£3.1 million) in respect of VAT arising on the Group's AIM Portfolio Services as it was confirmed this was exempt from VAT, covering the period from 1 October 2019 to 30 September 2024. This is partially offset by legacy legal costs (£0.3 million) and strategy-related review costs conducted as a result of the significant business change following the acquisitions and BMI disposal (£0.5 million). These items are excluded from underlying results in view of their non-recurring nature.
Basic earnings per share is calculated by dividing earnings attributable to ordinary shareholders by the weighted average number of shares in issue throughout the period. Included in the weighted average number of shares for basic earnings per share purposes are employee share options at the point all necessary conditions have been satisfied and the options have vested, even if they have not yet been exercised.
Diluted earnings per share represents the basic earnings per share adjusted for the effect of dilutive potential shares issuable on exercise of employee share options under the Group's share-based payment schemes, weighted for the relevant period. The diluted weighted average number of shares in issue and diluted earnings per share considers the effect of all dilutive potential shares issuable on exercise of employee share options. The potential shares issuable includes the contingently issuable shares related to share awards that have not yet vested and the vested unissued share options that are either nil cost options or have little or no consideration.
The weighted average number of shares in issue were as follows:
|
2025 |
2024 |
|
|
Number of shares |
Number of shares |
|
|
Weighted average number of shares in issue |
16,160,786 |
16,098,412 |
|
Effect of dilutive potential shares issuable on exercise of employee share options |
135,256 |
275,450 |
|
Diluted weighted average number of shares in issue |
16,296,042 |
16,373,862 |
|
2025 p |
2024 restated1 p |
|
|
Based on reported earnings: |
||
|
Basic earnings per share from continuing operations |
72.0 |
126.6 |
|
Basic earnings/(loss) per share from discontinued operations |
57.9 |
(86.5) |
|
Total statutory basic earnings per share |
129.9 |
40.1 |
|
Diluted earnings per share from continuing operations |
71.4 |
124.5 |
|
Diluted earnings/(loss) per share from discontinued operations |
57.4 |
(85.0) |
|
Total statutory diluted earnings per share |
128.8 |
39.5 |
|
Based on underlying earnings from continuing operations: |
||
|
Basic underlying earnings per share |
131.5 |
153.5 |
|
Diluted underlying earnings per share |
130.4 |
150.9 |
1 The prior financial year has been restated to separate the results of discontinued operations, consistent with the presentation in the current financial year. Refer to note 13 for details of the results of discontinued operations. In addition, there has been an update to the results presented in the restated comparative period previously disclosed in the interim report and accounts for the six months ended 31 December 2024. Refer to note 2 for further details.
16. Dividends
Amounts recognised as distributions to equity holders of the Company in the financial year were as follows:
|
2025 £'000 |
2024 £'000 |
|
|
Final dividend paid for the year ended 30 June 2024 of 49.0p (2023: 47.0p) per share |
7,872 |
7,467 |
|
Interim dividend paid for the year ended 30 June 2025 of 30.0p (2024: 29.0p) per share |
4,823 |
4,627 |
|
Total dividends |
12,695 |
12,094 |
The interim dividend of 30.0p (2024: 29.0p) per share was paid on 11 April 2025.
A final dividend for the year ended 30 June 2025 of 51.0p (2024: 49.0p) per share was declared by the Board of Directors on 3 September 2025 and is subject to approval by the shareholders at the Company's Annual General Meeting. It will be paid on 4 November 2025 to shareholders who are on the register at the close of business on 19 September 2025. Based on the current number of shares in issue at the date of signing this report, and excluding own shares held, the total amount payable for the final dividend would be £7.9 million.
17. Intangible assets
|
Goodwill £'000 |
Computer software and system development costs £'000 |
Client relationship contracts £'000 |
Total £'000 |
|
|
Cost |
||||
|
At 30 June 2023 |
64,373 |
8,830 |
76,098 |
149,301 |
|
Additions |
- |
1,734 |
- |
1,734 |
|
At 30 June 2024 |
64,373 |
10,564 |
76,098 |
151,035 |
|
Additions |
31,667 |
7,491 |
22,977 |
62,135 |
|
Disposals |
(249) |
- |
- |
(249) |
|
Disposal of subsidiary |
(21,243) |
- |
(29,930) |
(51,173) |
|
At 30 June 2025 |
74,548 |
18,055 |
69,145 |
161,748 |
|
Accumulated amortisation and impairment |
||||
|
At 30 June 2023 |
11,213 |
359 |
37,147 |
48,719 |
|
Amortisation charge |
- |
1,603 |
5,848 |
7,451 |
|
Impairment |
11,641 |
- |
- |
11,641 |
|
At 30 June 2024 |
22,854 |
1,962 |
42,995 |
67,811 |
|
Amortisation charge |
- |
2,480 |
5,863 |
8,343 |
|
Disposal of subsidiary |
(11,641) |
- |
(22,230) |
(33,871) |
|
At 30 June 2025 |
11,213 |
4,442 |
26,628 |
42,283 |
|
Net book value |
||||
|
At 30 June 2023 |
53,160 |
8,471 |
38,951 |
100,582 |
|
At 30 June 2024 |
41,519 |
8,602 |
33,103 |
83,224 |
|
At 30 June 2025 |
63,335 |
13,613 |
42,517 |
119,465 |
The amortisation charge of intangible assets is recognised within administrative costs in the consolidated statement of comprehensive income.
17(a) Goodwill
Goodwill acquired through business combinations is allocated to the respective CGUs that benefit from the acquisition. Impairment reviews are conducted annually to assess the recoverability of goodwill. As of 30 June 2025, the impairment assessments determined that no goodwill impairment is required for the CGUs within the Group.
Carrying amount of goodwill by CGU
|
CGU |
2025 £'000 |
2024 £'000 |
|
LIFT |
26,124 |
- |
|
Cornelian |
15,863 |
16,111 |
|
Adroit |
8,541 |
8,541 |
|
Integrity |
3,945 |
3,945 |
|
Lucas Fettes |
3,859 |
- |
|
Funds |
3,320 |
3,320 |
|
CST |
1,683 |
- |
|
International |
- |
9,602 |
|
Total goodwill |
63,335 |
41,519 |
During the year ended 30 June 2025, goodwill was acquired through the acquisitions of CST, Lucas Fettes and LIFT (note 14). Conversely, goodwill related to the disposals of the DCF (which was part of the Braemar acquisition) and International CGUs were derecognised (note 13).
Impairment assessment method and key assumptions
The recoverable amount of each CGU is estimated using value-in-use calculations based on five-year cash flow projections, derived from the most recent budgets and forecasts approved by subsidiary boards. These cash flows are extrapolated using a long-term growth rate of 2%, reflective of historical performance, management strategies and prevailing economic conditions. The key judgements and estimates use in the impairment calculations are the pre-tax discount rates and annual revenue growth. These are set out in the table below and reflect market conditions and specific business risks of the CGU.
|
CGU |
Pre-tax discount rate |
Annual revenue growth |
|
LIFT |
11% |
7%-8% |
|
Cornelian |
12% (2024: 13%) |
8%-10% (2024: 8%-9%) |
|
Adroit |
12% (2024: 14%) |
9%-10% (2024: 9%-15%) |
|
Integrity |
14% (2024: 14%) |
16%-28% (2024: 8%-13%) |
|
Lucas Fettes |
13% |
9%-10% |
|
Funds |
14% (2024: 15%) |
(4)%-0% (2024: 2%-9%) |
|
CST |
12% |
9%-10% |
All CGUs with goodwill showed surplus recoverable amounts over carrying amounts in the impairment assessments as of 30 June 2025. No significant changes to assumptions of CGU-specific risks necessitate further disclosure.
Sensitivity analysis: reasonably possible changes to assumptions
The below table reflects the sensitivity analysis conducted to determine the potential for impairment under reasonably possible changes in assumptions.
|
CGU |
Change in pre-tax discount rate |
Change in revenue growth rate |
|
LIFT |
Increase to 14% |
Reduction to (2)%-(1)% |
|
Cornelian |
Increase to 14% |
Reduction to 1%-3% |
|
Adroit |
Increase to 15% |
Reduction to 1%-2% |
|
Integrity |
Increase to 22% |
Reduction to 0%-12% |
|
Lucas Fettes |
Increase to 16% |
Reduction to 4%-5% |
|
Funds |
* |
* |
|
CST |
* |
* |
* There are no reasonably possible changes to assumptions that would result in an impairment.
17(b) Computer software
Internally developed software is amortised on a straight-line basis over a lifespan of approximately four years, subject to specific project adjustments based on size and usability.
17c) Acquired client relationship contracts
Acquired client relationship contracts represent fair value and are amortised over estimated useful lives ranging from six to twenty years.
The additions within the financial year relate to client relationships recognised on acquisition, including the acquisition of a portfolio of financial advice clients, totalling £22,977,000.
18. Property, plant and equipment
|
Leasehold improvements £'000 |
Fixtures, fittings and office equipment £'000 |
IT equipment £'000 |
Total £'000 |
|
|
Cost |
||||
|
At 1 July 2023 |
3,146 |
642 |
966 |
4,754 |
|
Additions |
13 |
47 |
23 |
83 |
|
Disposals |
(11) |
(3) |
(3) |
(17) |
|
At 30 June 2024 |
3,148 |
686 |
986 |
4,820 |
|
Additions |
2,617 |
183 |
477 |
3,277 |
|
Disposals |
- |
(7) |
- |
(7) |
|
Disposal of subsidiary |
(730) |
(151) |
(146) |
(1,027) |
|
At 30 June 2025 |
5,035 |
711 |
1,317 |
7,063 |
|
Accumulated depreciation |
||||
|
At 1 July 2023 |
1,647 |
442 |
542 |
2,631 |
|
Depreciation charge |
571 |
95 |
190 |
856 |
|
Depreciation on disposals |
(11) |
(3) |
(3) |
(17) |
|
At 30 June 2024 |
2,207 |
534 |
729 |
3,470 |
|
Additions |
51 |
144 |
138 |
333 |
|
Depreciation charge |
384 |
84 |
178 |
646 |
|
Disposal of subsidiary |
(566) |
(105) |
(133) |
(804) |
|
At 30 June 2025 |
2,076 |
657 |
912 |
3,645 |
|
Net book value |
||||
|
At 30 June 2023 |
1,499 |
200 |
424 |
2,123 |
|
At 30 June 2024 |
941 |
152 |
257 |
1,350 |
|
At 30 June 2025 |
2,959 |
54 |
405 |
3,418 |
19. Right-of-use assets
|
Cars £'000 |
Property £'000 |
Total £'000 |
||
|
Cost |
||||
|
At 1 July 2023 |
798 |
10,138 |
10,936 |
|
|
Additions |
174 |
1,125 |
1,299 |
|
|
Adjustment on change of lease terms |
(91) |
(315) |
(406) |
|
|
At 30 June 2024 |
881 |
10,948 |
11,829 |
|
|
Additions |
52 |
12,423 |
12,475 |
|
|
Adjustment on change of lease terms |
- |
(2) |
(2) |
|
|
Disposal of subsidiary |
- |
(1,970) |
(1,970) |
|
|
At 30 June 2025 |
933 |
21,399 |
22,332 |
|
|
Accumulated depreciation and impairment |
||||
|
At 1 July 2023 |
195 |
6,412 |
6,607 |
|
|
Depreciation charge |
210 |
1,929 |
2,139 |
|
|
Adjustment on change of lease terms |
50 |
(192) |
(142) |
|
|
At 30 June 2024 |
455 |
8,149 |
8,604 |
|
|
Depreciation charge |
192 |
2,093 |
2,285 |
|
|
Adjustment on change of lease terms |
51 |
- |
51 |
|
|
Disposal of subsidiary |
- |
(1,809) |
(1,809) |
|
|
Impairment |
- |
411 |
411 |
|
|
At 30 June 2025 |
698 |
8,844 |
9,542 |
|
|
Net book value |
||||
|
At 30 June 2023 |
603 |
3,726 |
4,329 |
|
|
At 30 June 2024 |
426 |
2,799 |
3,225 |
|
|
At 30 June 2025 |
235 |
12,555 |
12,790 |
The Group offers a car leasing arrangement to provide a salary sacrifice car leasing scheme for employees. Each vehicle leased to individual employees creates a separate right-of-use asset and lease liability measured at present value of the remaining lease payments, discounted using the lessee's estimated incremental borrowing rate (see note 24).
The property additions relate to two new leases that commenced during the financial year.
As at 30 June 2025, the Company recognised right-of-use assets totalling £11,509,000 in respect of a lease agreement for the Group's head office relocation, with a 10-year term and no break options, a rent review scheduled five years from lease commencement, a 25-month rent-free period at the start of the lease and no rent deposit required. The Company has assessed the ROU asset of the existing London office for impairment and recognised an impairment charge of £411,000 in the statement of comprehensive income.
20. Financial assets and liabilities
Financial assets and liabilities comprise the following:
|
Financial assets |
2025 £'000 |
2024 £'000 |
|
Financial assets at fair value through other comprehensive income |
- |
500 |
|
Financial assets measured at amortised cost |
56,243 |
78,089 |
|
Financial assets held at amortised cost |
19,925 |
29,963 |
|
Cash and cash equivalents (note 23) |
33,915 |
44,731 |
|
Trade and other receivable (note 22) |
2,403 |
3,395 |
|
Financial assets at fair value through profit and loss |
15,283 |
905 |
|
Financial assets held at fair value through profit and loss |
1,095 |
905 |
|
Deferred contingent consideration receivable (note 21) |
14,188 |
- |
|
Total financial assets |
71,526 |
79,494 |
|
Financial liabilities |
2025 £'000 |
2024 £'000 |
|
Financial assets measured at amortised cost |
7,959 |
3,728 |
|
Trade payables (note 29) |
7,959 |
3,728 |
|
Financial liabilities measured at fair value through profit and loss |
16,105 |
- |
|
Deferred contingent consideration payable (note 26) |
16,105 |
- |
|
Total financial liabilities |
24,064 |
3,728 |
20(a) Financial assets held at amortised cost
|
2025 £'000 |
2024 £'000 |
|
|
At 1 July |
29,963 |
- |
|
Additions |
- |
29,978 |
|
Disposals |
(9,959) |
- |
|
Interest income under EIR method |
1,108 |
197 |
|
Contractual coupons received |
(1,187) |
(212) |
|
At 30 June |
19,925 |
29,963 |
The Group holds UK Government Investment Loan and Treasury Stock ("Gilts"). The Gilts carry coupon rates ranging from 1.5%-4.5% per annum and have maturity dates ranging from 2026-2028. The Group partially disposed of its Gilts holding to meet a short-term liquidity requirement to fund the acquisition of LIFT. Refer to note 4(k) for further detail on the accounting treatment of financial assets held at amortised cost.
20(b) Financial assets at fair value through other comprehensive income
|
2025 £'000 |
2024 £'000 |
|
|
At 1 July |
500 |
500 |
|
Disposal |
(500) |
- |
|
At 30 June |
- |
500 |
During the year ended 30 June 2025, the Group disposed of its investment of redeemable £500,000 preference shares in an unlisted company incorporated in the UK.
20(c) Financial assets at fair value through profit or loss
|
2025 £'000 |
2024 £'000 |
|
|
At 1 July |
905 |
825 |
|
Additions |
14,453 |
- |
|
Changes in fair value |
(75) |
80 |
|
At 30 June |
15,283 |
905 |
Included in financial assets at fair value through profit and loss are amounts related to deferred contingent consideration receivable of £14,188,000 (see note 21 for further details).
The Group holds 500,000 shares in five of the SVS Cornelian Risk Managed Passive Funds. During the year ended 30 June 2025, the Group recognised a gain on these investments of £25,000. The Group's holding in the SVS Cornelian Risk Managed Passive Funds at 30 June 2025 was £676,000.
The Group previously invested £215,000 in the Blueprint Multi Asset Fund range across the various models within the fund range. During the year ended 30 June 2025, the Group recognised a gain on these investments of £14,000. The Group's holding in the Blueprint Multi Asset Fund range at 30 June 2025 was £268,000. Within the year, the Group invested an additional £135,000 in the MPS Fund and £11,000 in the Cornelian J Class fund range. These investments generated a combined gain of £5,000. As of year-end, the Group's total holdings across these fund ranges amounted to £151,000.
20(d) Levelling analysis
The following table provides an analysis of the financial assets and liabilities that, subsequent to initial recognition, are measured at fair value. These are grouped into the following levels within the fair value hierarchy, based on the degree to which the inputs used to determine the fair value are observable:
• Level 1 - derived from quoted prices in active markets for identical assets or liabilities at the measurement date;
• Level 2 - derived from inputs other than quoted prices included within Level 1 that are observable, either directly or indirectly; and
• Level 3 - derived from inputs that are not based on observable market data.
|
Level 1 £'000 |
Level 2 £'000 |
Level 3 £'000 |
Total £'000 |
|
|
Financial assets |
||||
|
At 1 July 2024 |
905 |
- |
500 |
1,405 |
|
Additions |
146 |
- |
14,307 |
14,453 |
|
Net changes in fair value |
44 |
- |
(392) |
(348) |
|
Finance income on deferred contingent consideration receivable |
- |
- |
273 |
273 |
|
Disposals |
- |
- |
(500) |
(500) |
|
At 30 June 2025 |
1,095 |
- |
14,188 |
15,283 |
Level 3 financial assets include an addition for deferred contingent consideration receivable, which due to materiality is separately disclosed on the consolidated statement of financial position. Disposals during the period relate to unlisted preference shares, which are valued using a perpetuity income model, based upon the preference dividend cash flows. The fair value of the assets was not deemed to be impacted by changes in the unobservable inputs as the dividend cash flows were contractual.
|
Level 1 £'000 |
Level 2 £'000 |
Level 3 £'000 |
Total £'000 |
|
|
Financial liabilities |
||||
|
At 1 July 2024 |
- |
- |
- |
- |
|
Additions |
- |
- |
15,338 |
15,338 |
|
Finance cost of deferred contingent consideration payable |
- |
- |
426 |
426 |
|
Net changes in fair value |
- |
- |
341 |
341 |
|
At 30 June 2025 |
- |
- |
16,105 |
16,105 |
Level 3 financial liabilities relate to deferred contingent consideration payable, valued using the net present value of the expected future amounts payable. The key inputs are management-approved forecasts and expectations against the criteria of the deferred contingent consideration to set expectations of future amounts payable. The deferred contingent consideration is reviewed and revalued at regular intervals over the deferred contingent consideration period (refer to note 26). The fair value is sensitive to the change in management-approved forecasts, which relate to revenue and AUM projections for future periods, however, at each reporting date, the relevant management approved forecasts are deemed to be the most accurate and relevant input to the fair value measurement.
21. Deferred contingent consideration receivable
Deferred contingent consideration receivable reflects the Directors' best estimate of amounts receivable in the future in respect of the sale of certain subsidiary undertakings and businesses. Deferred contingent consideration receivable is measured at its fair value based on discounted expected future cash flows. The movements in the total deferred contingent consideration receivable balance during the financial year were as follows:
|
2025 £'000 |
2024 £'000 |
|
|
At 1 July |
- |
- |
|
Additions |
14,307 |
- |
|
Finance income on deferred contingent consideration receivable |
273 |
- |
|
Fair value adjustments |
(392) |
- |
|
At 30 June |
14,188 |
- |
|
Analysed as: |
||
|
Amounts falling due within one year |
289 |
- |
|
Amounts falling due after more than one year |
13,899 |
- |
|
Total deferred contingent consideration receivable |
14,188 |
- |
During the financial year, the Group resigned as investment manager to the SVS Brooks Macdonald Defensive Capital Fund ("DCF") (subsequently renamed SVS RM Defensive Capital Fund). The resignation was subject to an SPA and under the terms of the SPA, the Group are entitled to deferred contingent consideration receivable based on funds under management meeting certain targets over a three-year period post disposal. On disposal, the estimated fair value of deferred contingent consideration receivable was £658,000. As at 30 June 2025, the fair value of deferred contingent consideration receivable for the DCF disposal was £289,000.
Additionally, the Group sold BMI and its wholly-owned subsidiaries, which made up the Group's previously reported International segment. Part of the consideration is deferred based on the disposal group revenue levels measured over a one-year period commencing 12 months post disposal, and payable two years post completion. On disposal, the estimated fair value of deferred contingent consideration receivable was £13,649,000. As at 30 June 2025, the fair value of deferred contingent consideration receivable for the sale of BMI was £13,899,000.
22. Trade and other receivables
|
2025 £'000 |
2024 £'000 |
|
|
Trade receivables |
832 |
2,899 |
|
Other receivables |
1,571 |
496 |
|
Prepayments and accrued income |
23,478 |
25,666 |
|
Total trade and other receivables |
25,881 |
29,061 |
Expected credit losses are immaterial in relation to trade receivables; refer to note 34 for details on the credit risk assessment. Accrued income includes portfolio management fee income for the final quarter, outstanding at the consolidated statement of financial position date.
23. Cash and cash equivalents
Cash and cash equivalents are distributed across a range of financial institutions with high credit ratings in accordance with the Group's treasury policy. Cash at bank comprises current accounts which can be accessed immediately.
Cash and cash equivalents also includes amounts held in money market funds and deposit accounts with a maturity of three months or less. The purpose of these holdings is to meet short-term cash requirements rather than for underlying investment purposes and are subject to insignificant risk of changes in value.
24. Lease liabilities
Finance costs and financing cash flows associated with leases are reconciled below to show the movement in the financial year.
|
Cars £'000 |
Property £'000 |
Total £'000 |
||
|
At 1 July 2023 |
611 |
4,530 |
5,141 |
|
|
Additions |
174 |
1,157 |
1,331 |
|
|
Adjustment on change of lease terms |
(142) |
(175) |
(317) |
|
|
Payments made |
(225) |
(2,311) |
(2,536) |
|
|
Finance cost of lease liabilities |
21 |
174 |
195 |
|
|
At 30 June 2024 |
439 |
3,375 |
3,814 |
|
|
Additions |
52 |
14,204 |
14,256 |
|
|
Adjustment on change of lease terms |
(57) |
3 |
(54) |
|
|
Payments made |
(203) |
(3,016) |
(3,219) |
|
|
Finance cost of lease liabilities |
15 |
280 |
295 |
|
|
Disposal of subsidiary |
- |
(174) |
(174) |
|
|
At 30 June 2025 |
246 |
14,672 |
14,918 |
|
|
2025 £'000 |
2024 £'000 |
|||
|
Analysed as: |
||||
|
Amounts falling due within one year |
700 |
2,169 |
||
|
Amounts falling due after more than one year |
14,218 |
1,645 |
||
|
Total lease liabilities |
14,918 |
3,814 |
Reconciliation of lease liability to changes in cash flows
The payments made included in the table above include lease payments of £254,000 (2024: £350,000) relating to leases attributable to discontinued operations up until the date of disposal.
|
2025 £'000 |
2024 £'000 |
|
|
Maturity analysis - undiscounted: |
||
|
Within one year |
1,561 |
2,054 |
|
One to five years |
10,454 |
1,445 |
|
More than five years |
7,568 |
- |
|
Total lease liabilities - undiscounted |
19,583 |
3,499 |
The Group offers a car leasing arrangement to provide a salary sacrifice car leasing scheme for employees. Each vehicle leased to individual employees creates a separate right-of-use asset (note 19) and lease liability measured at present value of the remaining lease payments, discounted using the lessee's estimated incremental borrowing rate.
The Group is party to leases as lessee in relation to property agreements for the use of office space. All leases are accounted for by recognising a right-of-use asset and a lease liability at the lease commencement date. Lease liabilities are initially measured at the present value of the contractual payments due to the lessor over the lease term discounted using the Group's incremental borrowing rate.
During the financial year, the Group recognised a new lease liability of £12,973,000 in relation to its new London head office. Further details of the lease are disclosed in note 19.
25. Provisions
|
Client compensation £'000 |
FSCS levy £'000 |
Leasehold dilapidations £'000 |
Other provisions £'000 |
Total £'000 |
|
|
At 1 July 2023 |
250 |
167 |
625 |
280 |
1,322 |
|
Charge to the consolidated statement of comprehensive income |
640 |
691 |
83 |
- |
1,414 |
|
Utilised during the year |
(295) |
(167) |
(268) |
- |
(730) |
|
At 30 June 2024 |
595 |
691 |
440 |
280 |
2,006 |
|
Charge to the consolidated statement of comprehensive income |
15 |
817 |
466 |
236 |
1,534 |
|
Utilised during the year |
(275) |
(691) |
- |
(280) |
(1,246) |
|
Additions |
- |
- |
- |
375 |
375 |
|
Disposals |
- |
- |
(6) |
- |
(6) |
|
At 30 June 2025 |
335 |
817 |
900 |
611 |
2,663 |
|
2025 £'000 |
2024 £'000 |
|
|
Analysed as: |
||
|
Amounts falling due within one year |
1,890 |
1,628 |
|
Amounts falling due after more than one year |
773 |
378 |
|
Total provisions |
2,663 |
2,006 |
25(a) Client compensation
Client compensation provisions relate to the potential liability arising from client complaints against the Group. Complaints are assessed on a case-by-case basis and provisions for compensation are made when they meet the recognition criteria. The amount recognised within provisions for client compensation represents management's best estimate of the potential liability. The timing of the corresponding outflows is uncertain as these are made as and when claims arise.
25(b) FSCS levy
Following confirmation by the FSCS in July 2025 of its final industry levy for the 2025/26 scheme year, the Group has made a provision of £817,000 (2024: £691,000) for its estimated share.
25(c) Leasehold dilapidations
Leasehold dilapidations relate to dilapidation provisions expected to arise on leasehold premises held by the Group, and monies due under the contract with the assignee of leases on the Group's leased properties.
25(d) Other provisions
Other provisions include tax-related items arising from voluntary disclosures made by the Group to HMRC, following an input VAT review conducted during a prior financial year.
26. Deferred contingent consideration payable
Deferred contingent consideration payable reflects the Directors' best estimate of amounts payable in the future in respect of certain client relationships and subsidiary undertakings that were acquired by the Group. Deferred contingent consideration payable is measured at its fair value based on discounted expected future cash flows and is split between current and non-current liabilities to the extent that it is due for payment within one year of the reporting date. The movements in the total deferred contingent consideration payable balance during the financial year were as follows:
|
2025 £'000 |
2024 £'000 |
|
|
At 1 July |
- |
1,467 |
|
Additions |
15,338 |
- |
|
Finance cost of deferred contingent consideration |
426 |
13 |
|
Fair value adjustments |
341 |
(3) |
|
Payments made during the year |
- |
(852) |
|
Share issues as consideration |
- |
(625) |
|
At 30 June |
16,105 |
- |
|
2025 £'000 |
2024 £'000 |
|
|
Analysed as: |
||
|
Amounts falling due within one year |
14,176 |
- |
|
Amounts falling due after more than one year |
1,929 |
- |
|
Total deferred contingent consideration payable |
16,105 |
- |
During the financial year, the Group completed three acquisitions of CST, Lucas Fettes and LIFT (refer to note 14). Part of the consideration amounts payable are deferred over one and two-year periods. The deferred amount is based on client attrition levels and business profitability over the deferral period. The estimated fair value of the deferred contingent consideration at acquisition was £14,558,000. During the period from acquisition to 30 June 2025, the Group recognised a finance cost of £398,000 and a fair value adjustment of £342,000 on the amount payable.
Also, during the year, the Company acquired a portfolio of financial advice clients. Part of the consideration amount, £779,000, is deferred over a year. The Company recognised a finance cost of £27,000 and £81,000 fair value increase in the deferred contingent amount.
Deferred contingent consideration is classified as Level 3 within the fair value hierarchy, as defined in note 20.
27. Net deferred tax liabilities
An analysis of the Group's deferred assets and deferred tax liabilities is shown below:
The gross movement on the deferred income tax account during the financial year was as follows:
|
Note |
2025 £'000 |
2024 £'000 |
|
|
At 1 July |
(5,394) |
(6,033) |
|
|
Liability on acquisition of client relationship intangible assets |
14 |
(5,744) |
- |
|
Credit to the consolidated statement of comprehensive income |
1,357 |
1,574 |
|
|
Charge recognised in equity |
(346) |
(935) |
|
|
Disposal of subsidiary |
964 |
- |
|
|
At 30 June |
(9,163) |
(5,394) |
The change in deferred income tax assets and liabilities during the financial year was as follows:
|
Share-based payments £'000 |
Trading losses carried forward £'000 |
Dilapidations £'000 |
Accelerated capital allowances £'000 |
Total £'000 |
|
|
Deferred tax assets |
|||||
|
At 1 July 2023 |
2,333 |
363 |
119 |
164 |
2,979 |
|
Credit to the consolidated statement of comprehensive income |
503 |
(216) |
(7) |
(71) |
209 |
|
Charge to equity |
(935) |
- |
- |
- |
(935) |
|
At 30 June 2024 |
1,901 |
147 |
112 |
93 |
2,253 |
|
Disposal of subsidiary |
(147) |
(4) |
3 |
(148) |
|
|
Credit to the consolidated statement of comprehensive income |
2 |
- |
117 |
106 |
225 |
|
Charge to equity |
(346) |
- |
- |
- |
(346) |
|
At 30 June 2025 |
1,557 |
- |
225 |
202 |
1,984 |
|
2025 £'000 |
2024 £'000 |
|
|
Deferred tax assets |
||
|
Deferred tax assets to be settled within one year |
947 |
1,192 |
|
Deferred tax assets to be settled after more than one year |
1,037 |
1,061 |
|
Total deferred tax assets |
1,984 |
2,253 |
The carrying amount of the deferred tax asset is reviewed at each reporting date and is only recognised to the extent that it is probable that future taxable profits of the Group will allow the asset to be recovered. There is an amount of unrecognised deferred tax in relation to capital losses carried forward at 30 June 2025 of £859,000. A deferred tax asset is not recognised in these consolidated financial statements, nor the Parent Company financial statements, on the basis that it is not probable that capital gains will be available against which capital losses can be offset.
The change in deferred income tax liabilities during the financial year is as follows:
|
Accelerated capital allowances on research and development £'000 |
Intangible asset amortisation £'000 |
Total £'000 |
|
|
Deferred tax liabilities |
|||
|
At 1 July 2023 |
856 |
8,156 |
9,012 |
|
Credit to the consolidated statement of comprehensive income |
62 |
(1,427) |
(1,365) |
|
At 30 June 2024 |
918 |
6,729 |
7,647 |
|
Disposal of subsidiary |
(5) |
(1,106) |
(1,111) |
|
Acquisition of subsidiaries |
- |
5,744 |
5,744 |
|
Charge/(credit) to the consolidated statement of comprehensive income |
75 |
(1,208) |
(1,133) |
|
At 30 June 2025 |
988 |
10,159 |
11,147 |
|
2025 £'000 |
2024 £'000 |
|
|
Deferred tax liabilities |
||
|
Deferred tax liabilities to be settled within one year |
1,185 |
1,006 |
|
Deferred tax liabilities to be settled after more than one year |
9,962 |
6,641 |
|
Total deferred tax liabilities |
11,147 |
7,647 |
28. Other non-current liabilities
|
2025 £'000 |
2024 £'000 |
|
|
At 1 July |
587 |
783 |
|
National insurance liability in respect of share option awards |
392 |
128 |
|
Liability in respect of retention payments to ex-BMI employees |
456 |
- |
|
Transfer to current liabilities |
(391) |
(324) |
|
At 30 June |
1,044 |
587 |
Other non-current liabilities include employer's National Insurance contributions arising from share option awards under the Long-Term Incentive Scheme ("LTIS") and Long-Term Incentive Plan ("LTIP") schemes. During the financial year, a liability was recognised of £392,000 (2024: £128,000) in respect of awards granted during the financial year, which are expected to vest in the future. During the financial year, an amount of £391,000 (2024: £324,000) was transferred to current liabilities, reflecting awards that are expected to vest within the next 12 months. At 30 June 2025, the non-current liability for employer's National Insurance contributions arising from share option awards under the LTIS and LTIP schemes was £588,000 (2024: £587,000).
29. Trade and other payables
|
2025 £'000 |
2024 £'000 |
|
|
Trade payables |
7,959 |
3,728 |
|
Other taxes and social security |
1,763 |
2,767 |
|
Other payables |
2,295 |
- |
|
Accruals and deferred income |
19,277 |
21,394 |
|
Total trade and other payables |
31,294 |
27,889 |
Included within accruals and deferred income is an accrual of £391,000 (2024: £324,000) in respect of employer's National Insurance contributions arising from share option awards under the LTIS. Other payables includes the current portion of the liability in respect of retention payments to ex-BMI employees.
30. Share capital and share premium account
The movements in share capital and share premium during the financial year were as follows:
|
Number of shares |
Exercise price £ |
Share capital £'000 |
Share premium account £'000 |
Total £'000 |
|
|
At 1 July 2023 |
16,399,663 |
164 |
81,830 |
81,994 |
|
|
Shares issued: |
|||||
|
• on exercise of options |
8,554 |
13.81 - 17.25 |
- |
135 |
135 |
|
• to SAYE Scheme |
35,488 |
11.72 - 19.88 |
1 |
545 |
546 |
|
• of consideration for business combinations |
28,748 |
19.00 - 21.74 |
- |
625 |
625 |
|
At 30 June 2024 |
16,472,453 |
165 |
83,135 |
83,300 |
|
|
Shares issued: |
|||||
|
• on exercise of options |
699 |
17.70 |
- |
16 |
16 |
|
• to SAYE Scheme |
4,714 |
14.34 - 19.88 |
- |
130 |
130 |
|
• of consideration for business combinations |
42,673 |
16.41 - 16.61 |
- |
706 |
706 |
|
Shares cancelled on buybacks |
(464,000) |
- |
(5) |
- |
(5) |
|
At 30 June 2025 |
16,056,539 |
- |
160 |
83,987 |
84,147 |
The total number of ordinary shares issued and fully paid at 30 June 2025 was 16,056,539 (2024: 16,472,453) with a par value of 1p per share.
There was £852,000 of share capital issued on exercise of options as well as to Employee Save As You Earn ("SAYE") Scheme members and as consideration for acquisitions in the year ended 30 June 2025 (2024: £1,306,000).
On 28 January 2025, the Group announced the commencement of a share buyback programme in respect of its shares having an aggregate value of up to £10 million. The shares are being purchased in the open market and upon cancellation, the par value is transferred from the share capital to the capital redemption reserve (within other reserves, refer to note 31).
During the period from announcement to 30 June 2025, the Group has repurchased 464,000 shares for a total consideration of £6,970,000. The par value of share capital of £4,640 for these repurchases has transferred to the capital redemption reserve and the remaining amounts have reduced retained earnings by £6,966,000. At the date of signing this report, a further 74,000 shares were purchased and cancelled, for additional total consideration of £1,178,000. The Board will continue to deploy the remainder of the £10 million buyback in due course.
Employee Benefit Trust
The Group established an Employee Benefit Trust ("EBT") on 3 December 2010 to acquire ordinary shares in the Company to satisfy awards under the Group's LTIS; see note 32. At 30 June 2025, the EBT held 437,374 (2024: 421,938) 1p ordinary shares in the Company, acquired for a total consideration of £21,650,000 (2024: £19,100,000) with a market value of £7,457,000 at 30 June 2025 (2024: £8,228,000). These shares are classified as treasury shares in the consolidated statement of financial position, their cost being deducted from retained earnings within shareholders' equity.
31. Retained earnings and other reserves
The movements in retained earnings during the financial year were as follows:
|
2025 £'000 |
2024 £'000 |
|
|
At 1 July |
68,843 |
75,158 |
|
Total comprehensive income |
20,984 |
6,457 |
|
Share-based payments Tax on share options |
2,856 (346) |
2,407 (935) |
|
Purchase of own shares by Employee Benefit Trust |
(2,566) |
(2,150) |
|
Share buyback |
(6,971) |
- |
|
Dividends paid |
(12,695) |
(12,094) |
|
At 30 June |
70,105 |
68,843 |
Other reserves comprise the following balances:
|
2025 £'000 |
2024 £'000 |
|
|
Merger reserve |
192 |
192 |
|
Capital redemption reserve |
5 |
- |
|
Total other reserves |
197 |
192 |
31(a) Merger reserve
The merger reserve arises when the consideration and nominal value of the shares issued during a merger and the fair value of assets transferred during the business combination differ.
31(b) Capital redemption reserve
The capital redemption reserve arises on the cancellation of shares following share buybacks when the nominal value of the shares cancelled is transferred from share capital.
32. Share-based incentive and benefits plans
During the year ended 30 June 2025, the Group operated a number of share-based incentive and benefit schemes, which are described below.
Company Share Option Plan ("CSOP")
This plan was approved by HMRC in November 2013. The CSOP is a discretionary scheme whereby employees or Directors are granted an option to purchase the Company's shares in the future at a price set on the date of the grant. Since 2023, the maximum award under the terms of the scheme is a total market value of £60,000 per recipient. The options expire 10 years from the grant date.
The Company ceased making CSOP grants following the awards made in 2016. As at 30 June 2025, all options for the CSOP schemes have vested and are able to be exercised. No awards expired during the financial year under the CSOP schemes (2024: none).
Employee Save As You Earn ("SAYE") Scheme
SAYE is a voluntary participation benefit offered to all permanent employees. Under the SAYE, employees commit to a three-year savings contract of between £5 and £500 a month. At the end of the savings contract, employees have the option to use their savings to exercise their option to buy Company shares at a discounted price determined at the beginning of the savings contract or elect to have their cash savings returned. More recent annual schemes also include a savings bonus for completing the savings contract. This can be used to buy shares or be returned in cash, as it is the equivalent of an interest consideration.
Long-Term Incentive Plan ("LTIP")
This is an equity-settled scheme approved by shareholders at the 2018 Annual General Meeting and encompasses three components:
• Deferred Bonus Plan ("DBP"): Under this plan, a proportion of discretionary annual bonus awards for Material Risk Takers and high earning employees is awarded as 10-year BRK nil price share options. These awards vest in three equal tranches at 12, 24 and 36 months from date of grant. The employee is then able to exercise the award in the option period at which point the shares would be transferred to the employee. Leaver provisions apply, where in cases of resignation, any vested and unvested options are forfeited to the employee on leaving, and employees leaving with good leaver status remain eligible for the awards.
• LTIP awards: These are 10-year BRK nil price share options awarded to Executive Directors and ExCo Members. Vesting of these awards may be contingent on specified performance measures determined at grant being met. These awards are subject to three-year cliff vesting and a further two-year holding period (on any options that are exercised immediately after vesting). Awards are forfeited in instances of resignation and for good leavers, the award value will be pro-rated in alignment with the proportion of the vesting period the employee served.
• Exceptional Share Option Awards ("ESOA"): These are discretionary share option awards made to employees making exceptional contributions to the Company. The vesting profile and any performance conditions associated with these awards are determined by the Company's Remuneration Committee. ESOA awards are also used to fulfil buy-out commitments and share option awards made in relation to acquisitions made by the Company.
With the exception of a limited number of Good Leaver scenarios, employee eligibility for all LTIP awards is subject to continued employment. All LTIP awards are made at the discretion of the Remuneration Committee. A total of 323,670 (2024: 609,163) BRK share options were granted under the LTIP during the 2025 financial year. The vesting periods for these awards are between 12 and 36 months. In the 2025 financial year, 4,330 share options expired (2024: none).
Long-Term Incentive Scheme ("LTIS")
Share-based incentives were made under the LTIS scheme before its replacement by the LTIP scheme in 2018. No LTIS grants were made after 2017 and no holdings or commitments remain under this scheme, all awards having been vested and exercised.
Valuation of awards
Full details of the awards granted during the year along with their valuation and the inputs used in the valuation are described in the tables below. The valuation was determined using the Black-Scholes-Merton model.
|
2025 |
2024 |
|||
|
Long-Term Incentive Plan |
Save As You Earn ("SAYE") |
Long-Term Incentive Plan |
Save As You Earn ("SAYE") |
|
|
Fair value |
£12.17-£15.31 |
£4.27 |
£14.33-£16.49 |
£7.35 |
|
Share price at grant |
£14.20-£18.25 |
£15.00 |
£16.50-£18.05 |
£20.60 |
|
Exercise price |
- |
£11.56 |
- |
£14.62 |
|
Grant date |
Various |
01/06/2025 |
Various |
01/06/2024 |
|
Vesting period |
27-51 months |
36 months |
27-51 months |
36 months |
|
Volatility |
34.84%-37.71% |
37.22% |
35.34%-38.06% |
38.01% |
|
Annual dividend |
4.11%-5.70% |
5.40% |
4.26%-4.73% |
3.79% |
|
Risk-free rate |
3.99%-4.50% |
3.87% |
3.95%-4.92% |
4.07% |
|
Option value |
£14.20-£18.25 |
£15.00 |
£16.50-£18.05 |
£20.60 |
Outstanding awards
Movements in the outstanding awards including the weighted average exercise price under each of the plans is set out in the tables below.
|
2025 |
2024 |
|||
|
Number of options |
Weighted average exercise price (£) |
Number of options |
Weighted average exercise price (£) |
|
|
Company Share Option Plan |
||||
|
Outstanding at start of year |
8,401 |
16.92 |
16,955 |
16.37 |
|
Exercised |
- |
- |
(8,554) |
15.83 |
|
Outstanding at end of year |
8,401 |
17.23 |
8,401 |
16.92 |
|
Exercisable at end of year |
8,401 |
17.23 |
8,401 |
16.92 |
The CSOP options outstanding at 30 June 2025 had exercise prices of £13.81p (725 options), £17.19p (5,236 options) and £17.25p (2,440 options), and a weighted average remaining contractual life of 0.6 years.
|
2025 |
2024 |
|||
|
Number of options |
Weighted average exercise price (£) |
Number of options |
Weighted average exercise price (£) |
|
|
Employee SAYE Scheme |
||||
|
Outstanding at start of year |
198,462 |
14.87 |
225,003 |
15.23 |
|
Granted |
175,672 |
11.56 |
63,603 |
14.62 |
|
Forfeited |
(111,676) |
14.81 |
(58,186) |
15.51 |
|
Exercised |
(8,583) |
15.14 |
(31,958) |
15.77 |
|
Outstanding at end of year |
253,875 |
12.63 |
198,462 |
14.87 |
|
Exercisable at end of year |
7,650 |
19.88 |
7,882 |
17.04 |
The SAYE Plan options outstanding at 30 June 2025 had exercise prices of £19.88p (7,650 options), £14.34p (45,099 options), £14.62p (26,608 options) and £11.56p (174,518 options), and a weighted average remaining contractual life of 2.79 years.
All share options under the LTIP schemes set out below have exercise prices of £nil.
|
2025 Number of shares |
2024 Number of shares |
|
|
Long-Term Incentive Plan |
||
|
Outstanding at start of year |
609,163 |
687,360 |
|
Granted |
385,085 |
232,851 |
|
Forfeited |
(88,809) |
(58,541) |
|
Exercised |
(110,742) |
(252,507) |
|
Outstanding at end of year |
794,697 |
609,163 |
|
Exercisable at end of year |
2,896 |
- |
|
Long-Term Incentive Scheme |
||
|
Outstanding at start of year |
1,144 |
5,442 |
|
Exercised |
- |
(4,298) |
|
Outstanding at end of year |
1,144 |
1,144 |
|
Exercisable at end of year |
1,144 |
1,144 |
Employee Benefit Trust ("EBT")
The Company established an EBT on 3 December 2010 to acquire ordinary shares in the Company to satisfy various company award plans. All finance costs and administration expenses connected with the EBT are charged to the consolidated statement of comprehensive income as they accrue. The EBT has waived its rights to dividends. The number of shares held by the EBT have not yet vested unconditionally.
|
2025 Number of shares |
2024 Number of shares |
|
|
Employee Benefit Trust |
||
|
1 July |
421,938 |
552,633 |
|
Acquired in the year |
141,070 |
123,918 |
|
Exercised |
(125,634) |
(254,613) |
|
At 30 June |
437,374 |
421,938 |
33. Reconciliation of operating profit to net cash inflow from operating activities
|
2025 £'000 |
2024 restated1 £'000 |
|
|
Operating profit before tax |
12,006 |
22,256 |
|
Adjustments for: |
||
|
Amortisation of intangible assets |
7,850 |
4,758 |
|
Depreciation of property, plant and equipment |
520 |
567 |
|
Depreciation of right-of-use assets |
2,044 |
1,585 |
|
Impairment of right-of-use assets |
411 |
- |
|
Other losses/(gains) |
247 |
(83) |
|
Decrease in receivables |
537 |
4,391 |
|
Increase in payables |
3,125 |
5,851 |
|
Increase in provisions |
151 |
684 |
|
Increase/(decrease) in other non-current liabilities |
457 |
(196) |
|
Share-based payments charge |
1,379 |
1,366 |
|
Net cash inflow from operating activities |
28,727 |
41,179 |
1 The prior financial year operating profit has been restated to separate the results of discontinued operations, consistent with the presentation in the current financial year. Refer to note 13 for details of the results of discontinued operations.
34. Financial risk management
The Group has identified the financial risks arising from its activities and has established policies and procedures as part of a formal structure for managing risk, including establishing risk lines, reporting lines, mandates and other control procedures. The structure is reviewed regularly. The Group does not use derivative financial instruments for risk management purposes.
34(a) Liquidity risk
Liquidity risk is the risk that the Group is unable to meet its payment obligations associated with its financial liabilities when they fall due. The primary objective of the Group's treasury policy is to manage short-term liquidity requirements and to ensure that the Group maintains a surplus of immediately realisable assets over its liabilities, such that all known and potential cash obligations can be met.
The table below shows the Group's undiscounted cash inflows and outflows from non-derivative financial assets and liabilities, together with cash and bank balances available on demand.
|
On demand £'000 |
Not more than 3 months £'000 |
After 3 months but not more than 1 year £'000 |
After 1 year but not more than 6 years £'000 |
No fixed payment date £'000 |
Total £'000 |
|
|
At 30 June 2025 |
||||||
|
Cash flows from financial assets |
||||||
|
Financial assets at amortised cost |
- |
205 |
419 |
19,301 |
- |
19,925 |
|
Financial assets at fair value through profit or loss |
- |
- |
- |
- |
1,095 |
1,095 |
|
Deferred contingent consideration receivable |
- |
- |
- |
14,188 |
- |
14,188 |
|
Cash and balances at bank |
33,915 |
- |
- |
- |
- |
33,915 |
|
Trade receivables |
- |
832 |
- |
- |
- |
832 |
|
Other receivables |
- |
1,571 |
- |
- |
- |
1,571 |
|
33,915 |
2,608 |
419 |
33,489 |
1,095 |
71,526 |
|
|
Cash flows from financial liabilities |
||||||
|
Trade payables |
- |
(7,959) |
- |
- |
- |
(7,959) |
|
Deferred contingent consideration payable |
- |
- |
(14,176) |
(1,929) |
- |
(16,105) |
|
Accruals and deferred income |
- |
(19,277) |
- |
- |
- |
(19,277) |
|
Other financial liabilities |
- |
(6,070) |
(544) |
(1,817) |
- |
(8,431) |
|
- |
(33,306) |
(14,720) |
(3,746) |
- |
(51,772) |
|
|
Net liquidity surplus/(gap) |
33,915 |
(30,698) |
(14,301) |
29,743 |
1,095 |
19,754 |
|
At 30 June 2024 |
||||||
|
Cash flows from financial assets |
||||||
|
Financial assets at amortised cost* |
- |
379 |
593 |
28,991 |
- |
29,963 |
|
Financial assets at fair value through other comprehensive income |
- |
- |
- |
500 |
- |
500 |
|
Financial assets at fair value through profit or loss |
- |
- |
- |
- |
905 |
905 |
|
Cash and balances at bank |
44,731 |
- |
- |
- |
- |
44,731 |
|
Trade receivables |
- |
2,899 |
- |
- |
- |
2,899 |
|
Other receivables |
- |
496 |
- |
- |
- |
496 |
|
44,731 |
3,774 |
593 |
29,491 |
905 |
79,494 |
|
|
Cash flows from financial liabilities |
||||||
|
Trade payables |
- |
(3,728) |
- |
- |
- |
(3,728) |
|
Other financial liabilities |
- |
(25,618) |
(2,206) |
(2,032) |
- |
(29,856) |
|
- |
(29,346) |
(2,206) |
(2,032) |
- |
(33,584) |
|
|
Net liquidity surplus/(gap) |
44,731 |
(25,572) |
(1,613) |
27,459 |
905 |
45,910 |
* Prior year figures have been restated to separately disclose £972,000 of interest receivable relating to Gilts.
34(b) Market risk
Interest rate risk
The Group has limited exposure to interest rate risk due to fluctuations in the prevailing level of market interest rates. Surplus cash is invested in short-term deposits with maturity dates not exceeding three months and money market funds. Investments in Gilts are at a fixed interest rate.
A 1% fall in the average monthly interest rate receivable on the Group's cash and cash equivalents would have the impact of reducing interest receivable and therefore profit before taxation by £339,000 (2024: £447,000). An increase of 1% would have an equal and opposite effect.
Foreign exchange risk
The Group does not have any material exposure to transactional foreign currency risk, and therefore no analysis of foreign exchange risk is provided.
Price risk
Price risk is the risk that the fair value of the future cash flows from financial instruments will fluctuate due to changes in market prices (other than those arising from interest rate risk or currency risk). The Group is exposed to price risk through its holdings of equity securities and other financial assets, which are measured at fair value in the consolidated statement of financial position (note 20). A 1% fall in the value of these financial instruments would have the impact of reducing total comprehensive income by £11,000 (2024: £14,000). An increase of 1% would have an equal and opposite effect.
34(c) Credit risk
The Group may elect to invest surplus cash balances in highly liquid money market instruments with maturity dates not exceeding three months. The difference between the fair value and the net book value of these instruments is not material. To reduce the risk of a counterparty default, the Group deposits the rest of its funds in approved, high-quality banks. As part of the Group's strict due diligence assessment, there is a requirement for all banking counterparties to have a minimum credit rating of BBB+.
In line with the Group's corporate treasury policy, during the year ended 30 June 2025, the Group invested a proportion of surplus cash resources into UK GILTs. The credit risk severity is considered minimal due to the inherent government backing. A minimum credit rating requirement for Gilts as part of the Group's strategy has therefore been set at 'AA', which aligns to the current credit rating of UK Gilts.
Assets exposed to credit risk recognised on the consolidated statement of financial position total £33,915,000 (2024: £44,732,000), being the Group's total cash and cash equivalents.
Trade receivables with a carrying amount of £832,000 (2024: £2,899,000) are neither past due nor impaired. Trade receivables have no external credit rating as they relate to individual clients, although the value of investments held in each individual client's portfolio is always in excess of the total value of the receivable. All trade receivables fall due within one year (2024: one year).
35. Capital management
Capital is defined as the total of share capital, share premium, retained earnings and other reserves of the Company. Total capital at 30 June 2025 was £154,449,000 (2024: £152,335,000). Regulatory capital is derived from the Group's Internal Capital Adequacy and Risk Assessment ("ICARA"), which is a requirement of the Investment Firm Prudential Regime ("IFPR"). The ICARA draws on the Group's risk management process that is embedded within the individual businesses, function heads and executive committees within the Group.
The Group's objectives when managing capital are to comply with the capital requirements set by the FCA to safeguard the Group's ability to continue as a going concern so that it can continue to provide returns for shareholders and benefits for other stakeholders, and to maintain a strong capital base to support the development of the business.
The Group frequently assesses the adequacy of its own funds on a consolidated and legal entity basis. This includes continuous monitoring of 'K-factor' variables, which captures the variable nature of risk involved in the Group's business activities. A regulatory capital update is additionally provided to senior management on a monthly basis alongside a rolling 12-month regulatory capital forecast. In addition to this, the Group has implemented a number of 'Key Risk Indicators', which act as early warning signs with the aim of notifying senior management if own funds misalign with the Group's risk appetite and internal thresholds.
Capital adequacy is continuously monitored daily by the Group's management. The Group's 2025 ICARA will be presented for approval in December 2025. There have been no capital requirement breaches during the financial year. Brooks Macdonald Group plc's IFPR public disclosure is presented on our website at www.brooksmacdonald.com.
36. Contingent liabilities and guarantees
In the normal course of business, the Group is exposed to legal and regulatory issues, which, in the event of a dispute, could develop into litigious proceedings and, in some cases, may result in contingent liabilities. Similarly, a contingent liability may arise in the event of a finding in respect of the Group's tax affairs, including the accounting for VAT, which could result in a financial outflow from the relevant tax authorities. The Board assesses any such matters on an ongoing basis and there are no continent liabilities as at 30 June 2025.
Brooks Macdonald Asset Management Limited, a subsidiary company of the Group, has an agreement with the Royal Bank of Scotland plc to guarantee settlement for trading with CREST stock on behalf of clients. The Group holds client assets to fund such trading activity.
37. Related-party transactions
Transactions between the Company and its subsidiaries, which are related parties, are eliminated on consolidation. The Company's individual financial statements include the amounts attributable to subsidiaries.
Transactions with key management personnel
Key management personnel are those persons having authority and responsibility for planning, directing and controlling the activities of the Group, directly or indirectly, including any Director (whether executive or otherwise) of the Group. Details of the compensation paid to the Board of Directors as well as their shareholding in the Company are disclosed in the Remuneration Committee report.
Certain of the Groupʼs key management personnel make use of the services provided by companies within the Group. Charges for such services are made at various staff rates. All transactions were made on normal business terms.
38. Interest in unconsolidated structured entities
Structured entities are those entities that have been designed so that voting or similar rights are not the dominant factor in deciding who has control, such as when any voting rights relate to administrative tasks only, or when the relevant activities are directed by means of contractual arrangements. The Group's interests in consolidated and unconsolidated structured entities are described below.
The only consolidated structured entity is the Brooks Macdonald Group EBT, details of which are given in note 32.
The Group has interests in structured entities as a result of contractual arrangements arising from the management of assets on behalf of its clients. These structured entities consist of unitised vehicles such as OEICs, which entitle investors to a percentage of the vehicle's net asset value. The structured entities are financed by the purchase of units or shares by investors. As fund manager, the Group does not guarantee returns on its funds or commit to financially support its funds. Where external finance is raised, the Group does not provide a guarantee for the repayment of any borrowings. The business activity of all structured entities in which the Group has an interest is the management of assets in order to maximise investment returns for investors from capital appreciation and/or investment income. The Group earns a management fee from its structured entities based on a percentage of the entity's net asset value.
The funds under management of unconsolidated structured entities within the Group's continuing operations total £1.208 billion (2024: £1.323 billion). Included in the revenue from continuing operations on the consolidated statement of comprehensive income is management fee income of £6,598,000 (2024: £6,914,000) from unconsolidated structured entities managed by the Group.
39. Events since the end of the year
A final dividend was declared on 3 September 2025, refer to note 16 for further details.
In August 2025, the Group accepted an offer from its insurers for £1.3 million in settlement of legacy matters related to its International business. As the offer was made and accepted after the financial reporting date, and the receipt of funds was not considered virtually certain as at 30 June 2025, no asset has been recognised in these financial statements. However, at the date of signing these financial statements, the receipt of the proceeds was deemed probable. Accordingly, the insurance proceeds are expected to be recognised as other non-operating income in the statement of comprehensive income in the financial year ending 30 June 2026.
Non-IFRS financial information
Non-IFRS financial information or alternative performance measures ("APMs") are used as supplemental measures in monitoring the performance of the Group. The adjustments applied to IFRS measures to compute the Group's APMs exclude income and expense categories, which are deemed to be outside the normal course of business operations. The Board considers the disclosed APMs to be an appropriate reflection of the Group's underlying performance.
The Group follows a rigorous process in determining whether an adjustment should be made to present an alternative performance measure compared to IFRS measures.
For an adjustment to be removed from IFRS statutory profit before tax to derive underlying profit, it must be a significant item and meet the following criteria:
• It is non-recurring and outside the normal course of business operations; or
• It has been incurred as a result of an acquisition, disposal or company restructure process.
The Group uses the below APMs:
|
APM |
Equivalent IFRS measure |
Definition and purpose |
|
Underlying profit before tax from continuing operations |
Statutory profit before tax from continuing operations |
Calculated as profit before tax from continuing operations, excluding income and expense categories, which are deemed of a non-recurring nature. It is considered by the Board to be an appropriate reflection of the Group's performance. |
|
Underlying tax charge from continuing operations |
Statutory tax charge from continuing operations |
Calculated as the statutory tax charge from continuing operations, excluding the tax impact of the adjustments excluded from underlying profit. See note 12 Taxation. |
|
Underlying earnings/ Underlying profit after tax from continuing operations |
Total comprehensive income from continuing operations |
Calculated as underlying profit before tax from continuing operations less the underlying tax charge from continuing operations. See note 15 of the consolidated financial statements for a reconciliation of underlying profit after tax from continuing operations and total comprehensive income. |
|
Underlying diluted earnings per share from continuing operations |
Statutory diluted earnings per share from continuing operations |
Calculated as underlying profit after tax from continuing operations, divided by the weighted average number of shares in issue during the financial year, including the dilutive impact of future share awards. This is a key management incentive metric and is a measure used within the Group's remuneration schemes. See note 15 Earnings per share. |