Emami Limited · NSE:EMAMILTD
Emami — Q4 FY2024 Earnings Presentation
24 slides from Emami's earnings presentation, May 29, 2024
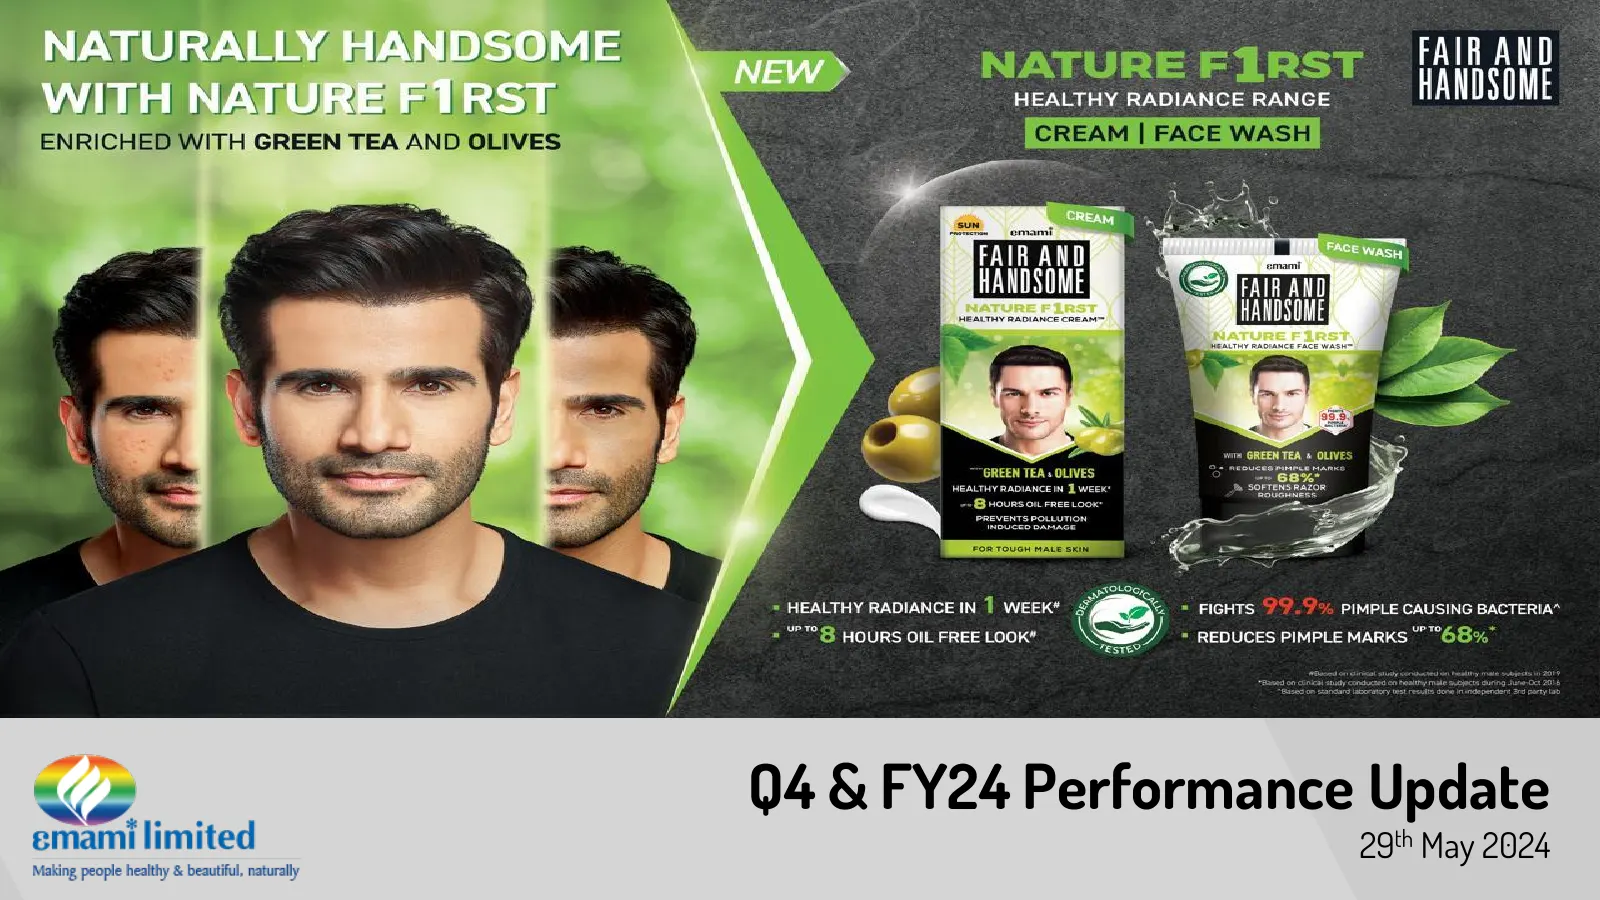
Slide 1: Q4 & FY24 Performance Update
Q4 & FY24 Performance Update 29th May 2024
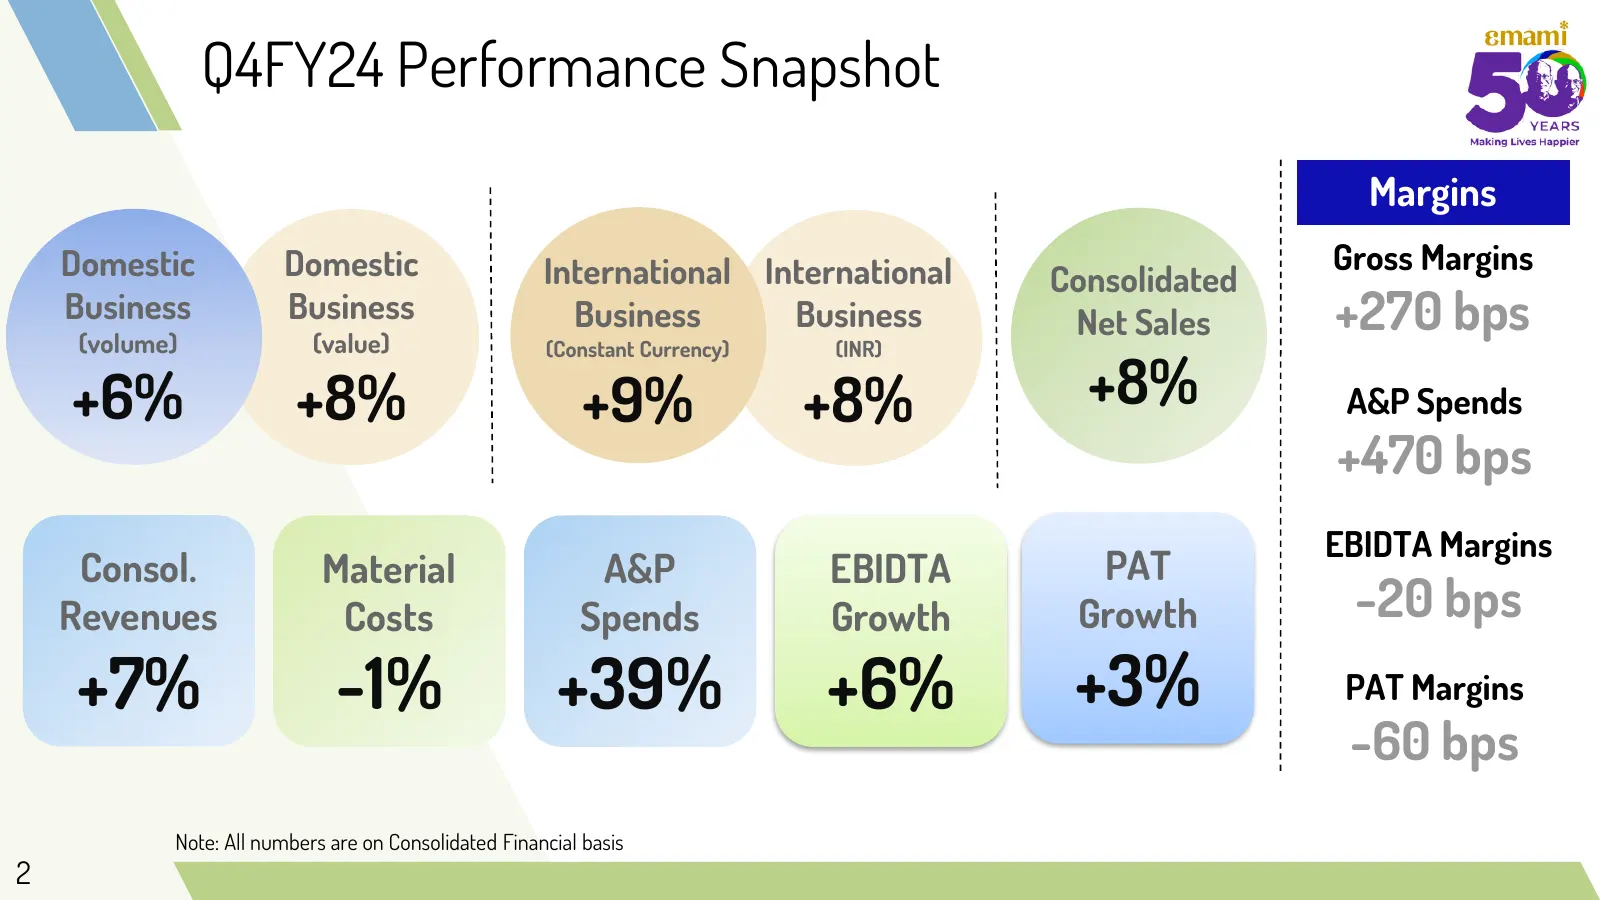
Slide 2: Q4FY24 Performance Snapshot
Q4FY24 Performance Snapshot Margins Domestic Domestic International International Gross Margins Consolidated Business (volume) Business (value) Business Business (Constant Currency) (INR) Net Sales +270 bps +6% +8% +9% +8% +8% A&P Spends +470 bps EBIDTA Margins Consol. Material A&P EBIDTA PAT Revenu
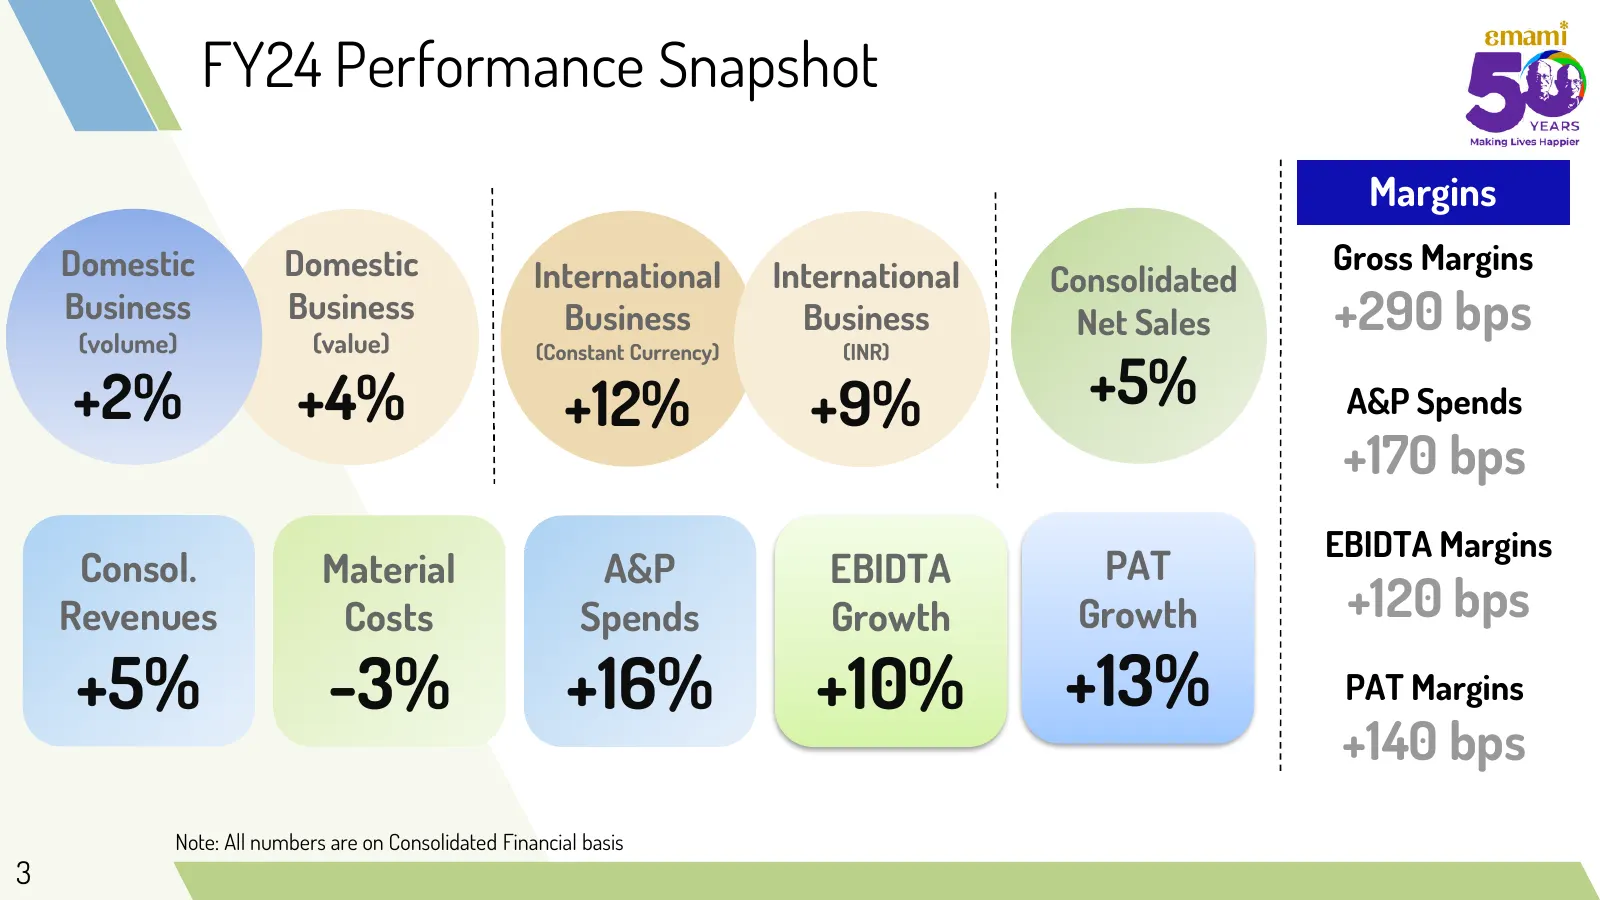
Slide 3: FY24 Performance Snapshot
FY24 Performance Snapshot Margins Domestic Domestic International International Gross Margins Consolidated Business (volume) Business (value) Business Business Net Sales +290 bps (Constant Currency) (INR) +2% +4% +12% +9% +5% A&P Spends +170 bps EBIDTA Margins Consol. Material A&P EBIDTA PAT Revenue
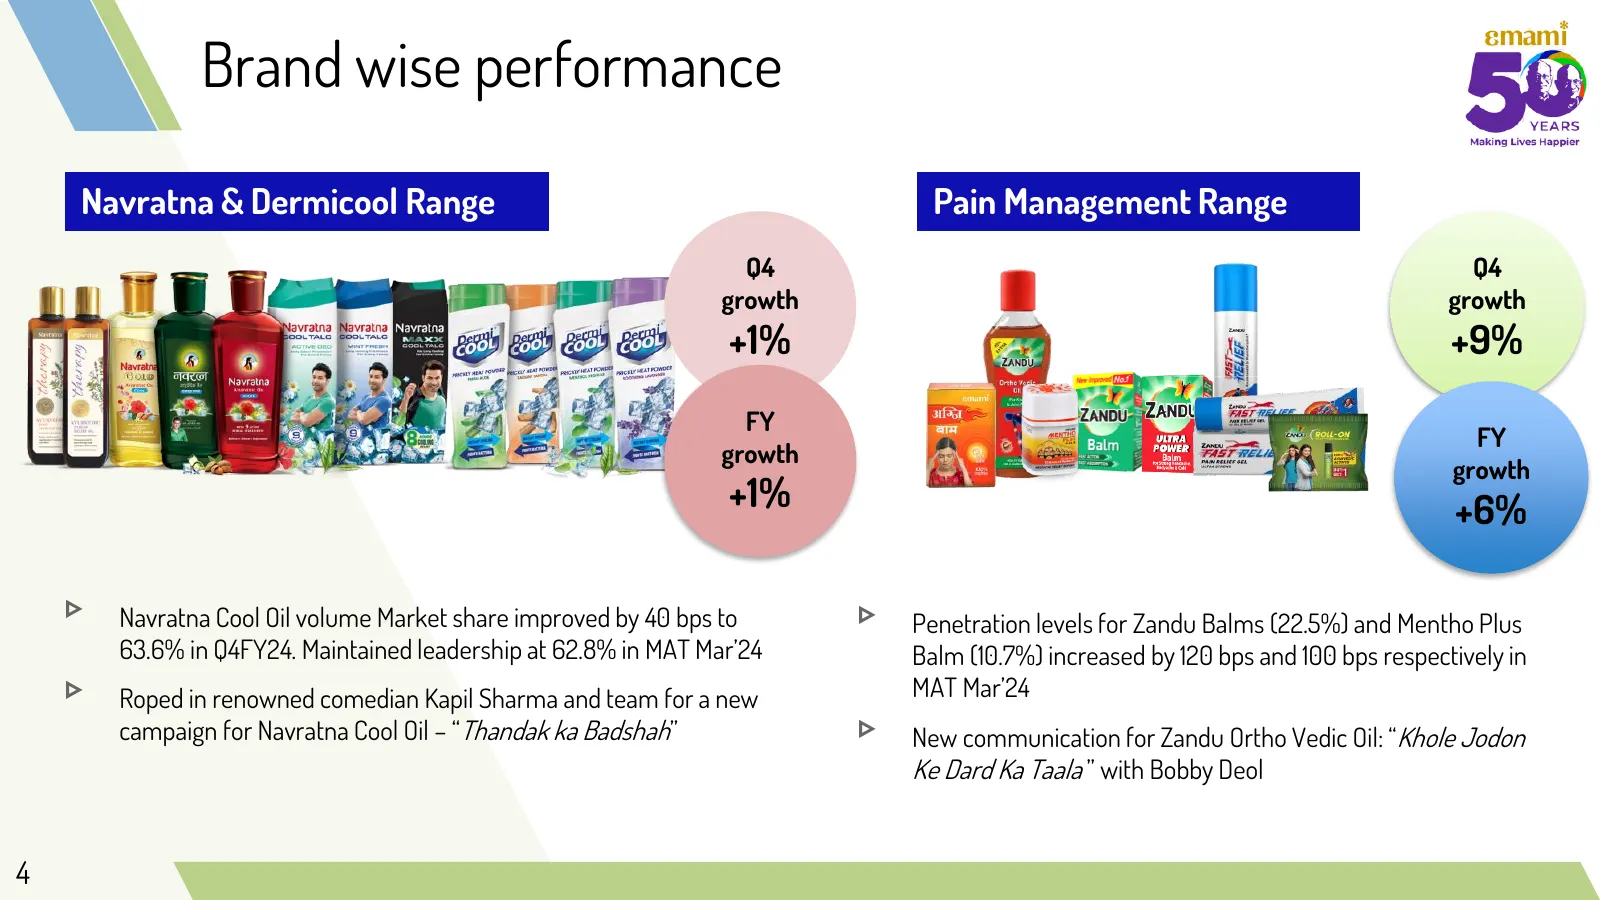
Slide 4: Brand wise performance
Brand wise performance Navratna & Dermicool Range Pain Management Range Q4 Q4 growth growth +1% +9% FY FY growth growth +1% +6% ▹ Navratna Cool Oil volume Market share improved by 40 bps to ▹ Penetration levels for Zandu Balms (22.5%) and Mentho Plus 63.6% in Q4FY24. Maintained leadership at 62.8% i
Slide 5: Brand wise performance
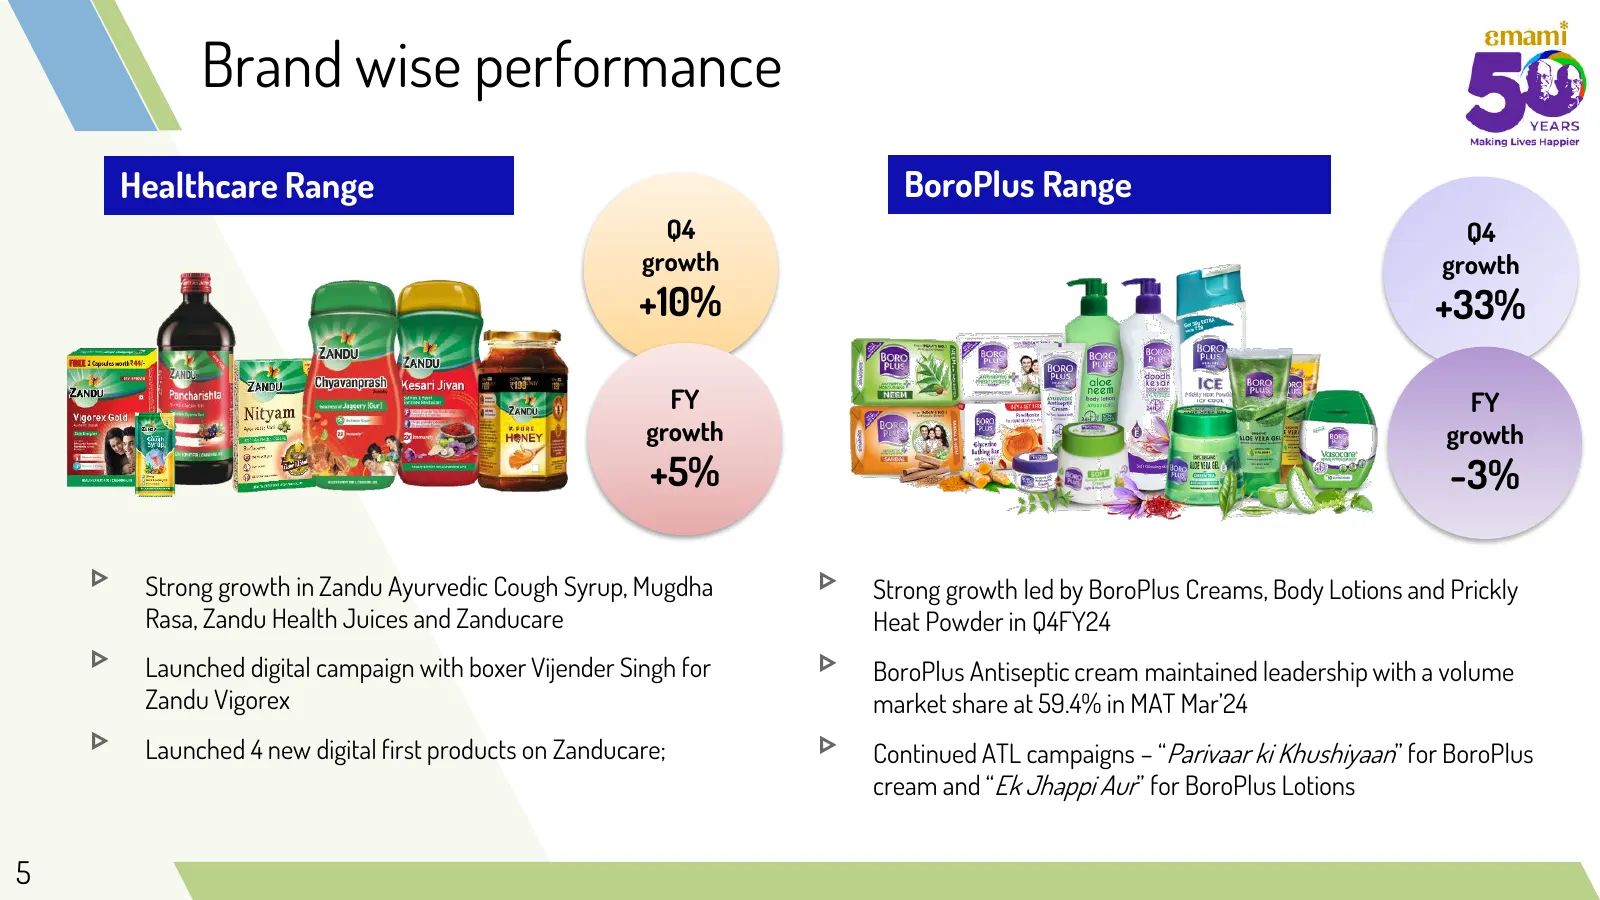
Brand wise performance Healthcare Range BoroPlus Range Q4 Q4 growth growth +10% +33% FY FY growth growth +5% -3% ▹ Strong growth in Zandu Ayurvedic Cough Syrup, Mugdha ▹ Strong growth led by BoroPlus Creams, Body Lotions and Prickly Rasa, Zandu Health Juices and Zanducare Heat Powder in Q4FY24 ▹ Lau
Slide 6: Brand wise performance
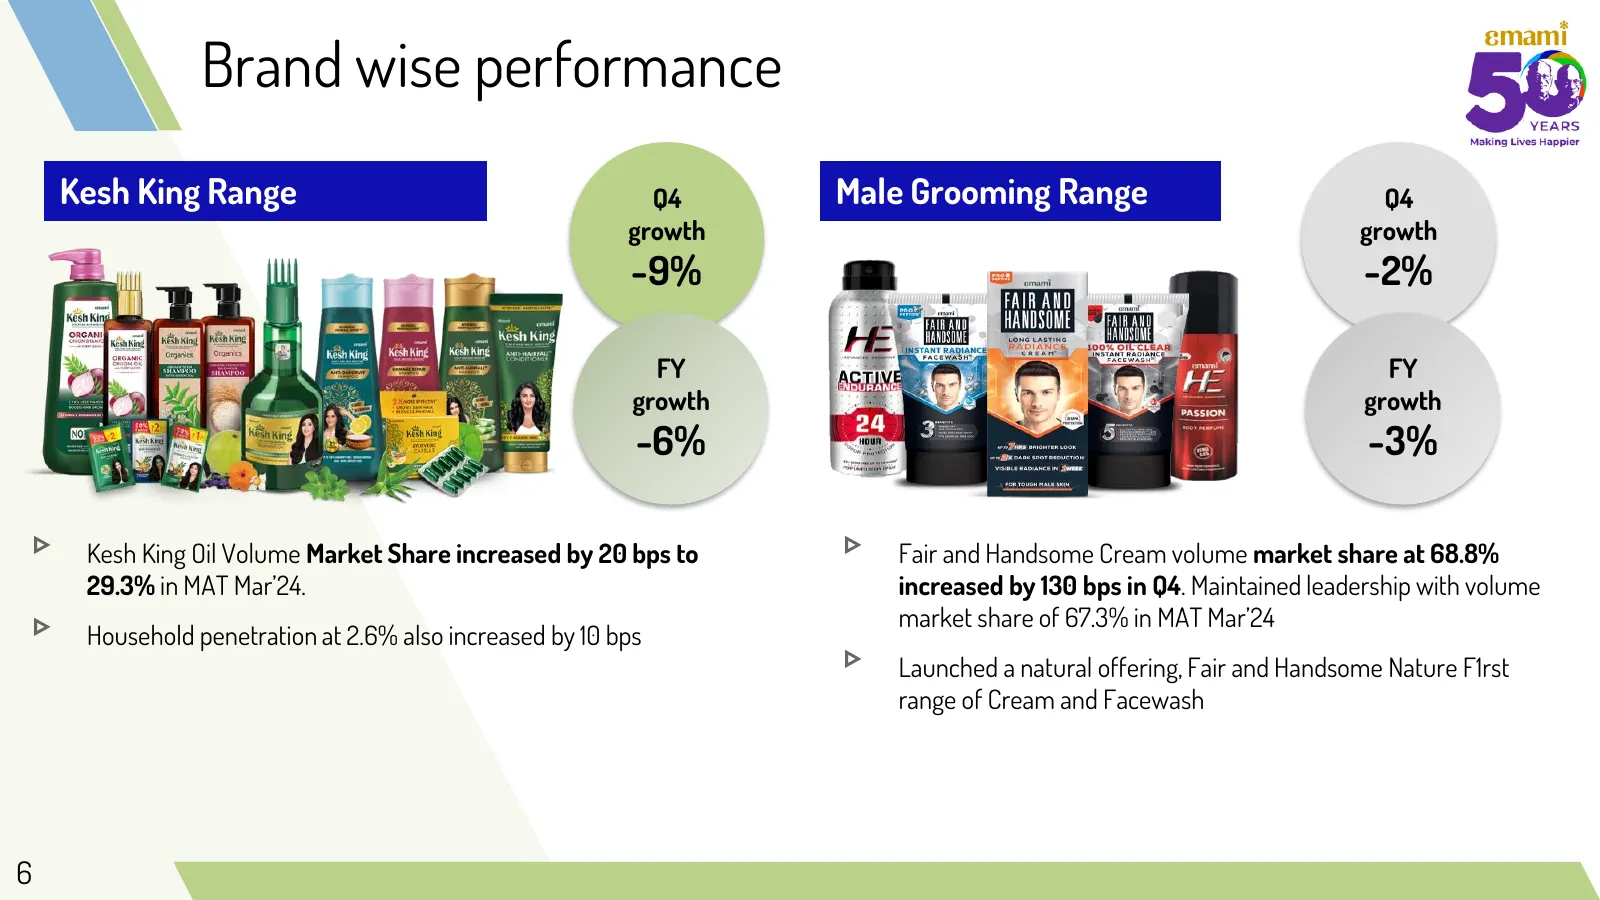
Brand wise performance Kesh King Range Q4 Male Grooming Range Q4 growth growth -9% -2% FY FY growth growth -6% -3% ▹ Kesh King Oil Volume Market Share increased by 20 bps to ▹ Fair and Handsome Cream volume market share at 68.8% 29.3% in MAT Mar’24. increased by 130 bps in Q4. Maintained leadership
Slide 7: Strategic Subsidiaries
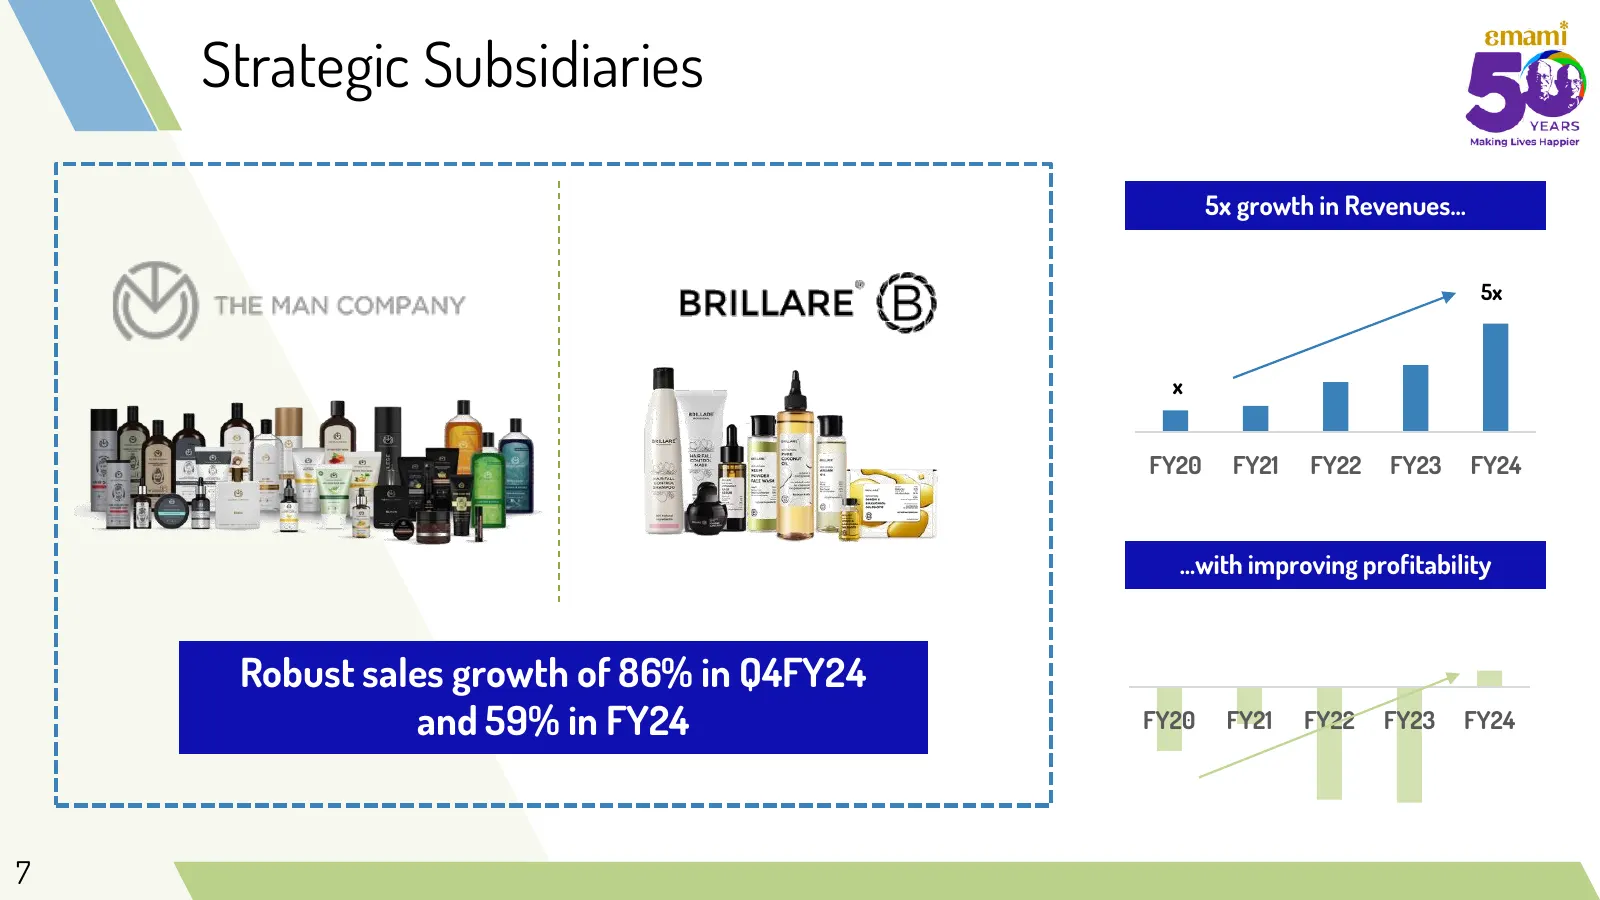
Strategic Subsidiaries 5x growth in Revenues… 5x x FY20 FY21 FY22 FY23 FY24 …with improving profitability Robust sales growth of 86% in Q4FY24 and 59% in FY24 FY20 FY21 FY22 FY23 FY24 7
Slide 8: NPD’s: Domestic Business
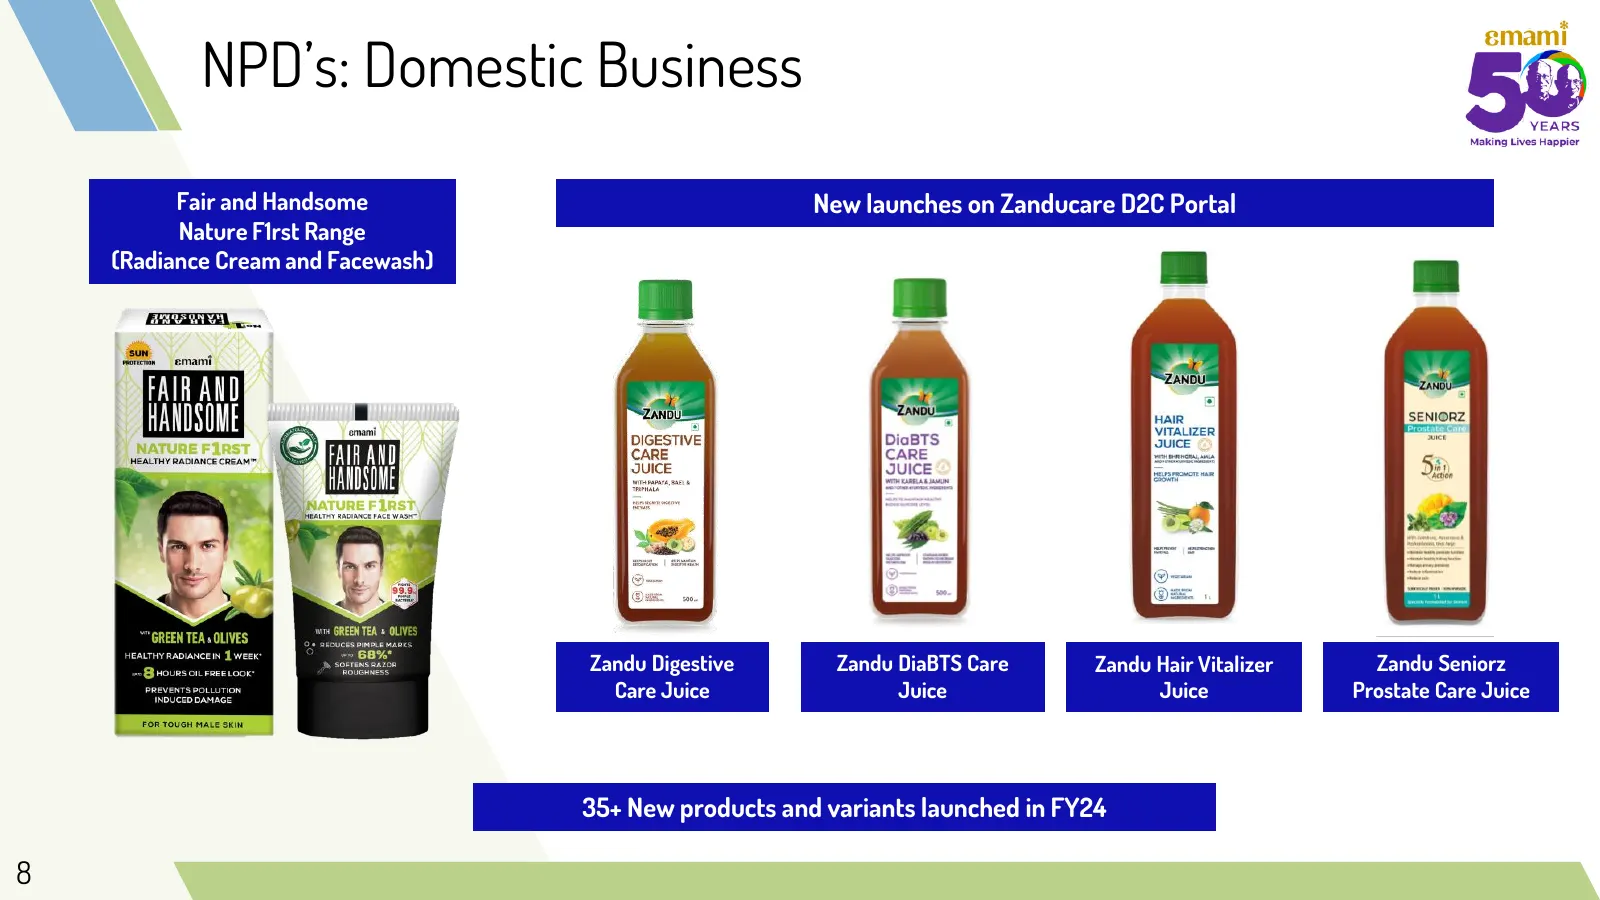
NPD’s: Domestic Business Fair and Handsome New launches on Zanducare D2C Portal Nature F1rst Range (Radiance Cream and Facewash) Zandu Digestive Zandu DiaBTS Care Zandu Hair Vitalizer Zandu Seniorz Care Juice Juice Juice Prostate Care Juice 35+ New products and variants launched in FY24 8
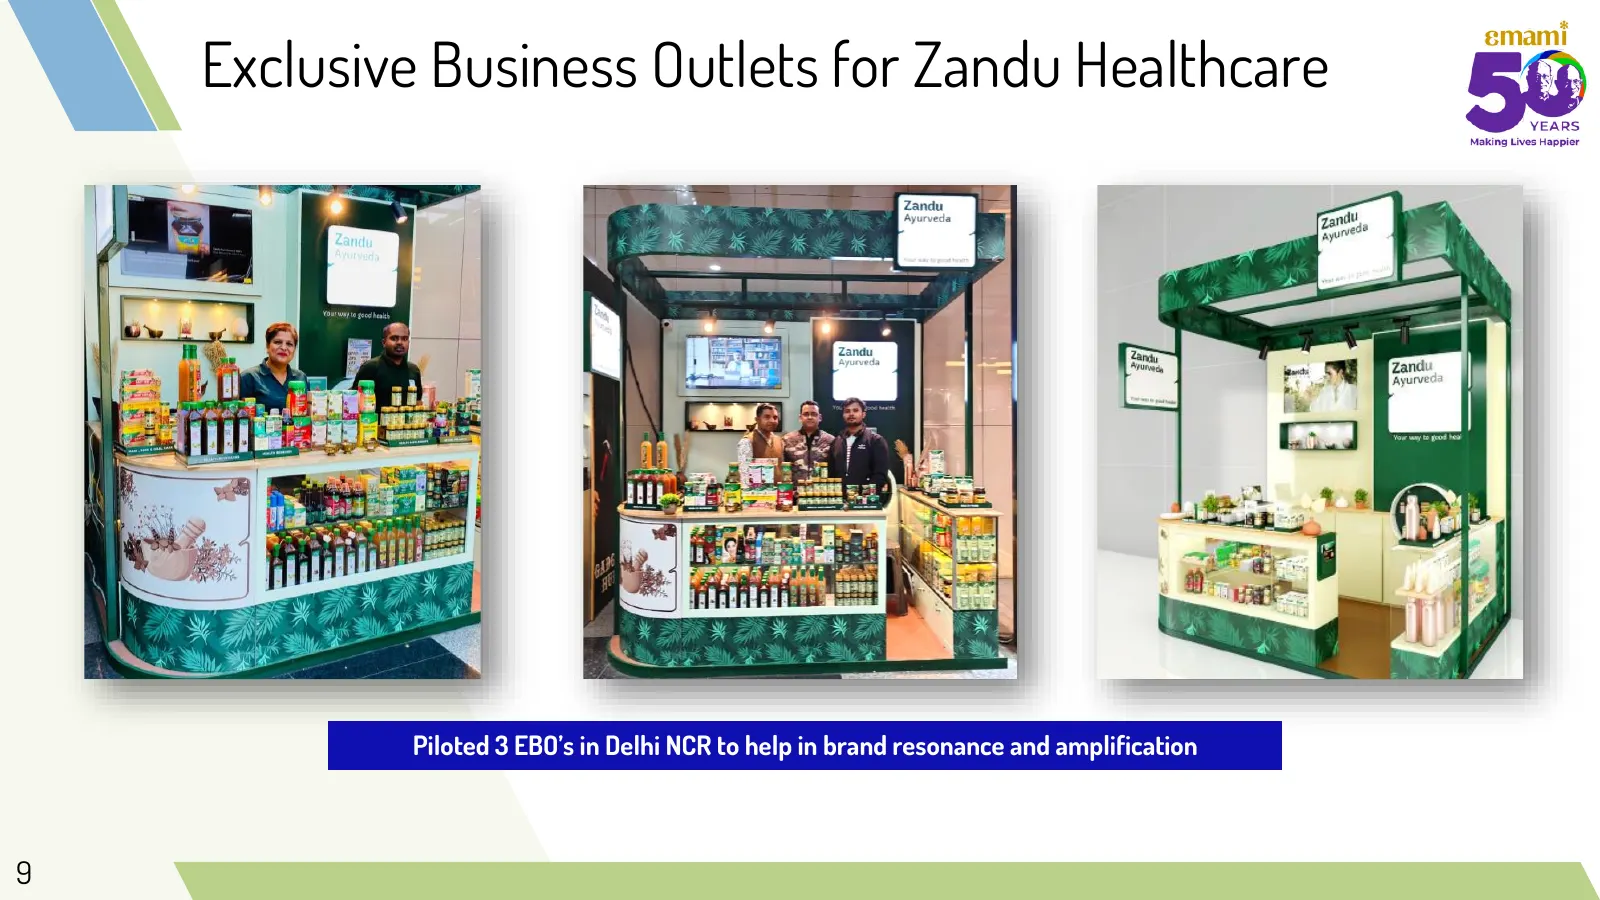
Slide 9: Exclusive Business Outlets for Zandu Healthcare
Exclusive Business Outlets for Zandu Healthcare Piloted 3 EBO’s in Delhi NCR to help in brand resonance and amplification 9
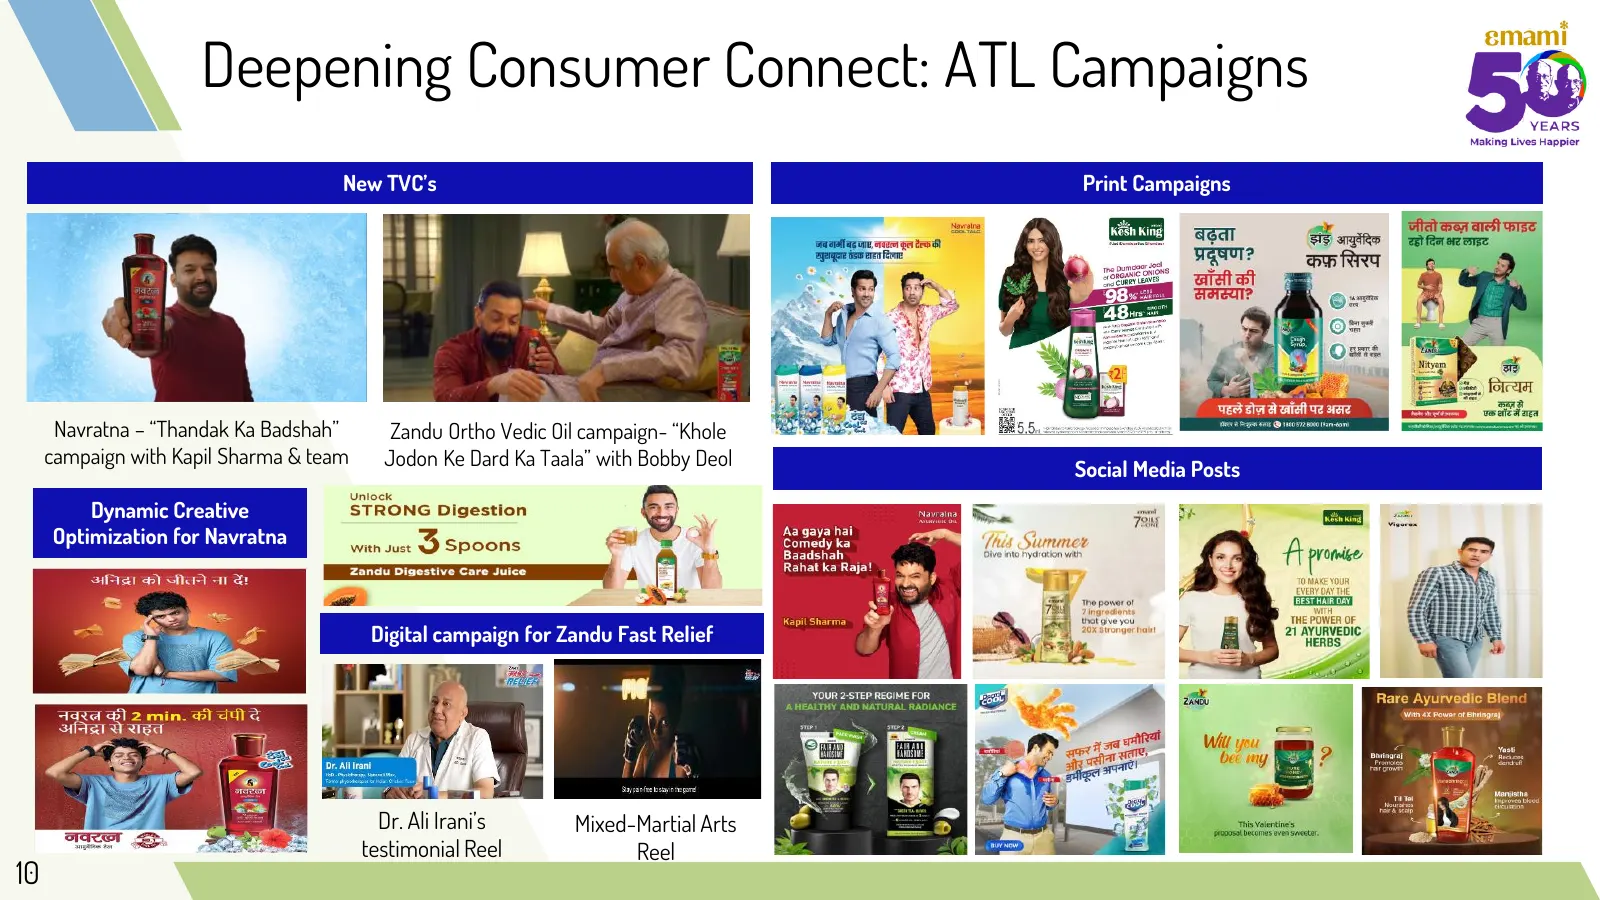
Slide 10: Deepening Consumer Connect: ATL Campaigns
Deepening Consumer Connect: ATL Campaigns New TVC’s Print Campaigns Navratna – “Thandak Ka Badshah” Zandu Ortho Vedic Oil campaign- “Khole campaign with Kapil Sharma & team Jodon Ke Dard Ka Taala” with Bobby Deol Social Media Posts Dynamic Creative Optimization for Navratna Digital campaign for Zand
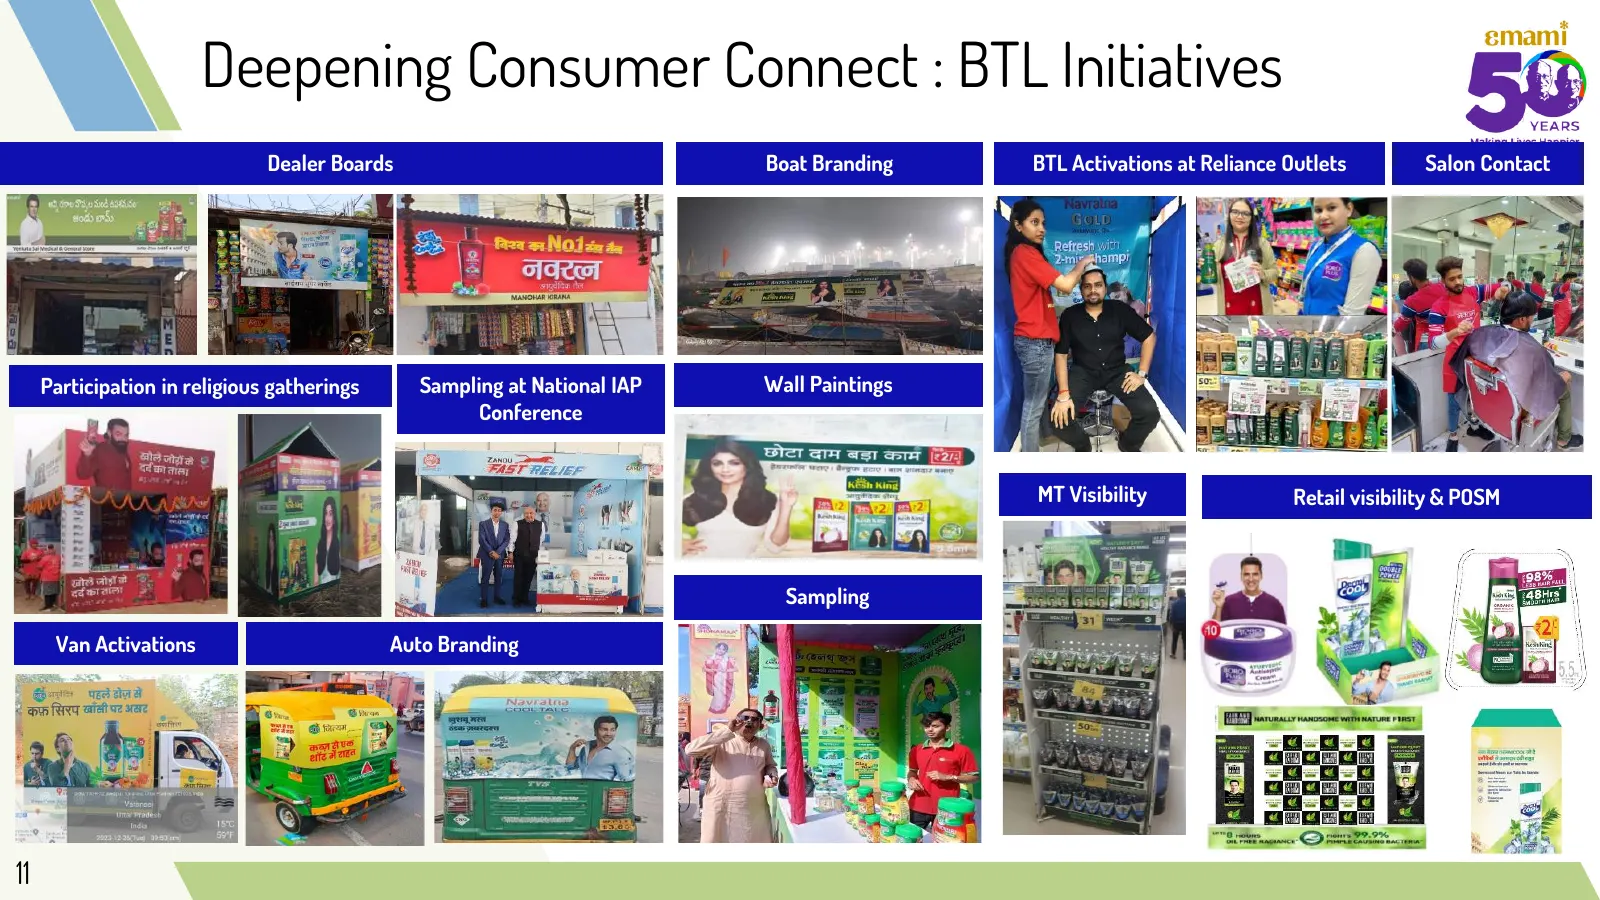
Slide 11: Deepening Consumer Connect: BTL Initiatives
Deepening Consumer Connect : BTL Initiatives Dealer Boards Boat Branding BTL Activations at Reliance Outlets Salon Contact Participation in religious gatherings Sampling at National IAP Wall Paintings Conference MT Visibility Retail visibility & POSM Sampling Van Activations Auto Branding 11
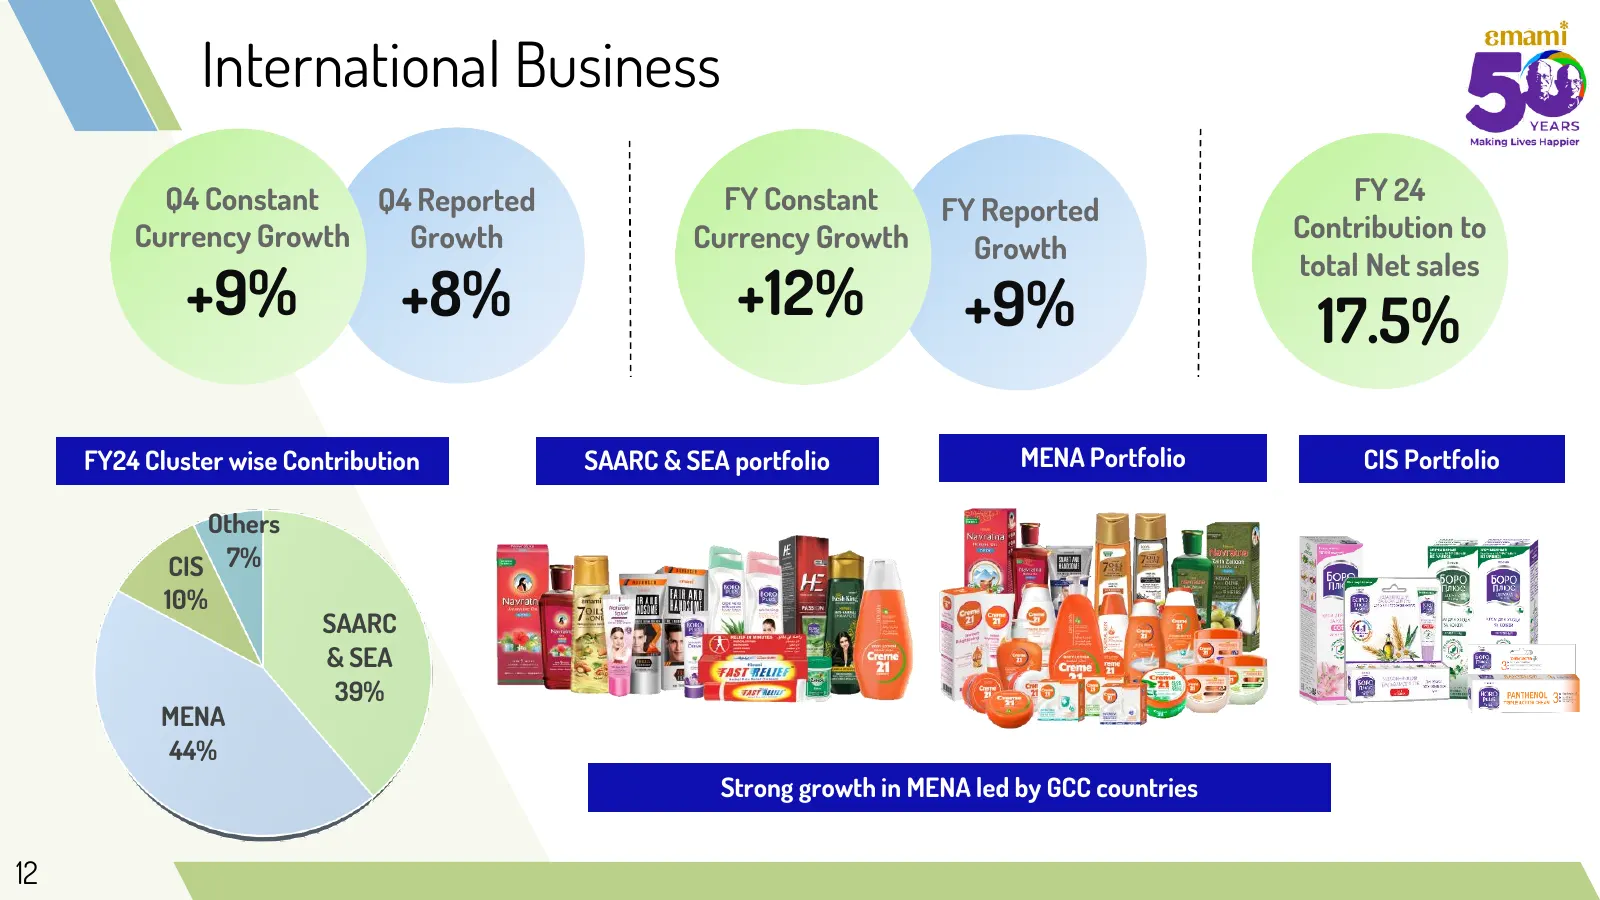
Slide 12: International Business
International Business Q4 Constant Q4 Reported FY Constant FY 24 FY Reported Currency Growth Growth Currency Growth Contribution to Growth total Net sales +9% +8% +12% +9% 17.5% FY24 Cluster wise Contribution SAARC & SEA portfolio MENA Portfolio CIS Portfolio Others CIS 7% 10% SAARC & SEA 39% MENA 4
Slide 13: NPD’s: International Business
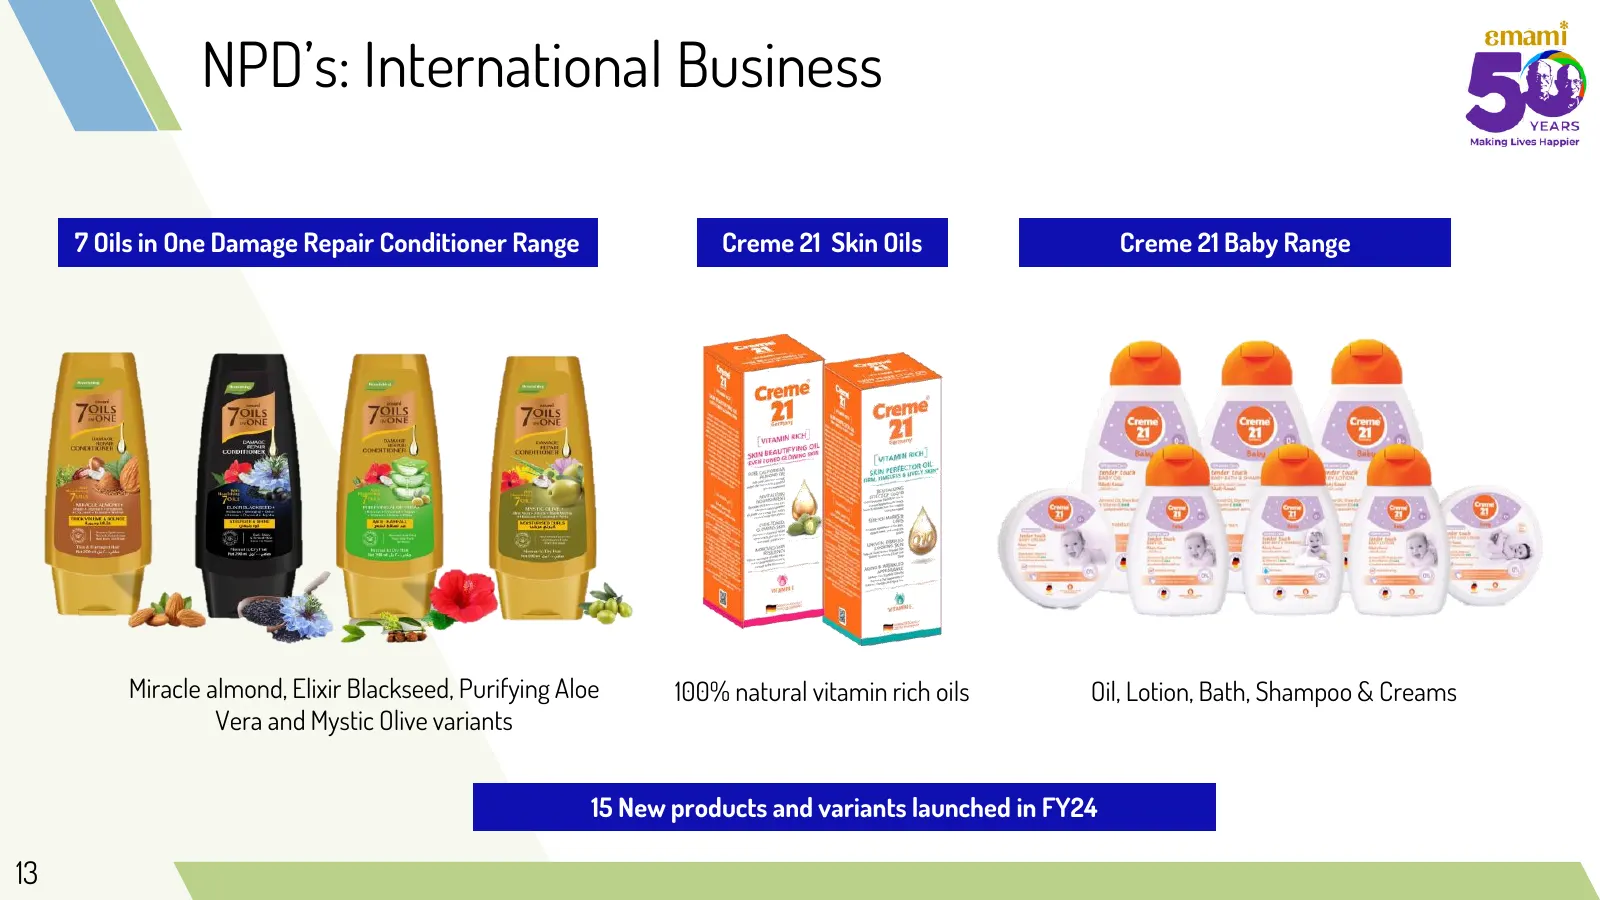
NPD’s: International Business 7 Oils in One Damage Repair Conditioner Range Creme 21 Skin Oils Creme 21 Baby Range Miracle almond, Elixir Blackseed, Purifying Aloe 100% natural vitamin rich oils Oil, Lotion, Bath, Shampoo & Creams Vera and Mystic Olive variants 15 New products and variants launched
Slide 14: Q4FY24 Profitability
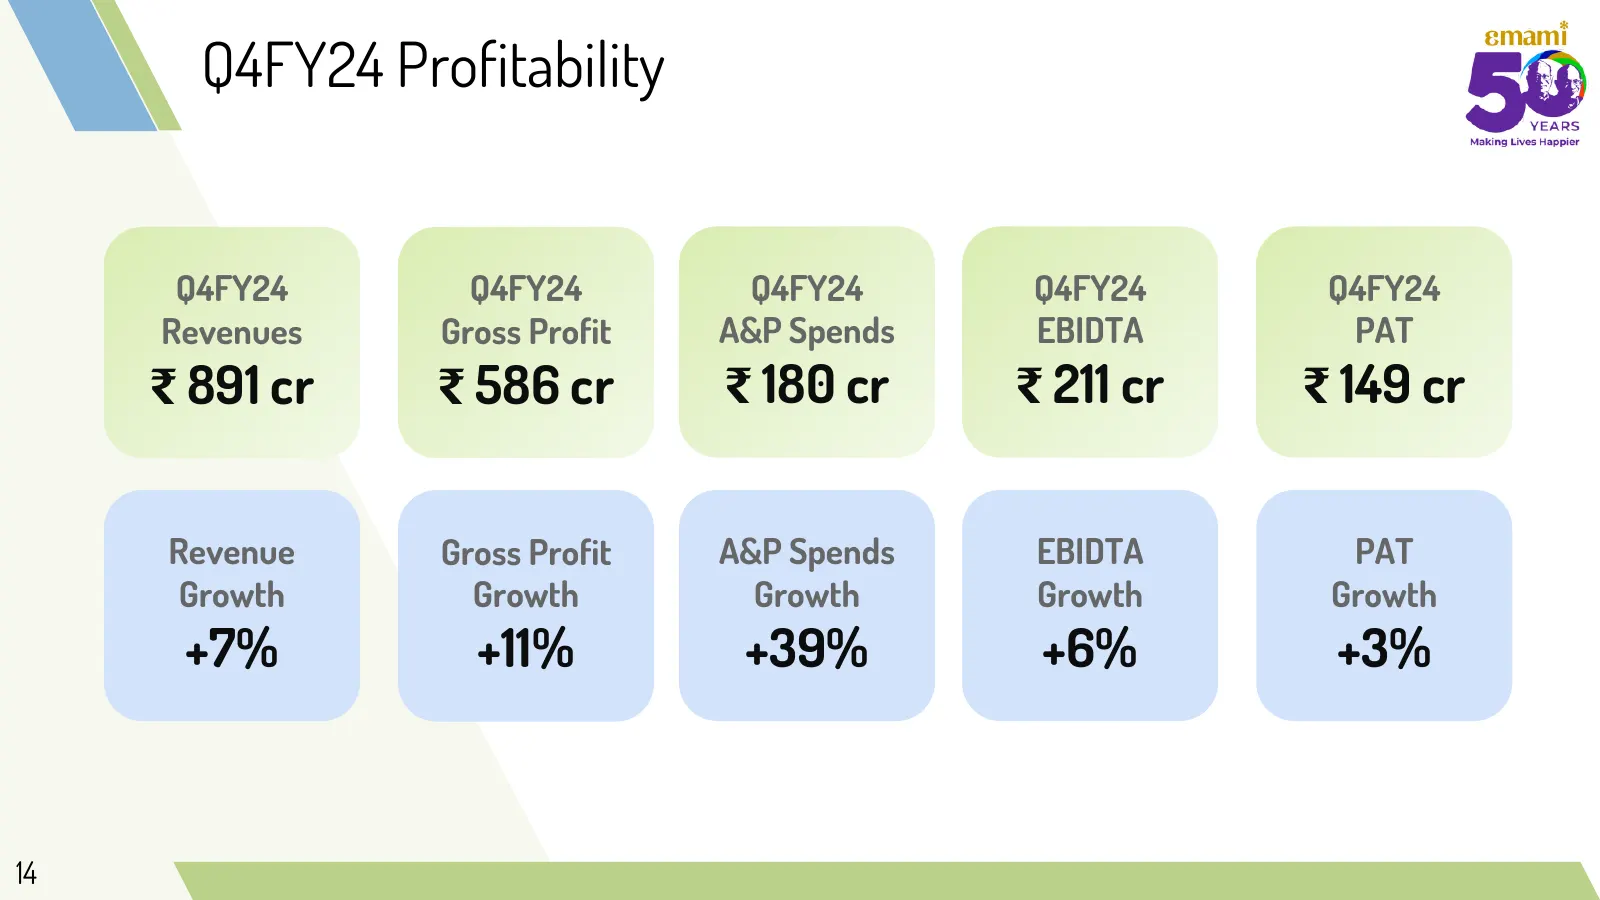
Q4FY24 Profitability Q4FY24 Q4FY24 Q4FY24 Q4FY24 Q4FY24 Revenues Gross Profit A&P Spends EBIDTA PAT ₹ 891 cr ₹ 586 cr ₹ 180 cr ₹ 211 cr ₹ 149 cr Revenue Gross Profit A&P Spends EBIDTA PAT Growth Growth Growth Growth Growth +7% +11% +39% +6% +3% 14
Slide 15: Q4FY24 Financial Analysis
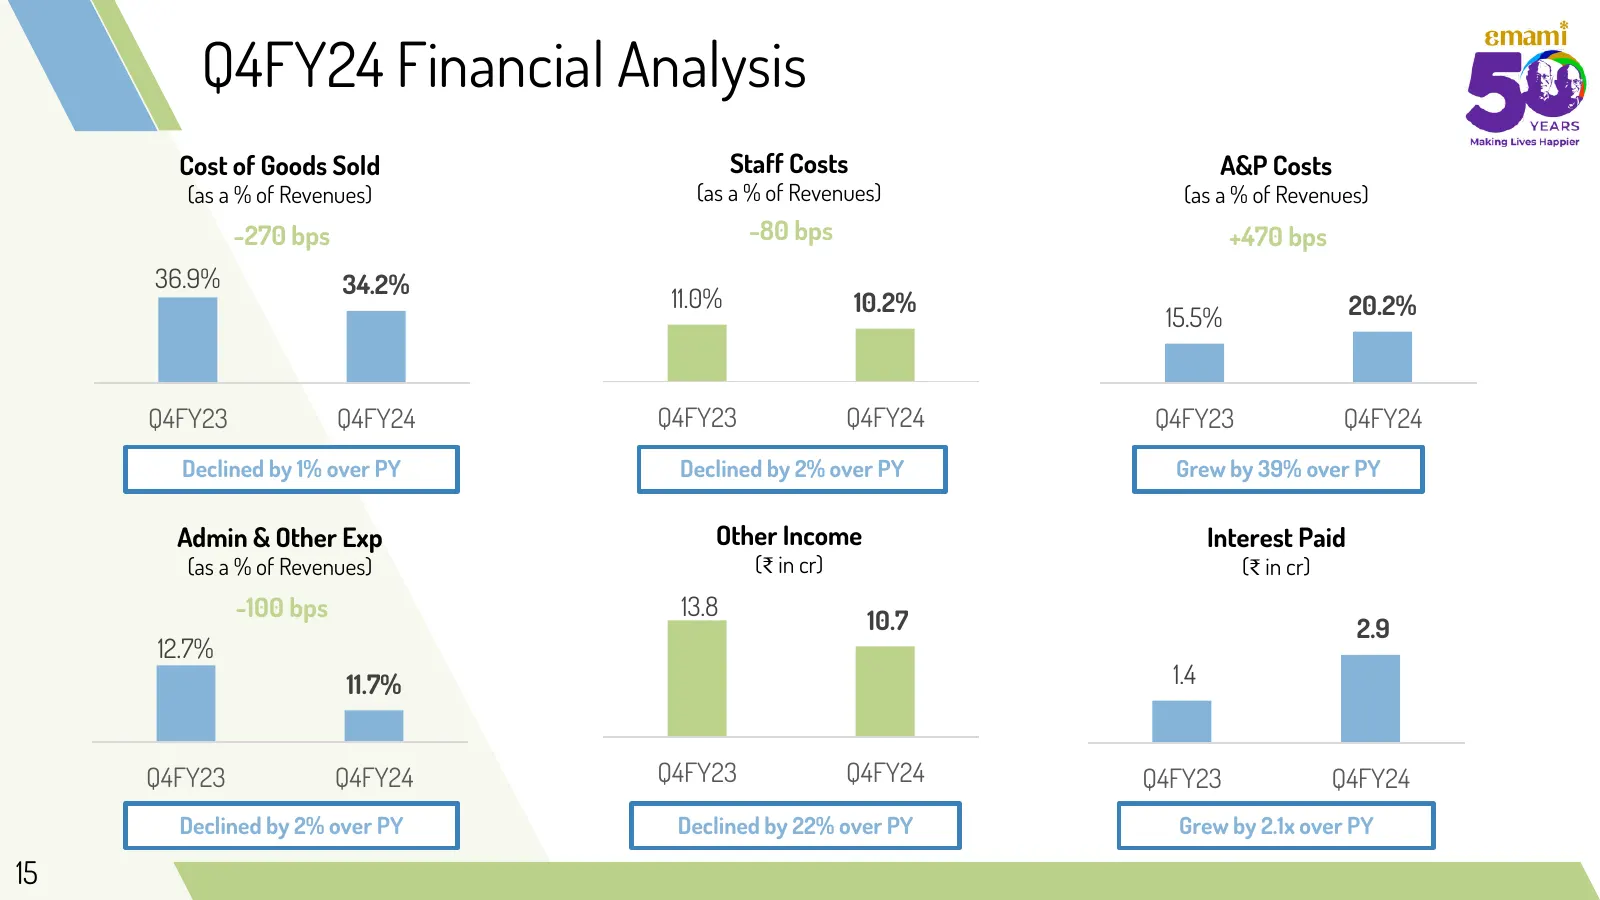
Q4FY24 Financial Analysis Cost of Goods Sold Staff Costs A&P Costs (as a % of Revenues) (as a % of Revenues) (as a % of Revenues) -270 bps -80 bps +470 bps 36.9% 34.2% 11.0% 10.2% 20.2% 15.5% Q4FY23 Q4FY24 Q4FY23 Q4FY24 Q4FY23 Q4FY24 Declined by 1% over PY Declined by 2% over PY Grew by 39% over PY
Slide 16: FY24 Profitability
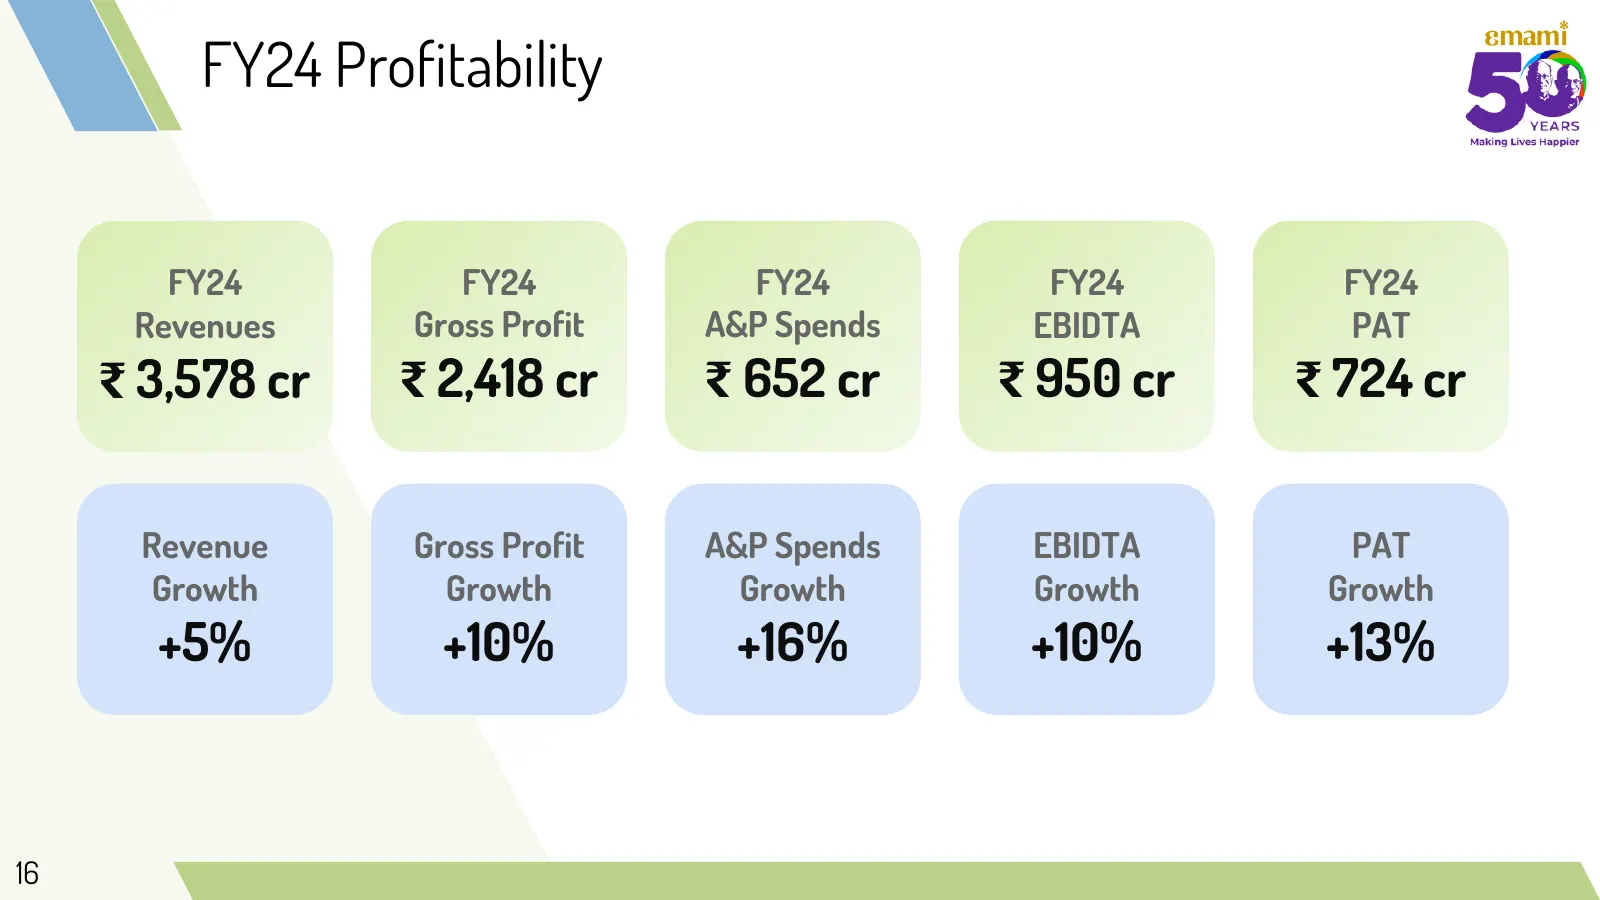
FY24 Profitability FY24 FY24 FY24 FY24 FY24 Revenues Gross Profit A&P Spends EBIDTA PAT ₹ 3,578 cr ₹ 2,418 cr ₹ 652 cr ₹ 950 cr ₹ 724 cr Revenue Gross Profit A&P Spends EBIDTA PAT Growth Growth Growth Growth Growth +5% +10% +16% +10% +13% 16
Slide 17: FY24 Financial Analysis
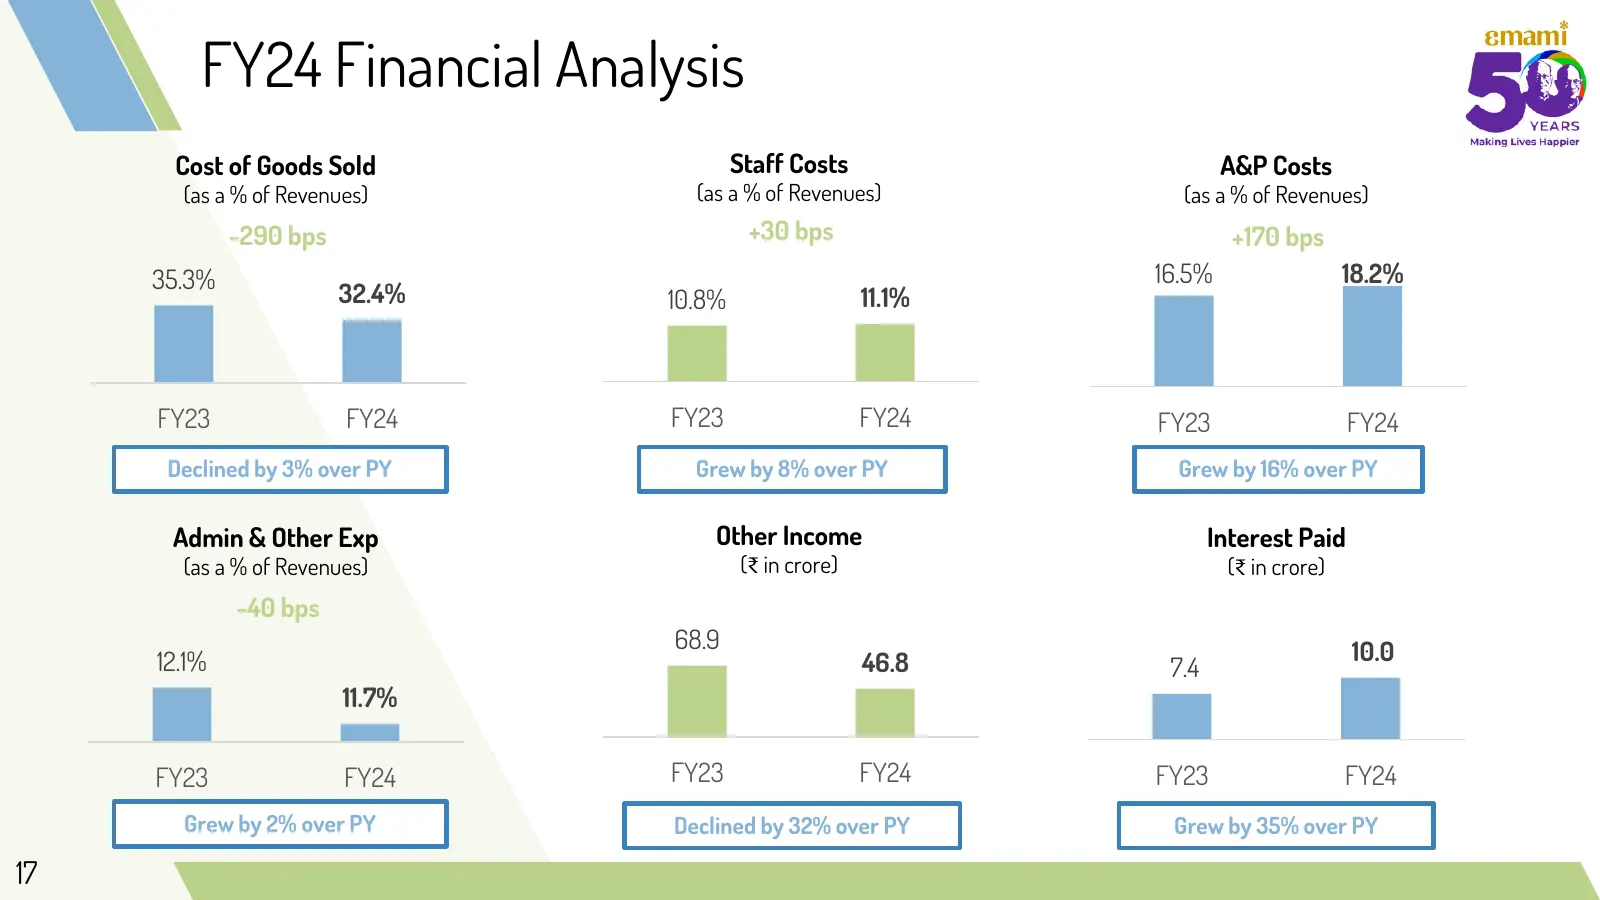
FY24 Financial Analysis Cost of Goods Sold Staff Costs A&P Costs (as a % of Revenues) (as a % of Revenues) (as a % of Revenues) -290 bps +30 bps +170 bps 35.3% 16.5% 18.2% 32.4% 10.8% 11.1% FY23 FY24 FY23 FY24 FY23 FY24 Declined by 3% over PY Grew by 8% over PY Grew by 16% over PY Admin & Other Exp
Slide 18: Q4FY24 Consolidated Financials
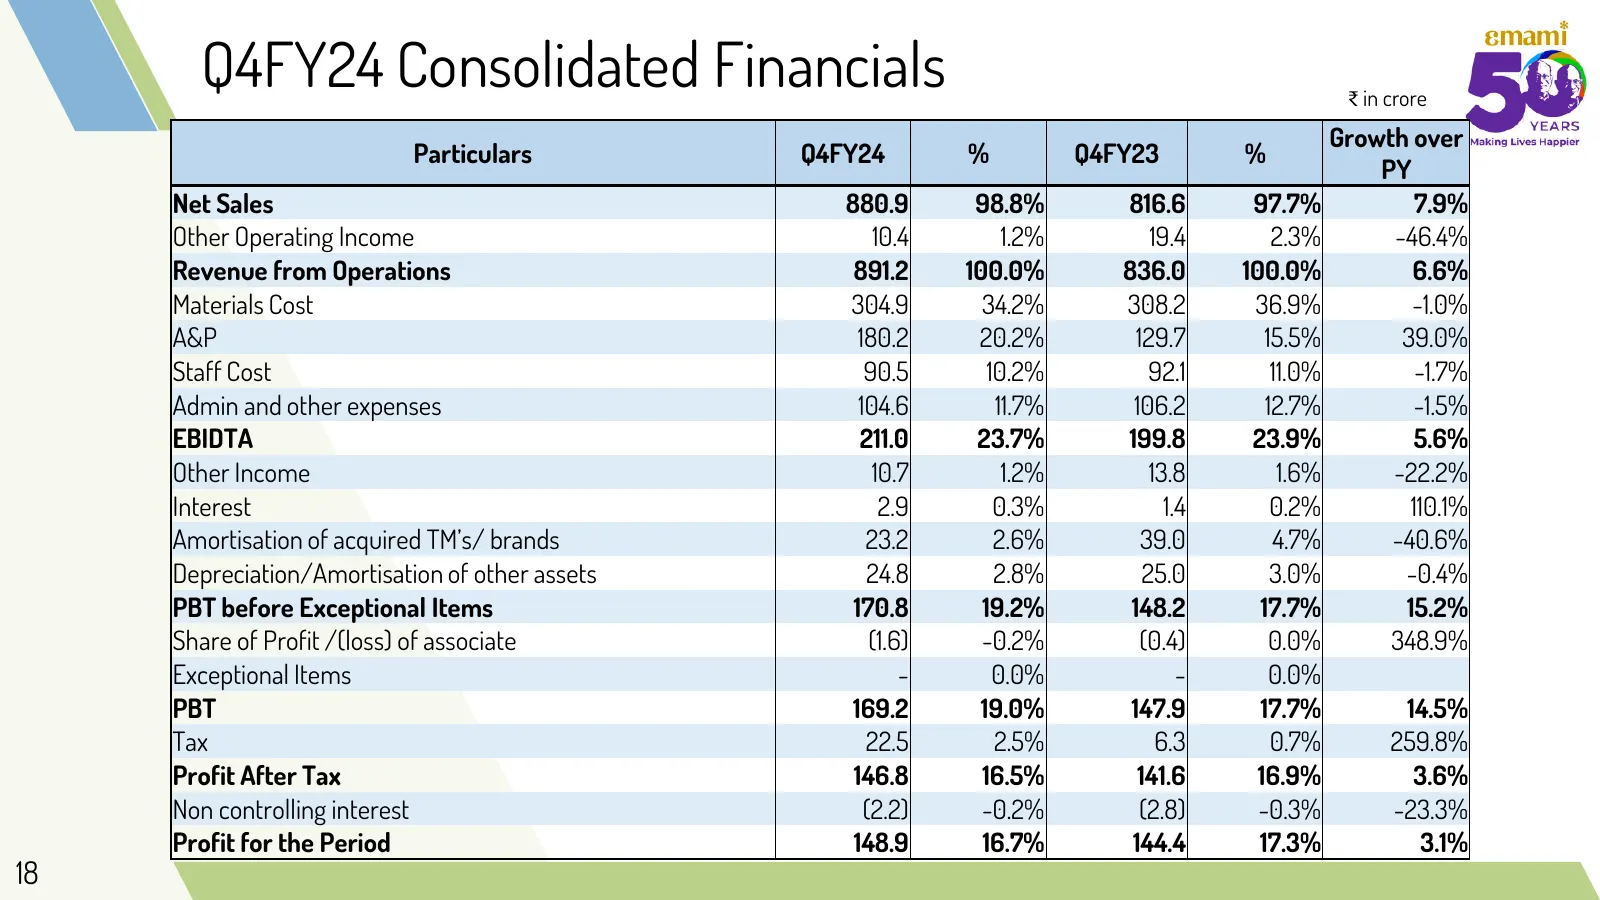
Q4FY24 Consolidated Financials ₹ in crore Growth over Particulars Q4FY24 % Q4FY23 % PY Net Sales 880.9 98.8% 816.6 97.7% 7.9% Other Operating Income 10.4 1.2% 19.4 2.3% -46.4% Revenue from Operations 891.2 100.0% 836.0 100.0% 6.6% Materials Cost 304.9 34.2% 308.2 36.9% -1.0% A&P 180.2 20.2% 129.7 15
Slide 19: FY24 Consolidated Financials
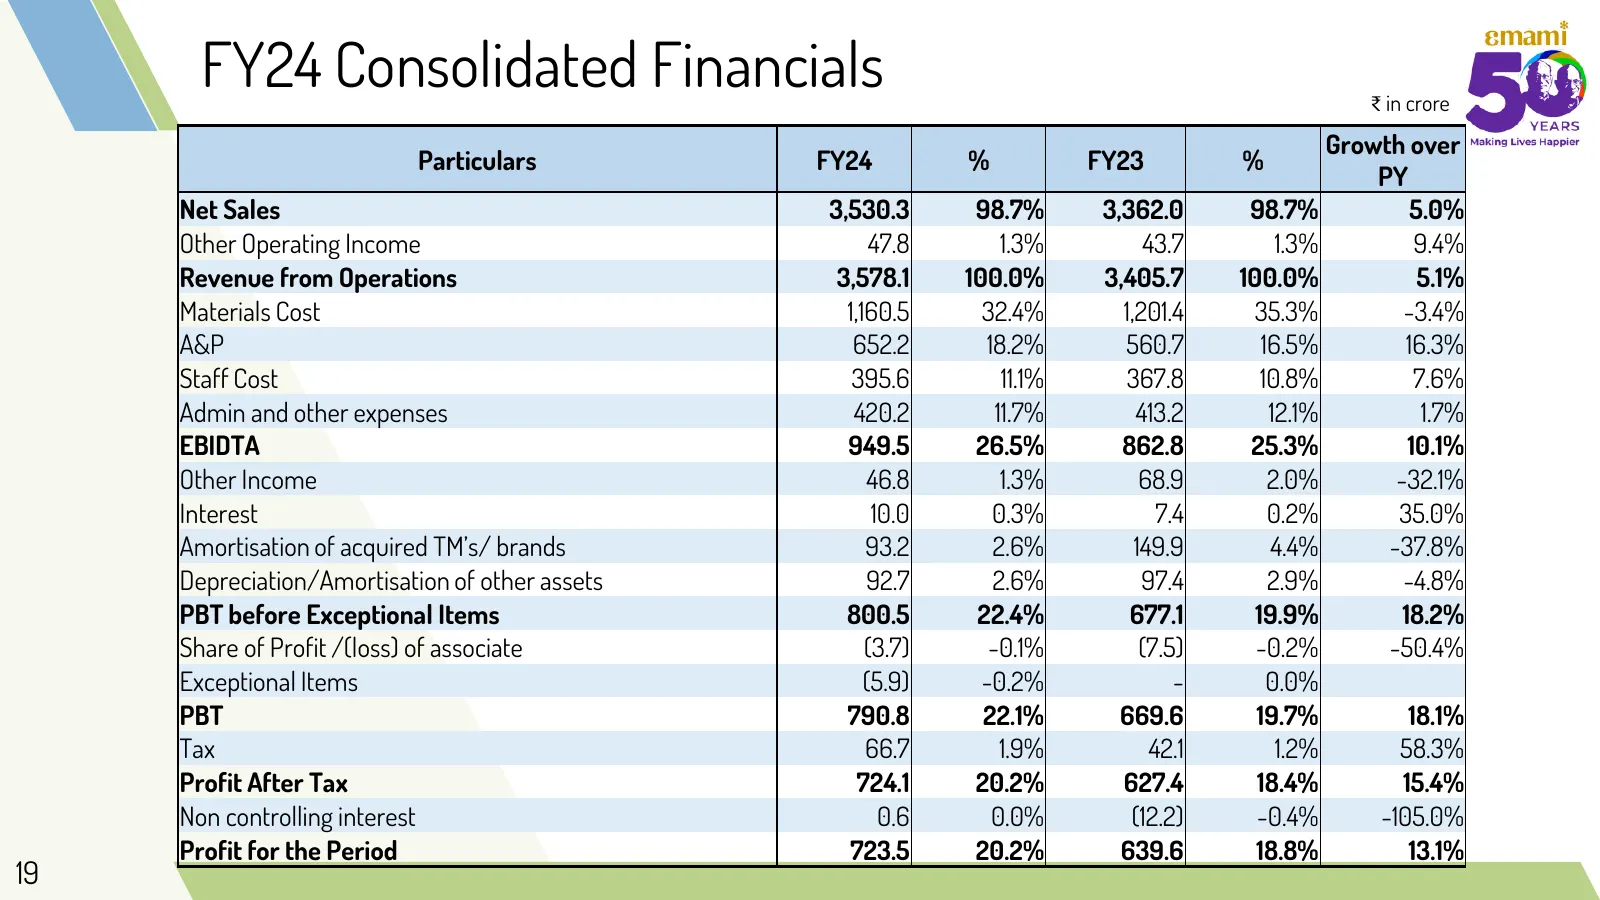
FY24 Consolidated Financials ₹ in crore Growth over Particulars FY24 % FY23 % PY Net Sales 3,530.3 98.7% 3,362.0 98.7% 5.0% Other Operating Income 47.8 1.3% 43.7 1.3% 9.4% Revenue from Operations 3,578.1 100.0% 3,405.7 100.0% 5.1% Materials Cost 1,160.5 32.4% 1,201.4 35.3% -3.4% A&P 652.2 18.2% 560.
Slide 20: Balance Sheet
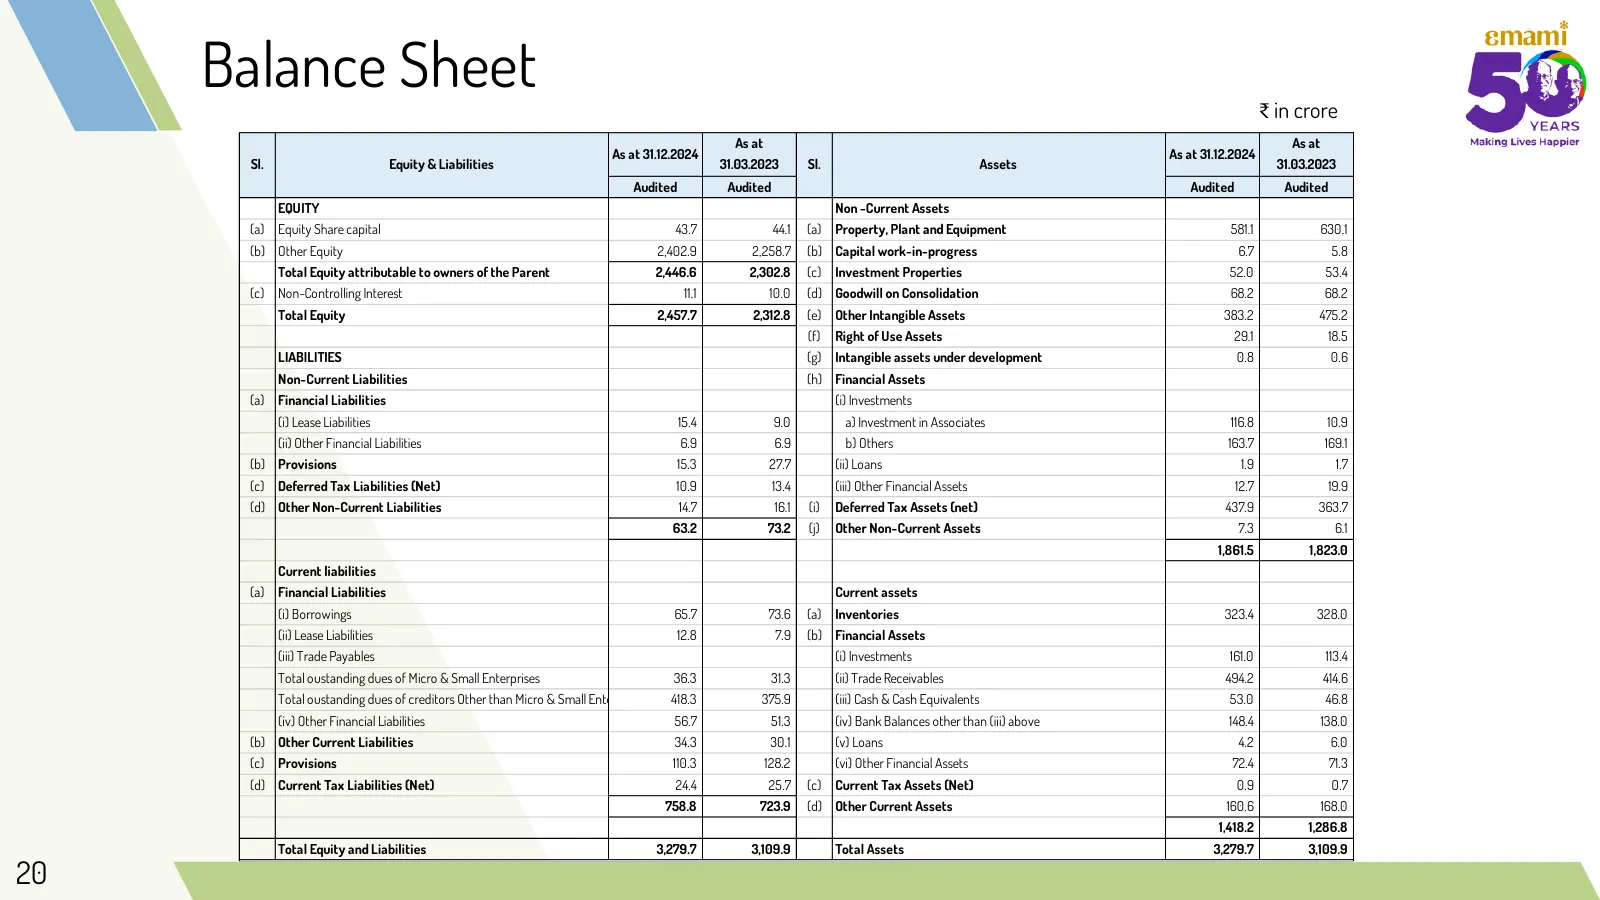
Balance Sheet ₹ in crore As at As at As at 31.12.2024 As at 31.12.2024 Sl. Equity & Liabilities 31.03.2023 Sl. Assets 31.03.2023 Audited Audited Audited Audited EQUITY Non -Current Assets (a) Equity Share capital 43.7 44.1 (a) Property, Plant and Equipment 581.1 630.1 (b) Other Equity 2,402.9 2,258.
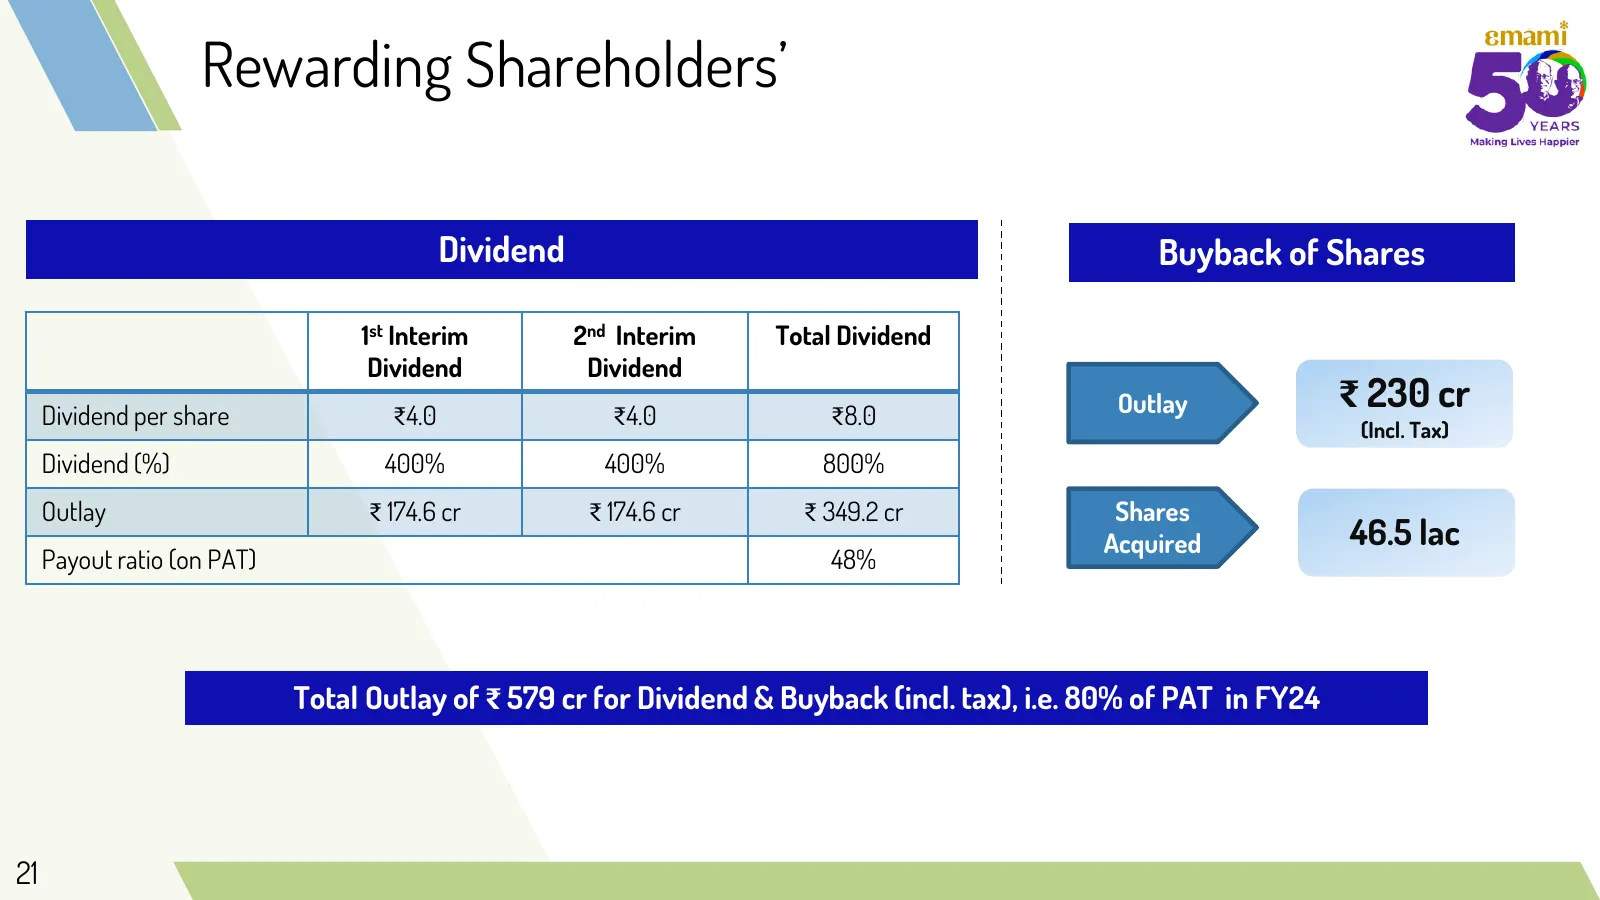
Slide 21: Rewarding Shareholders’
Rewarding Shareholders’ Dividend Buyback of Shares 1st Interim 2nd Interim Total Dividend Dividend Dividend Dividend per share ₹4.0 ₹4.0 ₹8.0 Outlay ₹ 230 cr (Incl. Tax) Dividend (%) 400% 400% 800% Outlay ₹ 174.6 cr ₹ 174.6 cr ₹ 349.2 cr Shares Acquired 46.5 lac Payout ratio (on PAT) 48% Total Outla
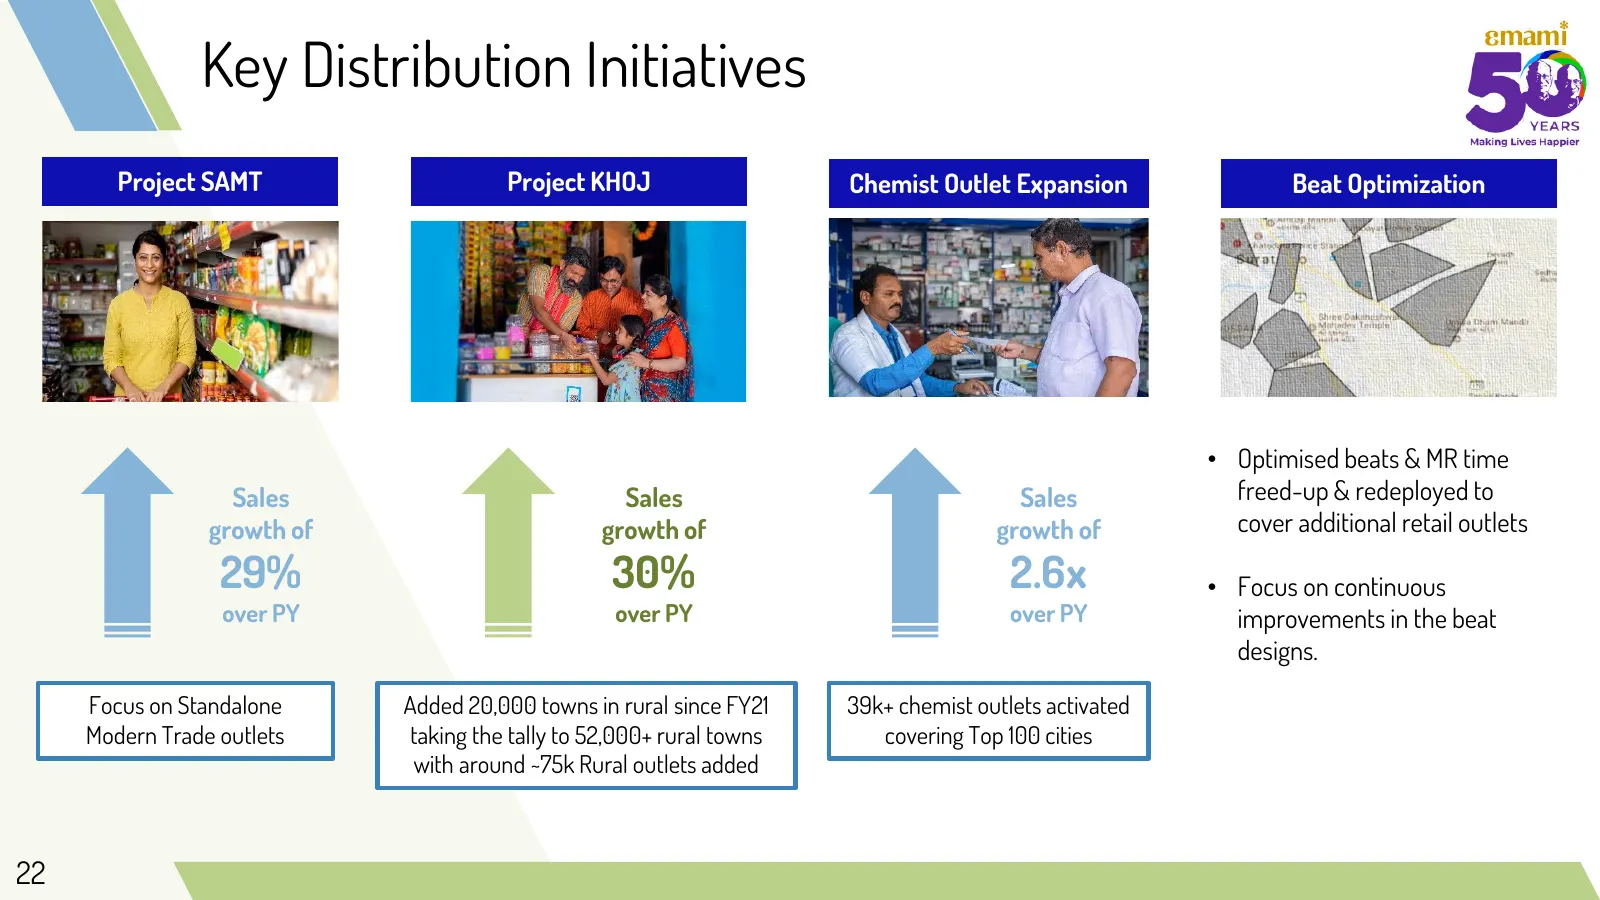
Slide 22: Key Distribution Initiatives
Key Distribution Initiatives Project SAMT Project KHOJ Chemist Outlet Expansion Beat Optimization • Optimised beats & MR time Sales Sales Sales freed-up & redeployed to growth of growth of growth of cover additional retail outlets 29% 30% 2.6x • Focus on continuous over PY over PY over PY improvemen
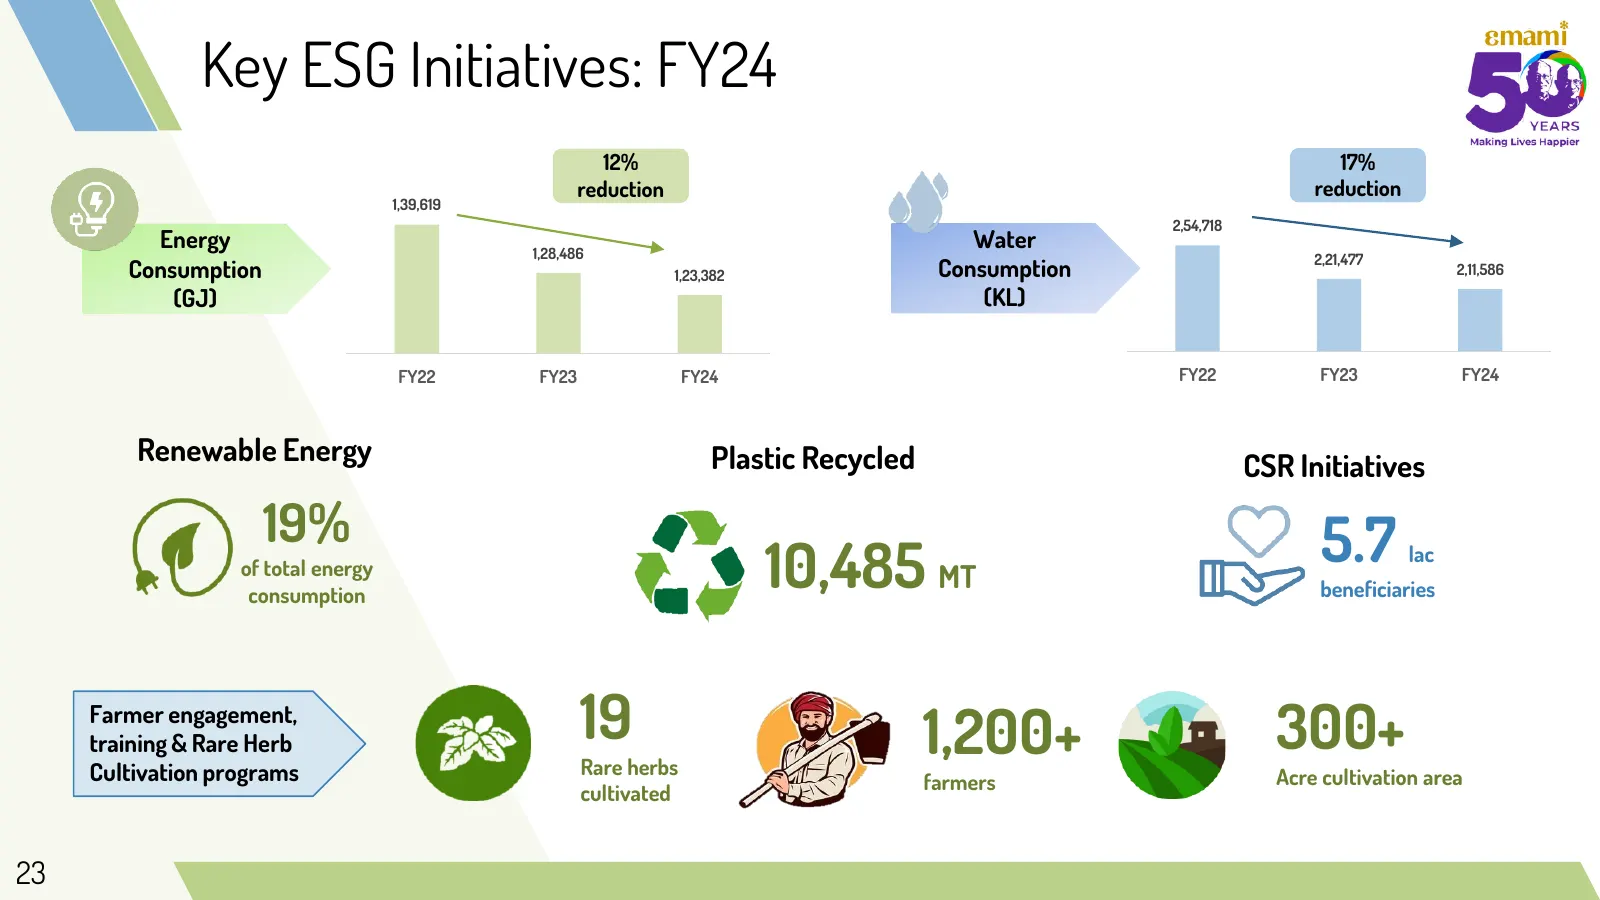
Slide 23: Key ESG Initiatives: FY24
Key ESG Initiatives: FY24 12% 17% reduction reduction 1,39,619 2,54,718 Energy 1,28,486 Water 2,21,477 Consumption 1,23,382 Consumption 2,11,586 (GJ) (KL) FY22 FY23 FY24 FY22 FY23 FY24 Renewable Energy Plastic Recycled CSR Initiatives 19% 5.7 of total energy consumption 10,485 MT lac beneficiaries F
Slide 24: Thank you
Thank you ~15% 24
Source: Internet Archive copy of emamiltd.in
More decks from Emami Limited
 Q2 FY27 Earnings Presentation25 slides · Nov 5, 2026
 Q1 FY27 Earnings Presentation18 slides · Aug 4, 2026
 Q4 FY2026 Earnings Presentation22 slides · May 21, 2026
 Nuvama India Conference 2026 & IIFL's 17th Enterprising India Global Investors' Conference22 slides · Feb 6, 2026
 Q3 FY2026 Earnings Presentation22 slides · Feb 5, 2026
 Q2 FY26 Earnings Presentation21 slides · Nov 10, 2025