GR. Sarantis S.A. · ATHEX:SAR
GR. Sarantis — Sarantis Group — H1 2016 Earnings Presentation
14 slides from GR. Sarantis's earnings presentation, Jul 28, 2016
Slide 1: Sarantis Group Investor & Analyst Conference Call Presentation H1 2016
Sarantis Group Investor & Analyst Conference Call Presentation H1 2016 Presented by : July 28th 2016 Kostas Rozakeas – CFO & Deputy CEO
Slide 2: Disclaimer
Disclaimer This material contains certain “forward-looking” statements. These statements are based on management’s current expectations and are naturally subject to uncertainty and changes in circumstances. Actual results may vary materially from the expectations contained herein and listeners are c
Slide 3: Consolidated Financial Highlights
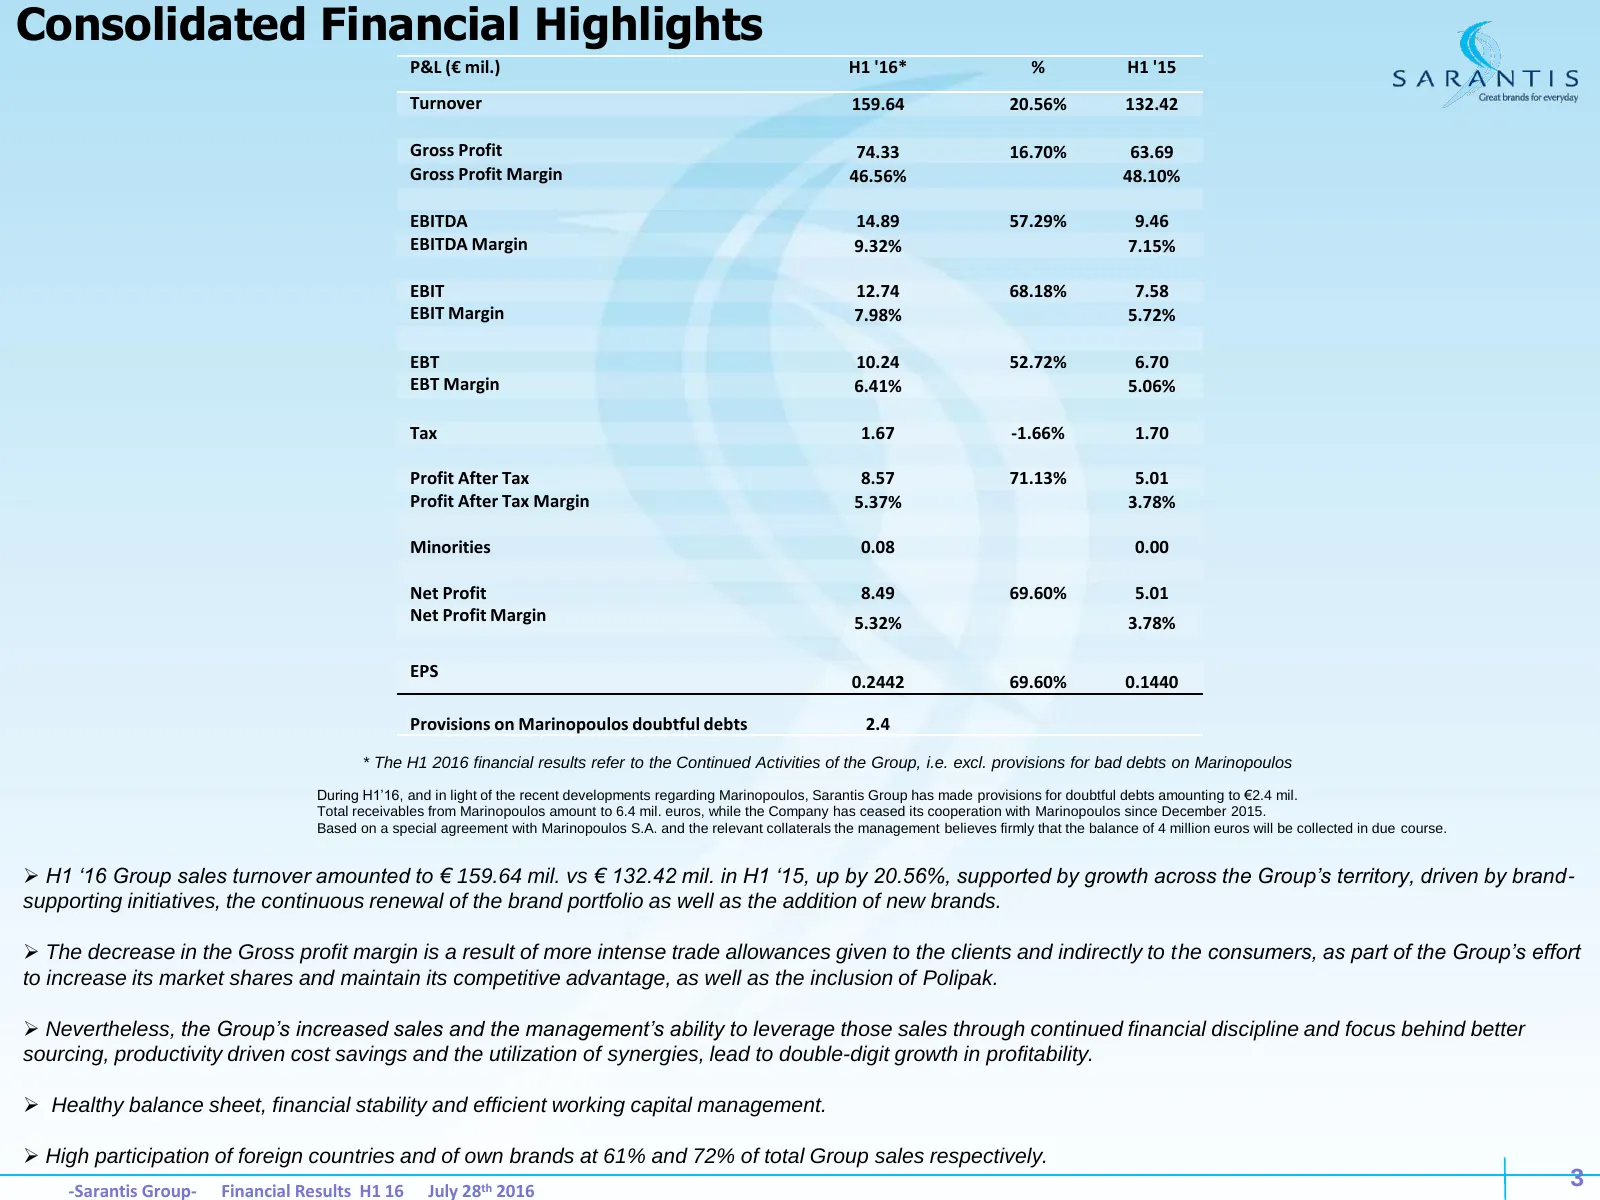
Consolidated Financial Highlights P&L (€ mil.) H1 '16* % H1 '15 Turnover 159.64 20.56% 132.42 Gross Profit 74.33 16.70% 63.69 Gross Profit Margin 46.56% 48.10% EBITDA 14.89 57.29% 9.46 EBITDA Margin 9.32% 7.15% EBIT 12.74 68.18% 7.58 EBIT Margin 7.98% 5.72% EBT 10.24 52.72% 6.70 EBT Margin 6.41% 5.0
Slide 4: Balance Sheet & Cash flow
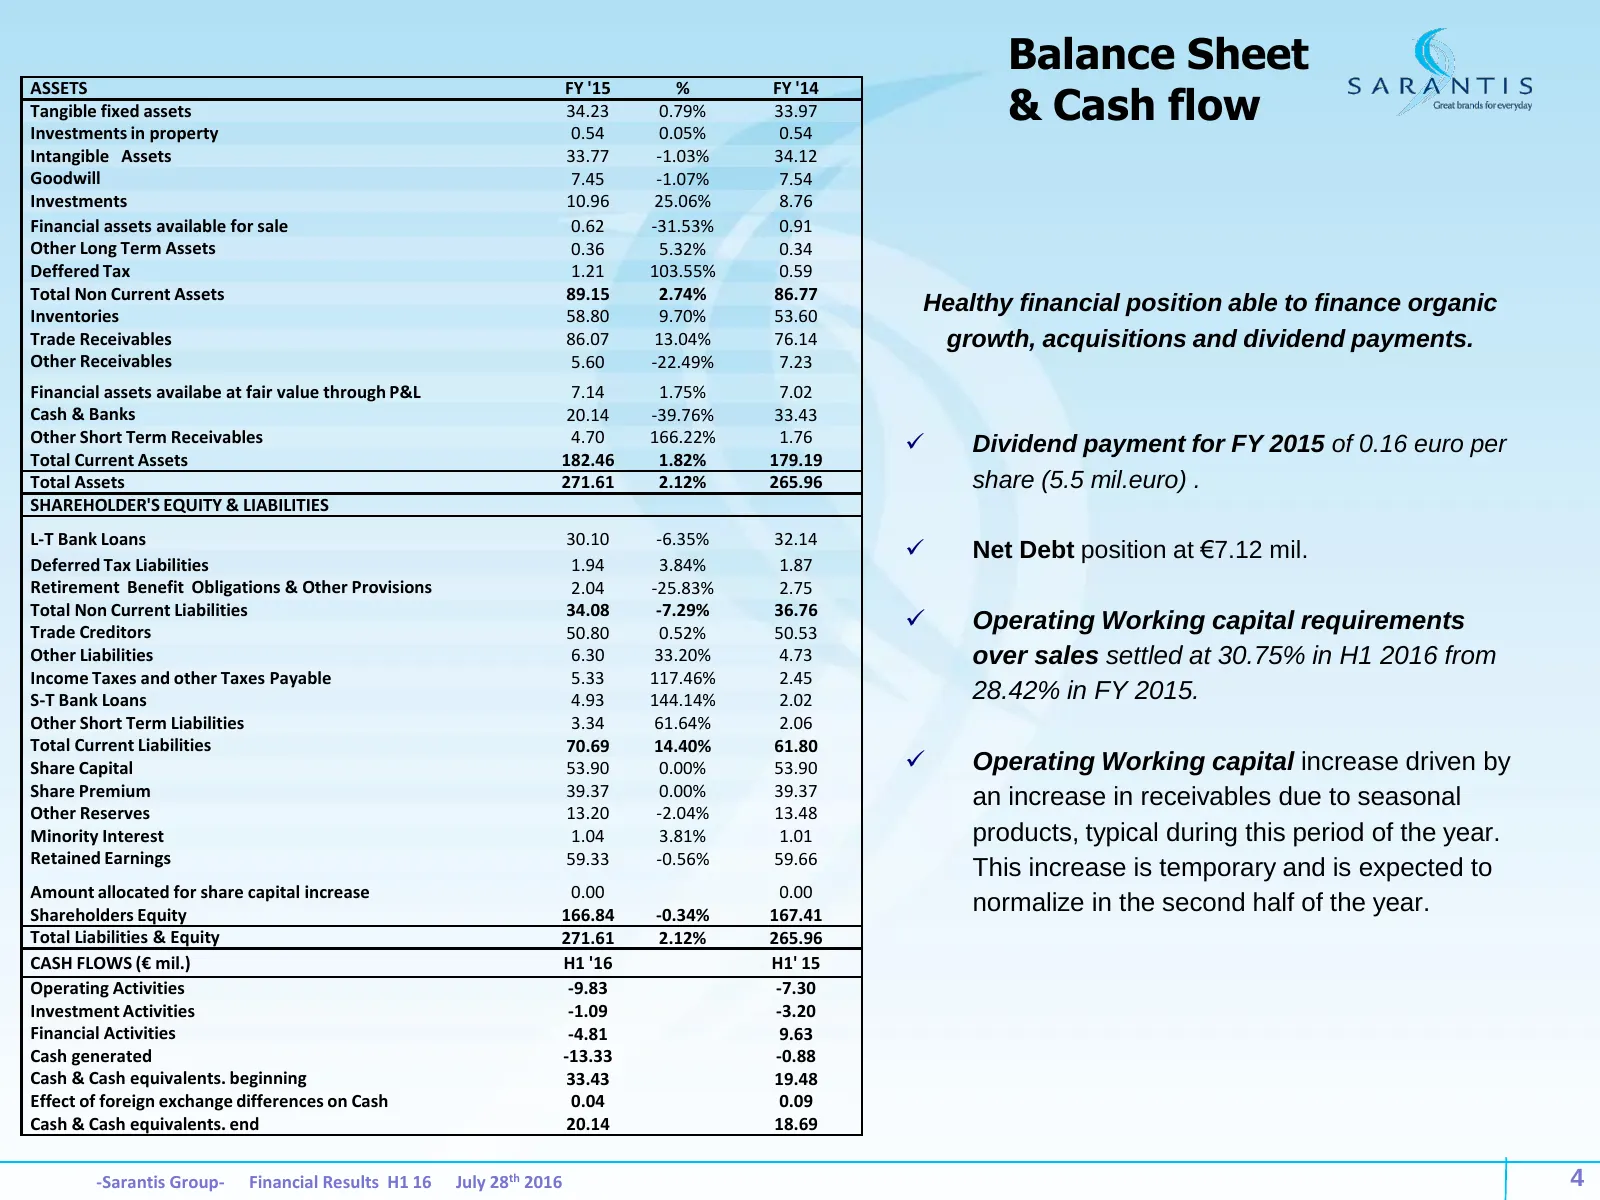
Balance Sheet & Cash flow ASSETS FY '15 % FY '14 Tangible fixed assets 34.23 0.79% 33.97 Investments in property 0.54 0.05% 0.54 Intangible Assets 33.77 -1.03% 34.12 Goodwill 7.45 -1.07% 7.54 Investments 10.96 25.06% 8.76 Financial assets available for sale 0.62 -31.53% 0.91 Other Long Term Assets 0
Slide 5: Business Units Analysis
SARANTIS Great brands for everyday Business Units Analysis
Slide 6: Turnover - SBU Split
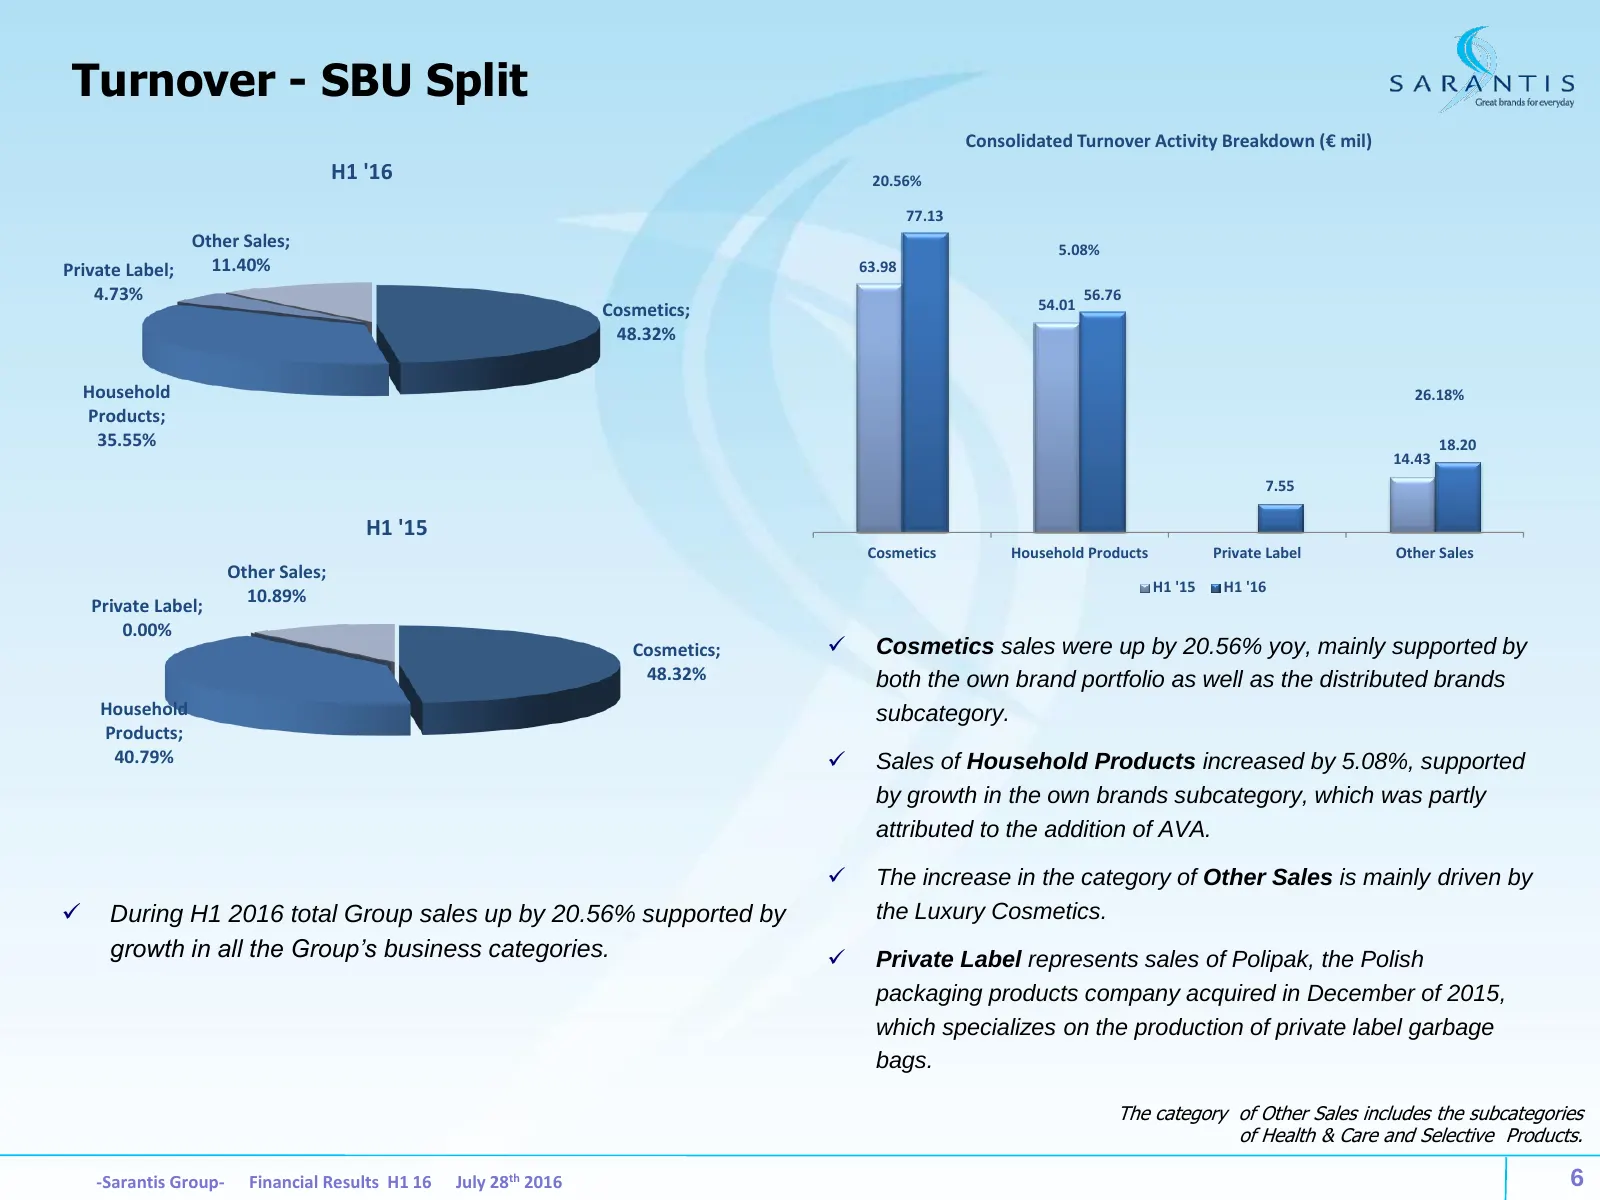
Turnover - SBU Split Consolidated Turnover Activity Breakdown (€ mil) H1 '16 20.56% 77.13 Other Sales; 5.08% Private Label; 11.40% 63.98 4.73% 56.76 Cosmetics; 54.01 48.32% Household 26.18% Products; 35.55% 18.20 14.43 7.55 H1 '15 Cosmetics Household Products Private Label Other Sales Other Sales; H
Slide 7: Turnover - Own vs Distributed Brands Overview
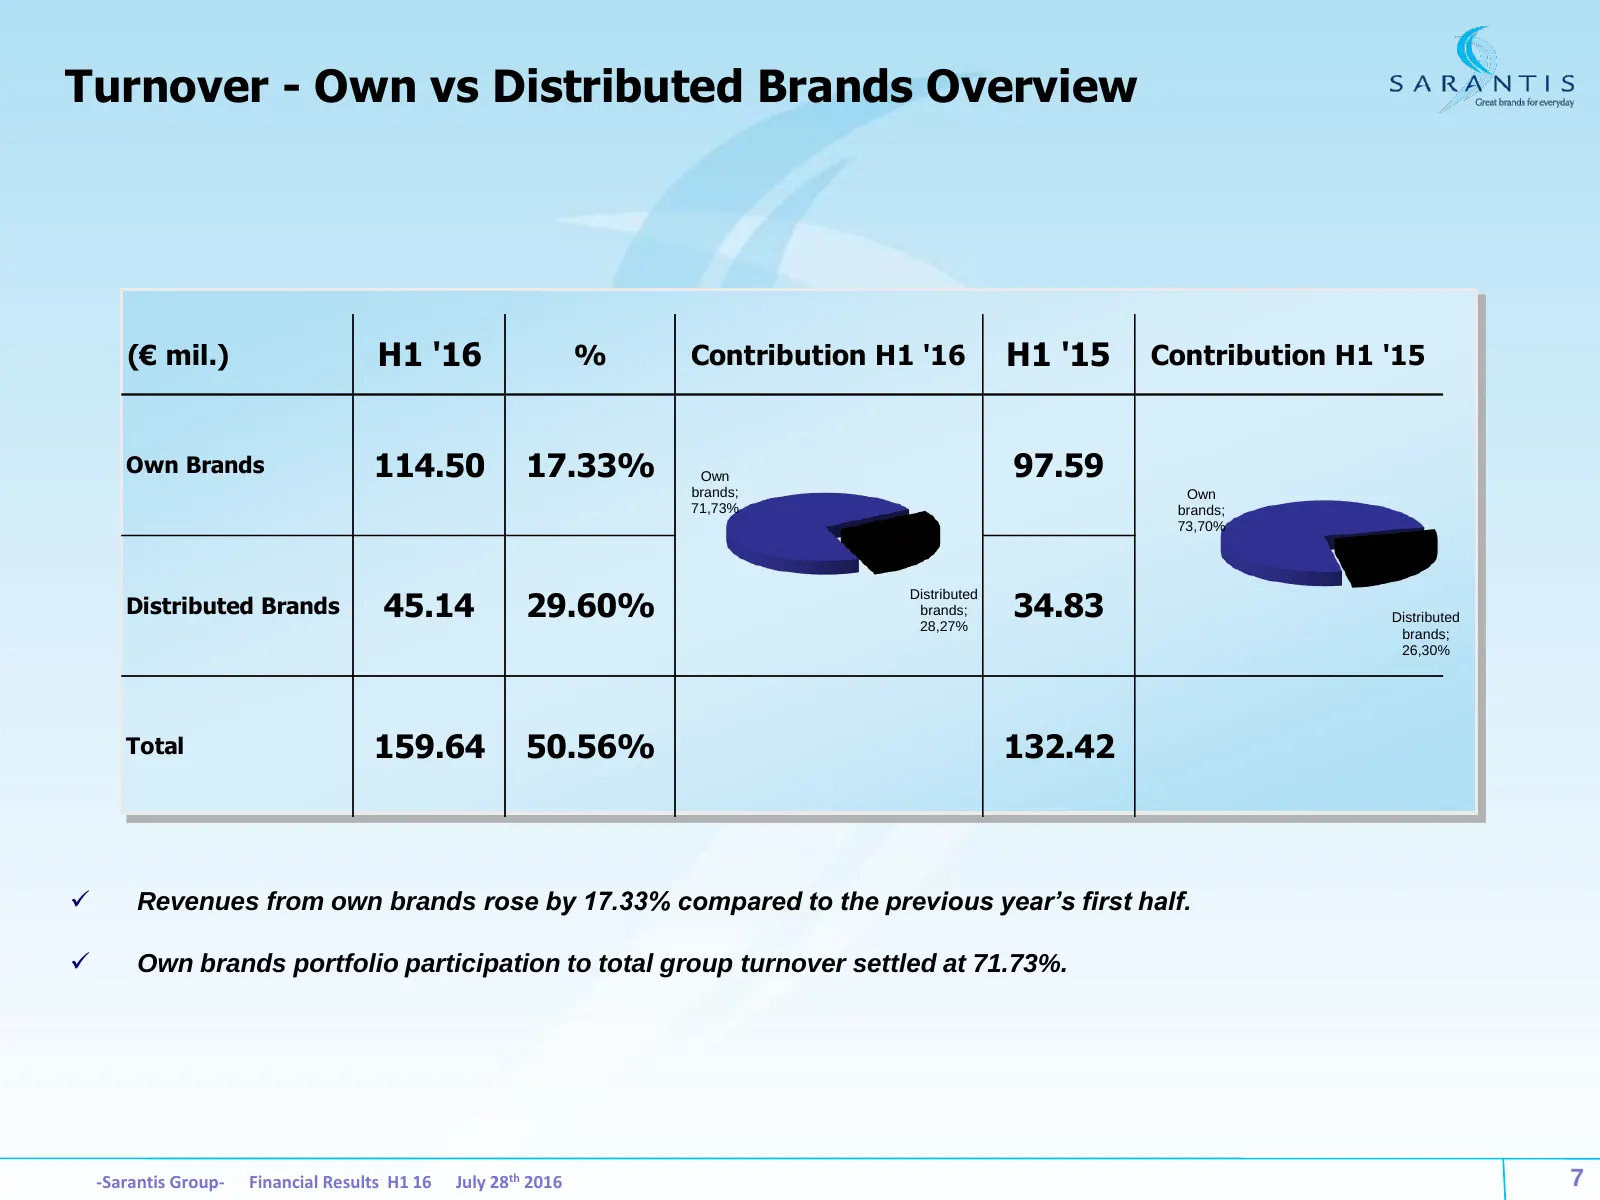
Turnover - Own vs Distributed Brands Overview (€ mil.) H1 '16 % Contribution H1 '16 H1 '15 Contribution H1 '15 Own Brands 114.50 17.33% Own 97.59 brands; Own 71,73% brands; 73,70% 45.14 29.60% 34.83 Distributed Distributed Brands brands; Distributed 28,27% brands; 26,30% Total 159.64 50.56% 132.42
Slide 8: EBIT – SBU Split
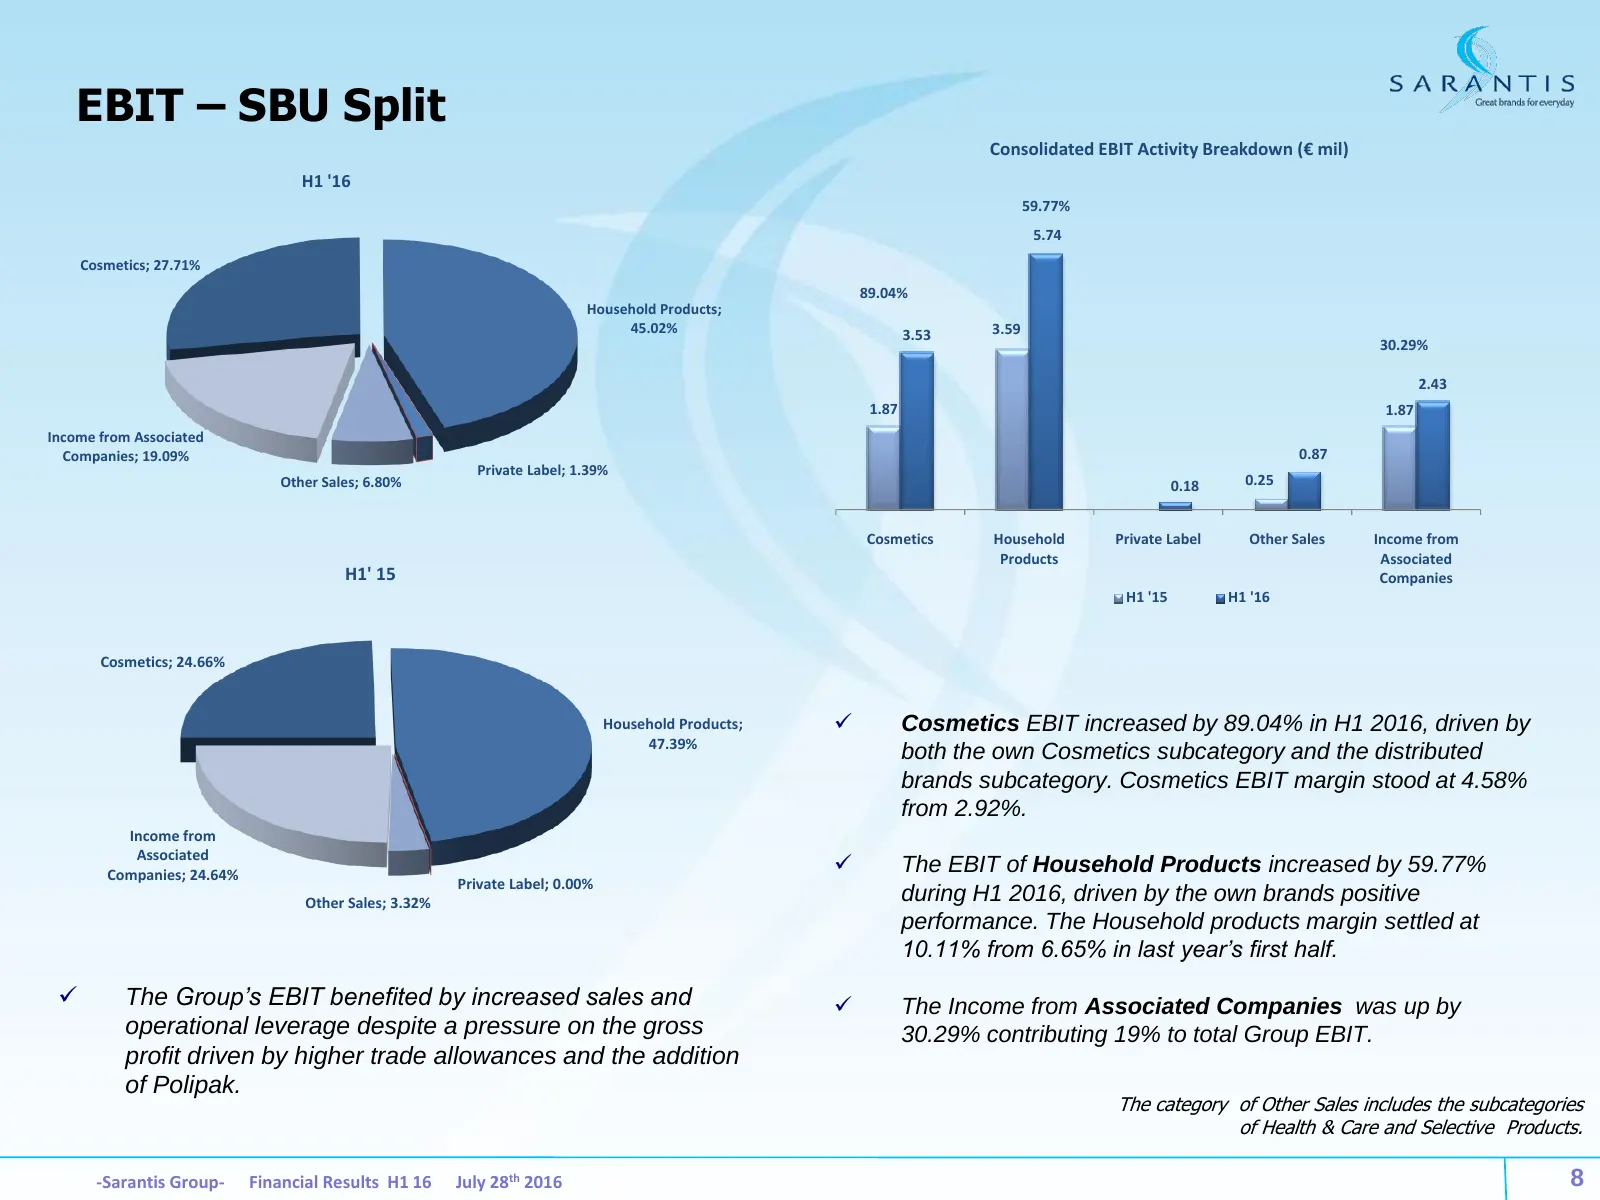
EBIT – SBU Split Consolidated EBIT Activity Breakdown (€ mil) H1 '16 59.77% 5.74 Cosmetics; 27.71% 89.04% Household Products; 45.02% 3.53 3.59 30.29% 2.43 1.87 1.87 Income from Associated Companies; 19.09% 0.87 Private Label; 1.39% Other Sales; 6.80% 0.18 0.25 Cosmetics Household Private Label Other
Slide 9: Geographical Analysis
SARANTIS Great brands for everyday Geographical Analysis
Slide 10: Turnover - Country Split
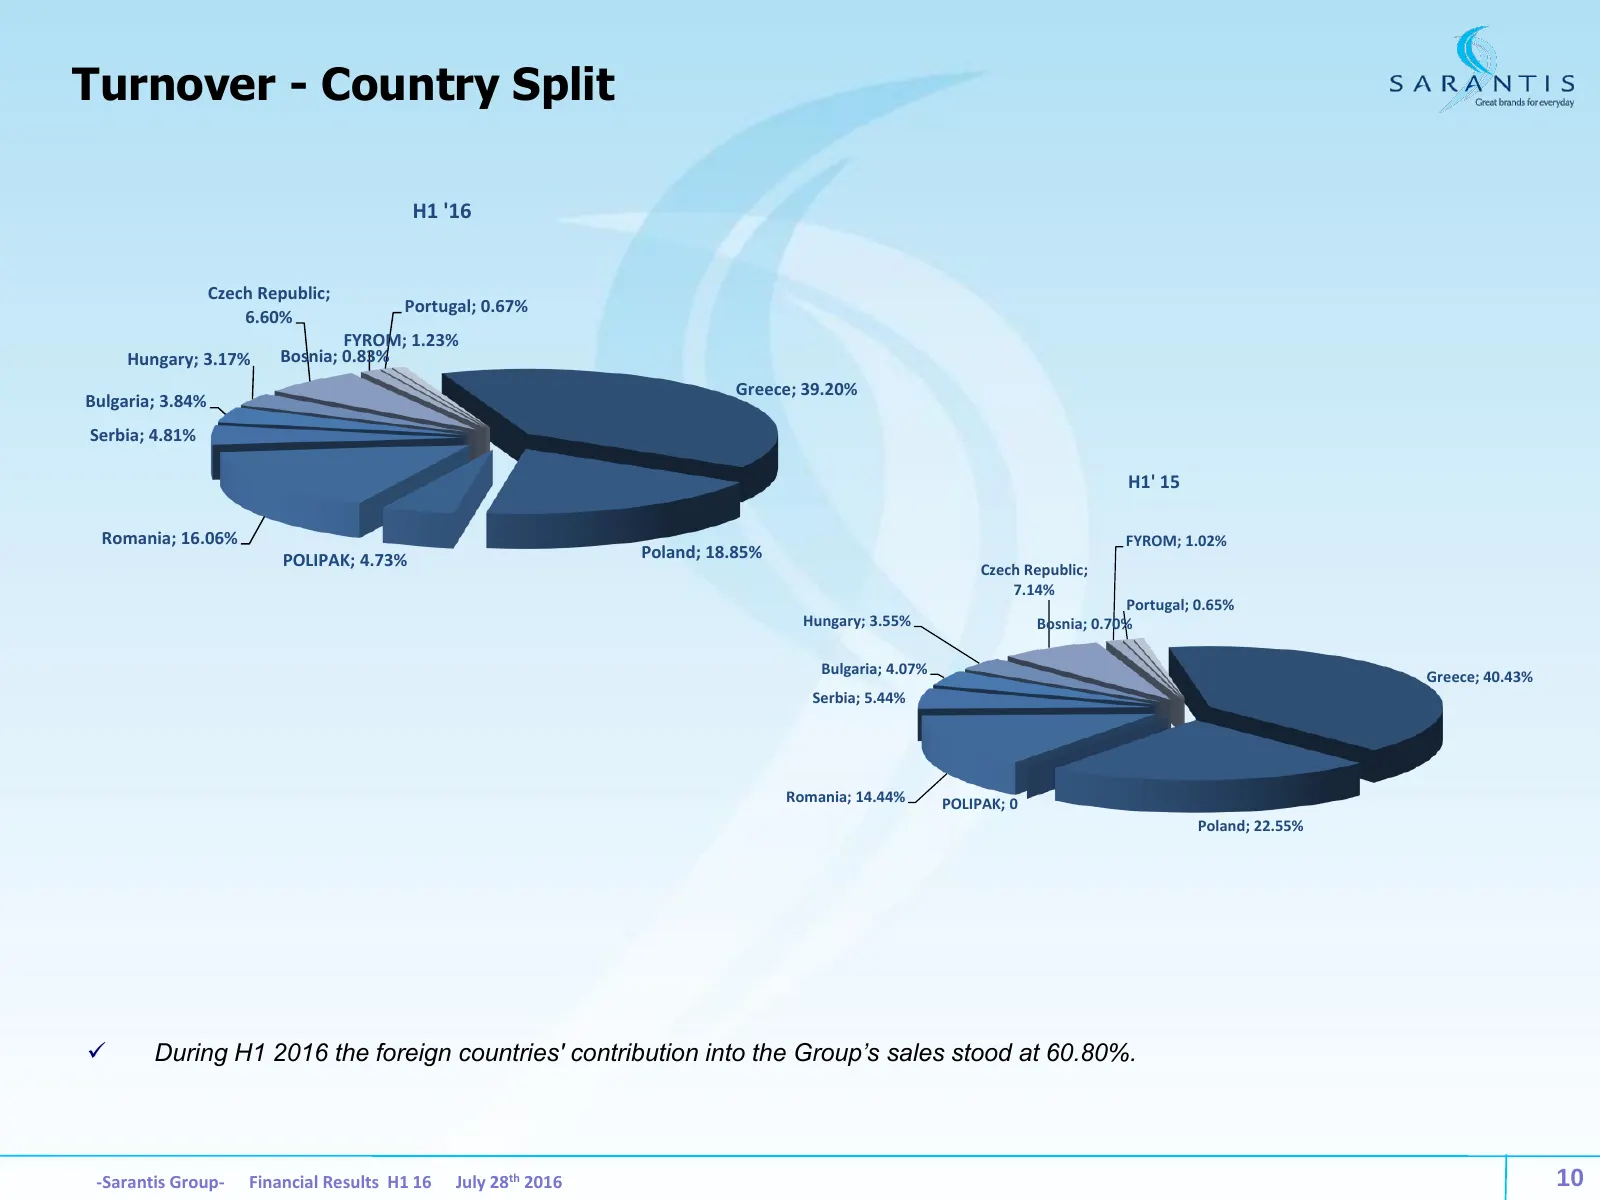
Turnover - Country Split H1 '16 Czech Republic; Portugal; 0.67% 6.60% FYROM; 1.23% Hungary; 3.17% Bosnia; 0.83% Greece; 39.20% Bulgaria; 3.84% Serbia; 4.81% H1' 15 Romania; 16.06% FYROM; 1.02% POLIPAK; 4.73% Poland; 18.85% Czech Republic; 7.14% Portugal; 0.65% Hungary; 3.55% Bosnia; 0.70% Bulgaria;
Slide 11: Turnover
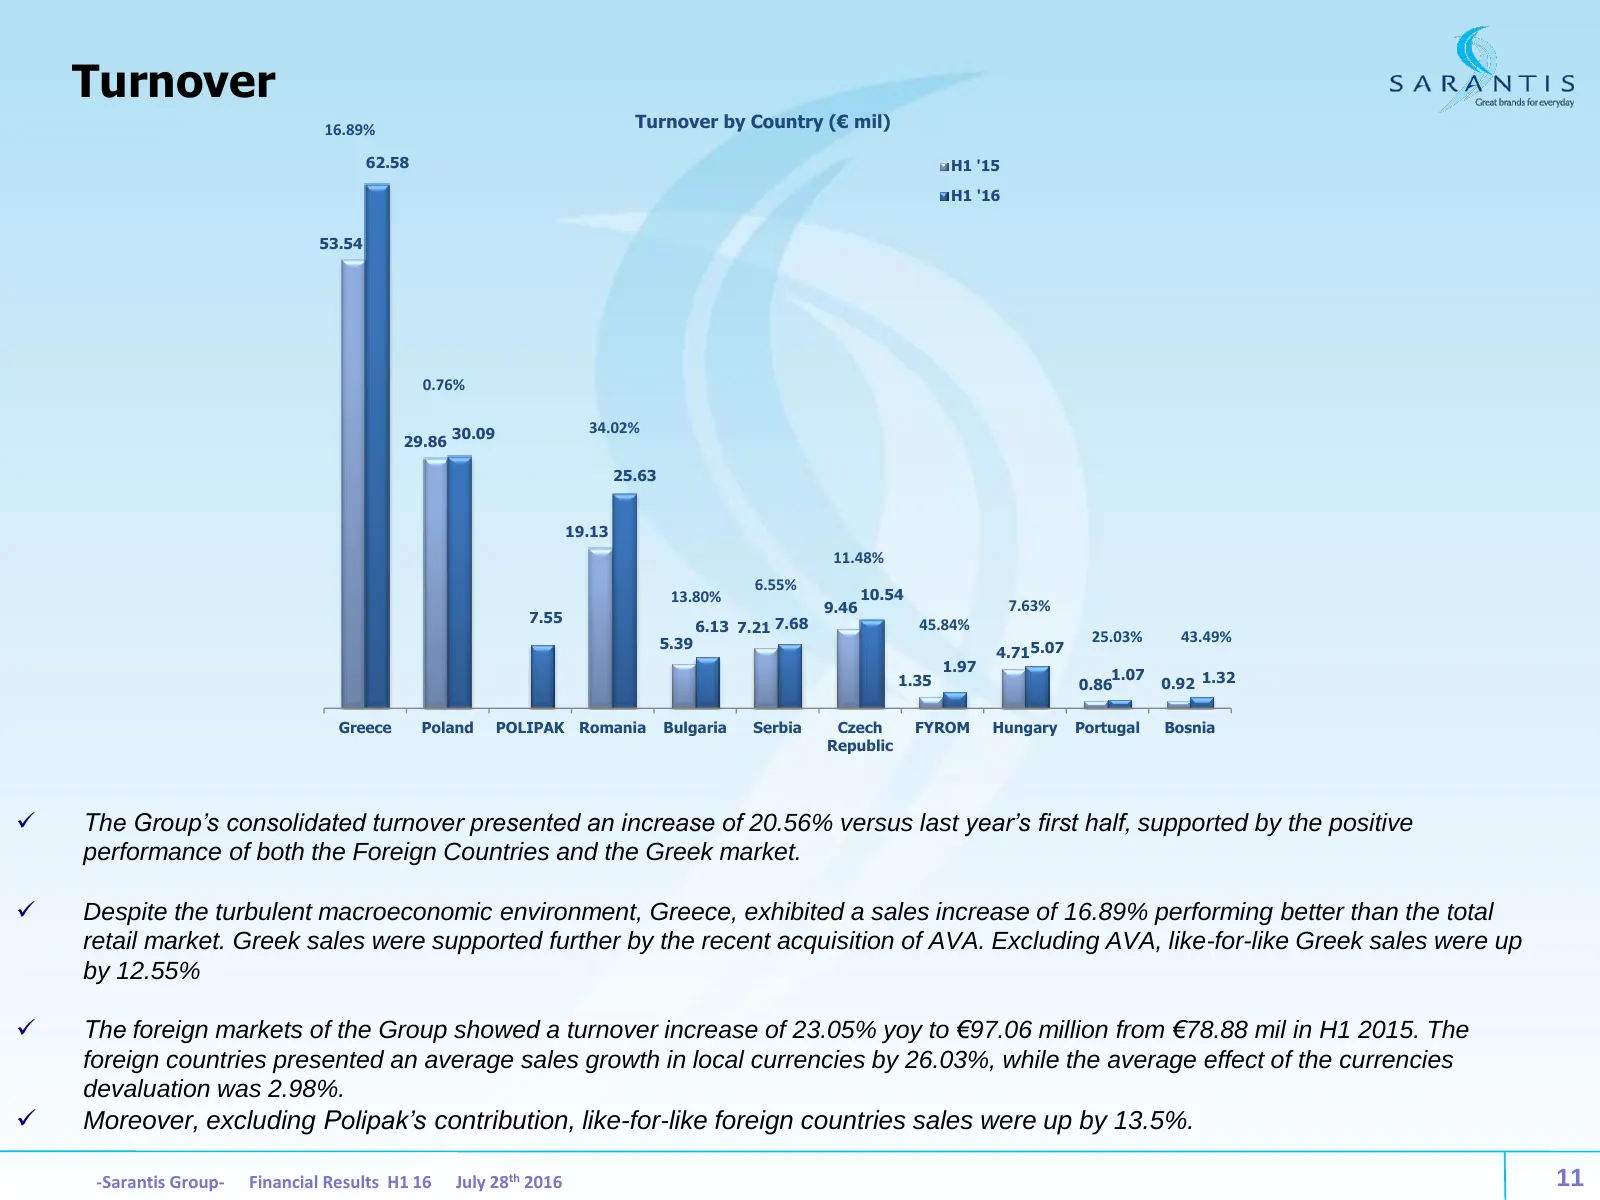
Turnover 16.89% Turnover by Country (€ mil) 62.58 H1 '15 H1 '16 53.54 0.76% 30.09 34.02% 29.86 25.63 19.13 11.48% 6.55% 13.80% 10.54 9.46 7.63% 7.55 6.13 7.21 7.68 45.84% 5.39 25.03% 43.49% 4.715.07 1.97 1.07 1.35 0.86 0.92 1.32 Greece Poland POLIPAK Romania Bulgaria Serbia Czech FYROM Hungary Portu
Slide 12: Greece vs Eastern Europe – Turnover
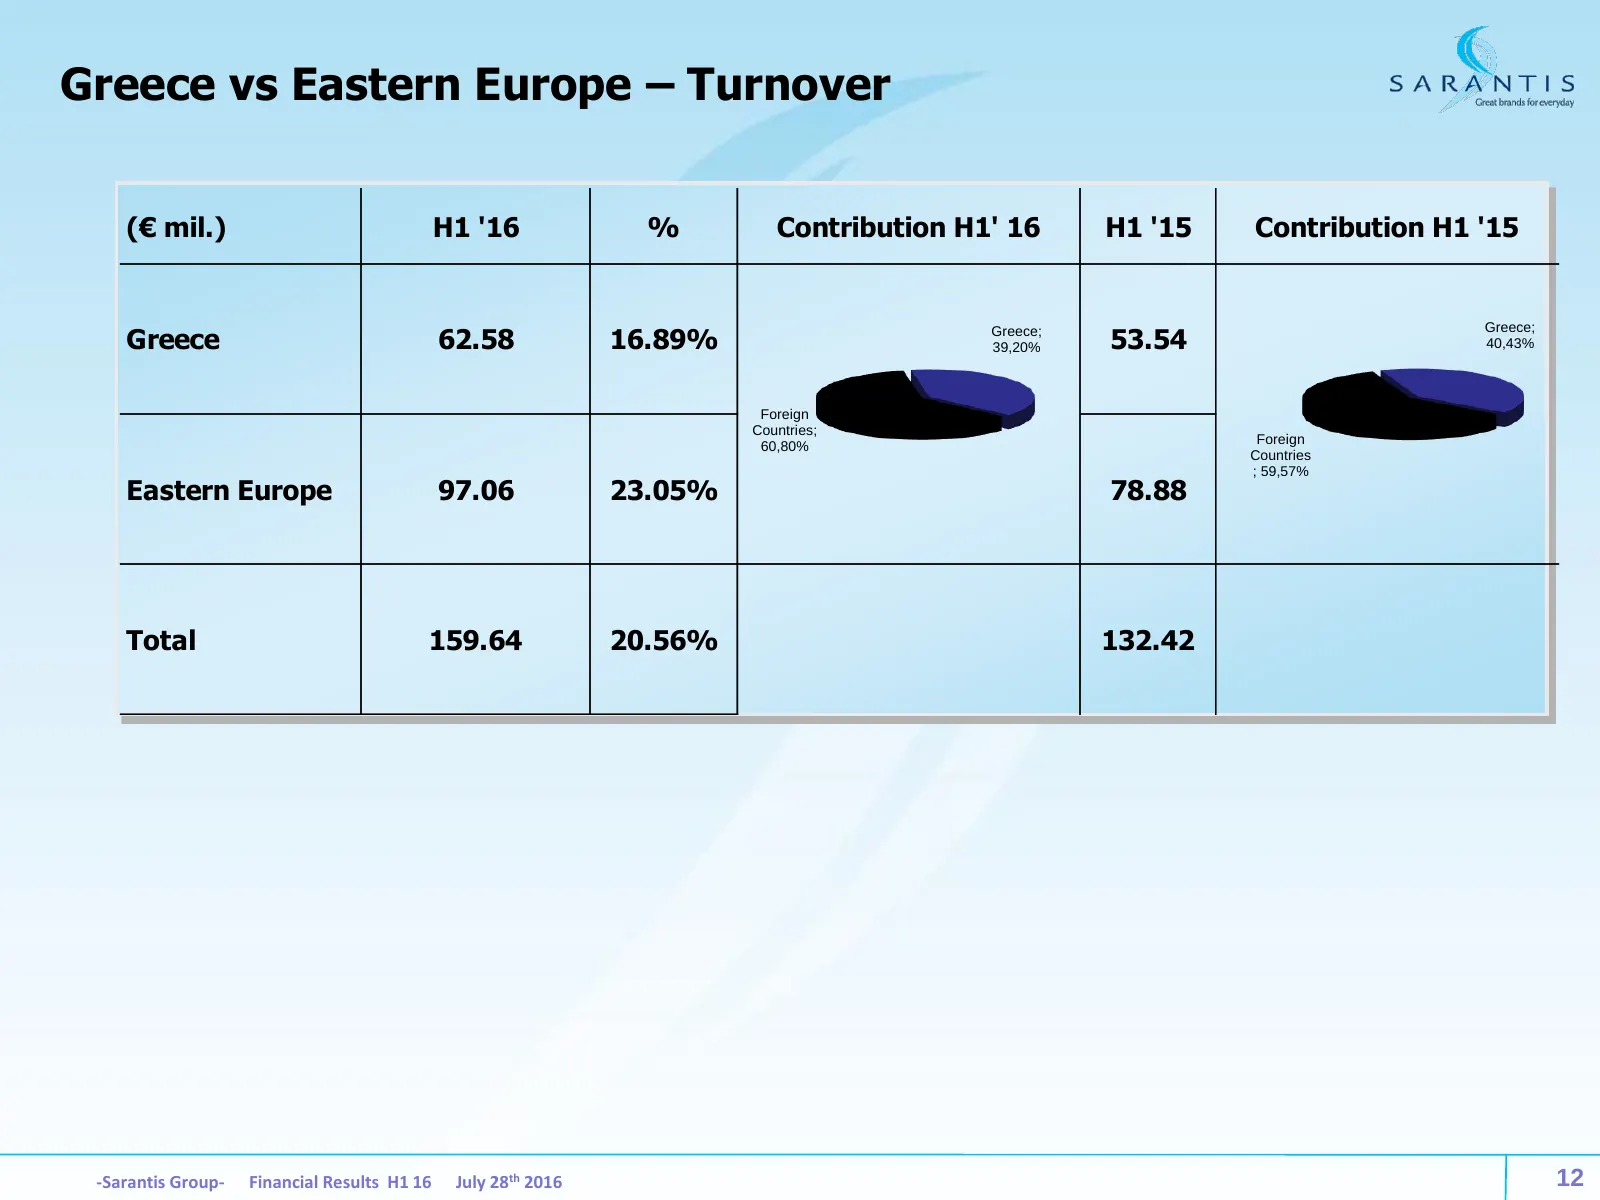
Greece vs Eastern Europe – Turnover (€ mil.) H1 '16 % Contribution H1' 16 H1 '15 Contribution H1 '15 Greece; Greece 62.58 16.89% 53.54 Greece; 39,20% 40,43% Foreign Countries; Foreign 60,80% Countries ; 59,57% Eastern Europe 97.06 23.05% 78.88 Total 159.64 20.56% 132.42 -Sarantis Group- Financial Re
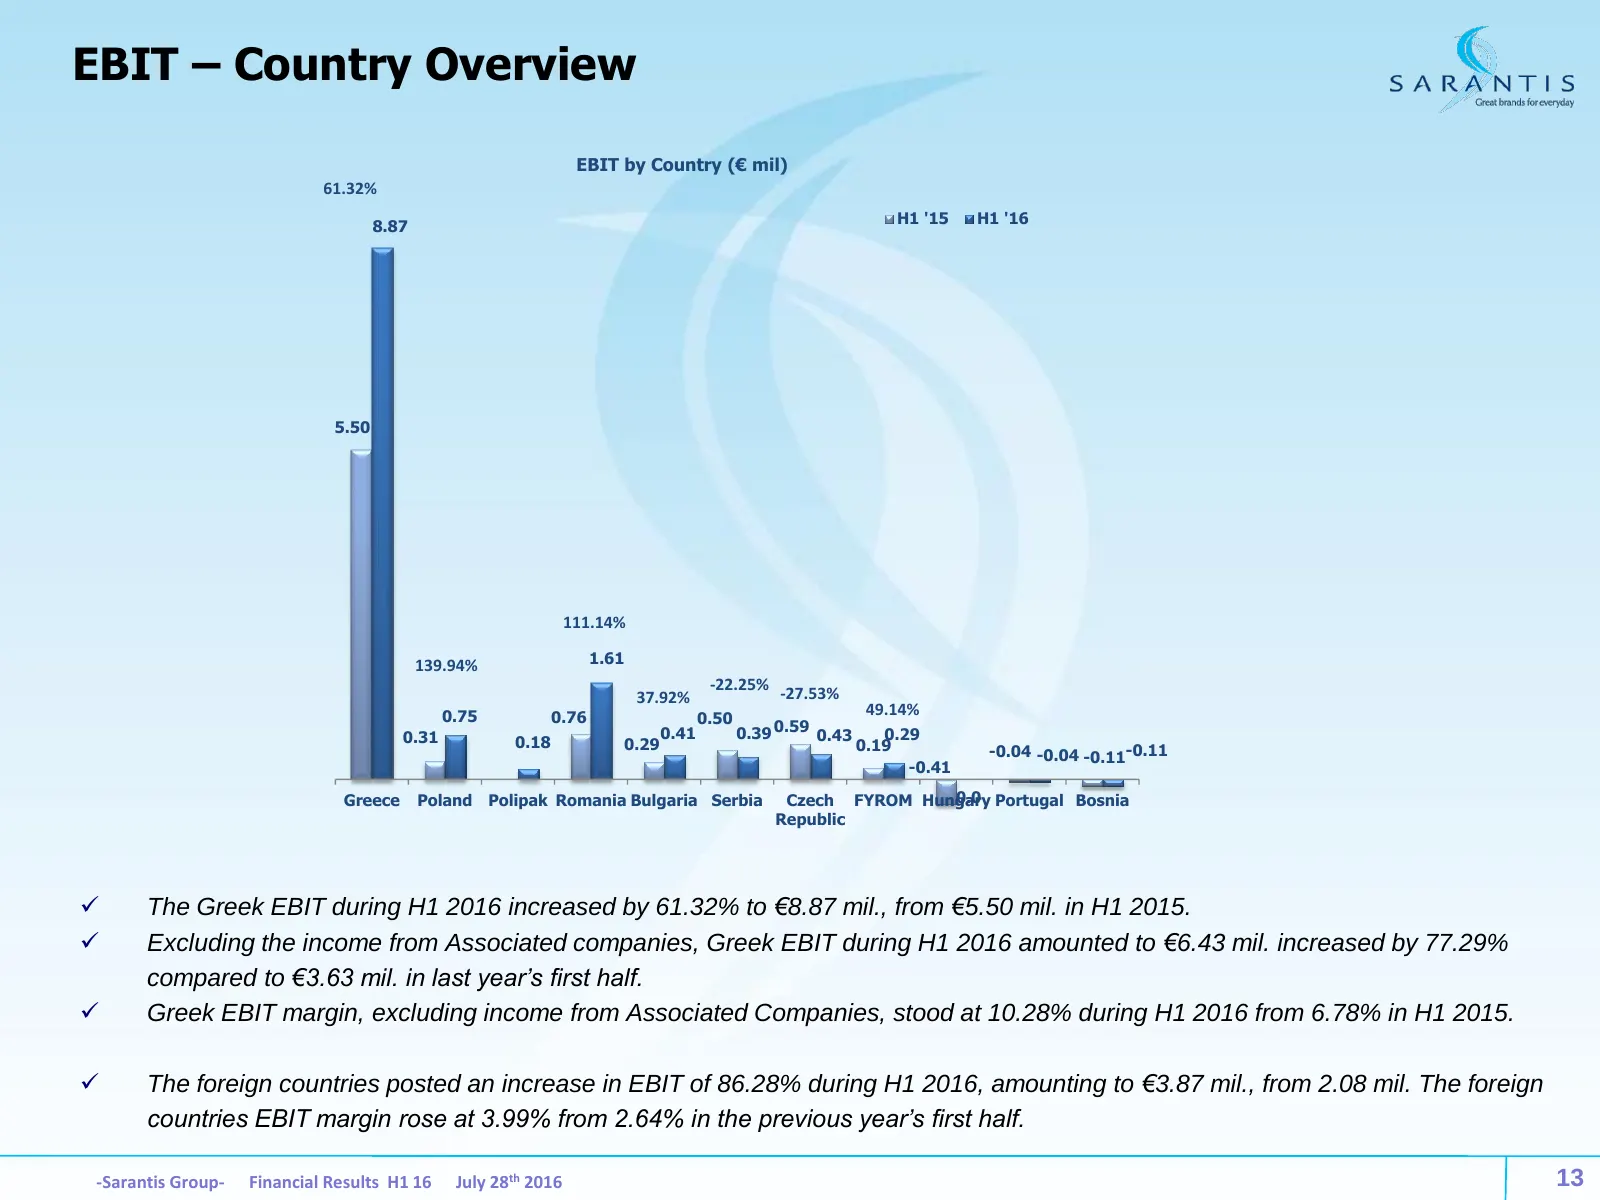
Slide 13: EBIT – Country Overview
EBIT – Country Overview EBIT by Country (€ mil) 61.32% 8.87 H1 '15 H1 '16 5.50 111.14% 139.94% 1.61 -22.25% -27.53% 37.92% 0.75 0.76 0.50 49.14% 0.31 0.41 0.39 0.59 0.43 0.29 0.18 0.29 0.19 -0.04 -0.04 -0.11-0.11 -0.41 Greece Poland Polipak Romania Bulgaria Serbia 0.0 Portugal Bosnia Czech FYROM Hun
Slide 14: Our Investor Relation Web Page
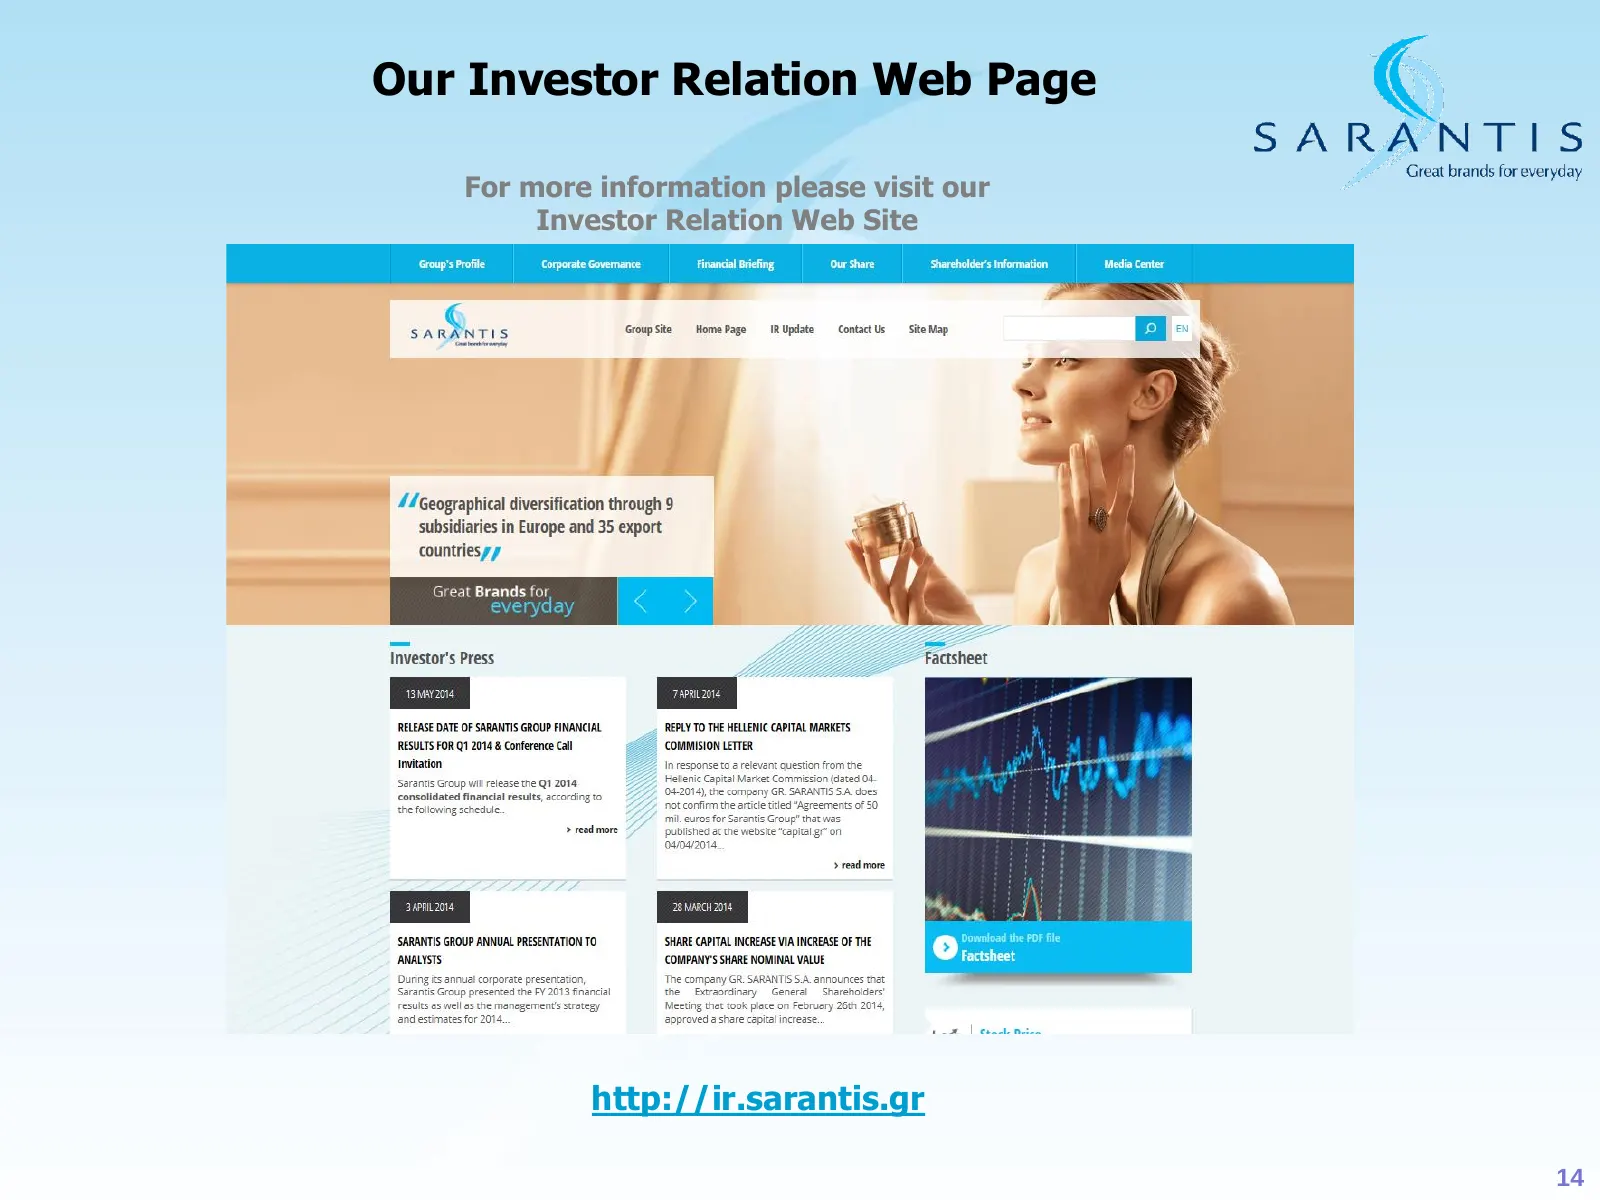
Our Investor Relation Web Page For more information please visit our Investor Relation Web Site http://ir.sarantis.gr 14
Source: company website
More decks from GR. Sarantis S.A.
 H1 2026 Earnings Presentation21 slides · Sep 9, 2026
 Investor Presentation (May 2026)36 slides · May 2026
 Investor Presentation (April 2026)36 slides · April 2026
 FY2025 Earnings Presentation21 slides · Mar 12, 2026
 Investor Presentation (January 2026)33 slides · January 2026
 Investor Presentation (December 2025)33 slides · December 2025