GR. Sarantis S.A. · ATHEX:SAR
GR. Sarantis — Sarantis Group — Investor Presentation (December 2025)
33 slides from GR. Sarantis's investor presentation, December 2025
Slide 1: Sarantis Group Investors Presentation December 2025
Sarantis Group Investors Presentation December 2025
Slide 2: Forward-looking statement
Forward-looking statement This document contains certain “forward-looking” statements. These statements may generally, but not always, be identified by the use of words such as “outlook”, “forecast”, “objective”, “expect”, “plan”, “intend”, “anticipate”, “believe”, “target”, “will”, “aim” and other
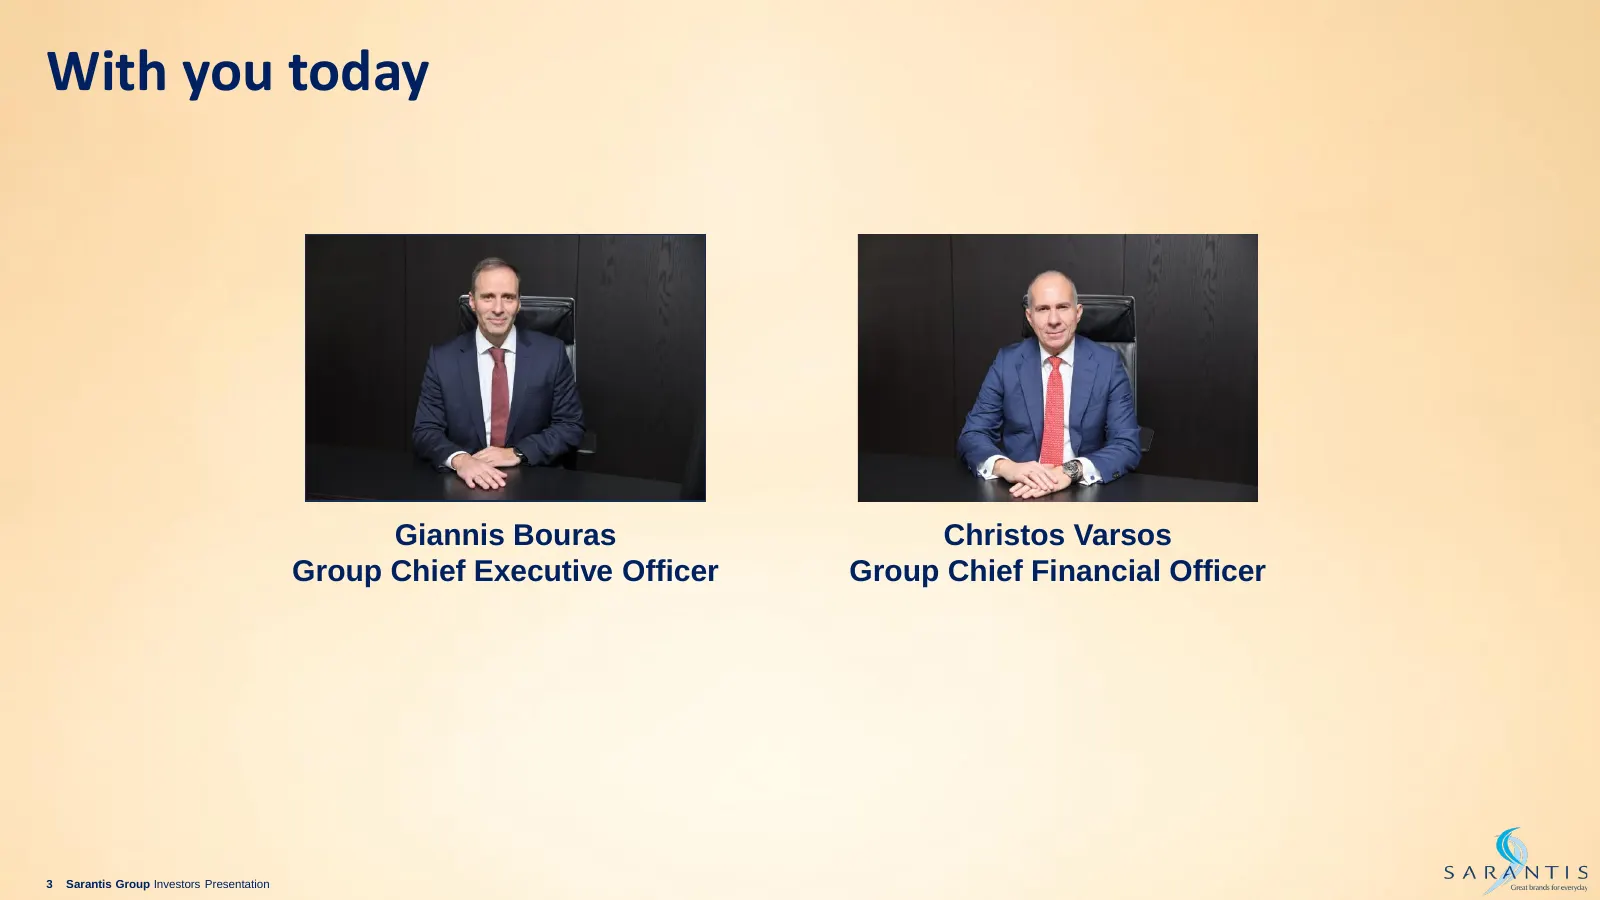
Slide 3: With you today
With you today Giannis Bouras Christos Varsos Group Chief Executive Officer Group Chief Financial Officer 3 Sarantis Group Investors Presentation
Slide 4: Strategic Overview
Strategic Overview Giannis Bouras, Group Chief Executive Officer
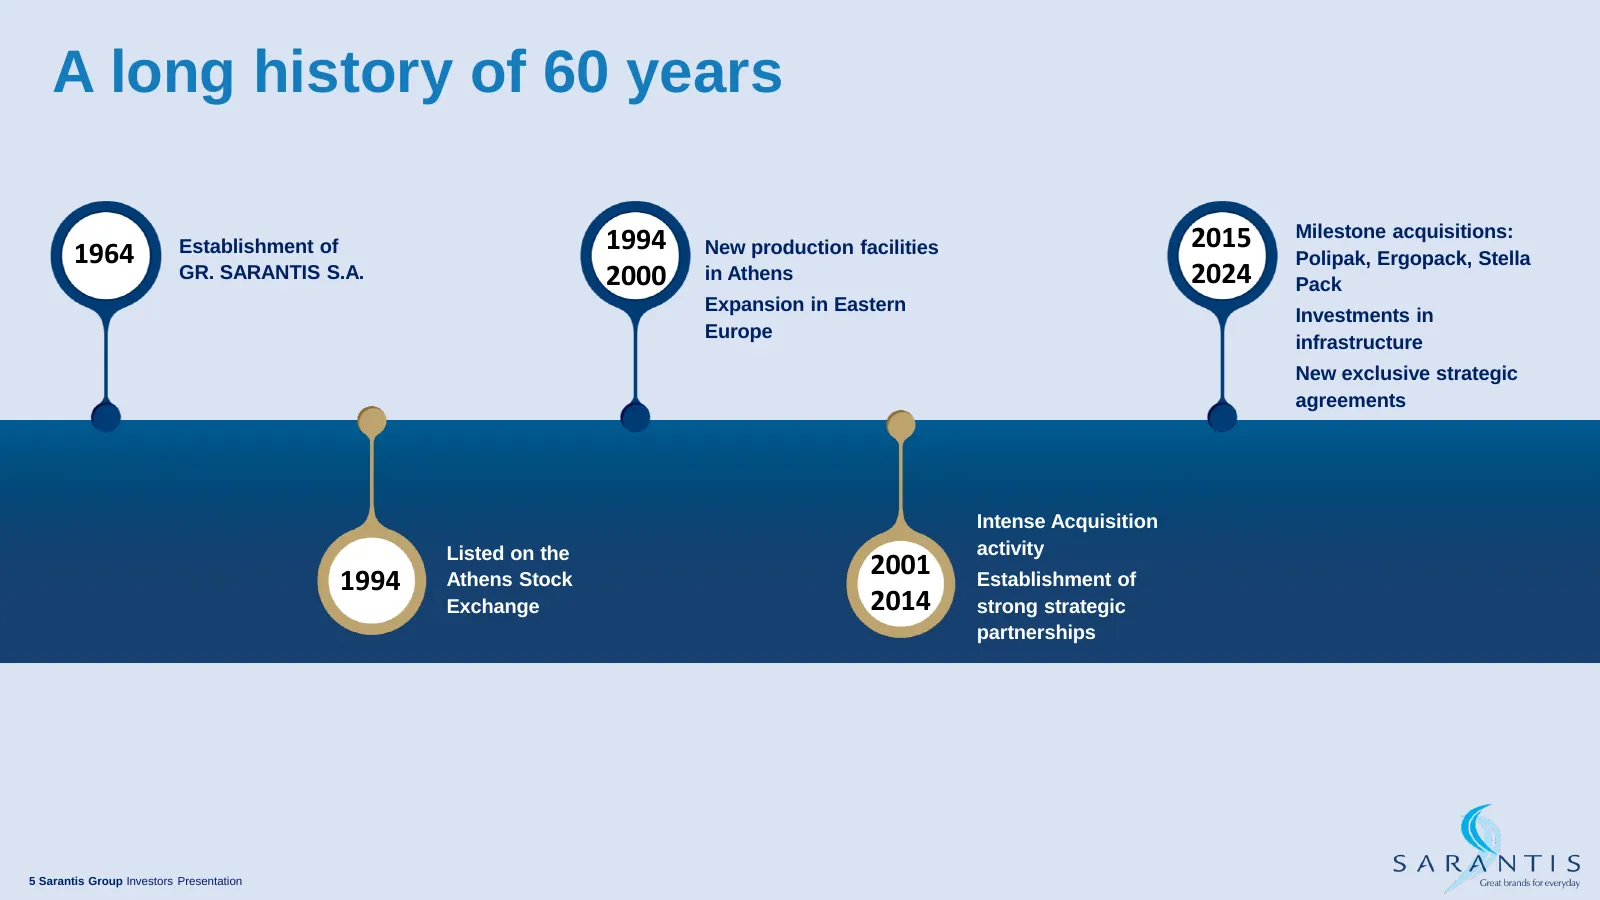
Slide 5: A long history of 60 years
A long history of 60 years 2015 Milestone acquisitions: 1964 Establishment of 1994 New production facilities Polipak, Ergopack, Stella GR. SARANTIS S.A. 2000 in Athens 2024 Pack Expansion in Eastern Investments in Europe infrastructure New exclusive strategic agreements Intense Acquisition Listed on
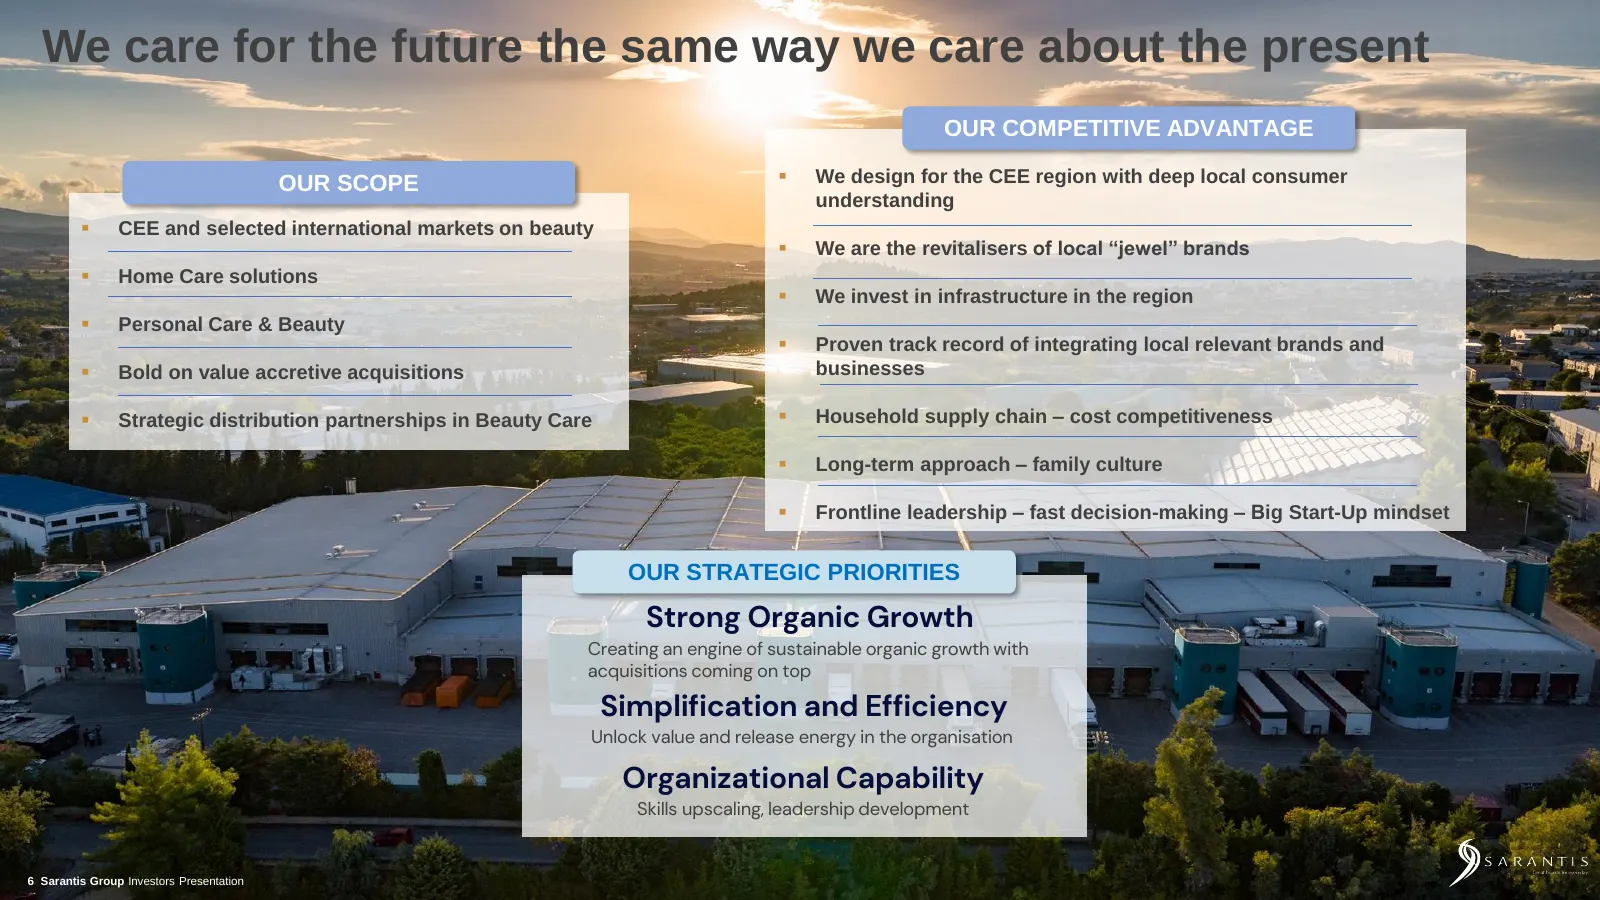
Slide 6: We care for the future the same way we care about the present
We care for the future the same way we care about the present OUR COMPETITIVE ADVANTAGE OUR SCOPE ▪ We design for the CEE region with deep local consumer understanding ▪ CEE and selected international markets on beauty ▪ We are the revitalisers of local “jewel” brands ▪ Home Care solutions ▪ We inve
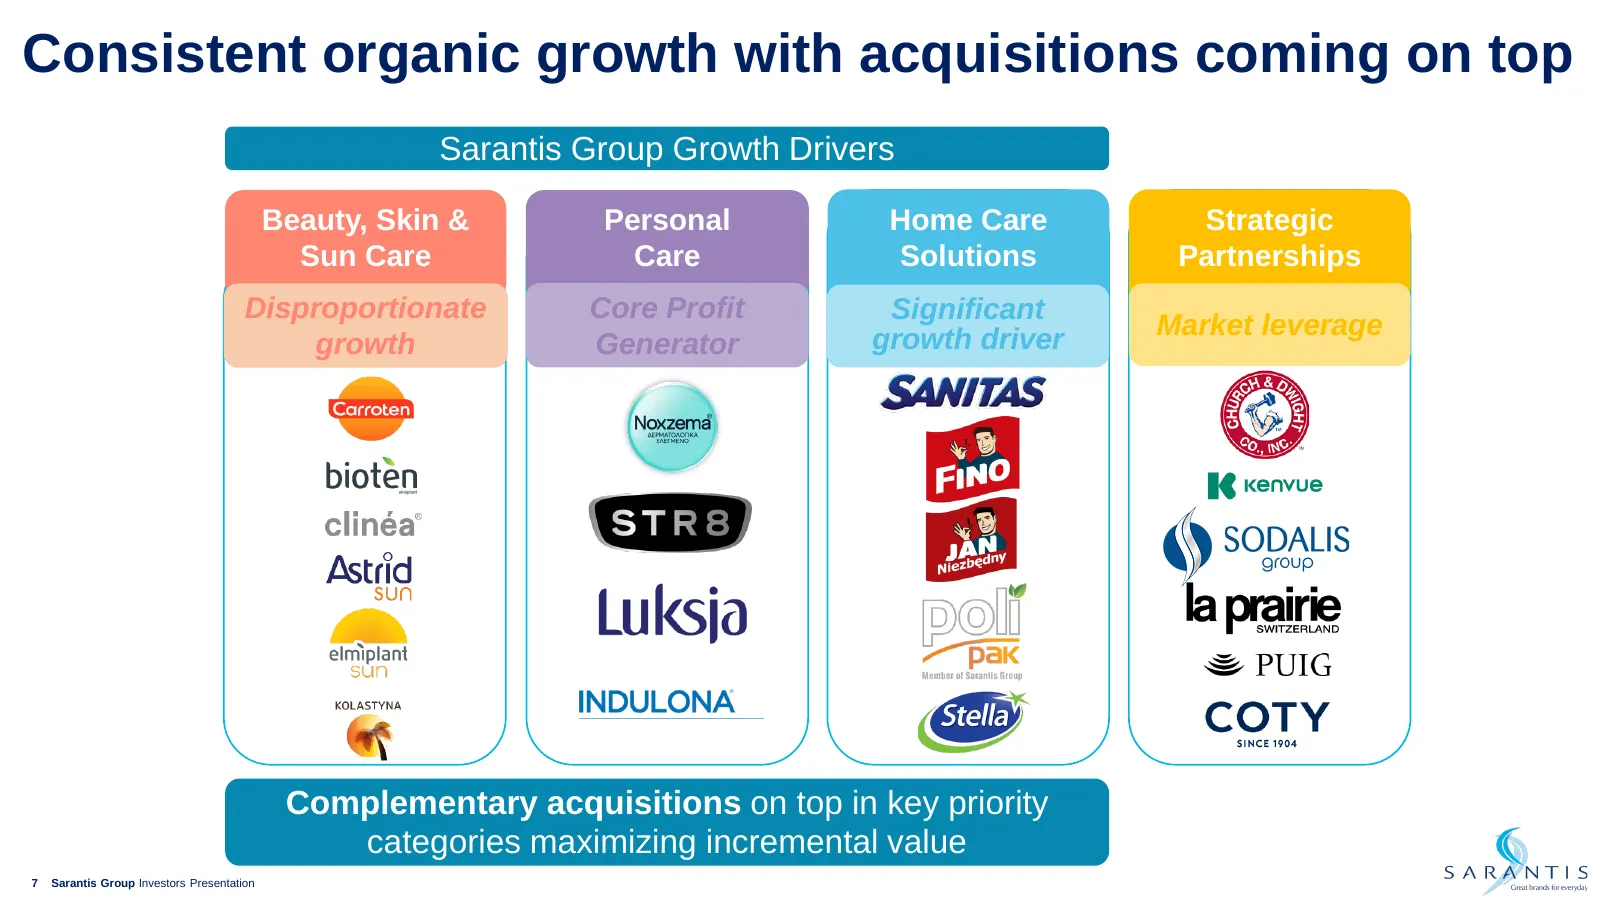
Slide 7: Consistent organic growth with acquisitions coming on top
Consistent organic growth with acquisitions coming on top Sarantis Group Growth Drivers Beauty, Skin & Personal Home Care Strategic Sun Care Care Solutions Partnerships Disproportionate Core Profit Significant growth driver Market leverage growth Generator Complementary acquisitions on top in key pr
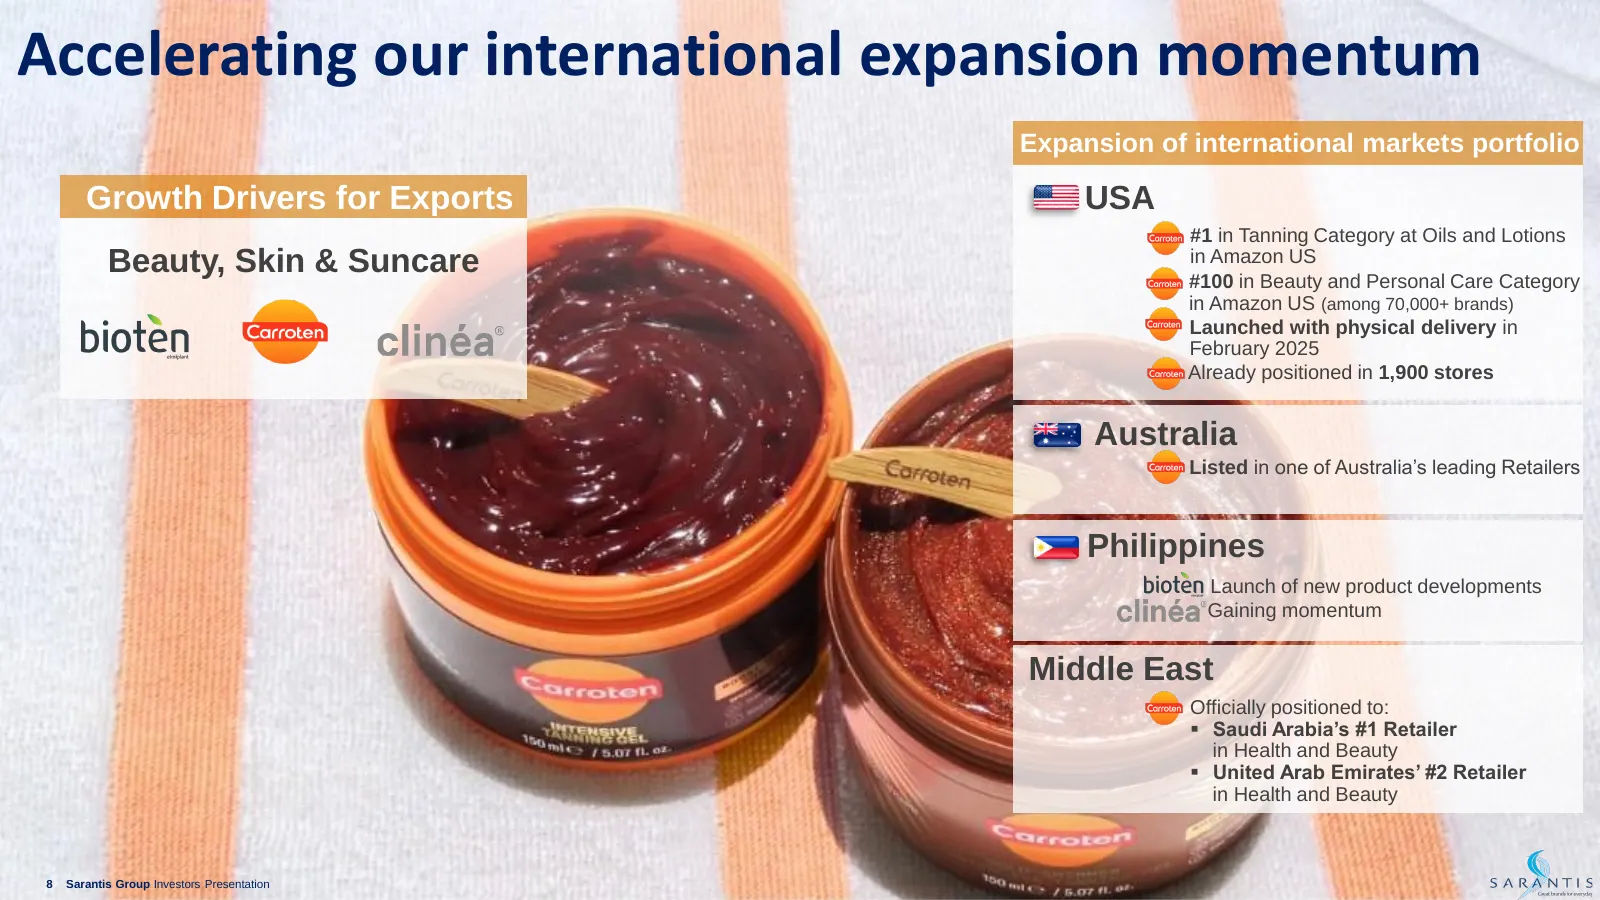
Slide 8: Accelerating our international expansion momentum
Accelerating our international expansion momentum Expansion of international markets portfolio Growth Drivers for Exports USA #1 in Tanning Category at Oils and Lotions Beauty, Skin & Suncare in Amazon US #100 in Beauty and Personal Care Category in Amazon US (among 70,000+ brands) Launched with phy
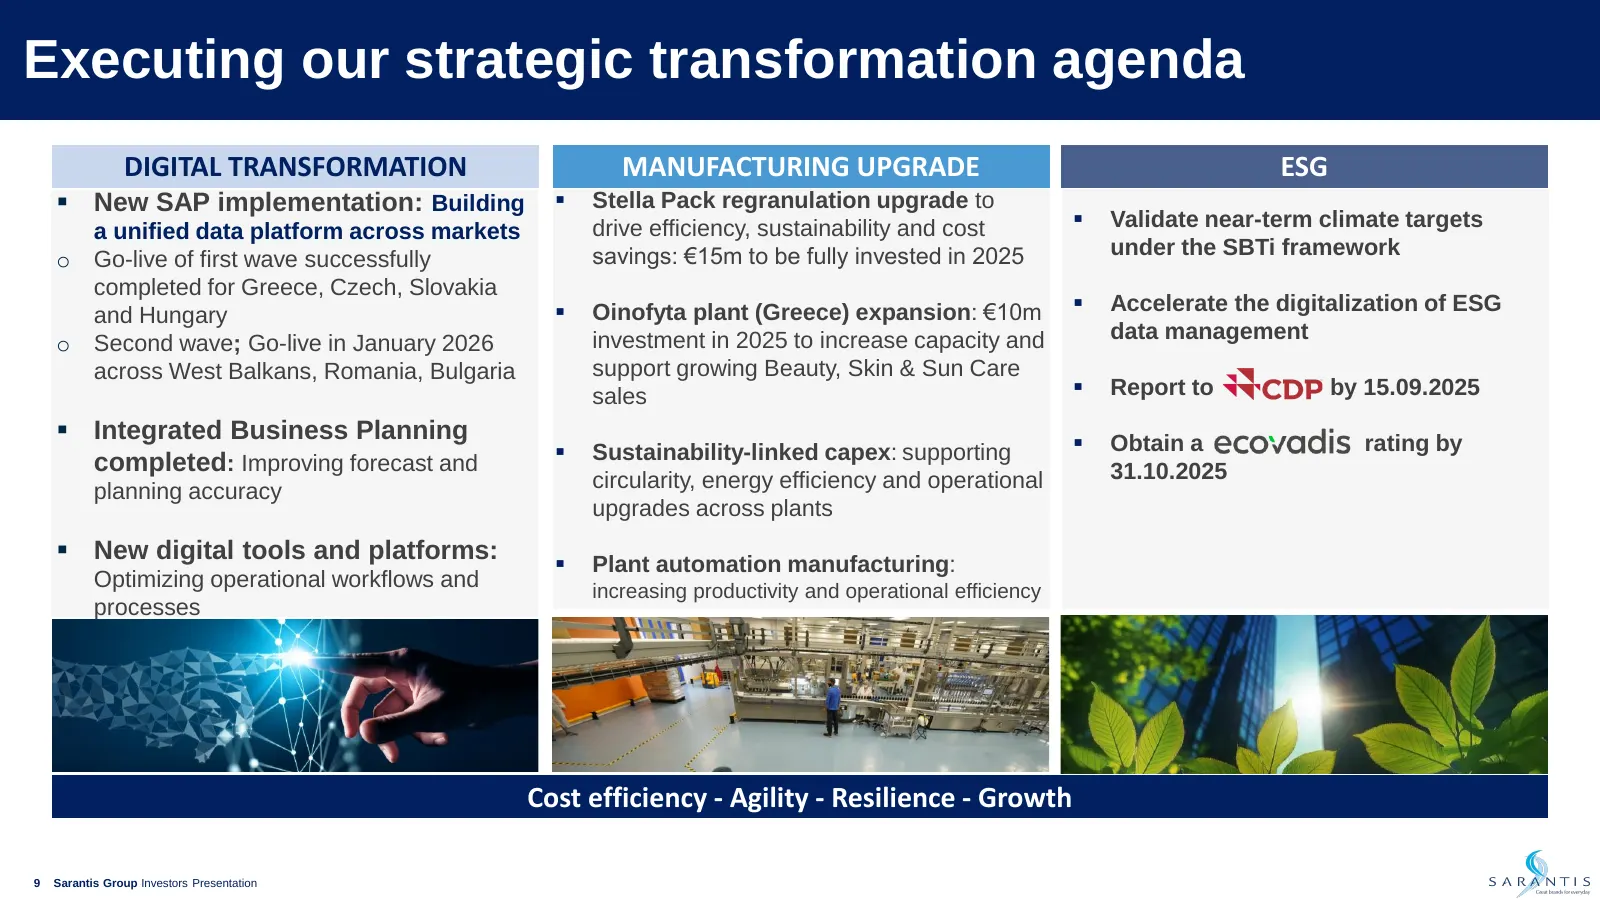
Slide 9: Executing our strategic transformation agenda
Executing our strategic transformation agenda DIGITAL TRANSFORMATION MANUFACTURING UPGRADE ESG ▪ New SAP implementation: Building ▪ Stella Pack regranulation upgrade to drive efficiency, sustainability and cost ▪ Validate near-term climate targets a unified data platform across markets savings: €15m
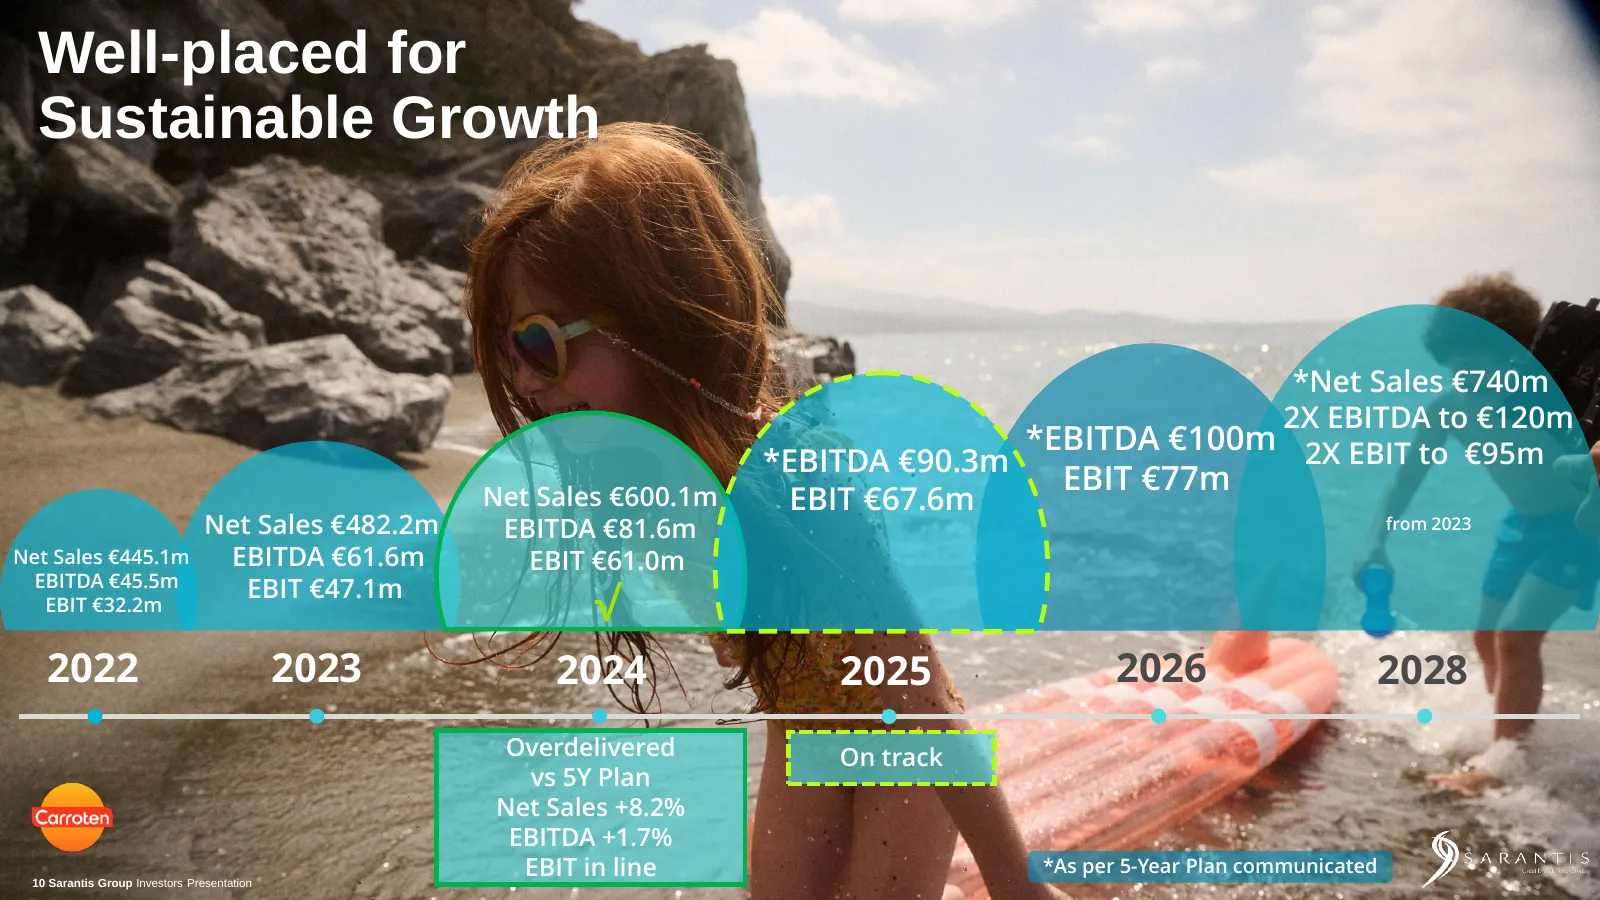
Slide 10: Well-placed for Sustainable Growth
Well-placed for 10 Sustainable Growth *Net Sales €740m 2X EBITDA to €120m *EBITDA €100m 2X EBIT to €95m *EBITDA €90.3m EBIT €77m Net Sales €600.1m EBIT €67.6m Net Sales €482.2m EBITDA €81.6m from 2023 Net Sales €445.1m EBITDA €61.6m EBIT €61.0m EBITDA €45.5m EBIT €47.1m EBIT €32.2m √ 2022 2023 2024
Slide 11: Financial Performance
Financial Performance Christos Varsos, Group Chief Financial Officer
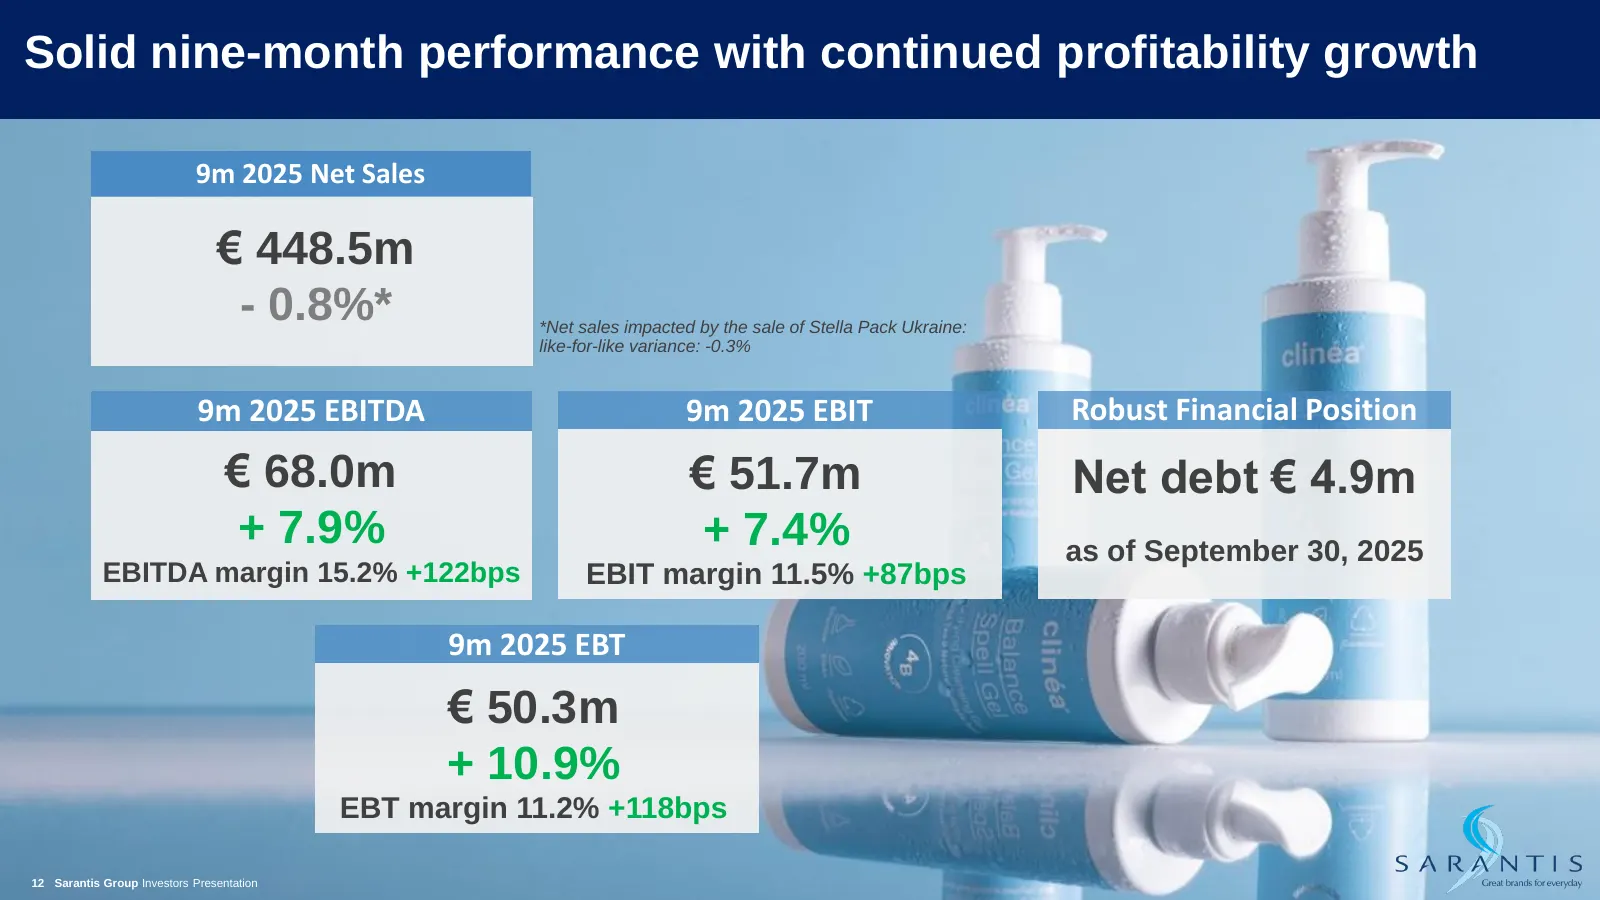
Slide 12: Solid nine-month performance with continued profitability growth
Solid nine-month performance with continued profitability growth 9m 2025 Net Sales € 448.5m - 0.8%* *Net sales impacted by the sale of Stella Pack Ukraine: like-for-like variance: -0.3% 9m 2025 EBITDA 9m 2025 EBIT Robust Financial Position € 68.0m € 51.7m Net debt € 4.9m + 7.9% + 7.4% as of Septembe
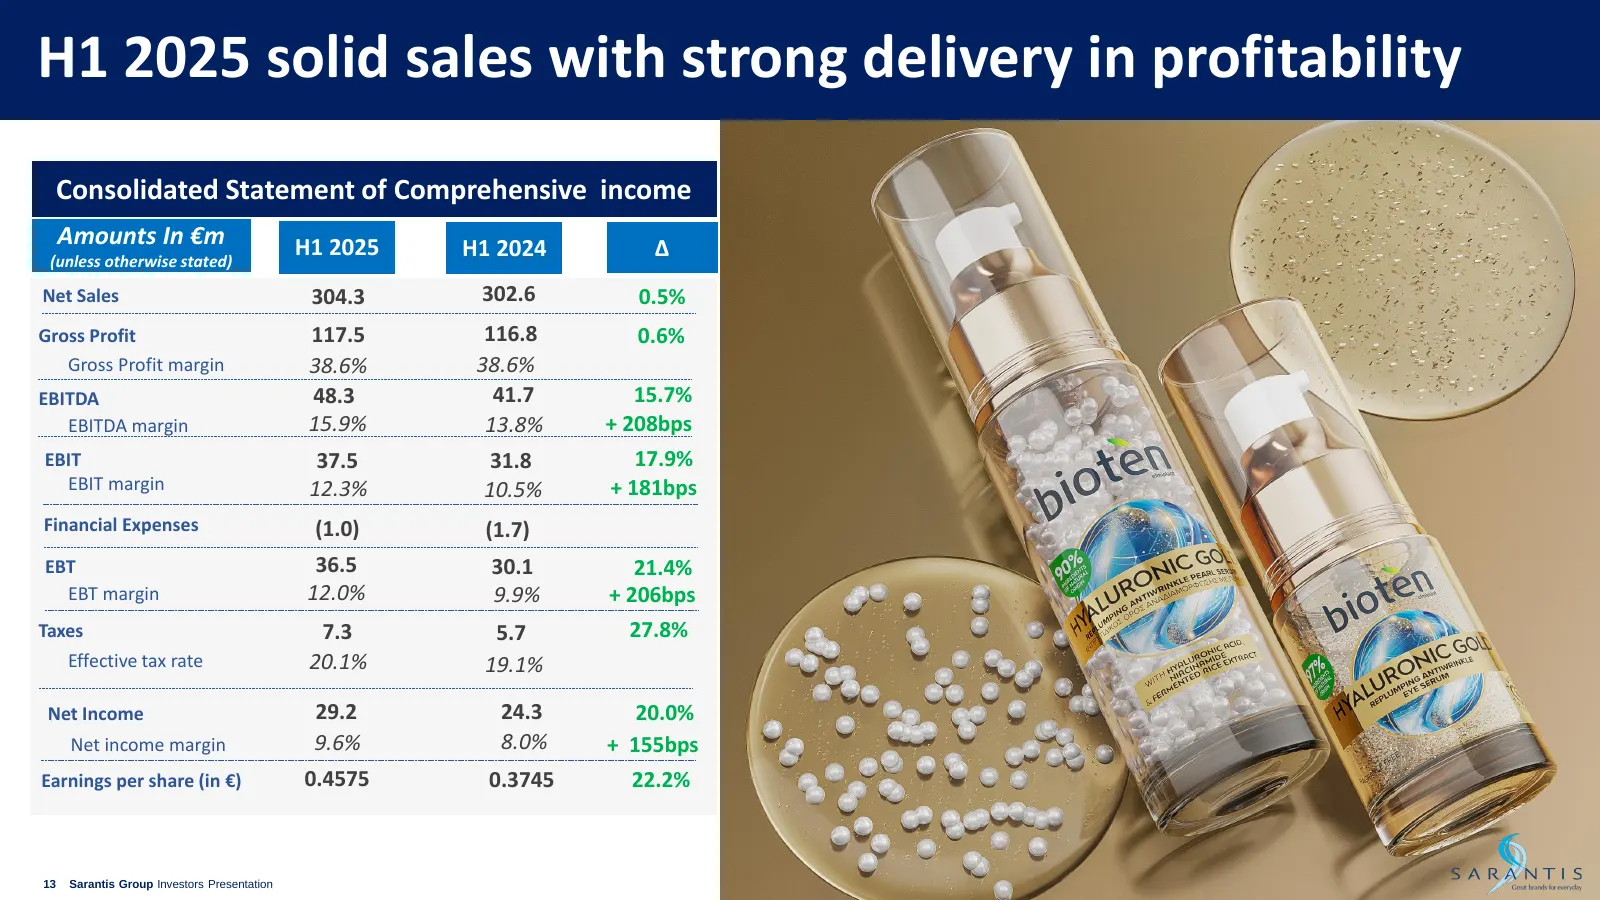
Slide 13: H1 2025 solid sales with strong delivery in profitability
H1 2025 solid sales with strong delivery in profitability Consolidated Statement of Comprehensive income Amounts In €m H1 2025 H1 2024 Δ (unless otherwise stated) Net Sales 304.3 302.6 0.5% Gross Profit 117.5 116.8 0.6% Gross Profit margin 38.6% 38.6% EBITDA 48.3 41.7 15.7% EBITDA margin 15.9% 13.8%
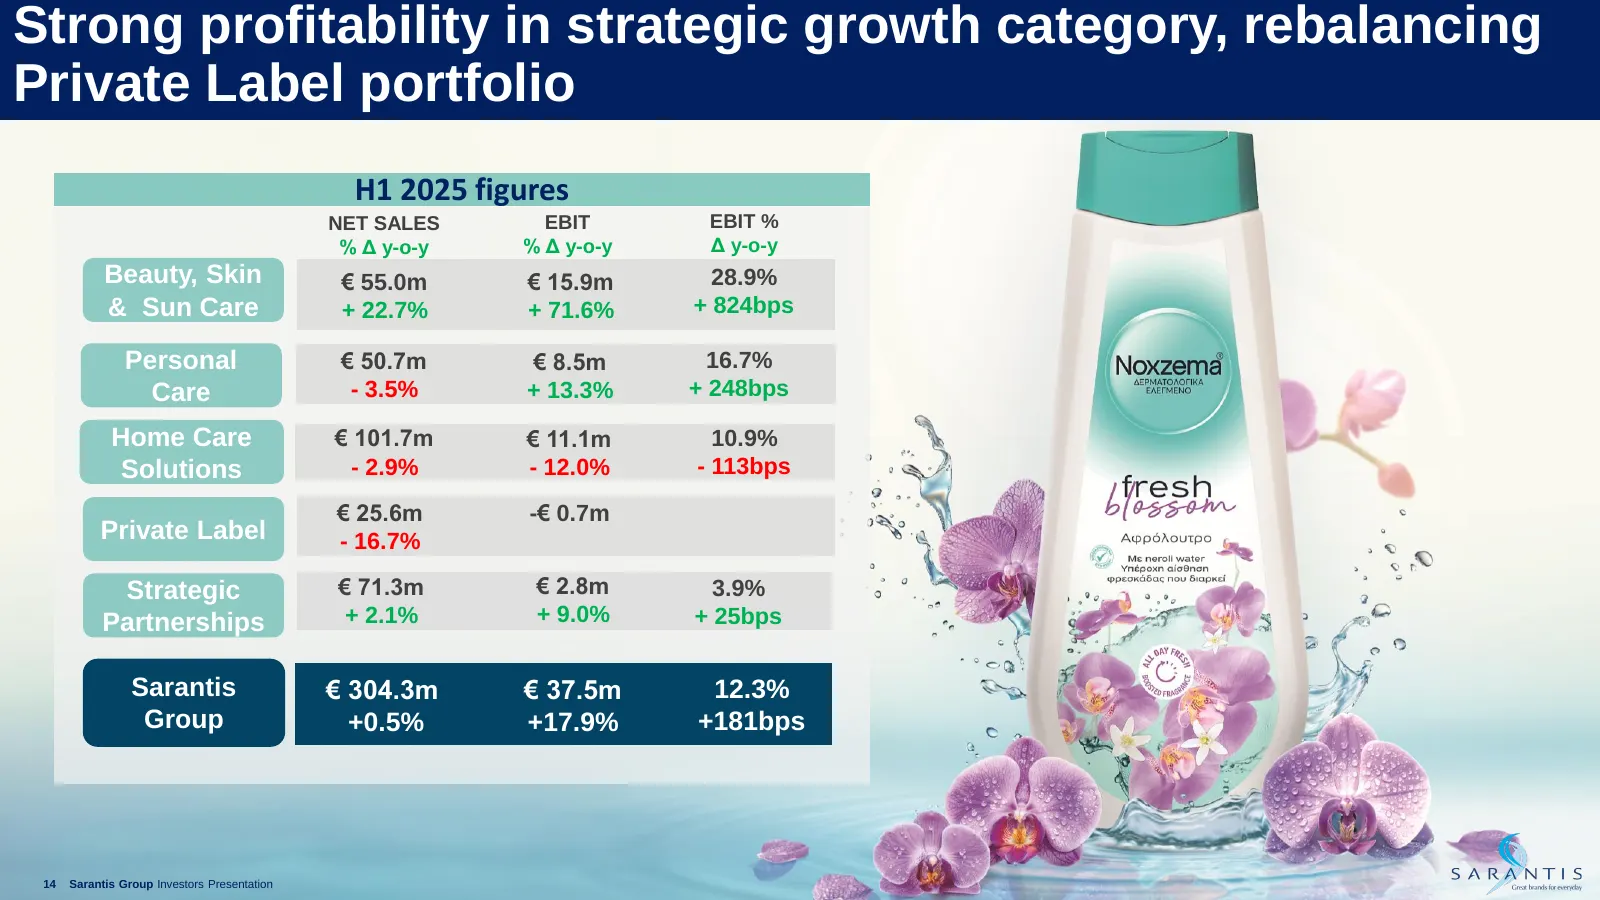
Slide 14: Strong profitability in strategic growth category, rebalancing Private Label portfolio
Strong profitability in strategic growth category, rebalancing Private Label portfolio H1 2025 figures NET SALES EBIT EBIT % % Δ y-o-y % Δ y-o-y Δ y-o-y Beauty, Skin € 55.0m € 15.9m 28.9% & Sun Care + 22.7% + 71.6% + 824bps Personal € 50.7m € 8.5m 16.7% Care - 3.5% + 13.3% + 248bps Home Care € 101.7
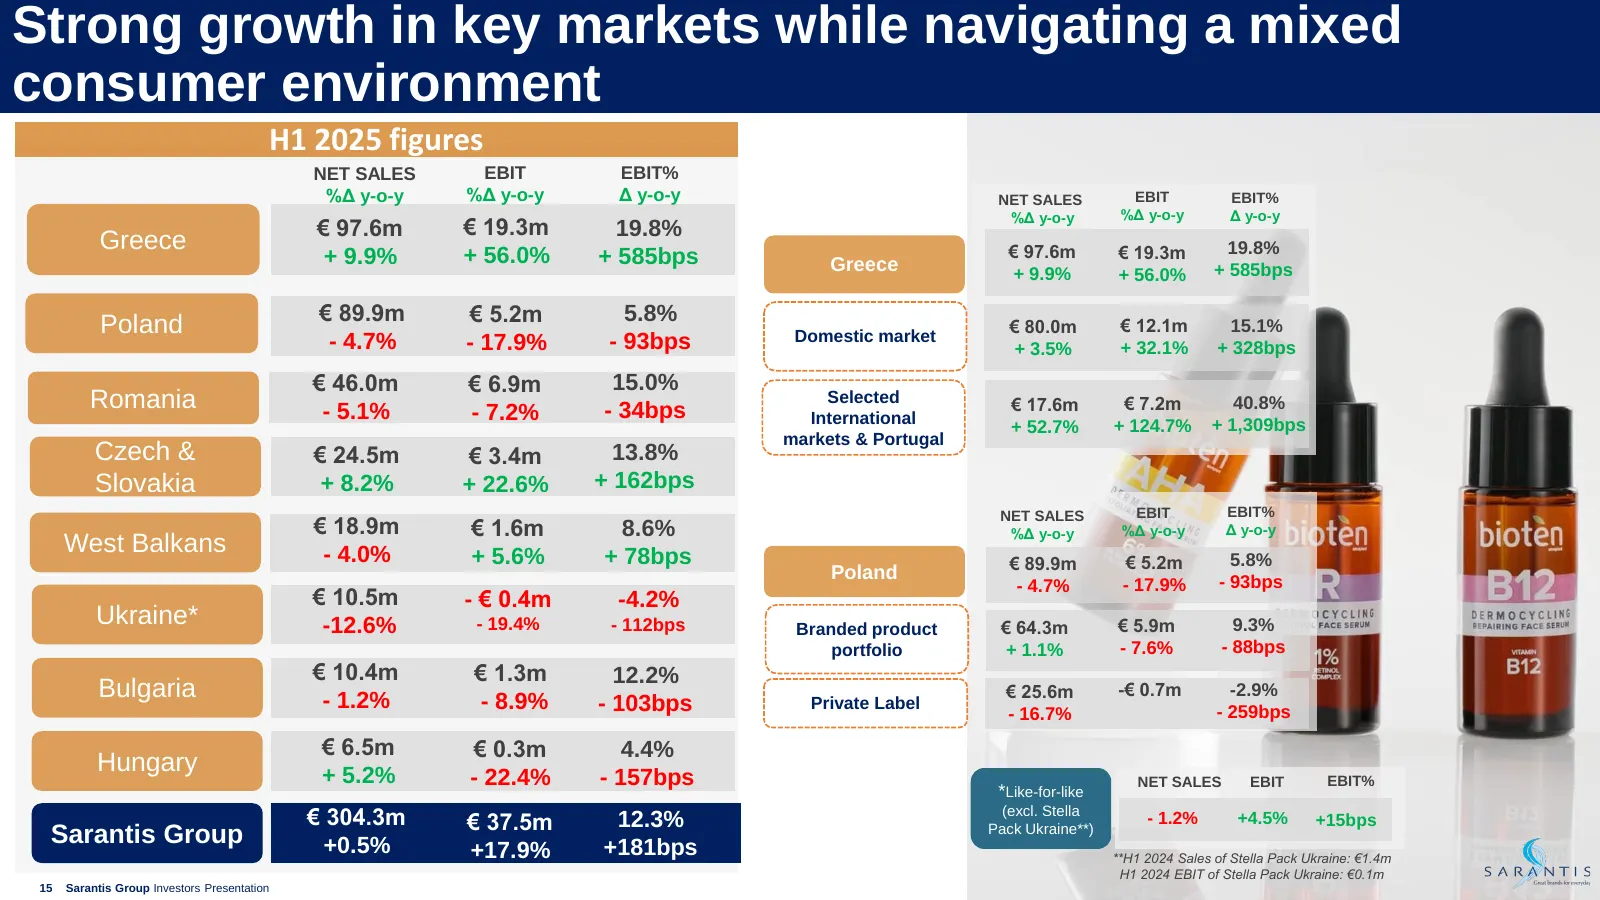
Slide 15: Strong growth in key markets while navigating a mixed consumer environment
Strong growth in key markets while navigating a mixed consumer environment H1 2025 figures NET SALES EBIT EBIT% %Δ y-o-y %Δ y-o-y Δ y-o-y NET SALES EBIT EBIT% %Δ y-o-y %Δ y-o-y Δ y-o-y € 97.6m € 19.3m 19.8% Greece € 97.6m € 19.3m 19.8% + 9.9% + 56.0% + 585bps Greece + 9.9% + 56.0% + 585bps € 89.9m €
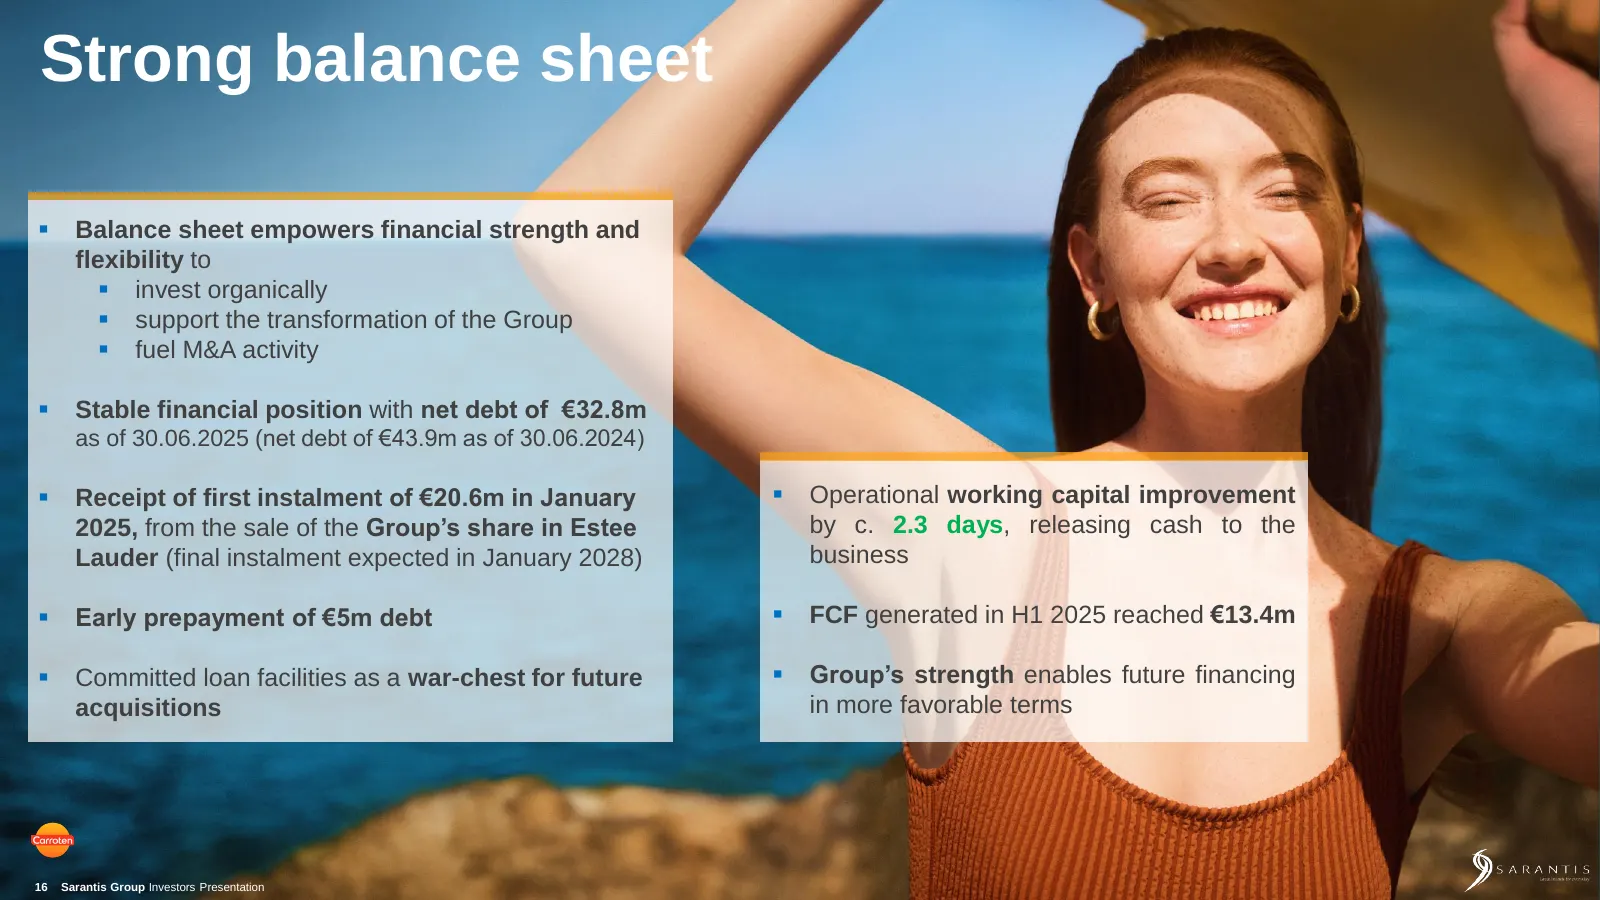
Slide 16: Strong balance sheet
Strong balance sheet ▪ Balance sheet empowers financial strength and flexibility to ▪ invest organically ▪ support the transformation of the Group ▪ fuel M&A activity ▪ Stable financial position with net debt of €32.8m as of 30.06.2025 (net debt of €43.9m as of 30.06.2024) ▪ Receipt of first instalm
Slide 17: Enhancing shareholders value
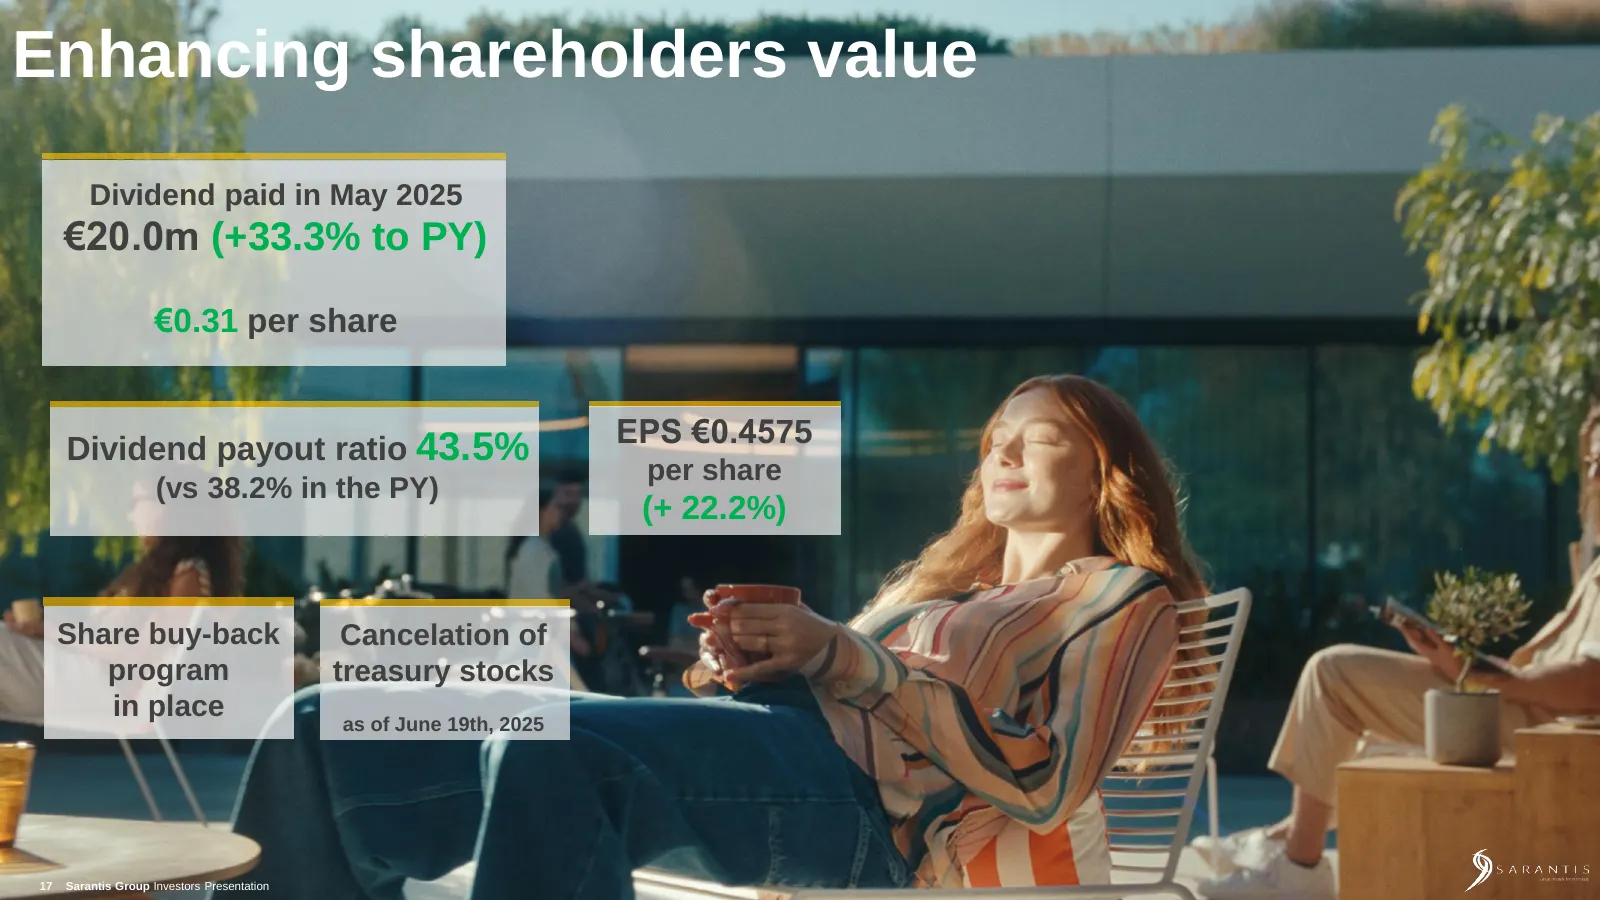
Enhancing shareholders value Dividend paid in May 2025 €20.0m (+33.3% to PY) €0.31 per share EPS €0.4575 Dividend payout ratio 43.5% per share (vs 38.2% in the PY) (+ 22.2%) Share buy-back Cancelation of program treasury stocks in place as of June 19th, 2025 17 Sarantis Group Investors Presentation
Slide 18: CAPEX Execution Plan with increased investment from 2025
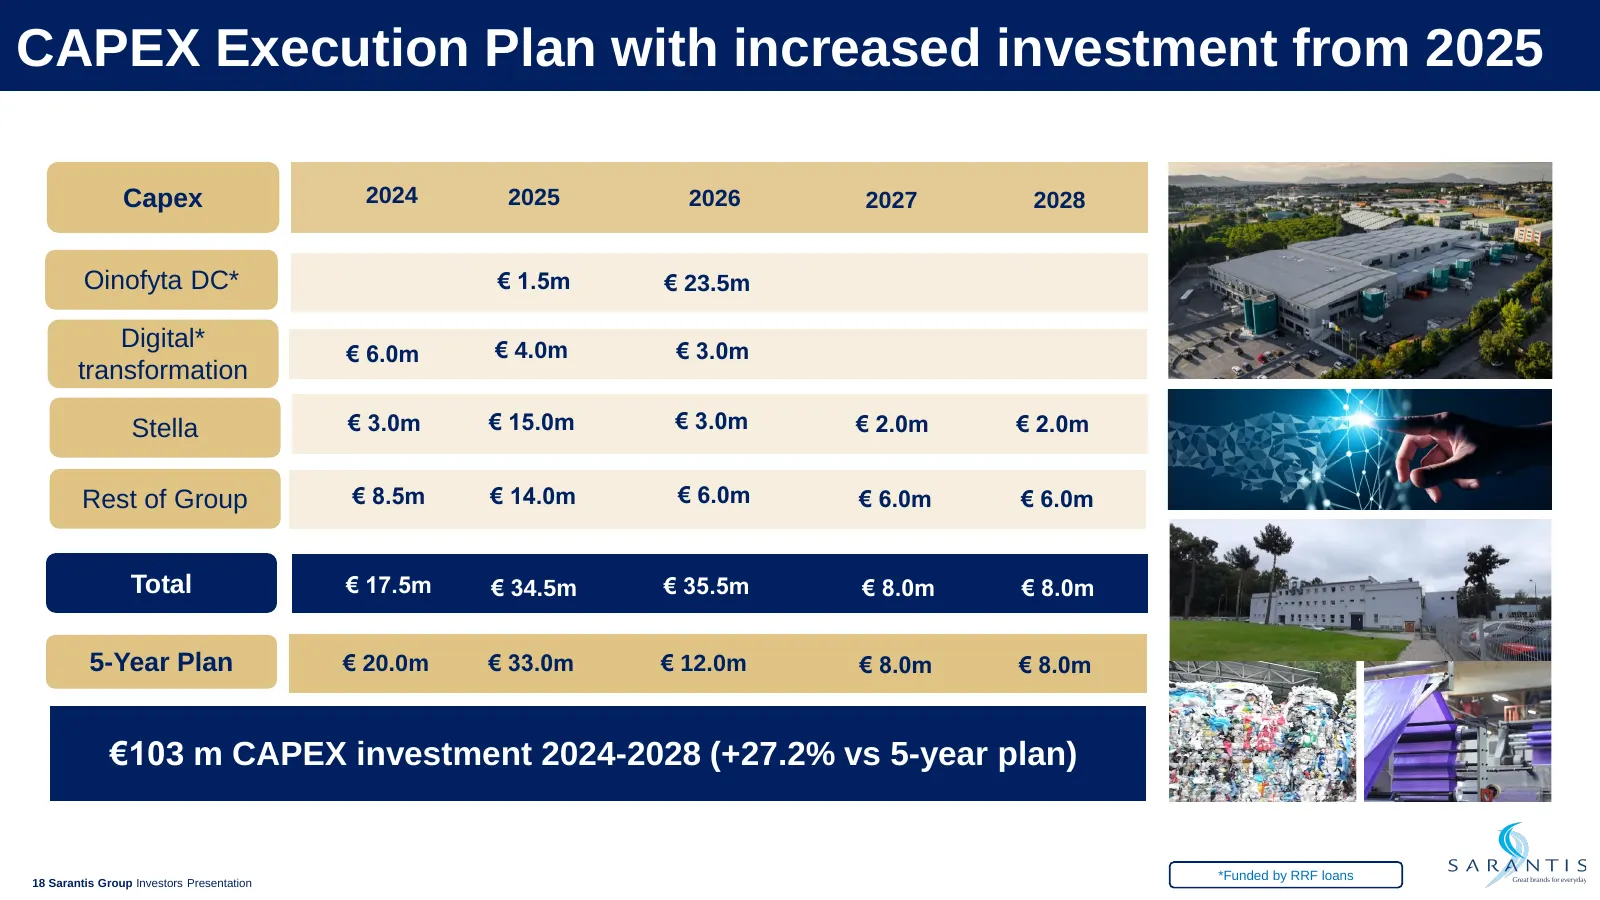
CAPEX Execution Plan with increased investment from 2025 Capex 2024 2025 2026 2027 2028 Oinofyta DC* € 1.5m € 23.5m Digital* € 4.0m € 3.0m € 6.0m transformation Stella € 3.0m € 15.0m € 3.0m € 2.0m € 2.0m Rest of Group € 8.5m € 14.0m € 6.0m € 6.0m € 6.0m Total € 17.5m € 34.5m € 35.5m € 8.0m € 8.0m 5-
Slide 19: 2025 outlook update
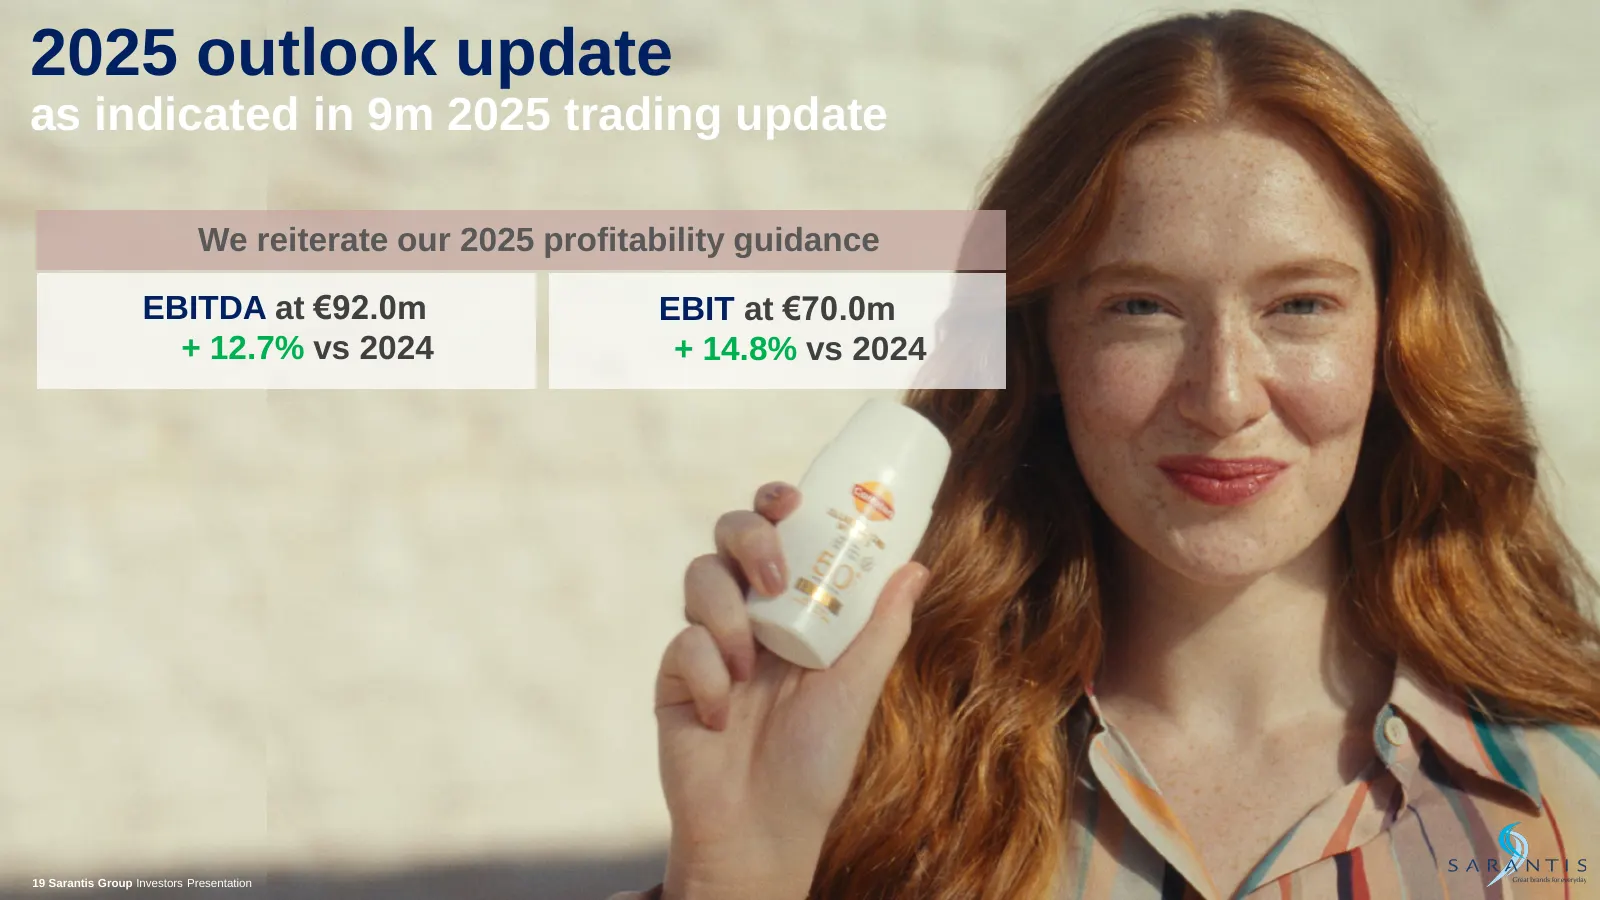
2025 outlook update as indicated in 9m 2025 trading update We reiterate our 2025 profitability guidance EBITDA at €92.0m EBIT at €70.0m + 12.7% vs 2024 + 14.8% vs 2024 19 Sarantis Group Investors Presentation
Slide 20: Delivering Strong Shareholder Value
Delivering Strong Shareholder Value 5-Year Plan* *as communicated during the Investor Day in March 2024
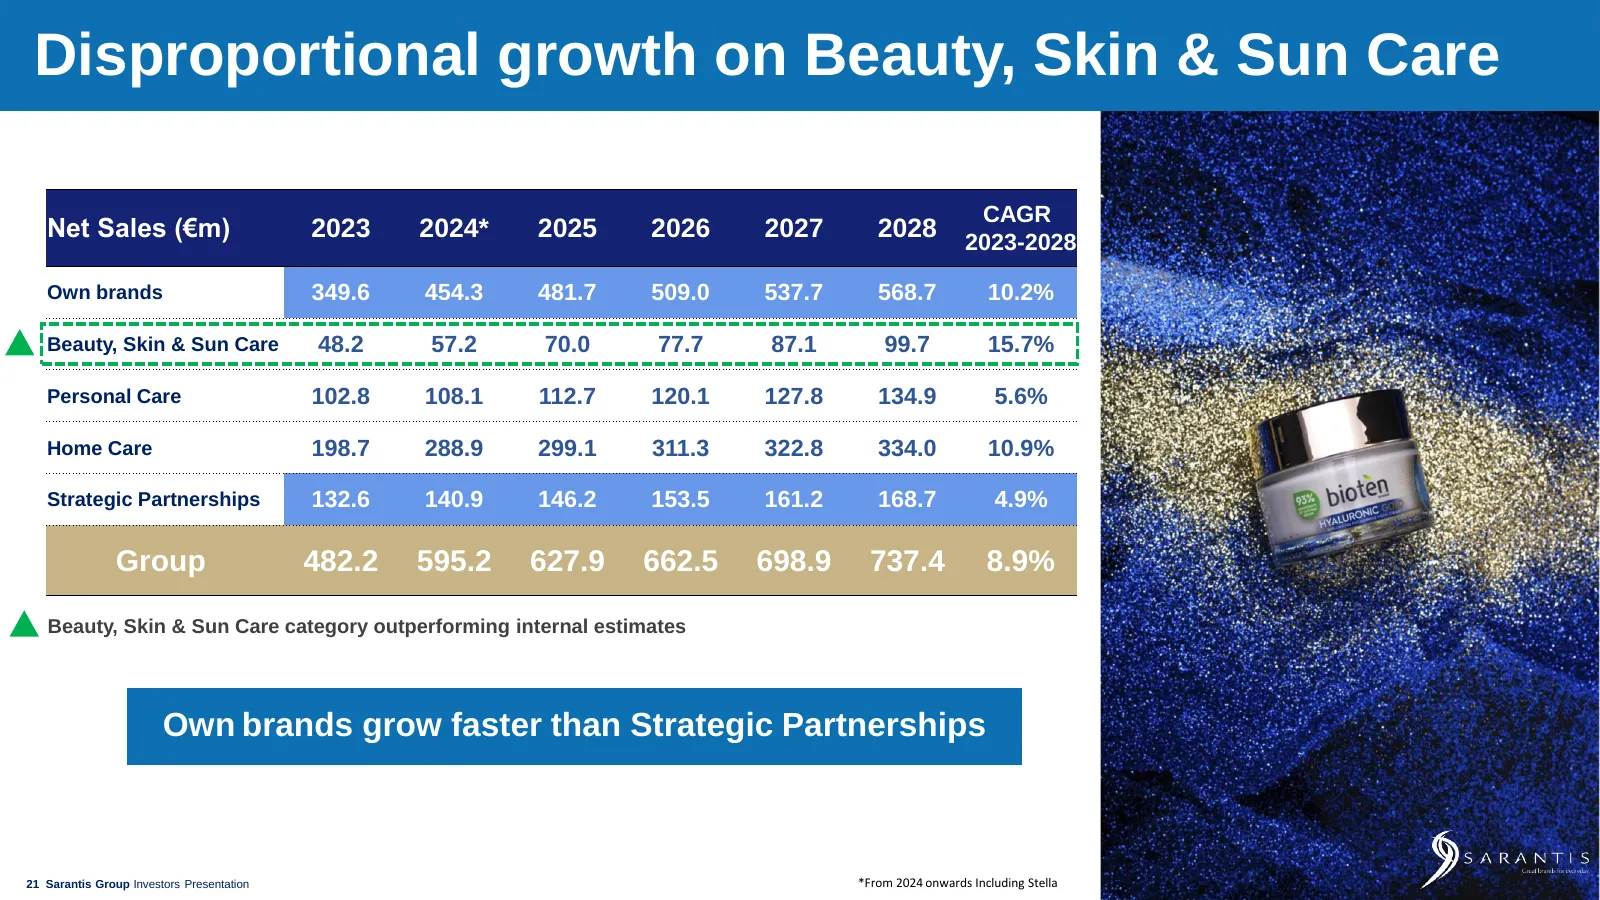
Slide 21: Disproportional growth on Beauty, Skin & Sun Care
Disproportional growth on Beauty, Skin & Sun Care CAGR Net Sales (€m) 2023 2024* 2025 2026 2027 2028 2023-2028 Own brands 349.6 454.3 481.7 509.0 537.7 568.7 10.2% Beauty, Skin & Sun Care 48.2 57.2 70.0 77.7 87.1 99.7 15.7% Personal Care 102.8 108.1 112.7 120.1 127.8 134.9 5.6% Home Care 198.7 288.9
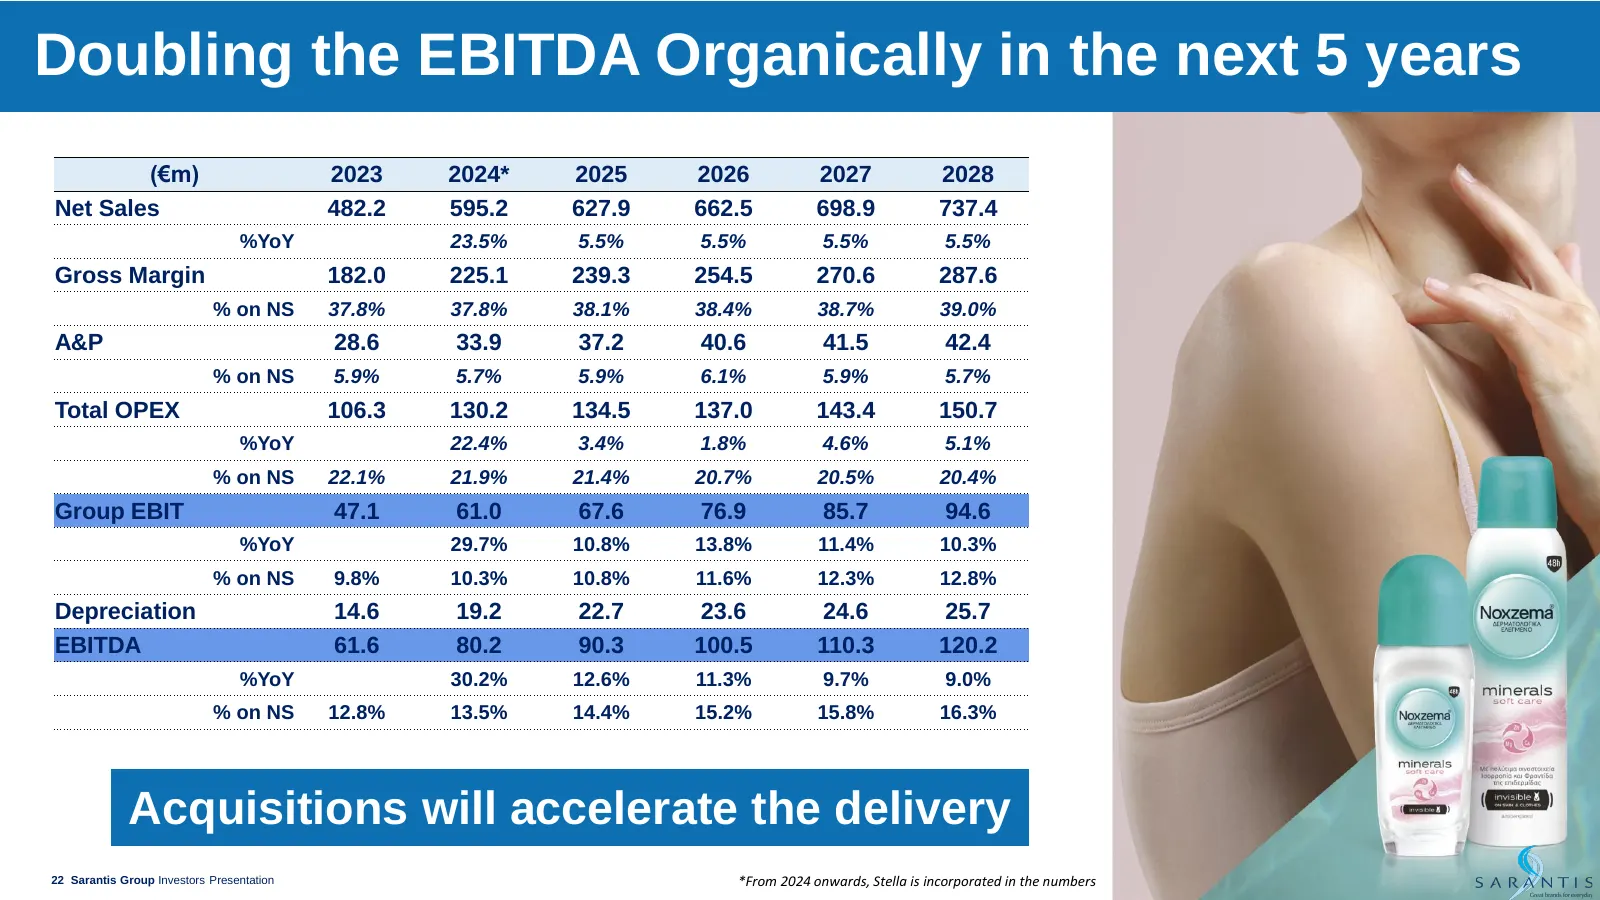
Slide 22: Doubling the EBITDA Organically in the next 5 years
Doubling the EBITDA Organically in the next 5 years (€m) 2023 2024* 2025 2026 2027 2028 Net Sales 482.2 595.2 627.9 662.5 698.9 737.4 %YoY 23.5% 5.5% 5.5% 5.5% 5.5% Gross Margin 182.0 225.1 239.3 254.5 270.6 287.6 % on NS 37.8% 37.8% 38.1% 38.4% 38.7% 39.0% A&P 28.6 33.9 37.2 40.6 41.5 42.4 % on NS
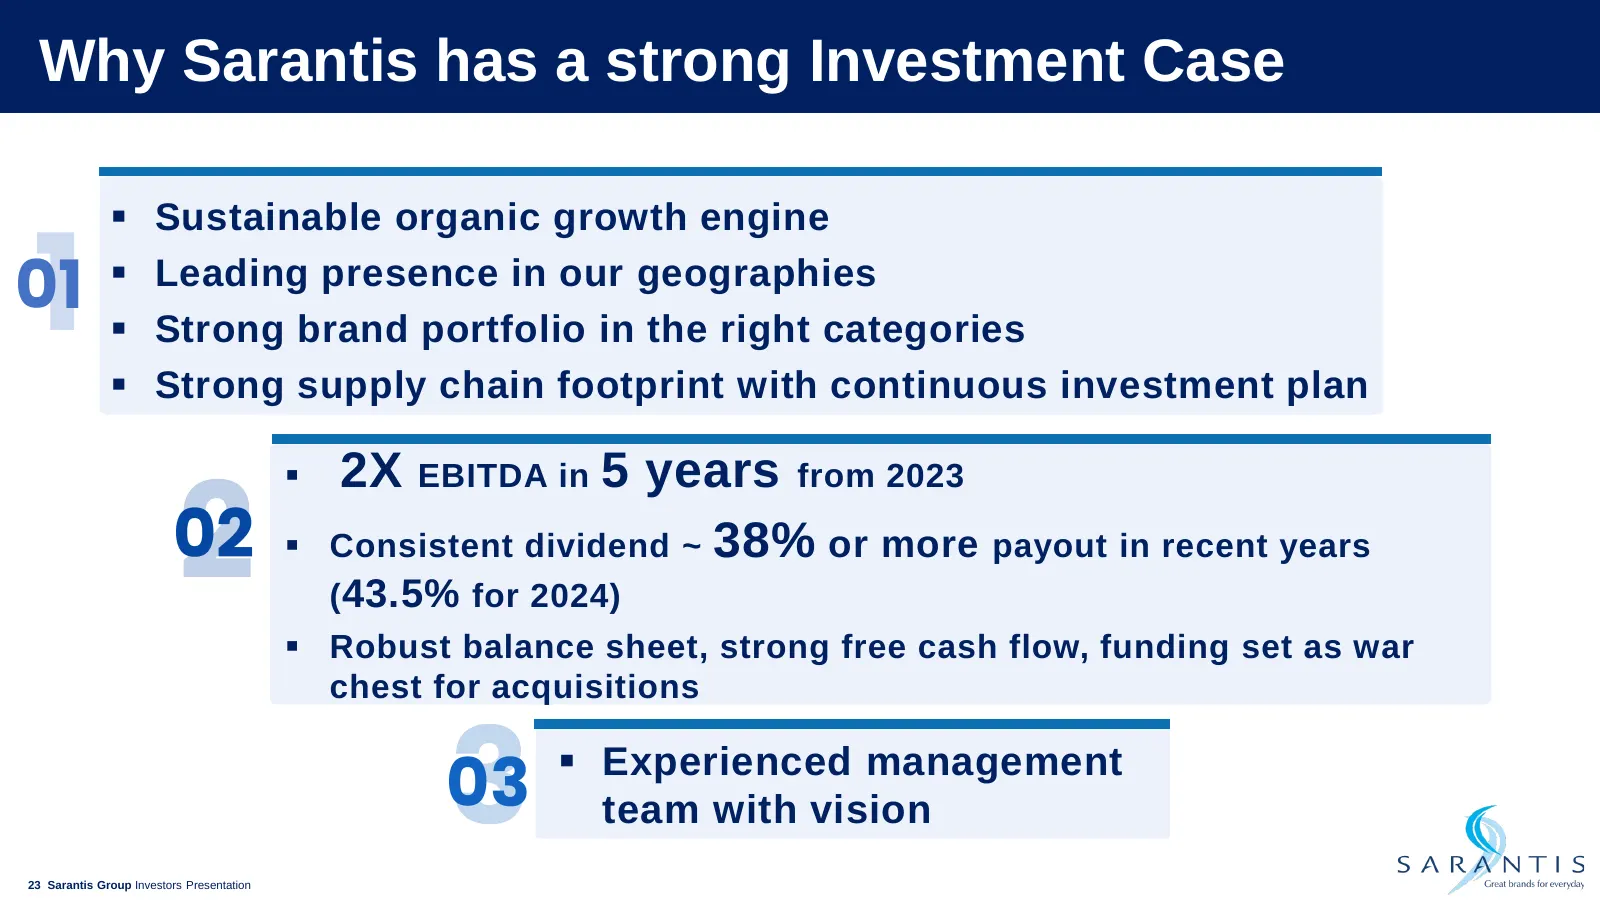
Slide 23: Why Sarantis has a strong Investment Case
Why Sarantis has a strong Investment Case ▪ Sustainable organic growth engine 01 ▪ Leading presence in our geographies ▪ Strong brand portfolio in the right categories ▪ Strong supply chain footprint with continuous investment plan 2X EBITDA in 5 years from 2023 ▪ 02 ▪ Consistent dividend ~ 38% or m
Slide 24: ESG Strategy
ESG Strategy
Slide 25: Raising Corporate Governance Standards
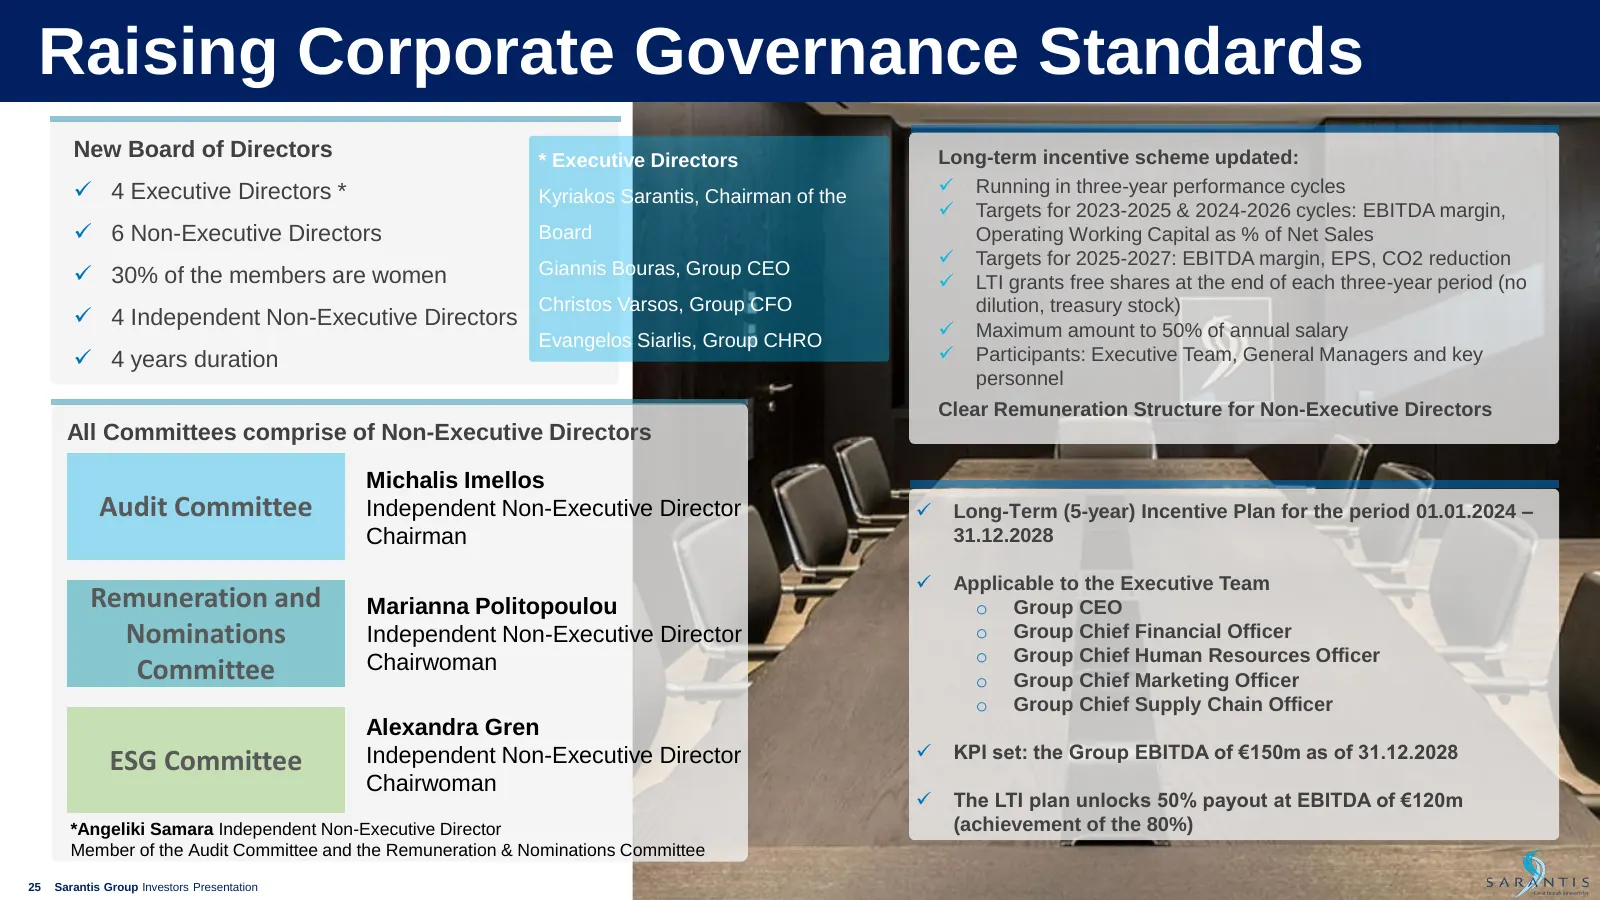
Raising Corporate Governance Standards New Board of Directors * Executive Directors Long-term incentive scheme updated: ✓ 4 Executive Directors * ✓ Running in three-year performance cycles Kyriakos Sarantis, Chairman of the ✓ Targets for 2023-2025 & 2024-2026 cycles: EBITDA margin, ✓ 6 Non-Executive
Slide 26: Committing to Science-Based Targets initiative (SBTi)-aligned targets
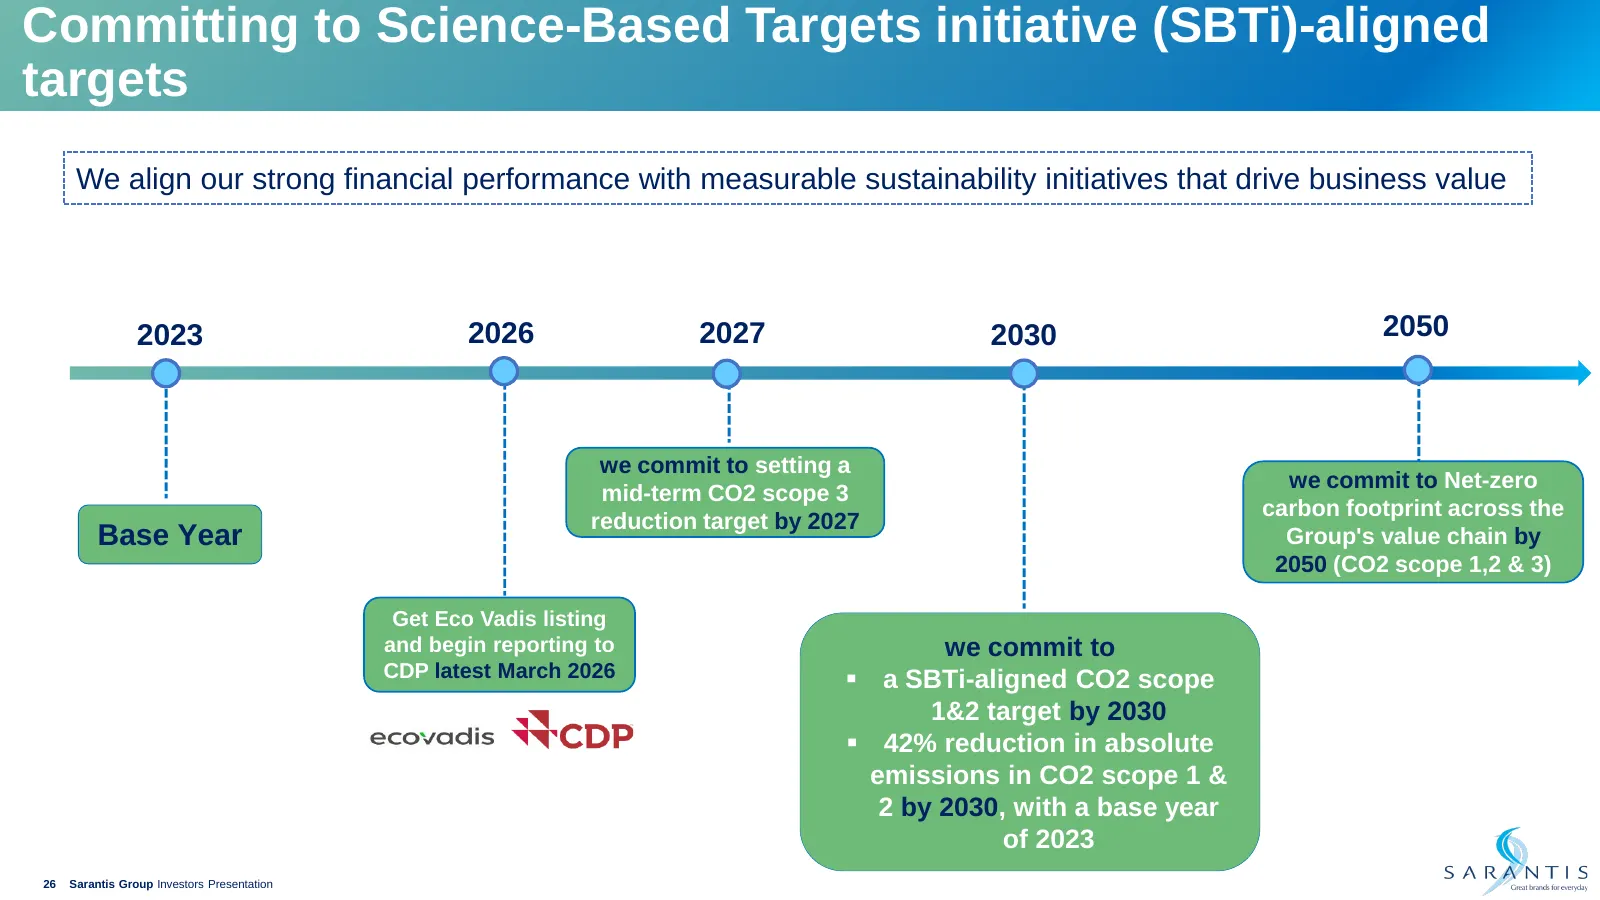
Committing to Science-Based Targets initiative (SBTi)-aligned targets We align our strong financial performance with measurable sustainability initiatives that drive business value 2023 2026 2027 2030 2050 we commit to setting a we commit to Net-zero mid-term CO2 scope 3 carbon footprint across the
Slide 27: Appendix
Appendix
Slide 28: Our brands
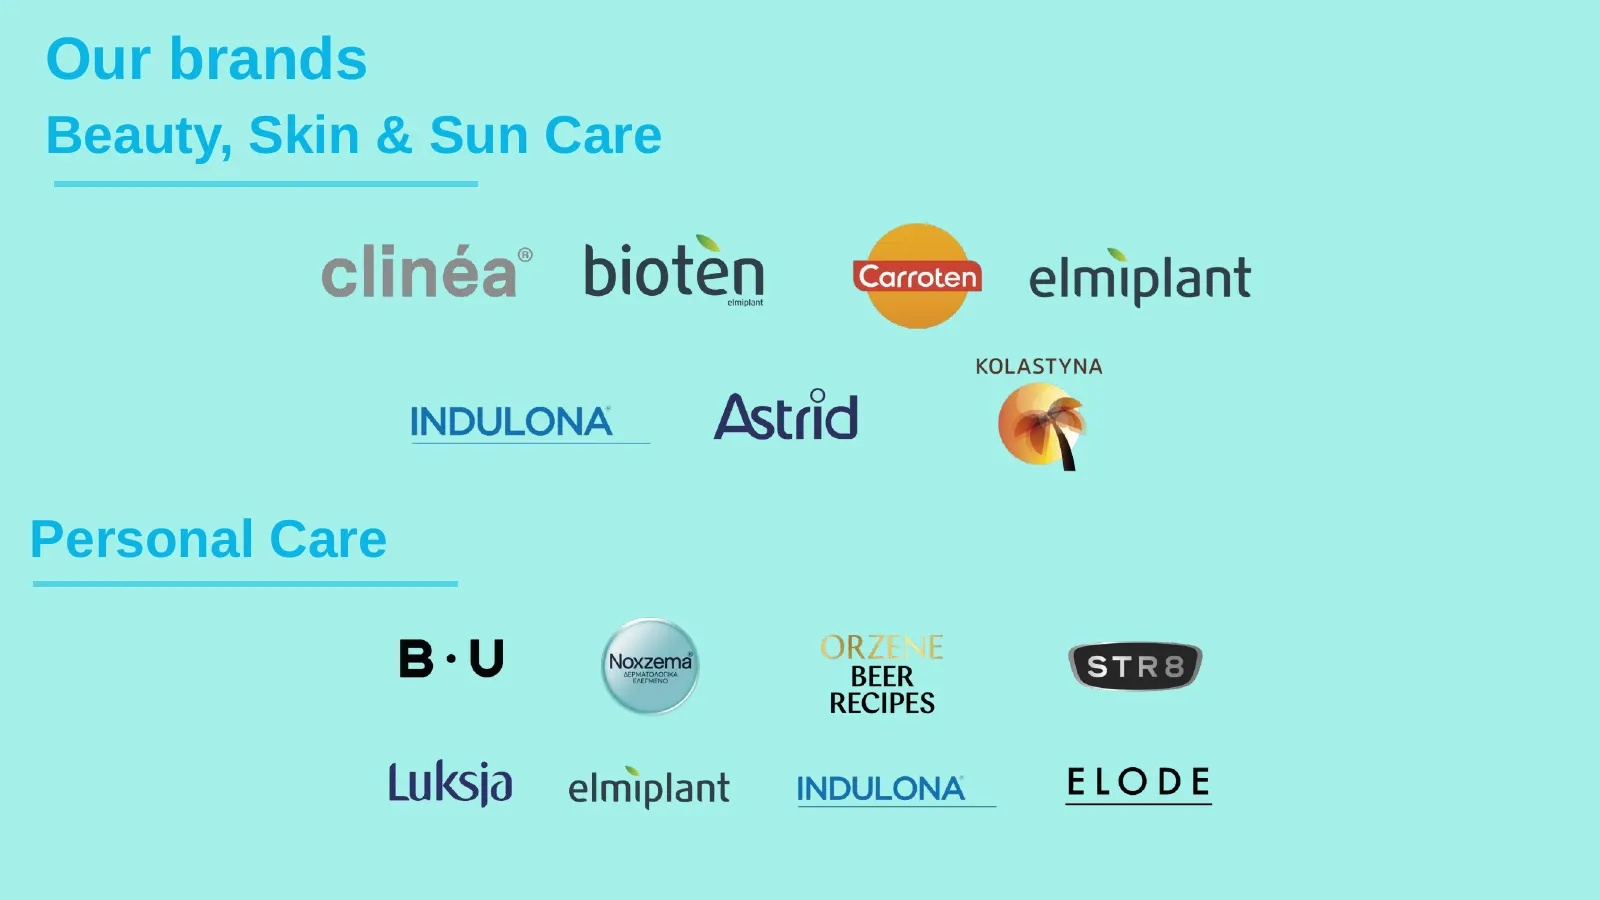
Our brands Beauty, Skin & Sun Care Personal Care
Slide 29: Our brands – Home Care Solutions
Our brands – Home Care Solutions
Slide 30: Strategic Partnerships – Mass Distribution
Strategic Partnerships – Mass Distribution
Slide 31: Strategic Partnerships – Selective Distribution
Strategic Partnerships – Selective Distribution
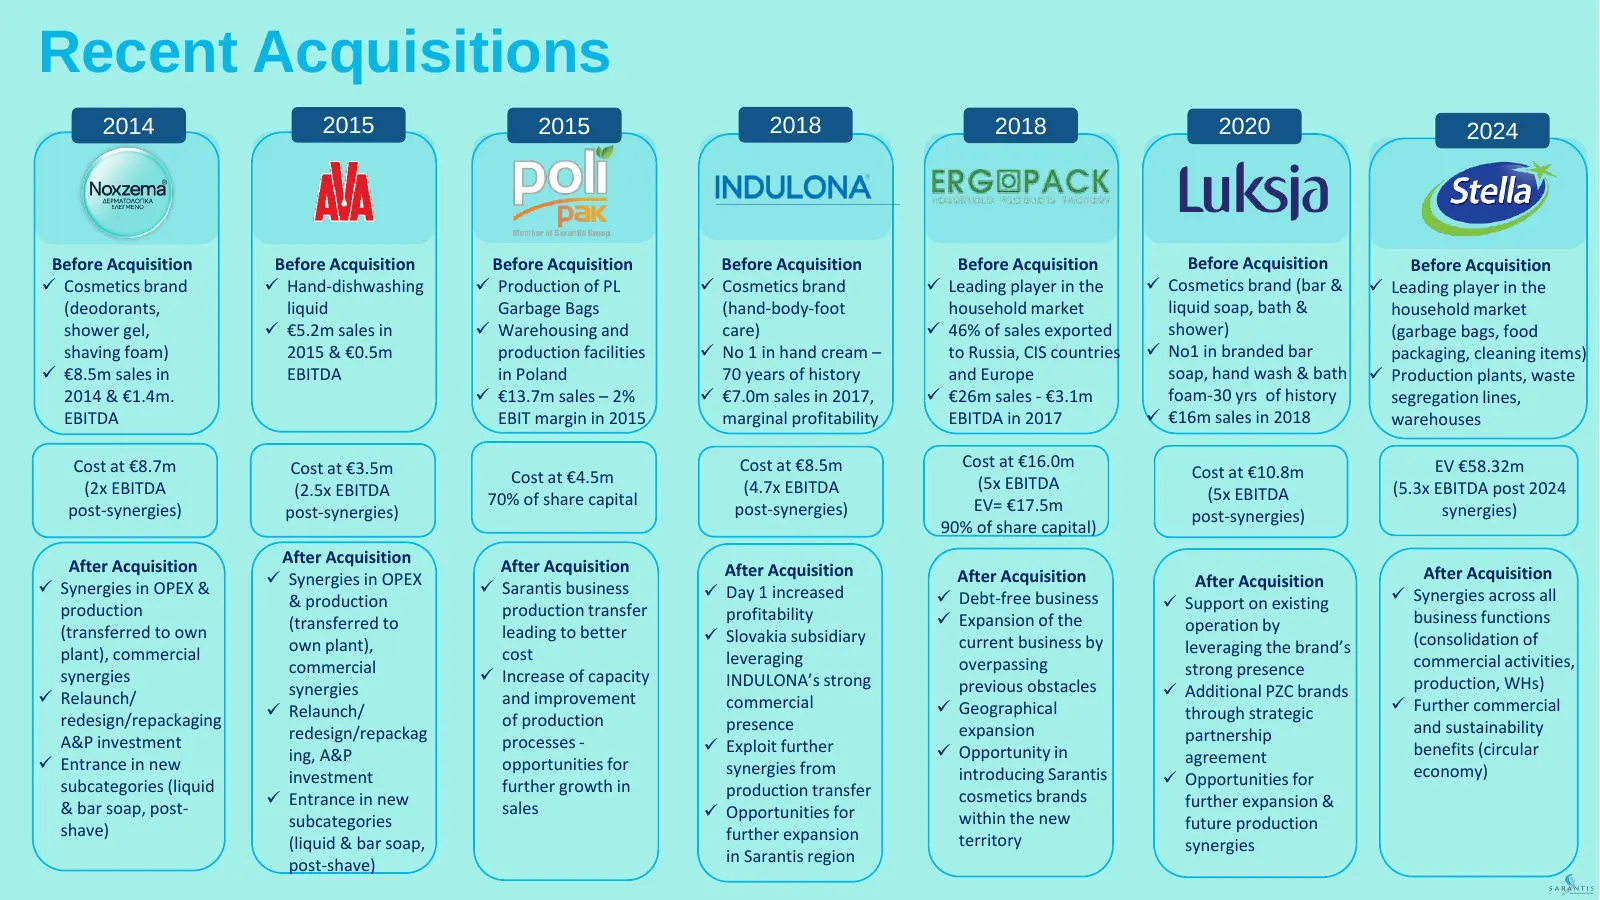
Slide 32: Recent Acquisitions
Recent Acquisitions 2014 2015 2015 2018 2018 2020 2024 Before Acquisition Before Acquisition Before Acquisition Before Acquisition Before Acquisition Before Acquisition Before Acquisition ✓ Cosmetics brand ✓ Hand-dishwashing ✓ Production of PL ✓ Cosmetics brand ✓ Leading player in the ✓ Cosmetics br
Slide 33: Q&A
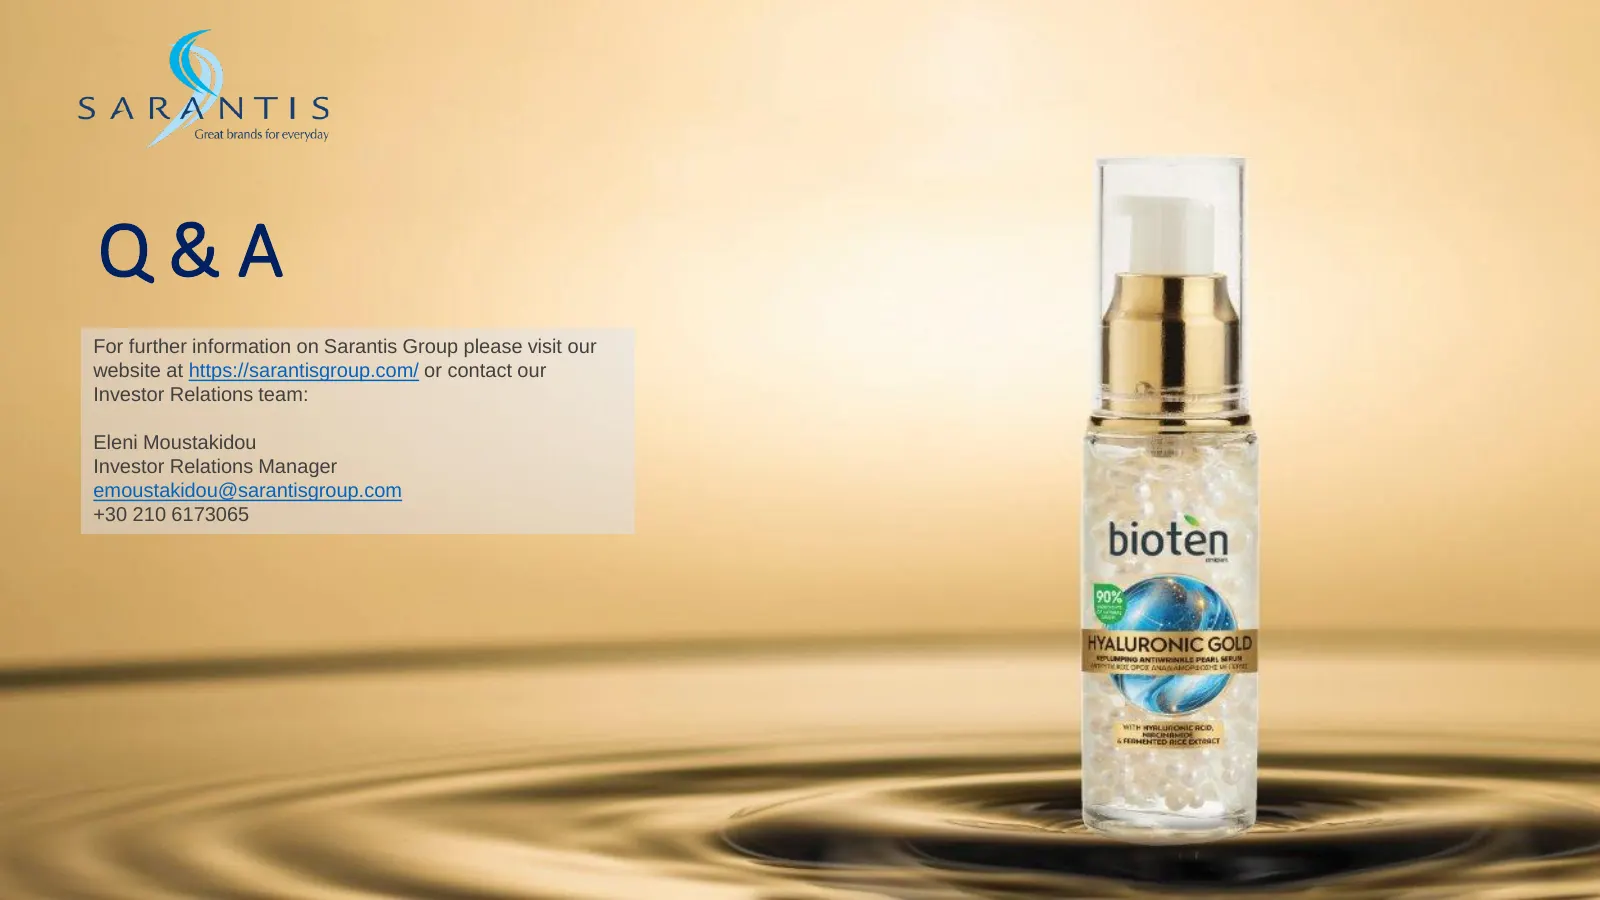
Q&A For further information on Sarantis Group please visit our website at https://sarantisgroup.com/ or contact our Investor Relations team: Eleni Moustakidou Investor Relations Manager emoustakidou@sarantisgroup.com +30 210 6173065
Source: company website
More decks from GR. Sarantis S.A.
 H1 2026 Earnings Presentation21 slides · Sep 9, 2026
 Investor Presentation (May 2026)36 slides · May 2026
 Investor Presentation (April 2026)36 slides · April 2026
 FY2025 Earnings Presentation21 slides · Mar 12, 2026
 Investor Presentation (January 2026)33 slides · January 2026
 Investor Presentation (November 2025)30 slides · November 2025