EPIQ Systems — Q2 2013 Earnings Presentation
14 slides from EPIQ Systems's earnings presentation, Jul 30, 2013

Slide 1: Second Quarter 2013 Earnings Conference Call
EpIQ Second Quarter 2013 Earnings Conference Call July 30, 2013 NASDAQ: EPIQ wwaw.epiqsystems.com
Slide 2: Forward Looking and Cautionary Statements
Forward Looking and Cautionary Statements SYSTEMS This presentation contains forward-looking statements within the meaning of Section 27A of the Securities Act of 1933, as amended, and Section 21E of the Securities Exchange Act of 1934, as amended, which include, but are not limited to, any projecti
Slide 3: Use of non-GAAP Measures
e Use of non-GAAP Measures SIQ ae amortization of acquisition intangibles, d e-tim: nology expense, lean fee amortization, litigation expense, timing of Penton - expense versus revenue, My rate, all net of tax), (ii) n P , |, amortization, share-based x), share basis, and (ii) NOGAAP ompensation, ac
Slide 4: Key Events
Key Events Epla Epiq was gni yy , Inc. in their fe} E- Discov very Software,” with the hi nace to execute” in the “Challengers” uadrant. Th iti idors according to their t d plet of vision. > In June, Epig of da dat in Shanghai, ex, i i a and i d and office nig in Hong dna a the recently opened Tokyo
Slide 5: Key Events
Key Events Epla > Epigi - PIq senior dit facility The new v facility i is expected to be completed third mone greater capital fini > On June 3, 2013, Epiq paid a in dividend of 9.0 cents per share of On 13, 2013, the Board of Directors O10 9.0 cents per declared h dividend 2013 to etockhold. ig 9; f
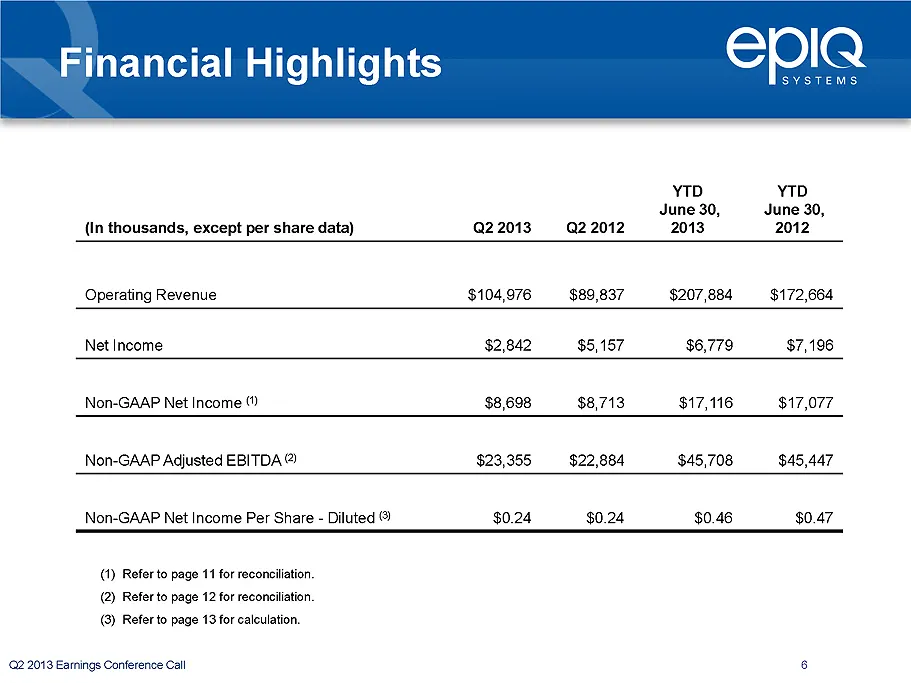
Slide 6: Financial Highlight
Financial Highlight Epla YTD YTD June 30, June 30, (inth ds 22013 Q2.2012 2013 2012 Operating Revenue $104,976 $89,837 $207,884 $172,664 Net Income $2,842 $5,157 $6,779 $7,196 Non-GAAP Net Income () $8,698 $8,713 $17,116 $17,077 Non-GAAP Adjusted EBITDA ® $23,355 $22,884 $45,708 $45,447 N Diluted @
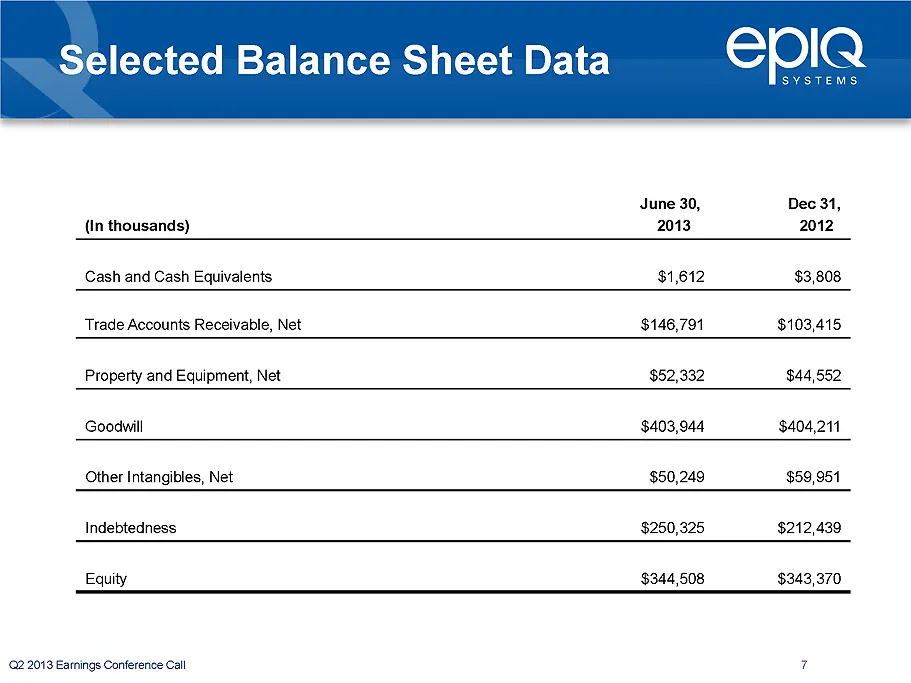
Slide 7: Selected Balance Sheet Data
Selected Balance Sheet Data EplQ June 30, Dec 31, (In thousands) 2013 2012 $1,612 $3,808 Ne $146,791 $103,415 $52,332 $44,552 Goodwill $403,944 $404,211 Other Intangibles, Net $50,249 $59,951 Indebtedness $250,325 $212,439 Equity $344,508 $343,370 (22.2018 Earnings Conference Call 7
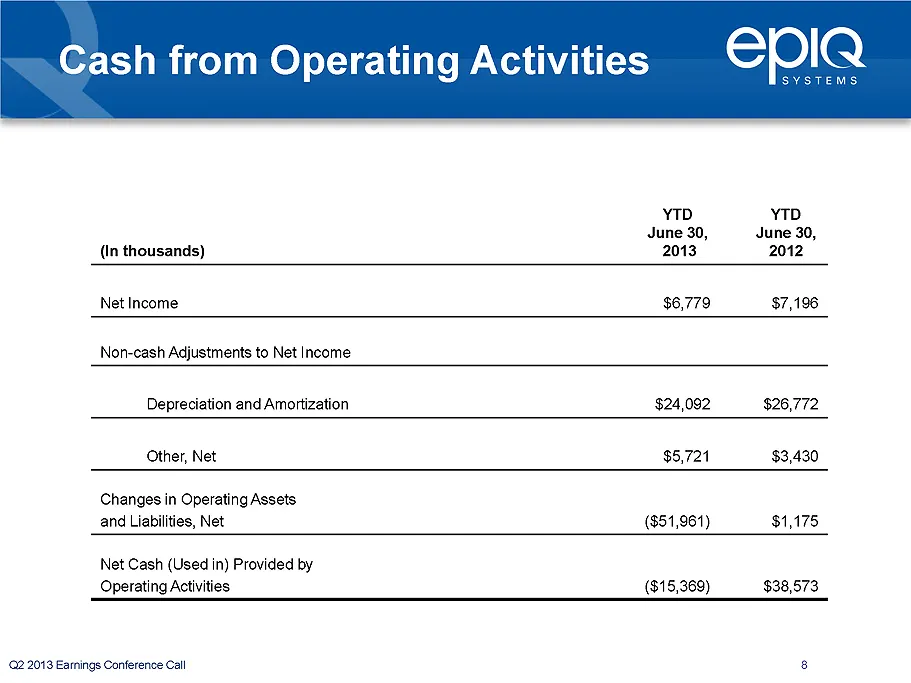
Slide 8: Cash from Operating Activities
Cash from Operating Activities Epla YTD YTD June 30, June 30, (In thousands) 2013 2012 Net Income $6,779 $7,196 $24,092 $26,772 Other, Net $5,721 $3,430 Changes in Operating Assets and Liabilities, Net (851,961) $1,175 Net Cash (Used in) Provided by Operating Activities (815,369) $38,573 (22.2018 Ea
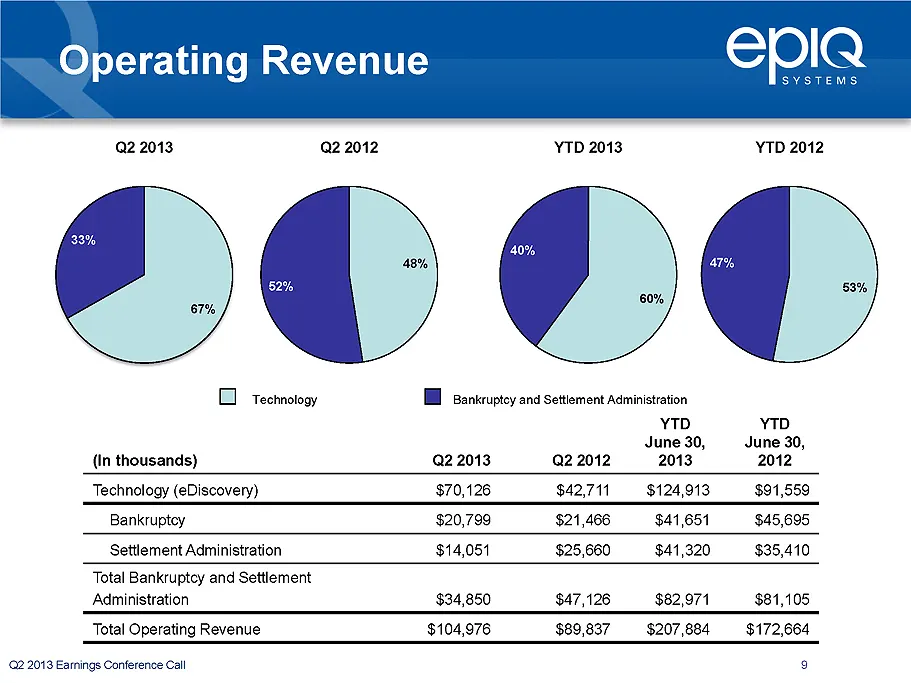
Slide 9: Operating Revenue
Operating Revenue Epla a2 2013 a2 2012 YTD 2013 YTD 2012 33% 40% é q- g: q: 52% technology TB Bankruptcy and Settlement Administration YTD June 30, June 30, (In thousands) Q2 2013 Q2 2012 2013 2012 Technology (eDiscovery) $70,126 $42,711 124,913 $91,559 Bankruptoy $20,799 $21,466 $41,654 $45,695 $14
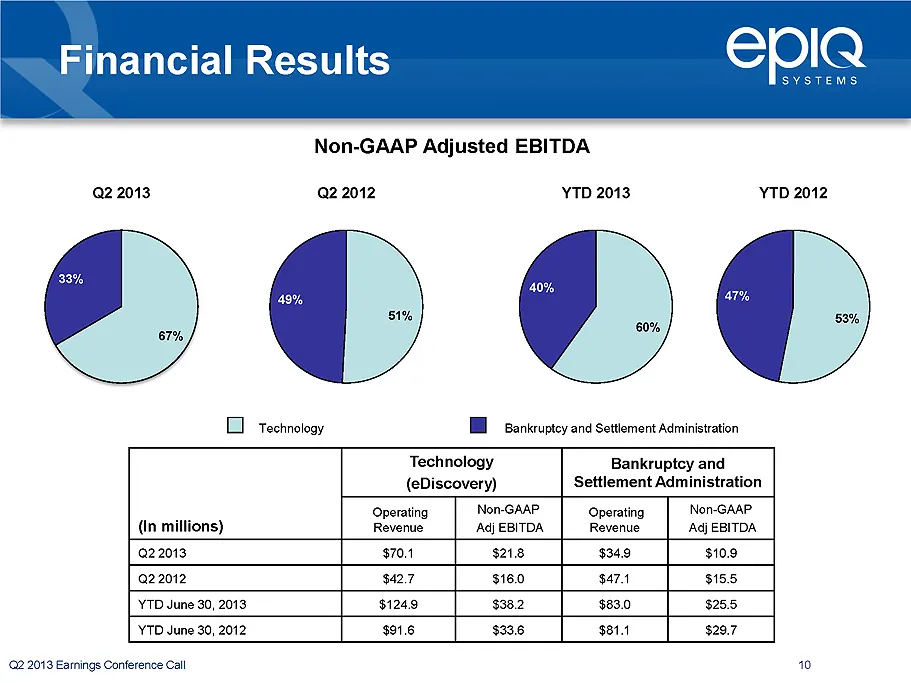
Slide 10: Financial Results
Financial Results e SYSTEMS Non-GAAP Adjusted EBITDA Q2 2013 Q2 2012 YTD 2013 YTD 2012 40% . > g> 1 technology TH Bankruptcy and Settlement Administration jechnology Bankruptcy and (eDiscovery) Settlement Administration Operating Non-GAAP Operating Non-GAAP (In millions) Revenue Adj EBITDA Revenue ‘
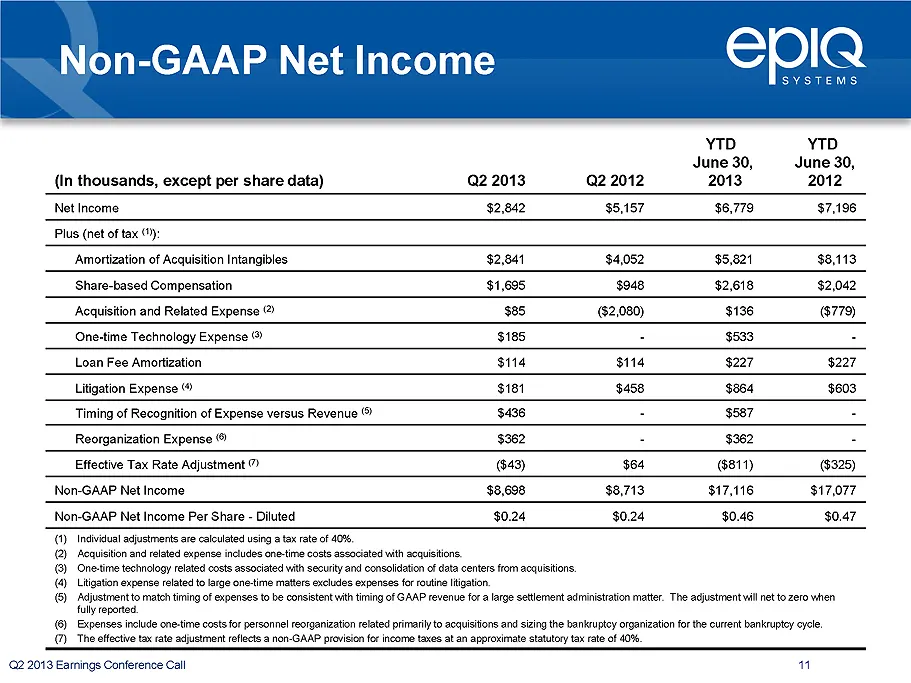
Slide 11: Non-GAAP Net Income
Non-GAAP Net Income SYSTEMS (in thousands, except per share data) Q2 2013 Q2 2012 201 2 Net Income $2,842 $5,157 $6,779 $7,196 Plus (net of tax () Amortization of Acquisition Intangibles $2,841 $4,052 $5,821 $8,113 sed Compensation $1,695 $2,618 $2,042 tion and Related Expense $85 ($2,080) $136 $185
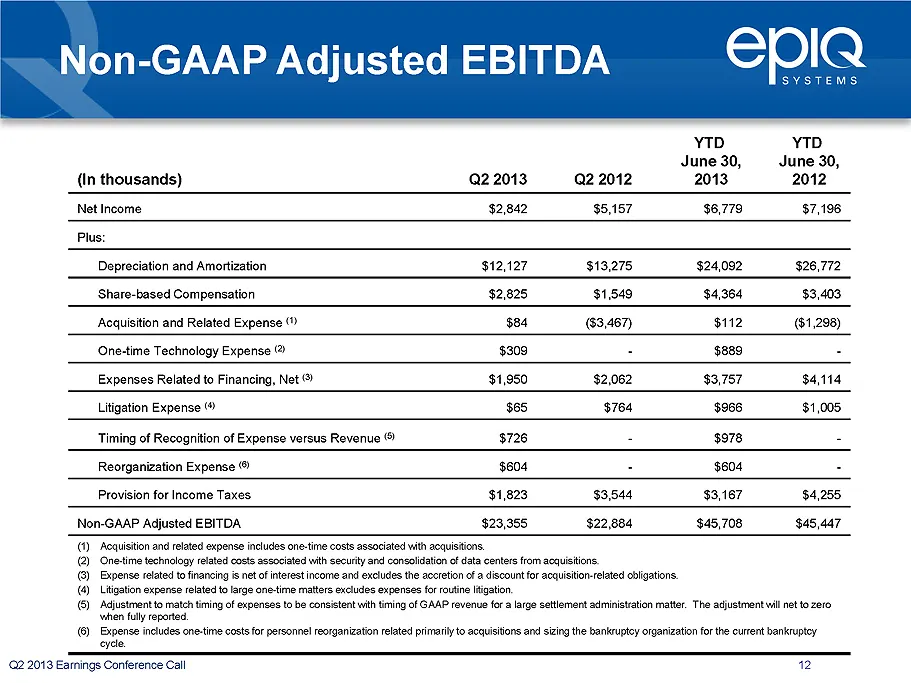
Slide 12: Non-GAAP Adjusted EBITDA
Non-GAAP Adjusted EBITDA SYSTEMS YTD YTD June 30, June 30, (In thousands) Q2 2013 Q2 2012 2013 2012 Net Income $2,842 $5,157 $6,779 $7,196 Pl $12,127 $13,275 $24,092 $26,772 $2,825 31.549 $4,364 $3. $84 (63,467) $112 (61,298) $309 $889 $1,950 $2,062 $3,757 $4,114 Litigation Expense ® $65 $966 ik $72
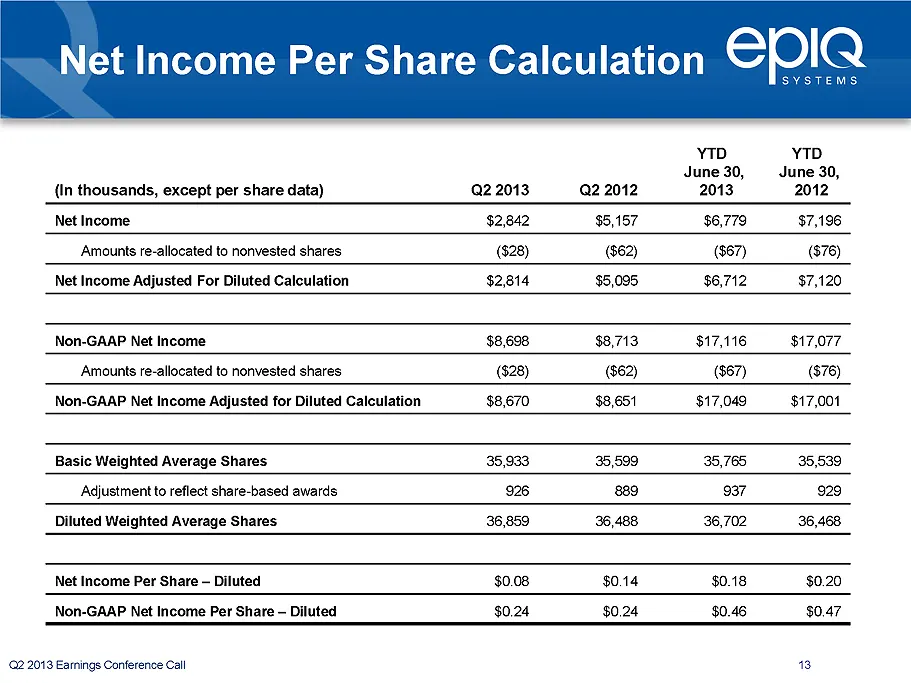
Slide 13: Net Income Per Share Calculation
Net Income Per Share Calculation EplQ SYSTEMS YTD YTD June 30, June 30, {in th 2 2013 Q2 2012 2013 2012 Net Income $2,842 $5,187 $6,779 $7,196 (828) (862) (967) (876) $2,814 $5,095 $6,712 $7,120 Non-GAAP Net Income $8,713 $17,116 $17,077 (828) (862) (867) (876) Non- 1 $17,049 $17,001 35,933 35,599 3

Slide 14: Epiq Investor Relations Contact
EpIQ Lew Schroeber Investor Relations (913) 621-9500 IR@epiqsystems.com NASDAQ: EPIQ wwaw.epiqsystems.com
Source: SEC EDGAR · 8-K filed Jul 30, 2013
More decks from EPIQ Systems Inc
 Q2 2016 Earnings Presentation12 slides · Aug 9, 2016
 Q1 2016 Earnings Presentation12 slides · May 3, 2016
 FY2015 Earnings Presentation13 slides · Mar 1, 2016
 Q3 2015 Earnings Presentation11 slides · Nov 3, 2015
 Q2 2015 Earnings Presentation11 slides · Aug 3, 2015
 Q1 2015 Earnings Presentation11 slides · Apr 28, 2015