EPIQ Systems — FY2015 Earnings Presentation
13 slides from EPIQ Systems's earnings presentation, Mar 1, 2016
Slide 1: Fourth Quarter and Fiscal Year 2015 Earnings Conference Call
Fourth Quarter and Fiscal Year 2015 Earnings Conference Call March 1, 2016 NASDAQ: EPIQ Exhibit 99.2
Slide 2: Forward-Looking Statements & Use of Non-GAAP Measures
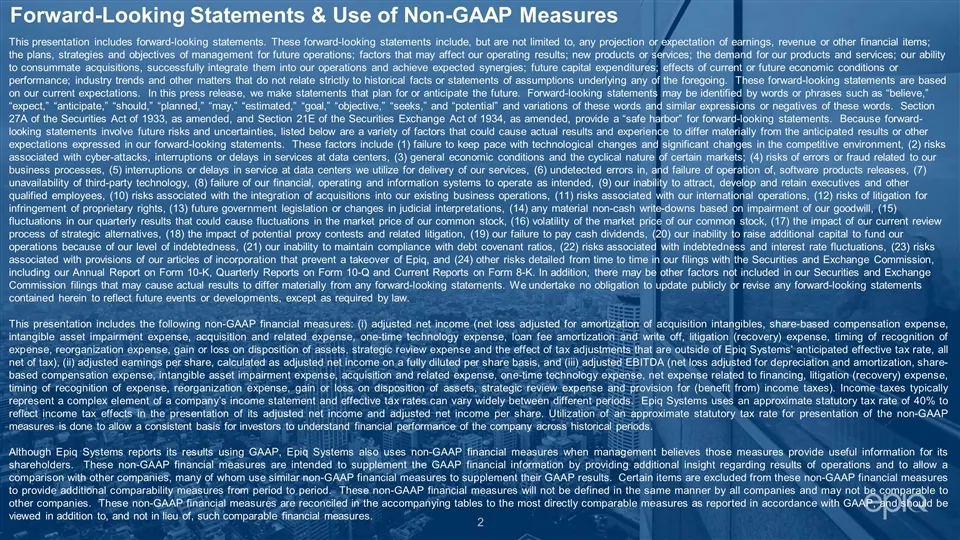
Forward-Looking Statements & Use of Non-GAAP Measures This presentation includes forward-looking statements. These forward-looking statements include, but are not limited to, any projection or expectation of earnings, revenue or other financial items; the plans, strategies and objectives of manageme
Slide 3: Selected Fourth Quarter & FY2015 Financial Results
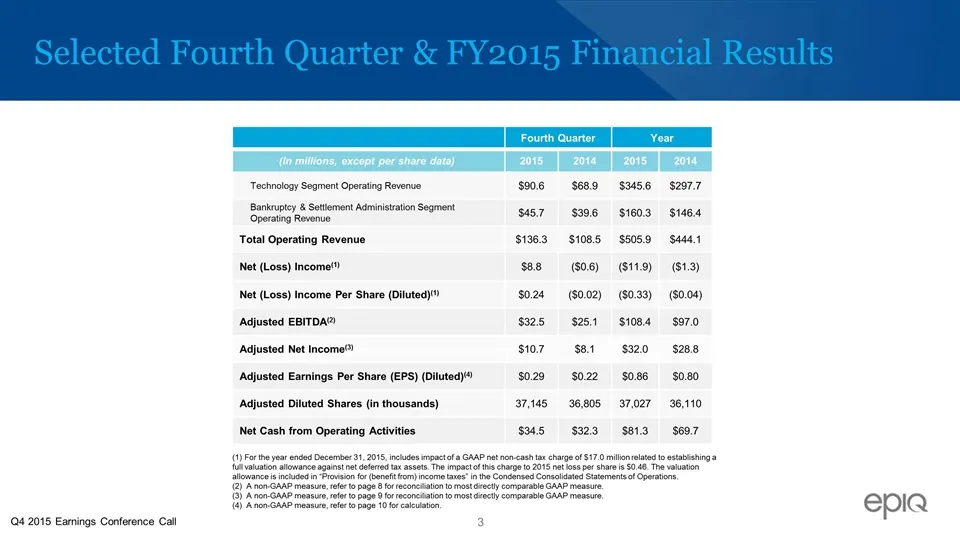
Selected Fourth Quarter & FY2015 Financial Results Fourth Quarter Year (In millions, except per share data) 2015 2014 2015 2014 Technology Segment Operating Revenue $90.6 $68.9 $345.6 $297.7 Bankruptcy & Settlement Administration Segment Operating Revenue $45.7 $39.6 $160.3 $146.4 Total Operating Re
Slide 4: Selected Balance Sheet Information
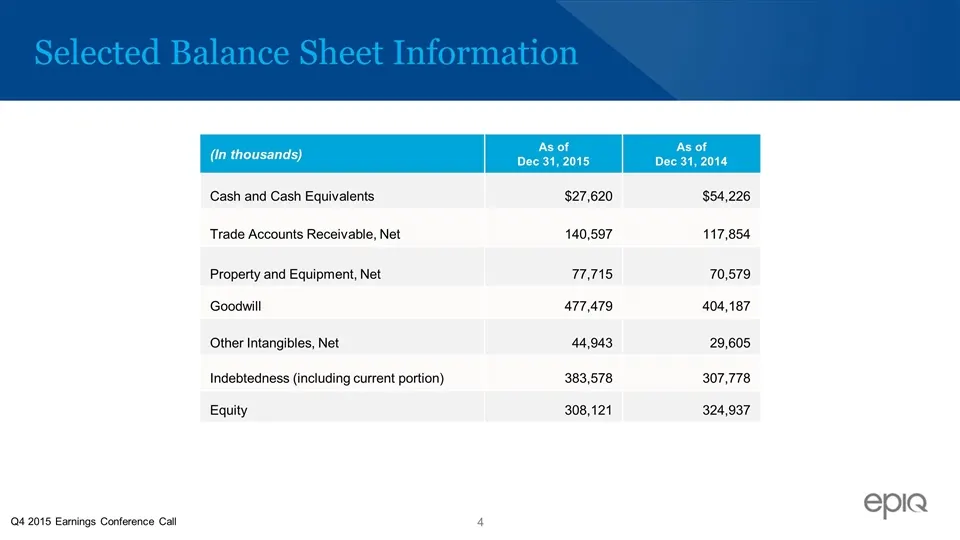
Selected Balance Sheet Information (In thousands) As of Dec 31, 2015 As of Dec 31, 2014 Cash and Cash Equivalents $27,620 $54,226 Trade Accounts Receivable, Net 140,597 117,854 Property and Equipment, Net 77,715 70,579 Goodwill 477,479 404,187 Other Intangibles, Net 44,943 29,605 Indebtedness (inclu
Slide 5: Cash from Operating Activities
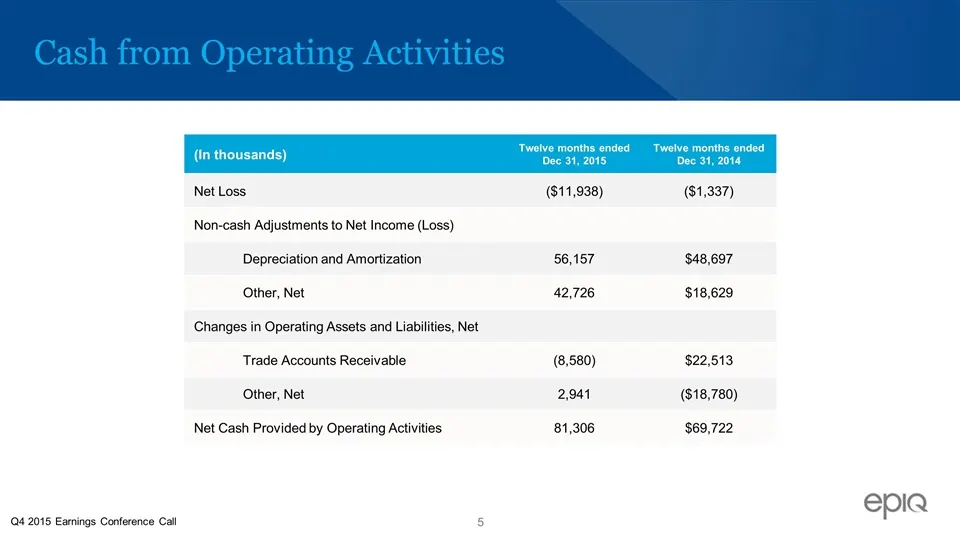
Cash from Operating Activities (In thousands) Twelve months ended Dec 31, 2015 Twelve months ended Dec 31, 2014 Net Loss ($11,938) ($1,337) Non-cash Adjustments to Net Income (Loss) Depreciation and Amortization 56,157 $48,697 Other, Net 42,726 $18,629 Changes in Operating Assets and Liabilities, Ne
Slide 6: Segment Operating Results
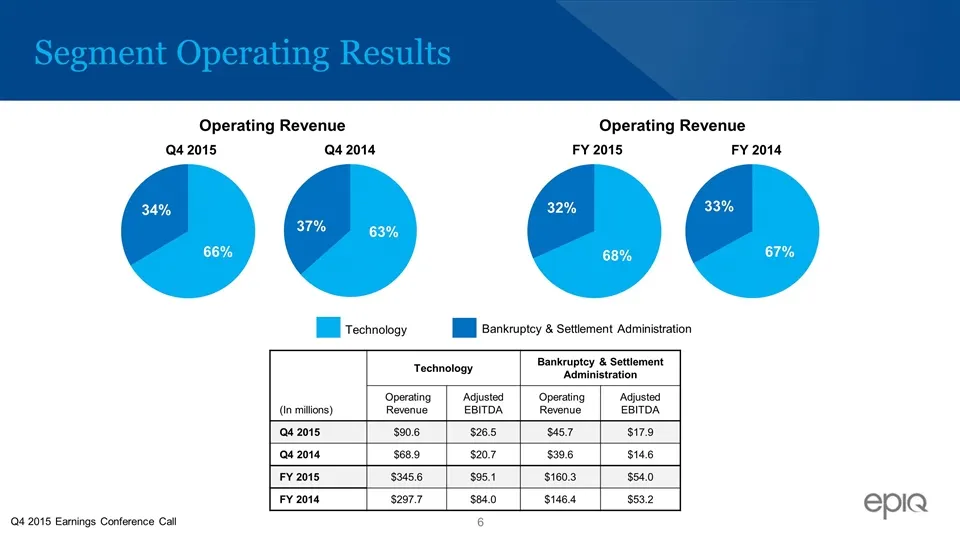
Segment Operating Results Technology Bankruptcy & Settlement Administration (In millions) Technology Bankruptcy & Settlement Administration Operating Revenue Adjusted EBITDA Operating Revenue Adjusted EBITDA Q4 2015 $90.6 $26.5 $45.7 $17.9 Q4 2014 $68.9 $20.7 $39.6 $14.6 FY 2015 $345.6 $95.1 $160.3
Slide 7: 2016 Financial Guidance
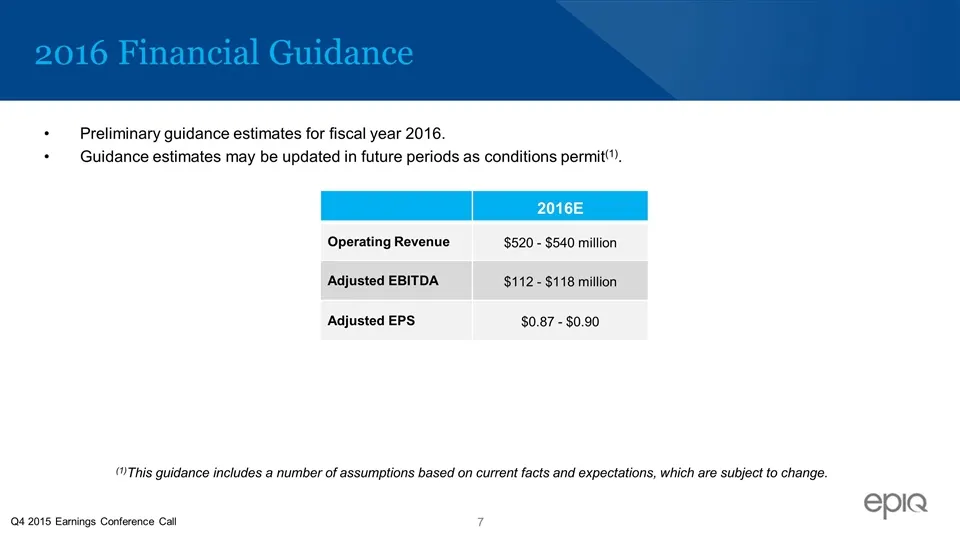
2016 Financial Guidance Preliminary guidance estimates for fiscal year 2016. Guidance estimates may be updated in future periods as conditions permit(1). 2016E Operating Revenue $520 - $540 million Adjusted EBITDA $112 - $118 million Adjusted EPS $0.87 - $0.90 Q4 2015 Earnings Conference Call (1)Thi
Slide 8: Adjusted EBITDA Reconciliation
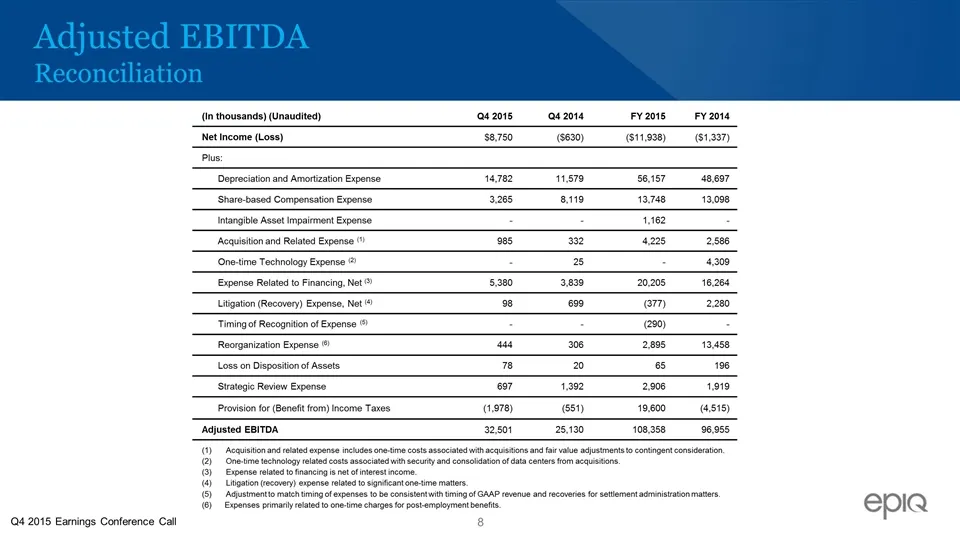
Adjusted EBITDA Reconciliation (In thousands) (Unaudited) Q4 2015 Q4 2014 FY 2015 FY 2014 Net Income (Loss) $8,750 ($630) ($11,938) ($1,337) Plus: Depreciation and Amortization Expense 14,782 11,579 56,157 48,697 Share-based Compensation Expense 3,265 8,119 13,748 13,098 Intangible Asset Impairment
Slide 9: Adjusted Net Income Reconciliation
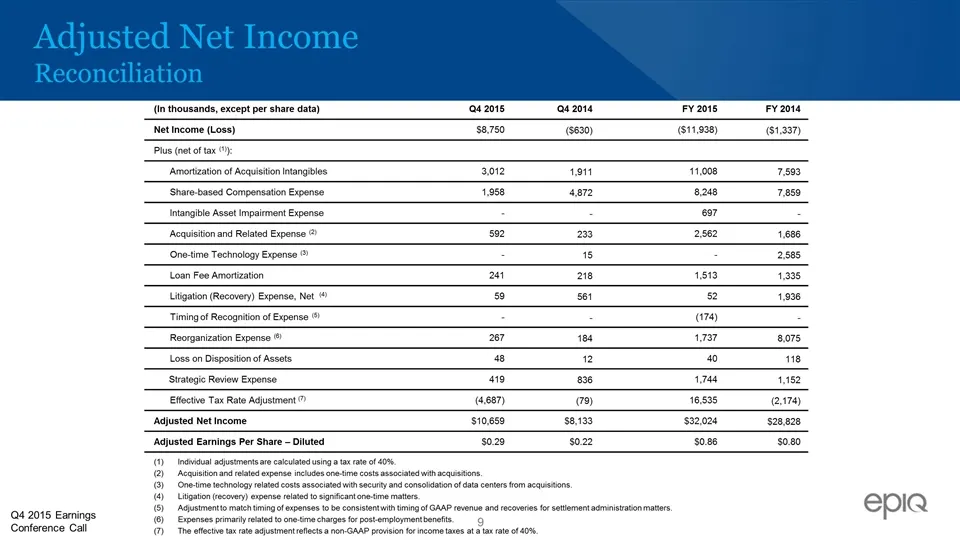
Adjusted Net Income Reconciliation (In thousands, except per share data) Q4 2015 Q4 2014 FY 2015 FY 2014 Net Income (Loss) $8,750 ($630) ($11,938) ($1,337) Plus (net of tax (1)): Amortization of Acquisition Intangibles 3,012 1,911 11,008 7,593 Share-based Compensation Expense 1,958 4,872 8,248 7,859
Slide 10: Net Income Per Share Calculation
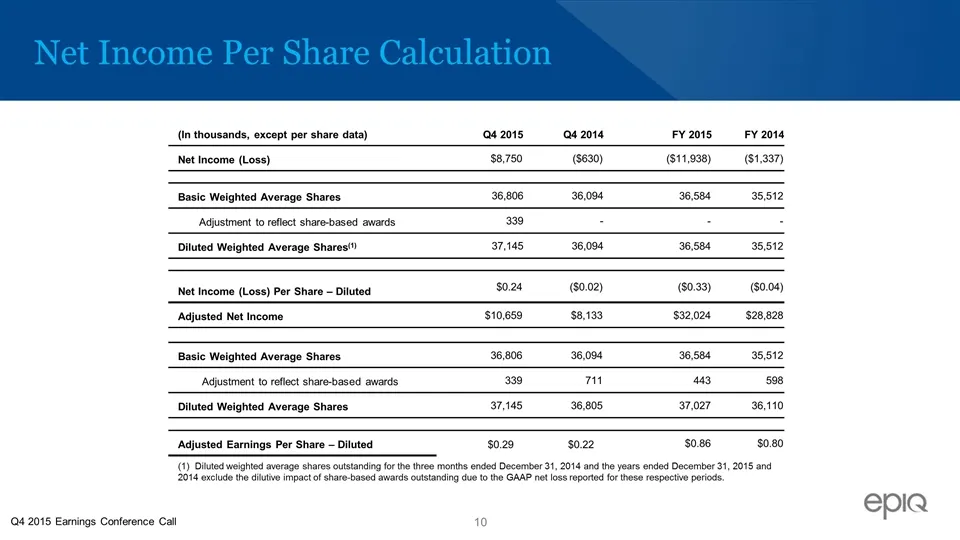
Net Income Per Share Calculation (In thousands, except per share data) Q4 2015 Q4 2014 FY 2015 FY 2014 Net Income (Loss) $8,750 ($630) ($11,938) ($1,337) Basic Weighted Average Shares 36,806 36,094 36,584 35,512 Adjustment to reflect share-based awards 339 - - - Diluted Weighted Average Shares(1) 37

Slide 11: About Epiq
Epiq (NASDAQ: EPIQ) is a leading global provider of integrated technology and services for the legal profession, including electronic discovery, bankruptcy, and class action and mass tort administration. Our innovative solutions are designed to streamline the administration of litigation, investigat
Slide 12: Epiq Worldwide
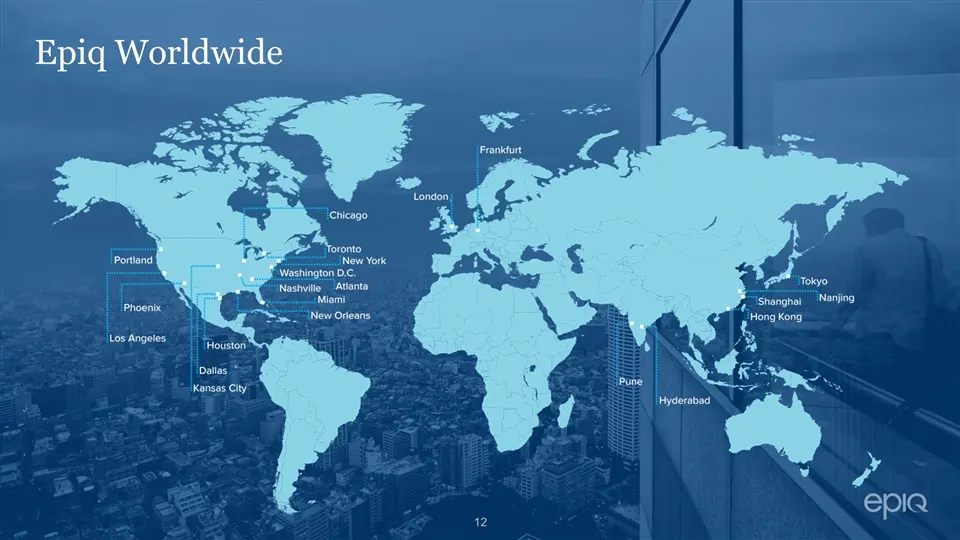
Epiq Worldwide
Slide 13: Investor Contacts
Investor Contacts Kelly Bailey Epiq Systems (913) 621-9500 IR@epiqsystems.com Chris Eddy Catalyst Global (212) 924-9800 epiq@catalyst-ir.com NASDAQ: EPIQ
Source: SEC EDGAR · 8-K filed Mar 1, 2016
More decks from EPIQ Systems Inc
 Q2 2016 Earnings Presentation12 slides · Aug 9, 2016
 Q1 2016 Earnings Presentation12 slides · May 3, 2016
 Q3 2015 Earnings Presentation11 slides · Nov 3, 2015
 Q2 2015 Earnings Presentation11 slides · Aug 3, 2015
 Q1 2015 Earnings Presentation11 slides · Apr 28, 2015
 FY2014 Earnings Presentation11 slides · Mar 2, 2015