EPIQ Systems — Q3 2015 Earnings Presentation
11 slides from EPIQ Systems's earnings presentation, Nov 3, 2015
Slide 1: Third Quarter 2015 Earnings Conference Call
Third Quarter 2015 Earnings Conference Call November 3, 2015 NASDAQ: EPIQ www.epiqsystems.com Exhibit 99.2
Slide 2: Forward Looking Statements & Use of Non-GAAP Measures
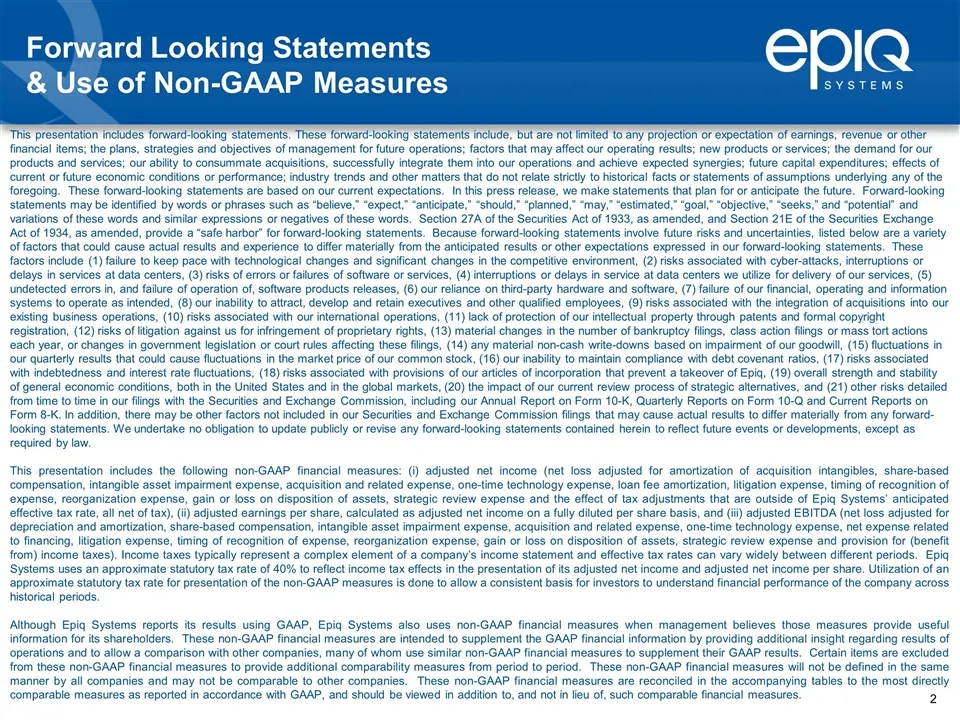
Forward Looking Statements & Use of Non-GAAP Measures This presentation includes forward-looking statements. These forward-looking statements include, but are not limited to any projection or expectation of earnings, revenue or other financial items; the plans, strategies and objectives of managemen
Slide 3: Third Quarter 2015 Financial Results
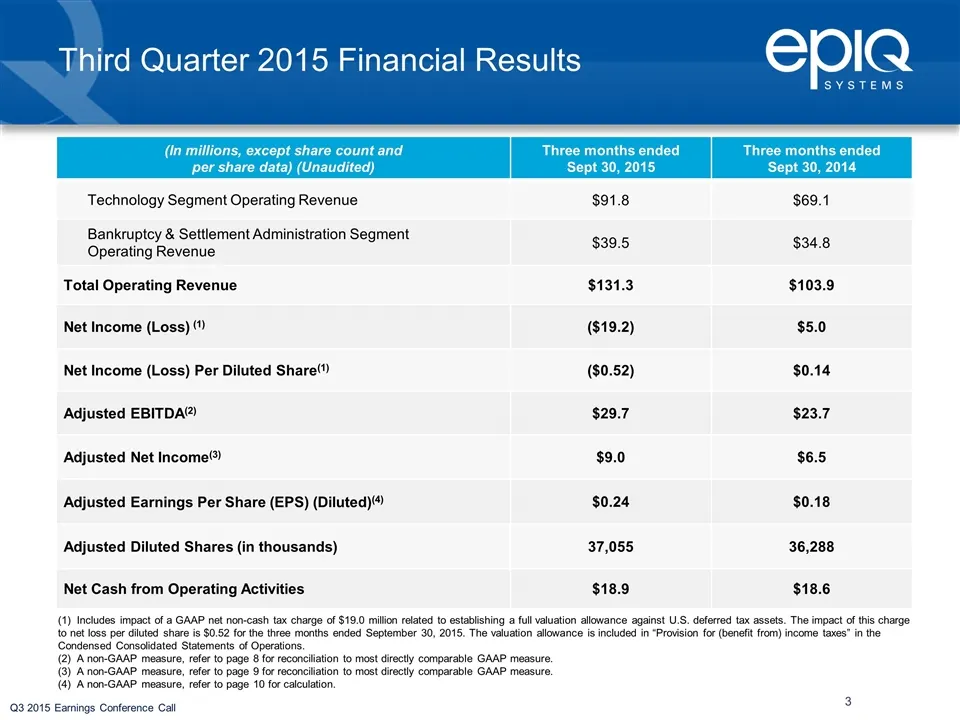
Q3 2015 Earnings Conference Call (1) Includes impact of a GAAP net non-cash tax charge of $19.0 million related to establishing a full valuation allowance against U.S. deferred tax assets. The impact of this charge to net loss per diluted share is $0.52 for the three months ended September 30, 2015.
Slide 4: Selected Balance Sheet Data
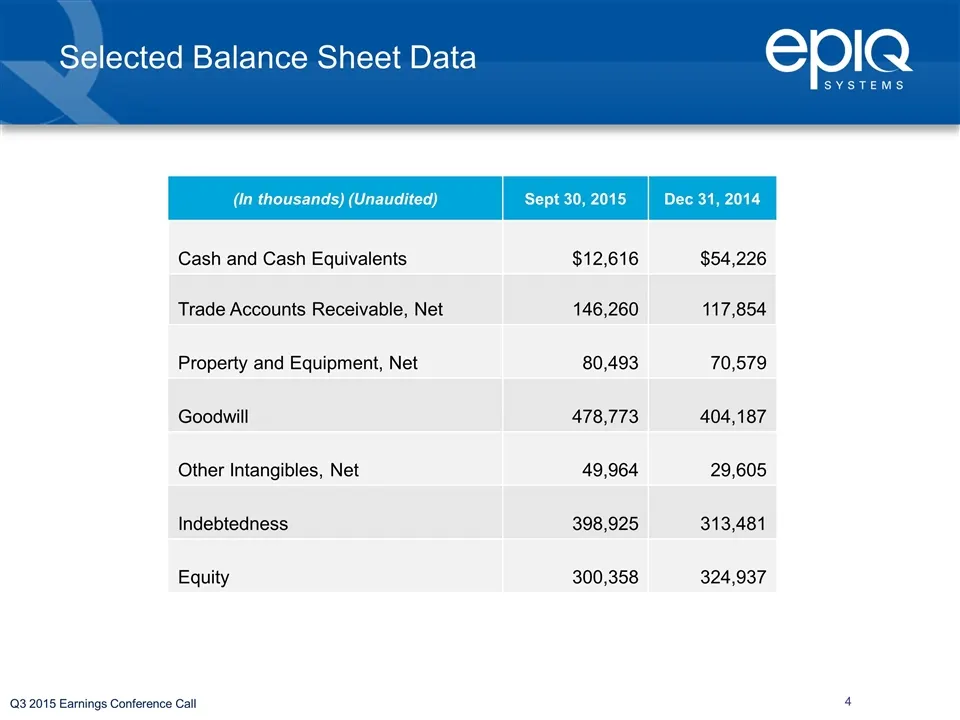
Q3 2015 Earnings Conference Call (In thousands) (Unaudited) Sept 30, 2015 Dec 31, 2014 Cash and Cash Equivalents $12,616 $54,226 Trade Accounts Receivable, Net 146,260 117,854 Property and Equipment, Net 80,493 70,579 Goodwill 478,773 404,187 Other Intangibles, Net 49,964 29,605 Indebtedness 398,925
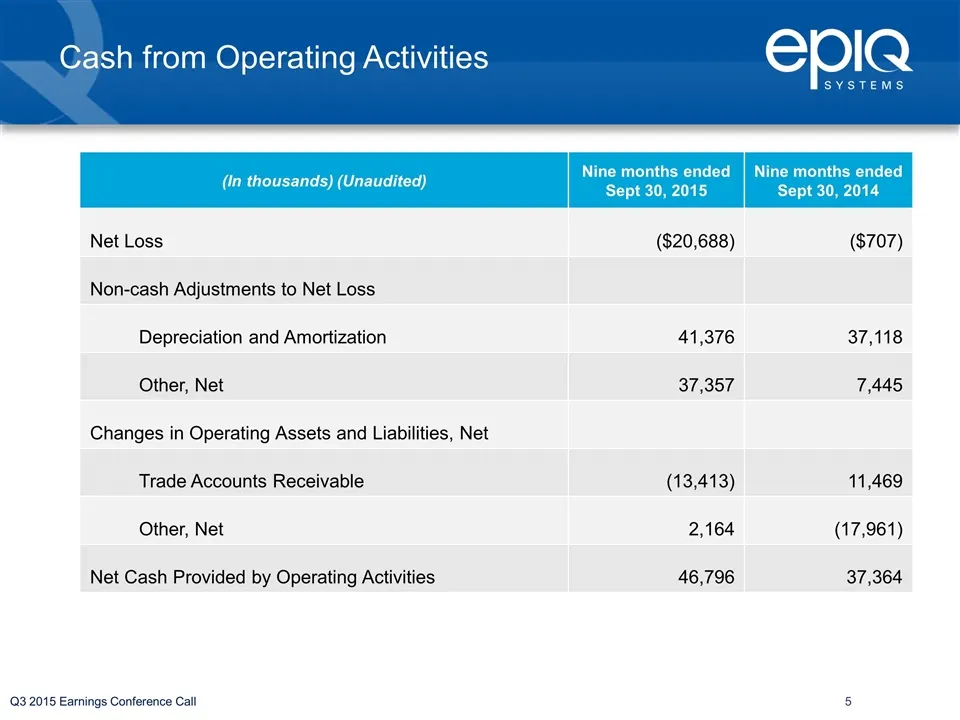
Slide 5: Cash from Operating Activities
Q3 2015 Earnings Conference Call (In thousands) (Unaudited) Nine months ended Sept 30, 2015 Nine months ended Sept 30, 2014 Net Loss ($20,688) ($707) Non-cash Adjustments to Net Loss Depreciation and Amortization 41,376 37,118 Other, Net 37,357 7,445 Changes in Operating Assets and Liabilities, Net
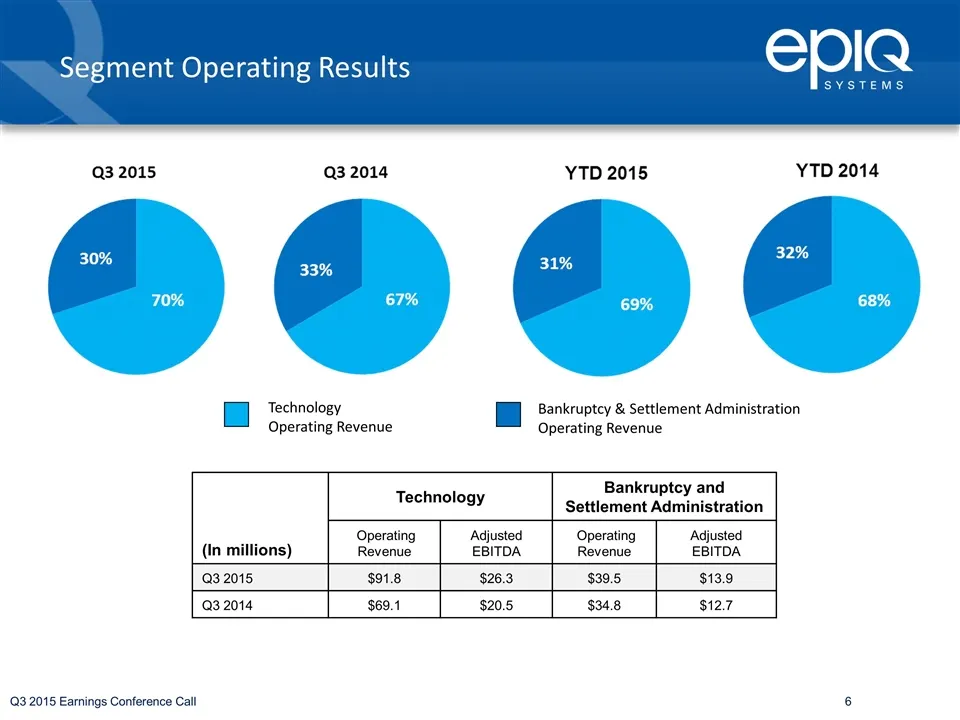
Slide 6: Segment Operating Results
Q3 2015 Earnings Conference Call Segment Operating Results Technology Operating Revenue Bankruptcy & Settlement Administration Operating Revenue (In millions) Technology Bankruptcy and Settlement Administration Operating Revenue Adjusted EBITDA Operating Revenue Adjusted EBITDA Q3 2015 $91.8 $26.3 $
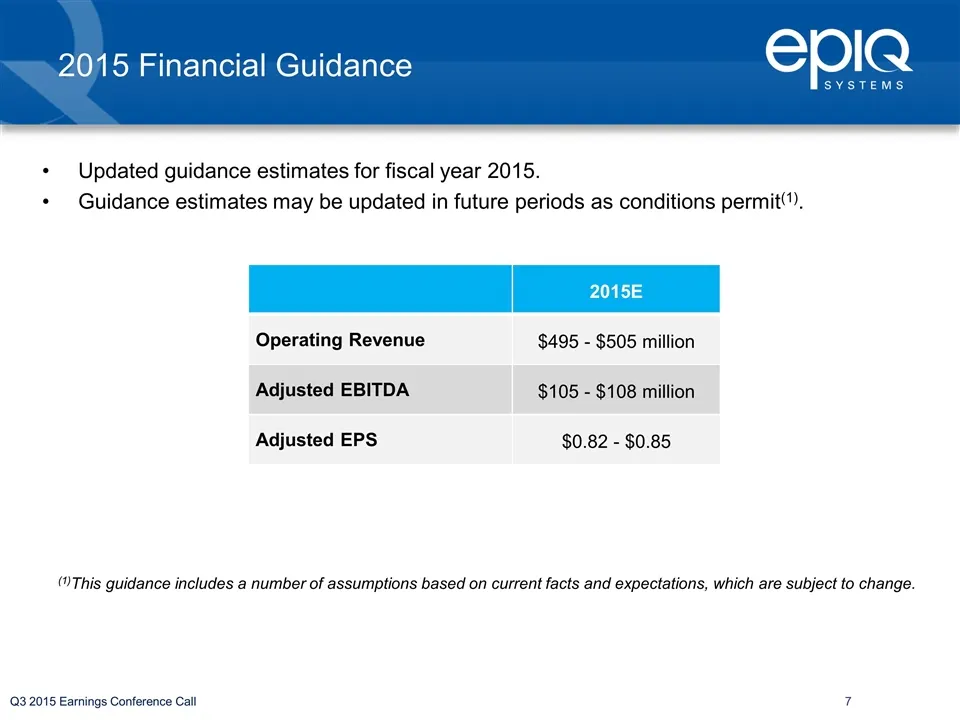
Slide 7: 2015 Financial Guidance
2015 Financial Guidance Updated guidance estimates for fiscal year 2015. Guidance estimates may be updated in future periods as conditions permit(1). 2015E Operating Revenue $495 - $505 million Adjusted EBITDA $105 - $108 million Adjusted EPS $0.82 - $0.85 (1)This guidance includes a number of assum
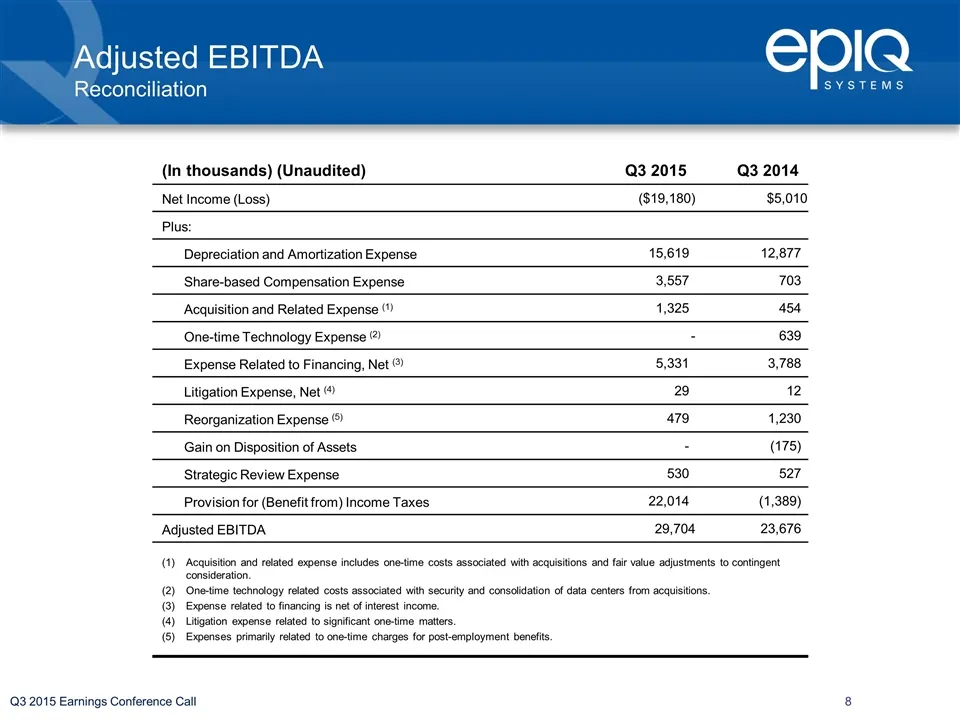
Slide 8: Adjusted EBITDA Reconciliation
Q3 2015 Earnings Conference Call (In thousands) (Unaudited) Q3 2015 Q3 2014 Net Income (Loss) ($19,180) $5,010 Plus: Depreciation and Amortization Expense 15,619 12,877 Share-based Compensation Expense 3,557 703 Acquisition and Related Expense (1) 1,325 454 One-time Technology Expense (2) - 639 Expe
Slide 9: Adjusted Net Income Reconciliation
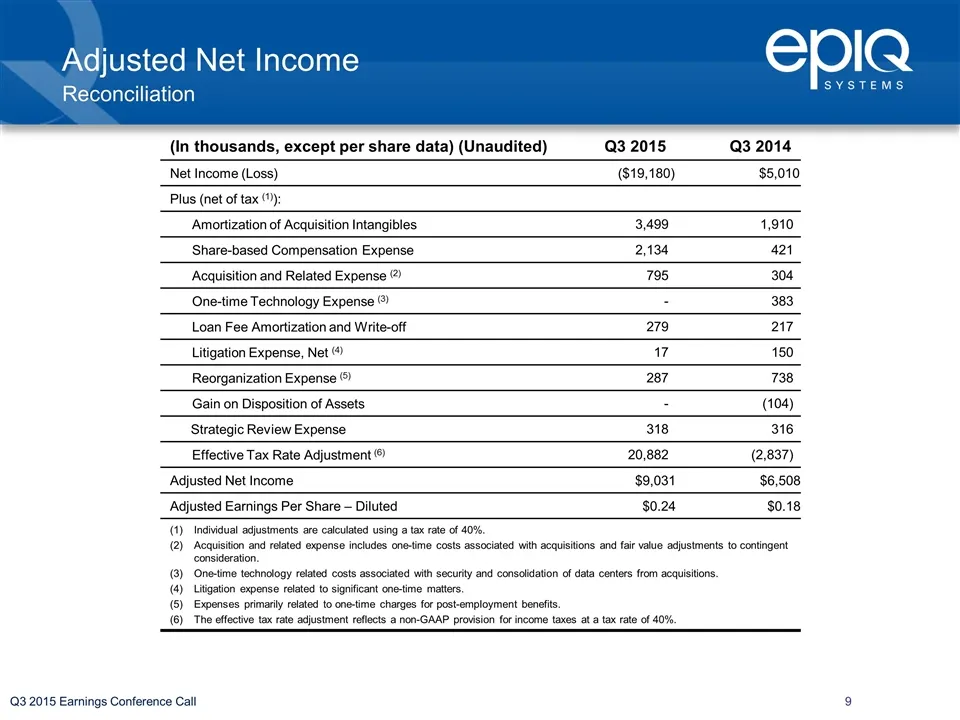
Q3 2015 Earnings Conference Call (In thousands, except per share data) (Unaudited) Q3 2015 Q3 2014 Net Income (Loss) ($19,180) $5,010 Plus (net of tax (1)): Amortization of Acquisition Intangibles 3,499 1,910 Share-based CompensationExpense 2,134 421 Acquisition and Related Expense (2) 795 304 One-t
Slide 10: Diluted Adjusted Earnings Per Share Calculation
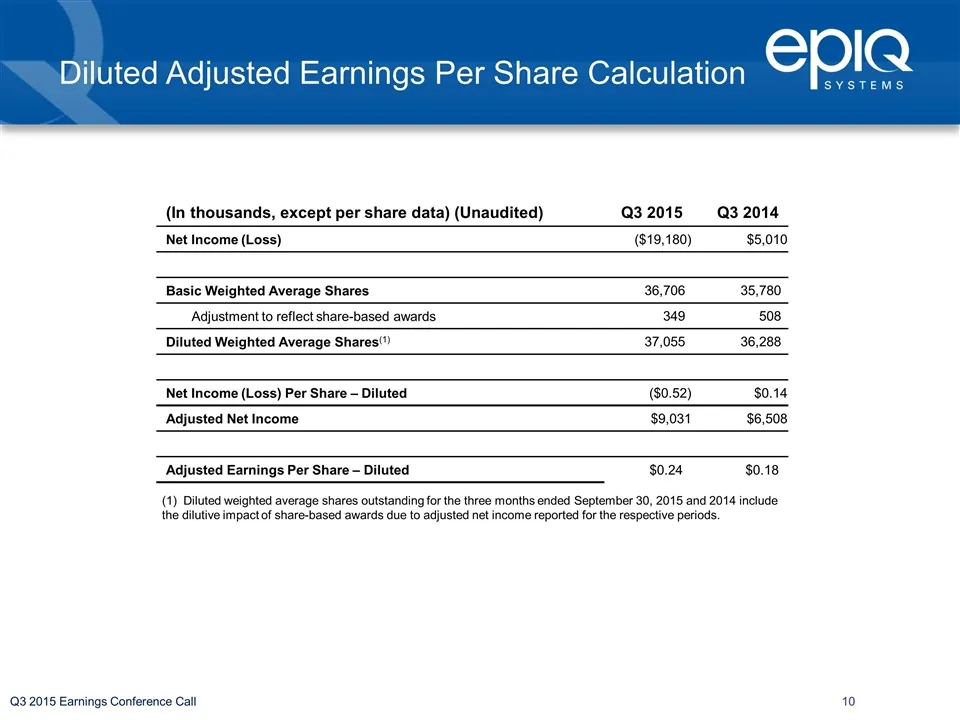
Q3 2015 Earnings Conference Call (In thousands, except per share data) (Unaudited) Q3 2015 Q3 2014 Net Income (Loss) ($19,180) $5,010 Basic Weighted Average Shares 36,706 35,780 Adjustment to reflect share-based awards 349 508 Diluted Weighted Average Shares(1) 37,055 36,288 Net Income (Loss) Per Sh
Slide 11: Investor Contacts
Investor Contacts Kelly Bailey Epiq Systems (913) 621-9500 IR@epiqsystems.com Chris Eddy Catalyst Global (212) 924-9800 epiq@catalyst-ir.com NASDAQ: EPIQ www.epiqsystems.com
Source: SEC EDGAR · 8-K filed Nov 3, 2015
More decks from EPIQ Systems Inc
 Q2 2016 Earnings Presentation12 slides · Aug 9, 2016
 Q1 2016 Earnings Presentation12 slides · May 3, 2016
 FY2015 Earnings Presentation13 slides · Mar 1, 2016
 Q2 2015 Earnings Presentation11 slides · Aug 3, 2015
 Q1 2015 Earnings Presentation11 slides · Apr 28, 2015
 FY2014 Earnings Presentation11 slides · Mar 2, 2015