EPIQ Systems — Q2 2015 Earnings Presentation
11 slides from EPIQ Systems's earnings presentation, Aug 3, 2015
Slide 1: Second Quarter 2015 Earnings Conference Call
Exhibit 99.2 Second Quarter 2015 Earnings Conference Call August 3, 2015 NASDAQ: EPIQ www.epiqsystems.com
Slide 2: Forward Looking Statements & Use of Non-GAAP Measures
Forward Looking Statements & Use of Non-GAAP Measures This presentation includes forward-looking statements. These forward-looking statements include, but are not limited to any projection or expectation of earnings, revenue or other financial items; the plans, strategies and objectives of managemen
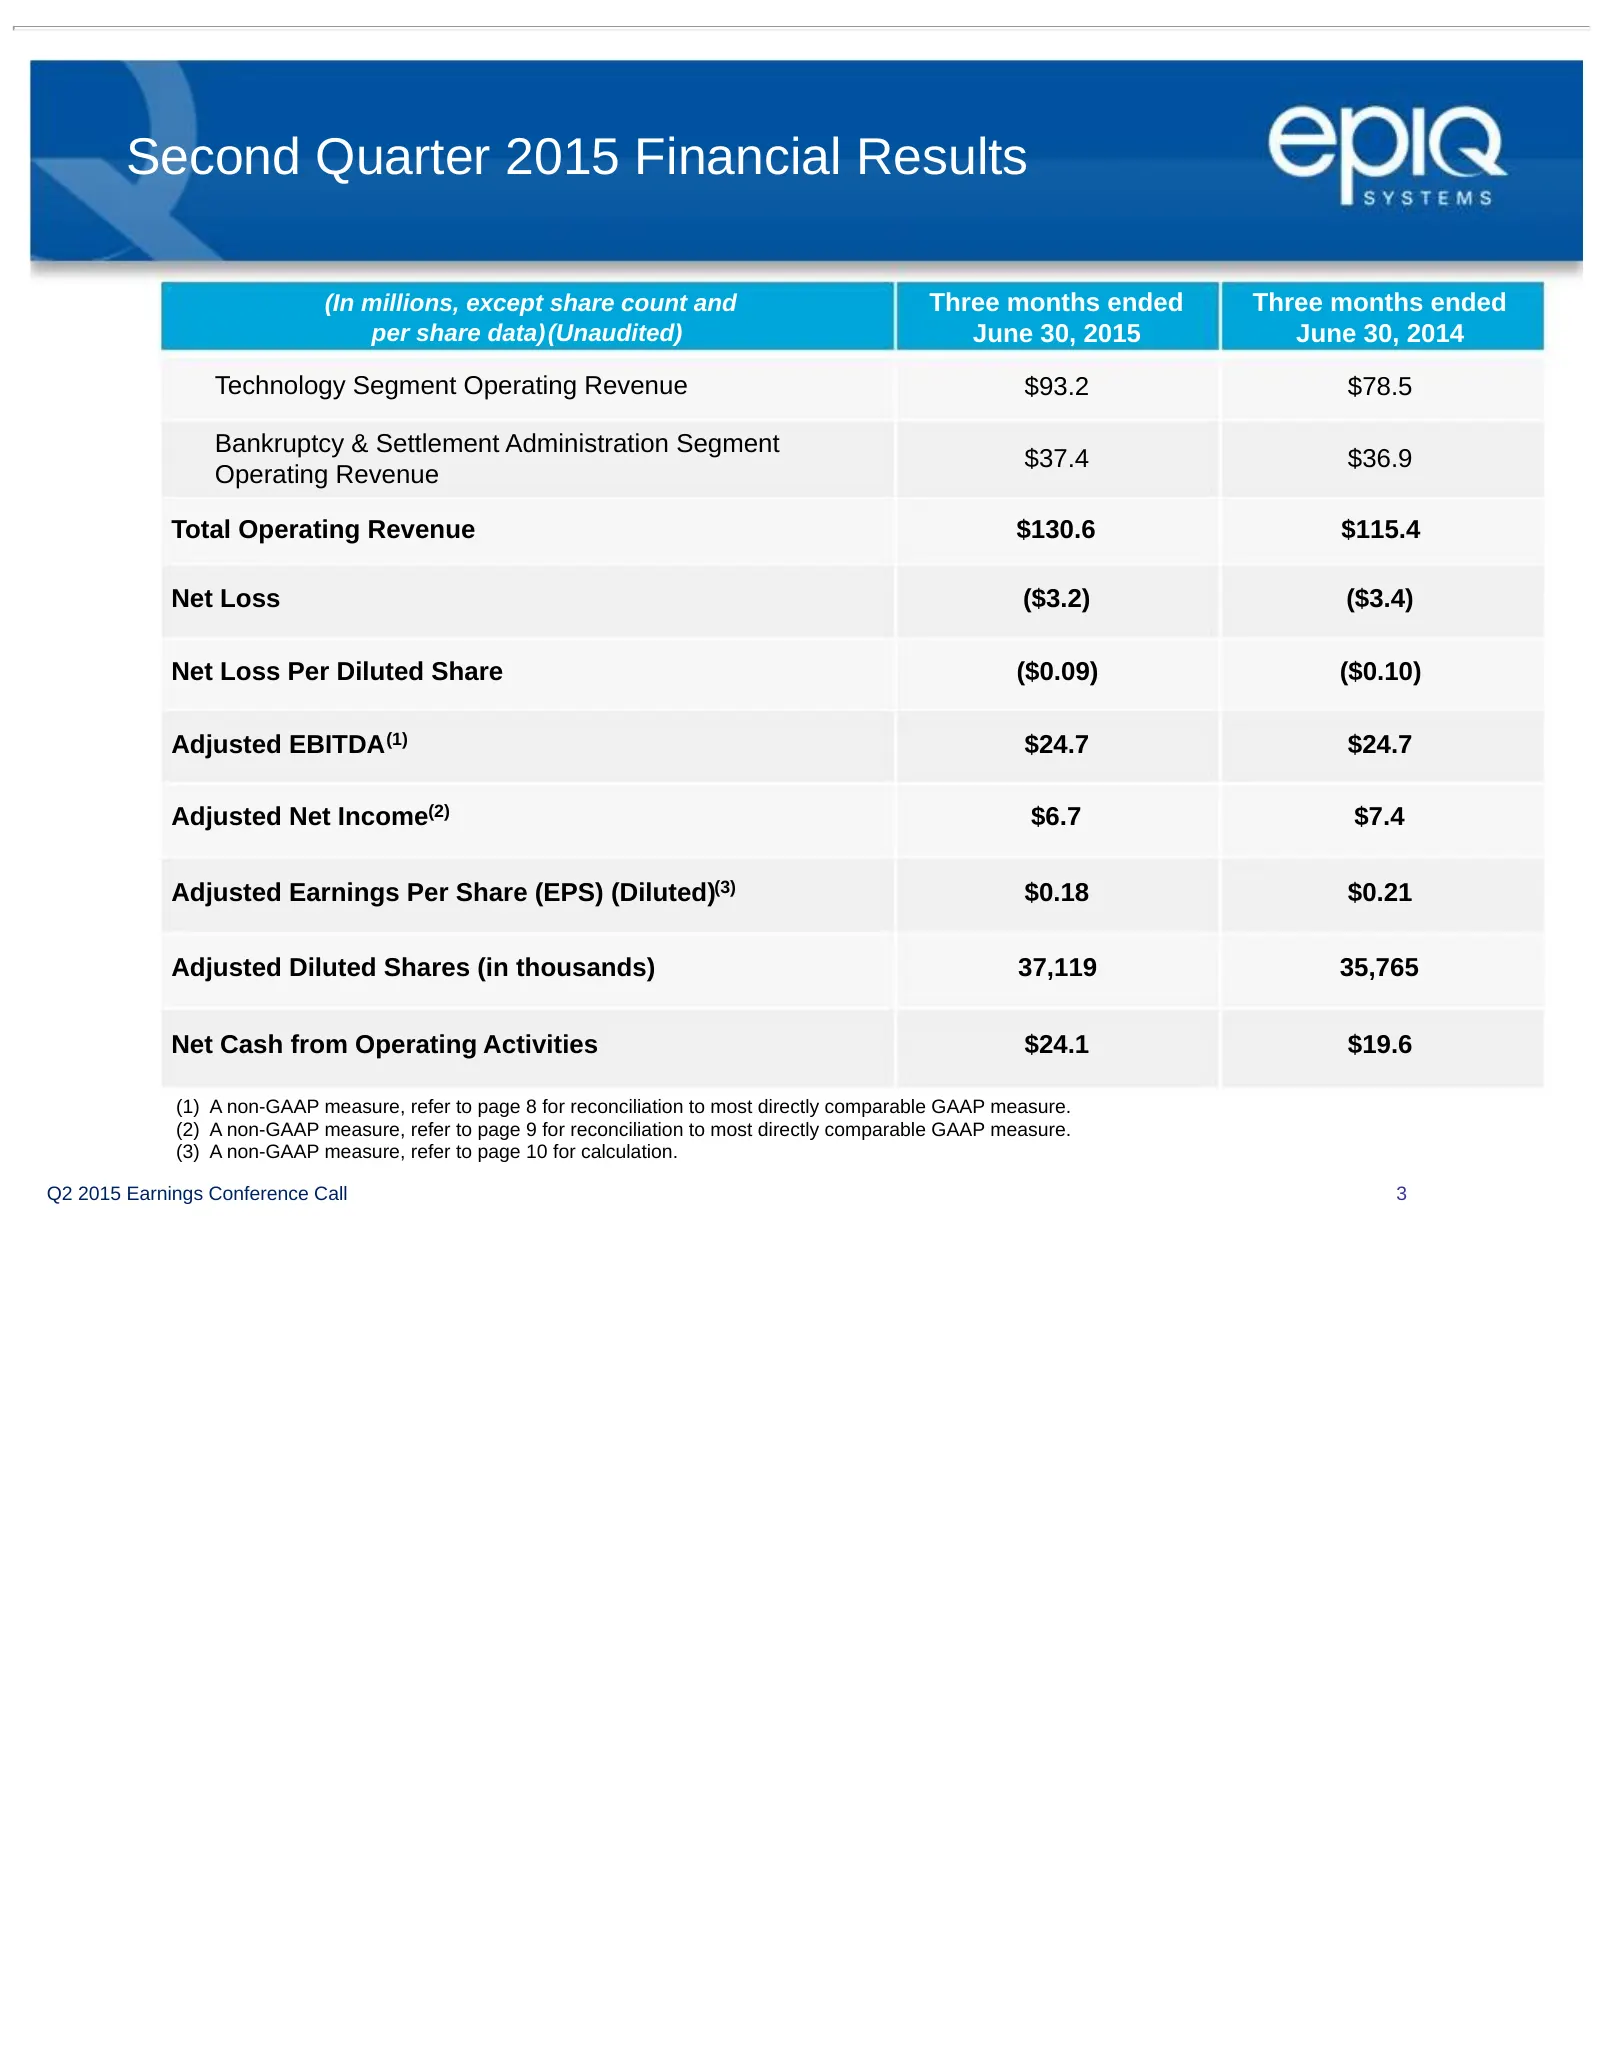
Slide 3: Second Quarter 2015 Financial Results
Second Quarter 2015 Financial Results (In millions, except share count and Three months ended Three months ended per share data)(Unaudited) June 30, 2015 June 30, 2014 Technology Segment Operating Revenue $93.2 $78.5 Bankruptcy & Settlement Administration Segment $37.4 $36.9 Operating Revenue Total
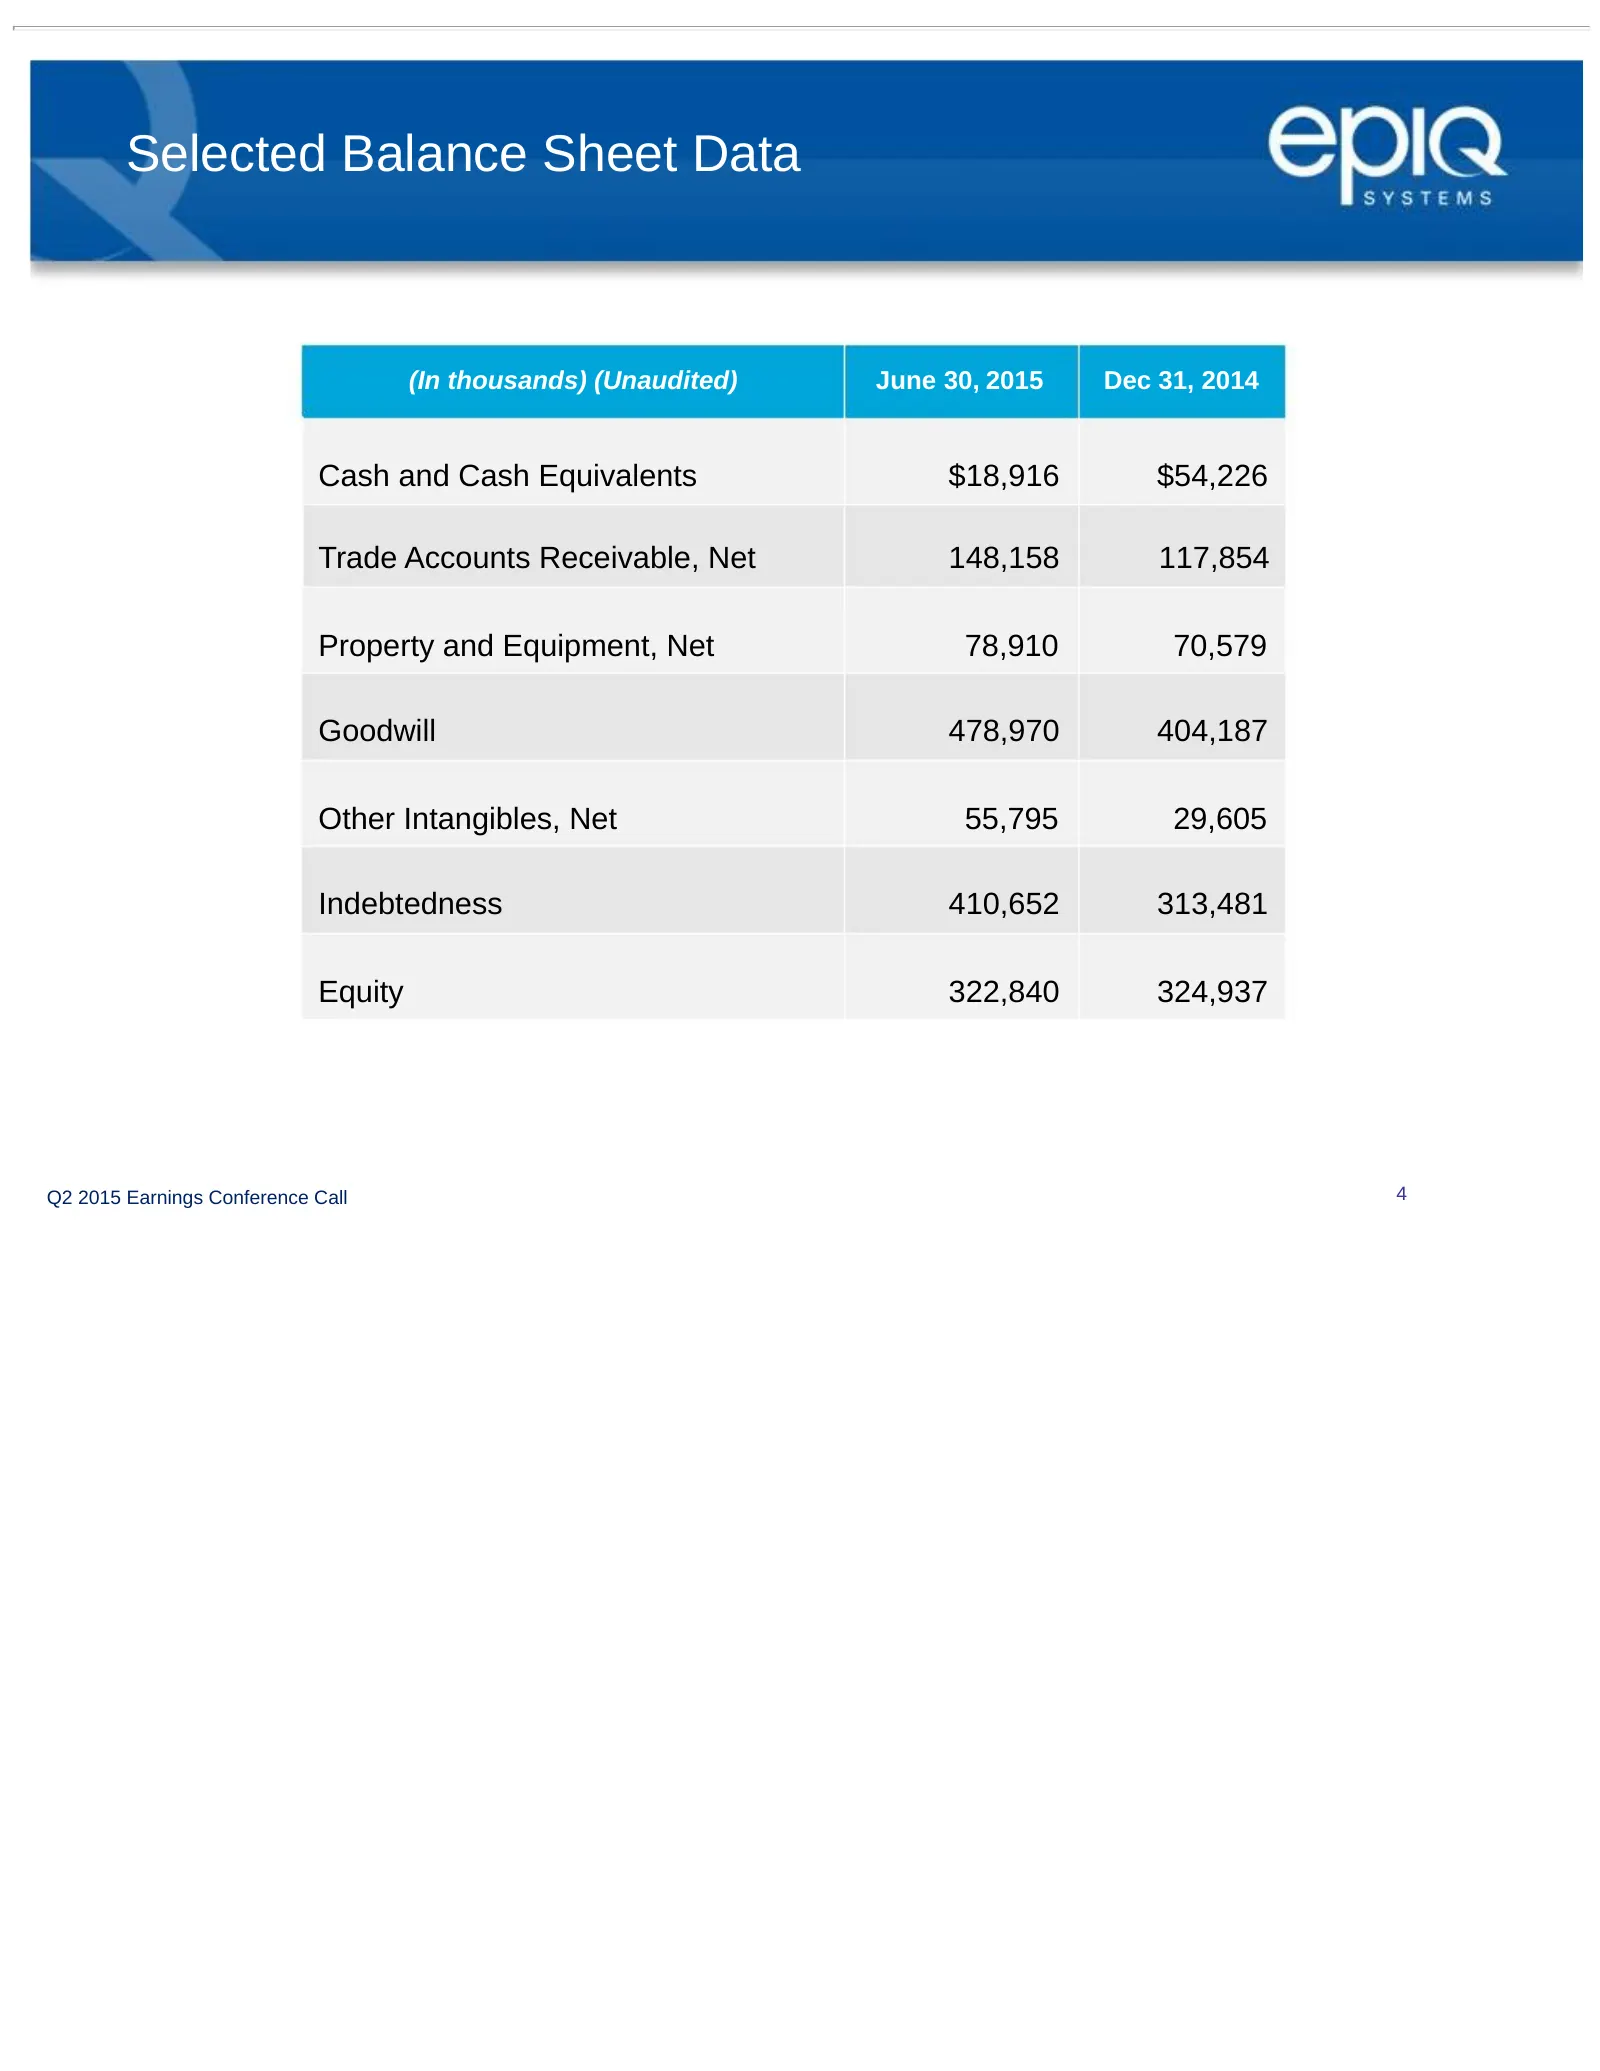
Slide 4: Selected Balance Sheet Data
Selected Balance Sheet Data (In thousands) (Unaudited) June 30, 2015 Dec 31, 2014 Cash and Cash Equivalents $18,916 $54,226 Trade Accounts Receivable, Net 148,158 117,854 Property and Equipment, Net 78,910 70,579 Goodwill 478,970 404,187 Other Intangibles, Net 55,795 29,605 Indebtedness 410,652 313,
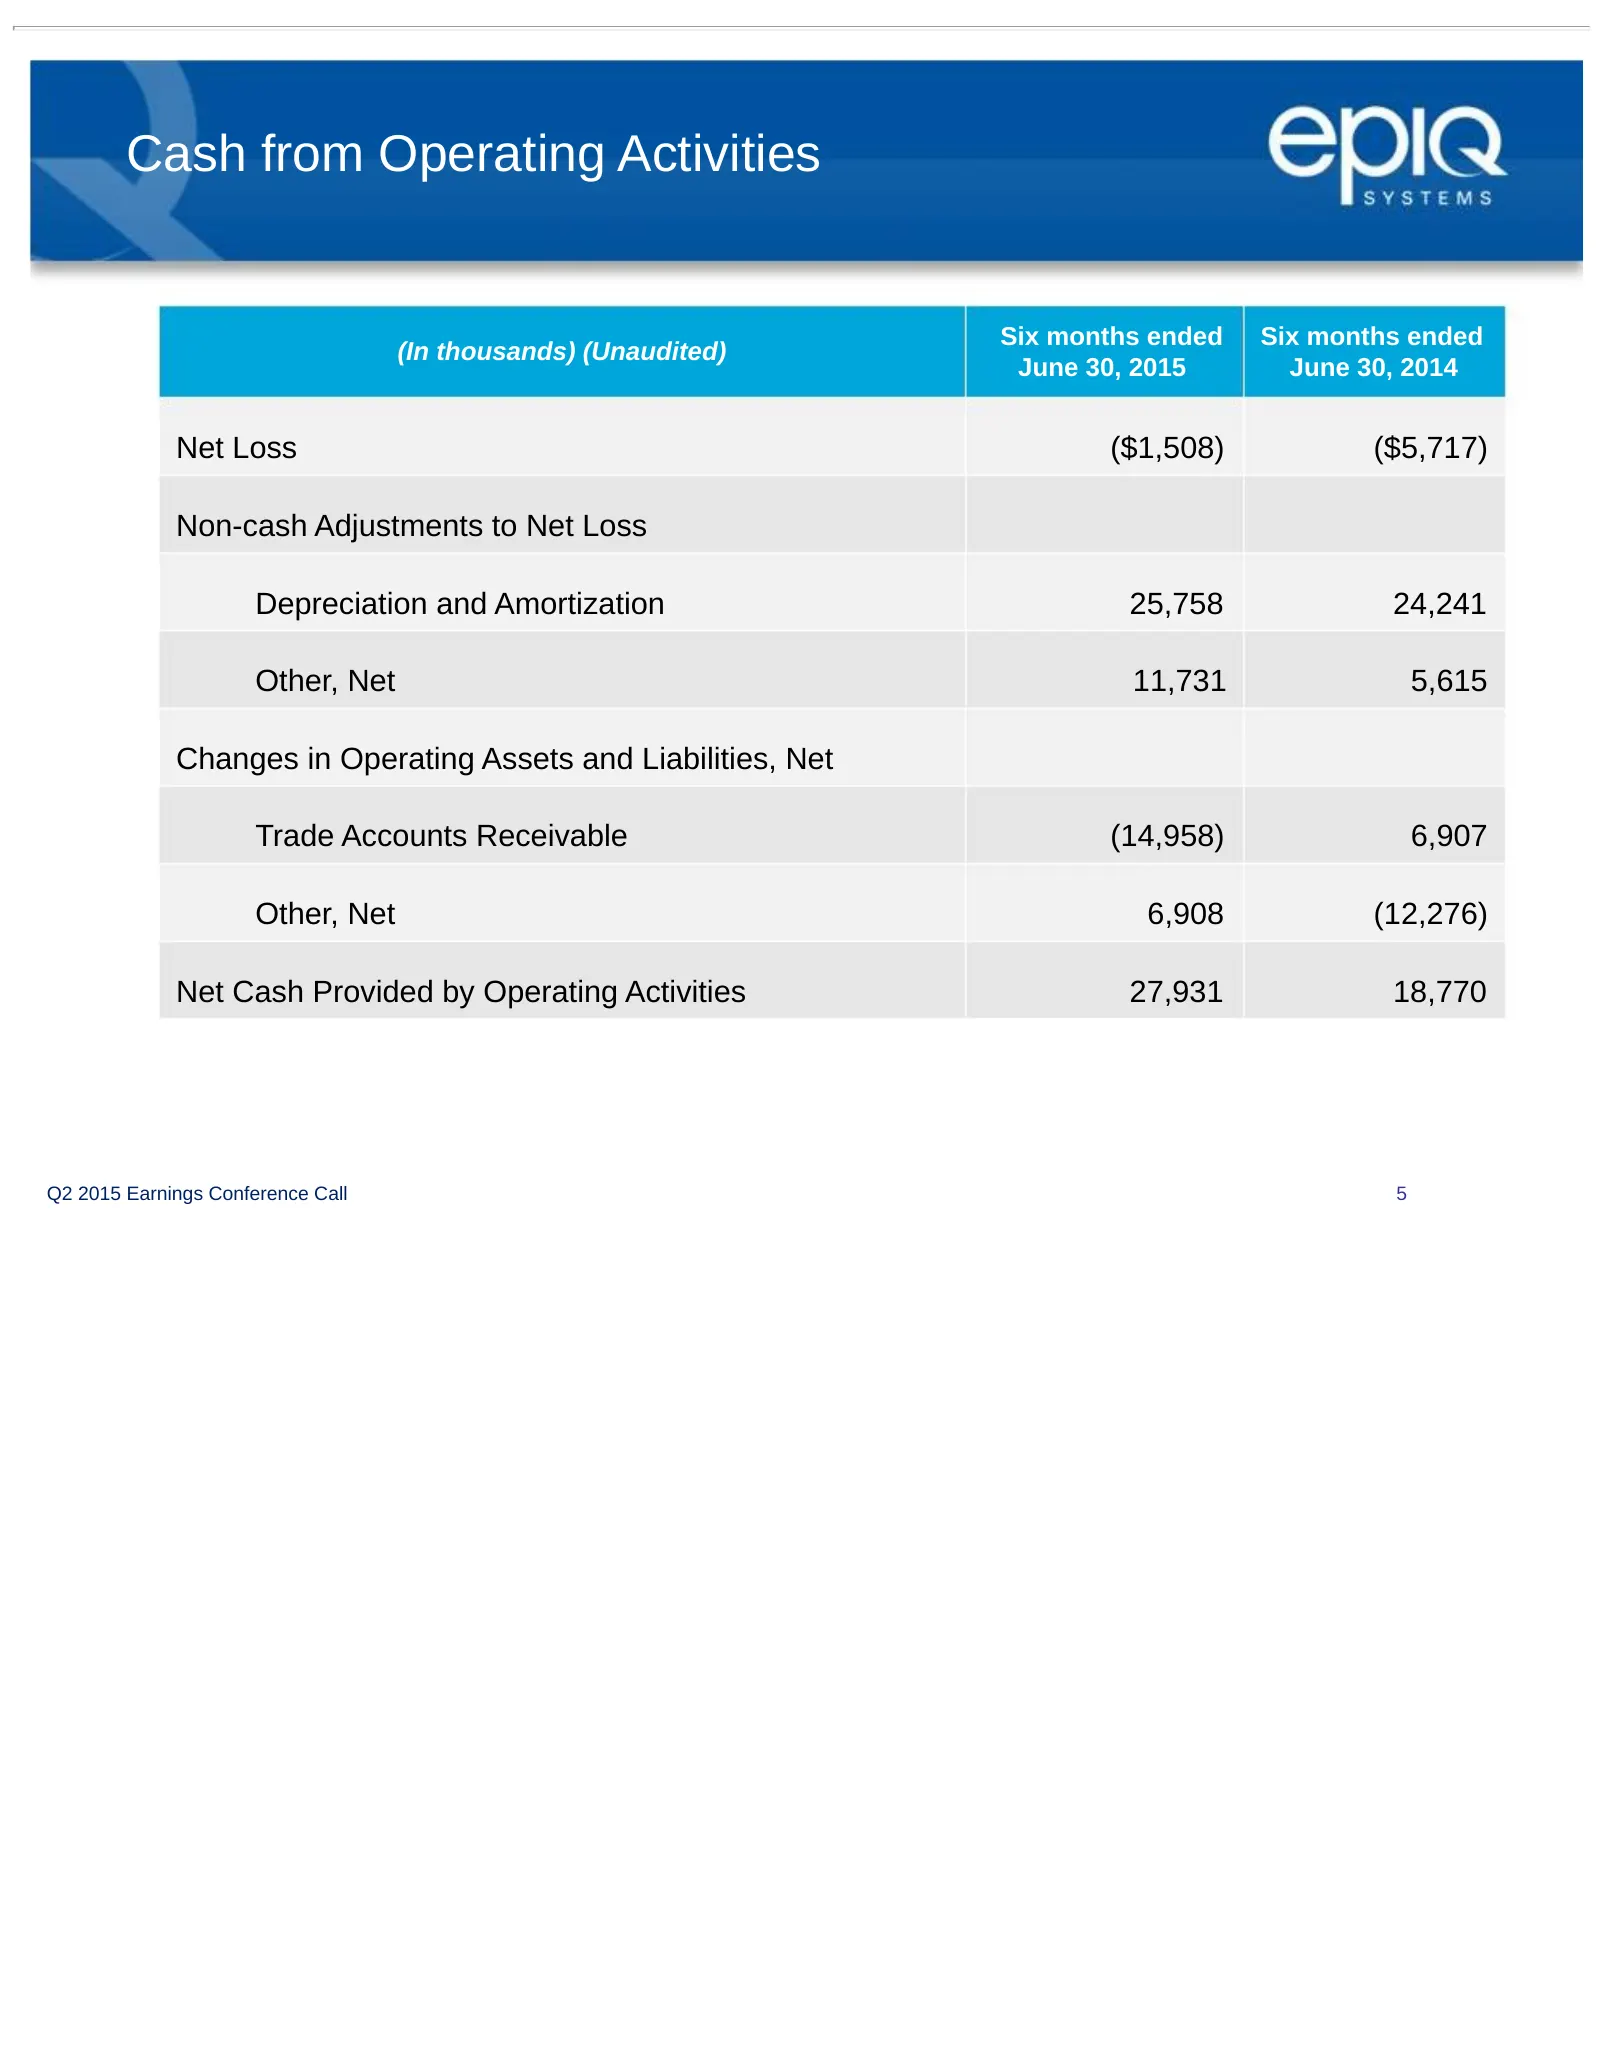
Slide 5: Cash from Operating Activities
Cash from Operating Activities Six months ended Six months ended (In thousands) (Unaudited) June 30, 2015 June 30, 2014 Net Loss ($1,508) ($5,717) Non-cash Adjustments to Net Loss Depreciation and Amortization 25,758 24,241 Other, Net 11,731 5,615 Changes in Operating Assets and Liabilities, Net Tra
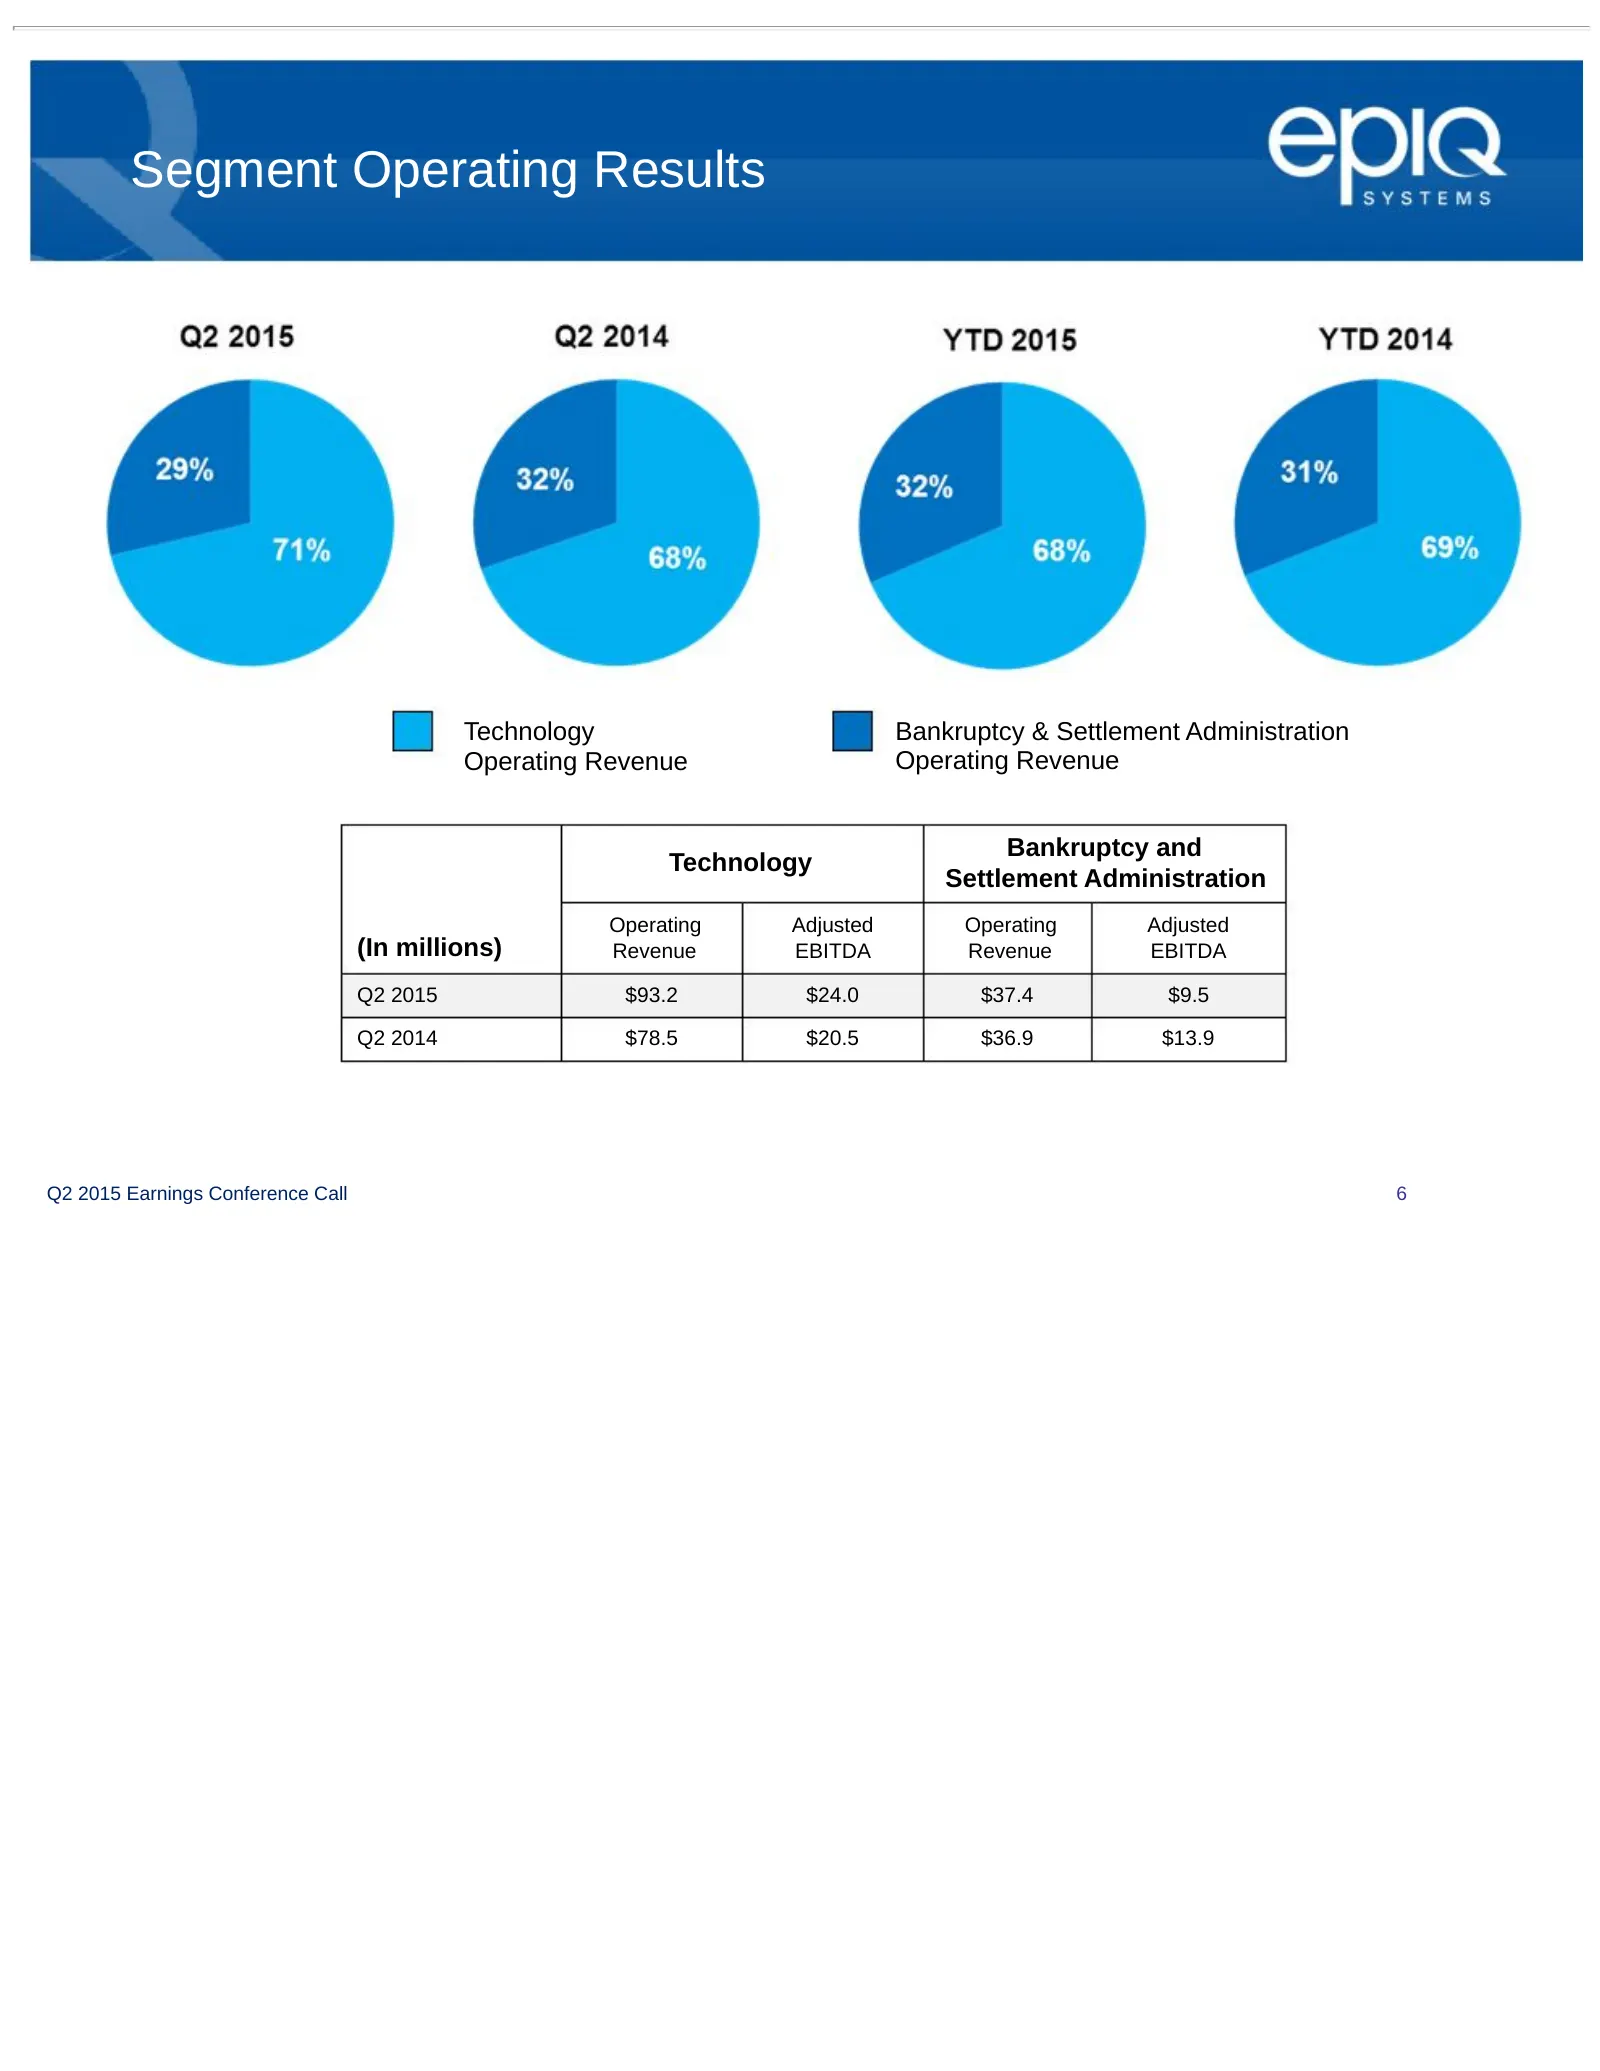
Slide 6: Segment Operating Results
Segment Operating Results Technology Bankruptcy & Settlement Administration Operating Revenue Operating Revenue Bankruptcy and Technology Settlement Administration Operating Adjusted Operating Adjusted (In millions) Revenue EBITDA Revenue EBITDA Q2 2015 $93.2 $24.0 $37.4 $9.5 Q2 2014 $78.5 $20.5 $36
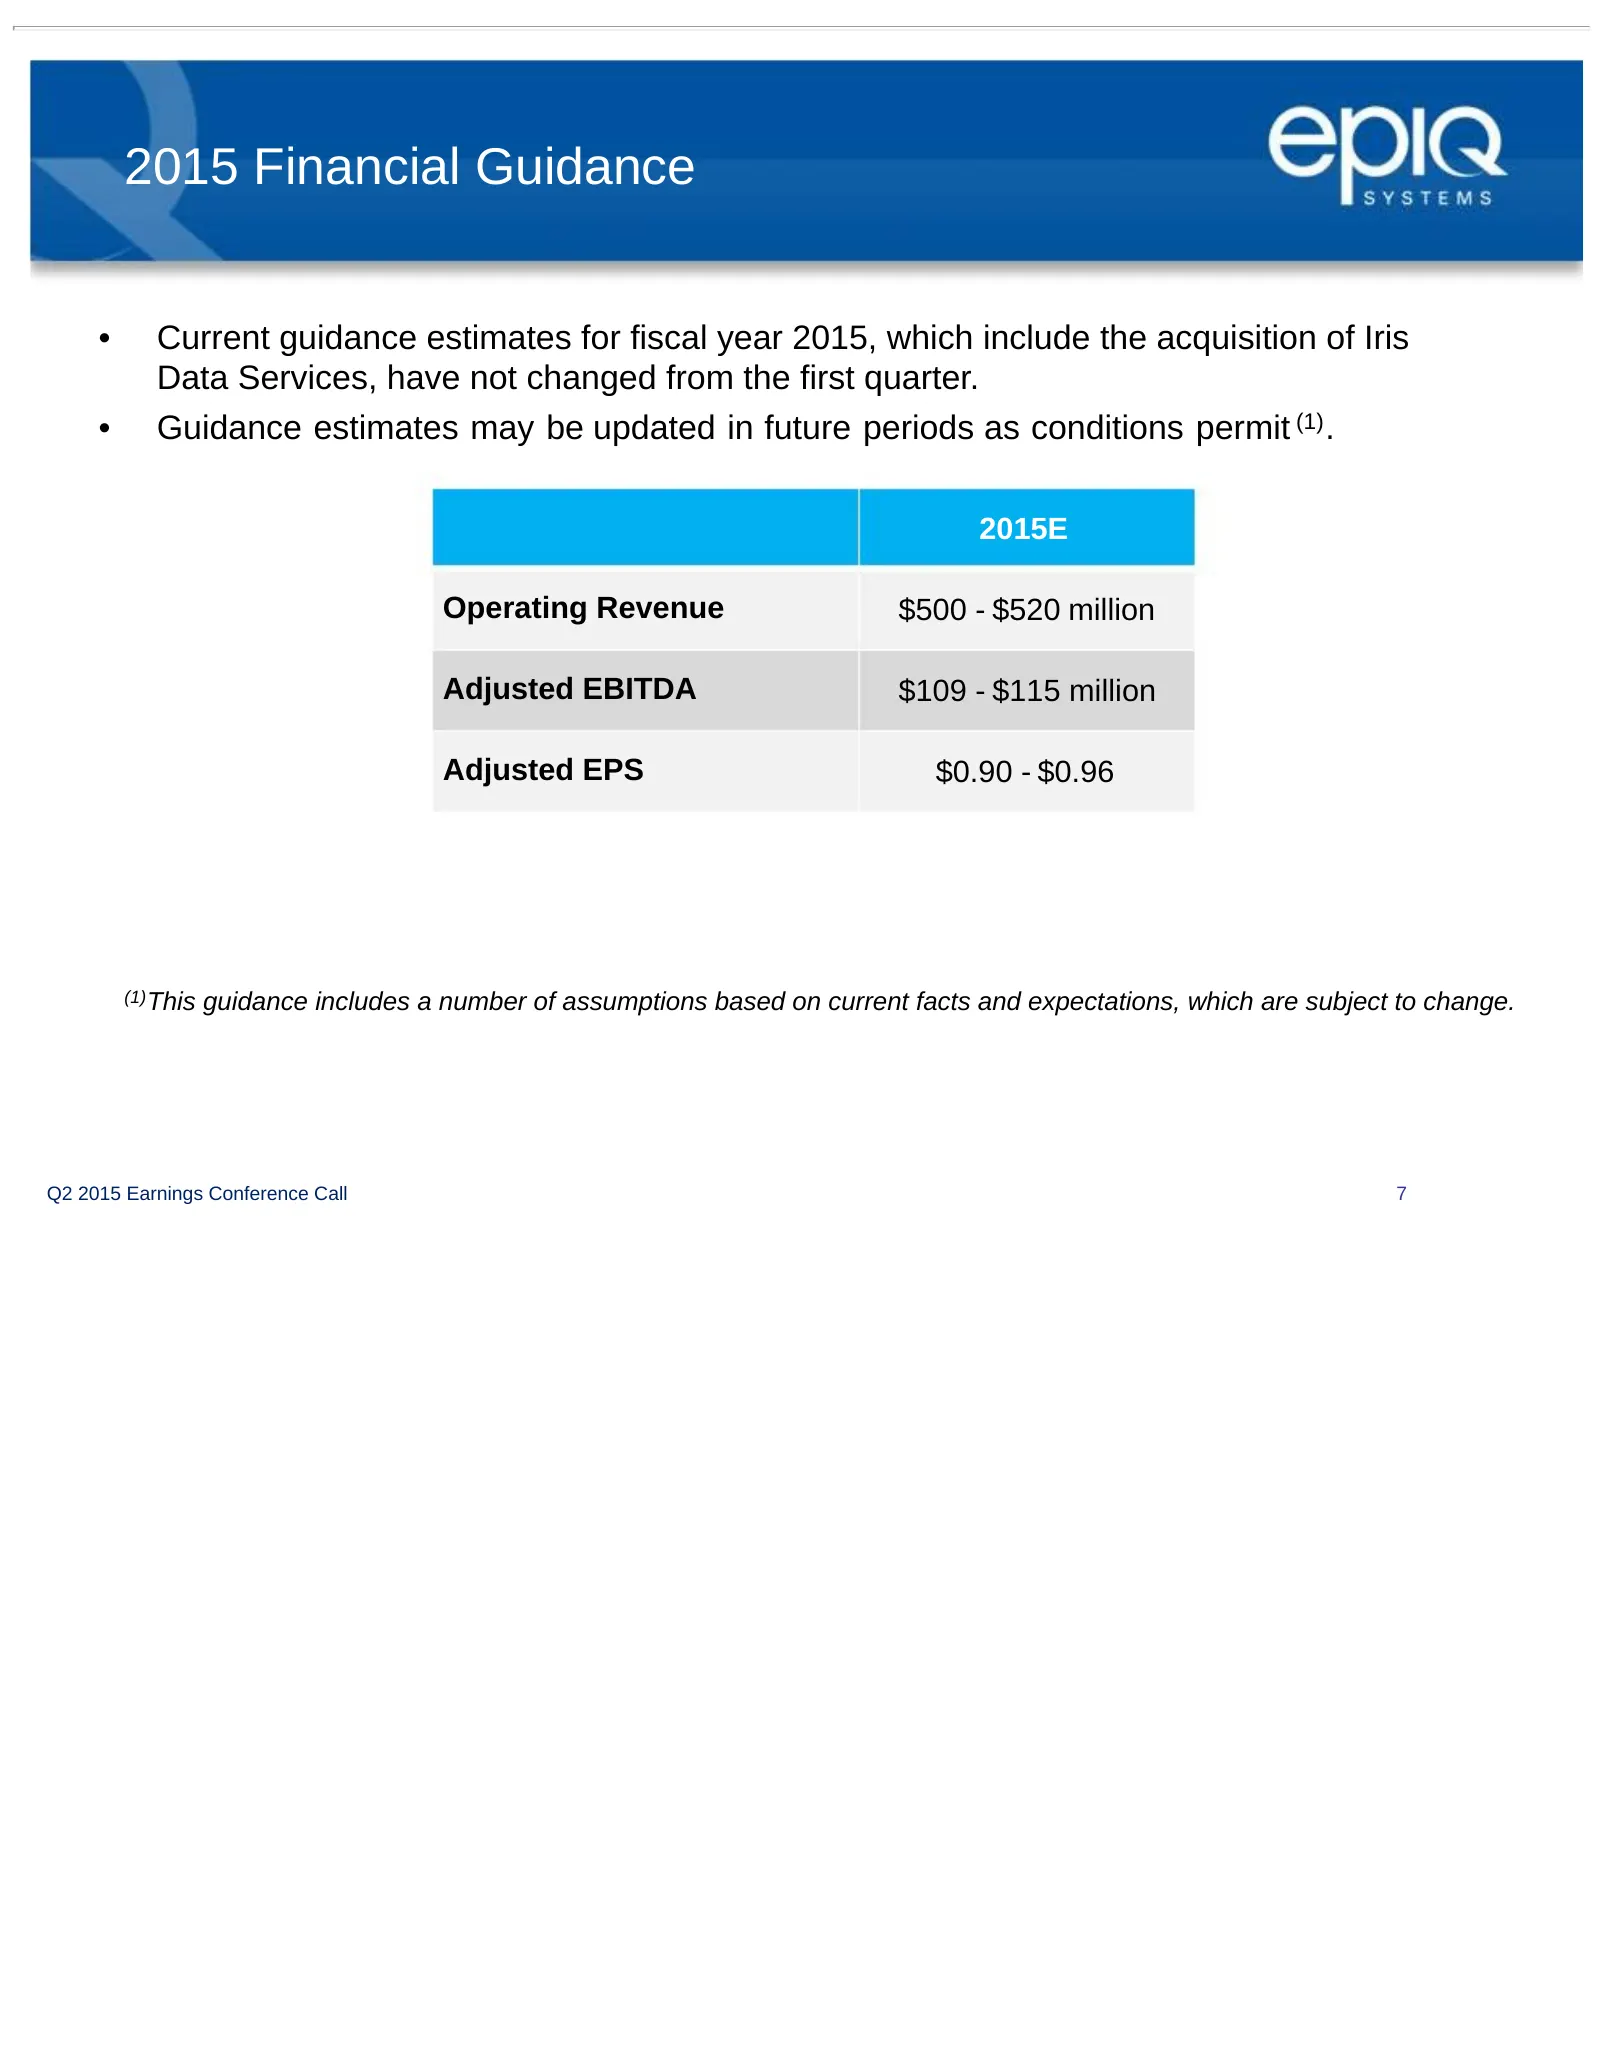
Slide 7: 2015 Financial Guidance
2015 Financial Guidance • Current guidance estimates for fiscal year 2015, which include the acquisition of Iris Data Services, have not changed from the first quarter. • Guidance estimates may be updated in future periods as conditions permit (1) . 2015E Operating Revenue $500 - $520 million Adjust
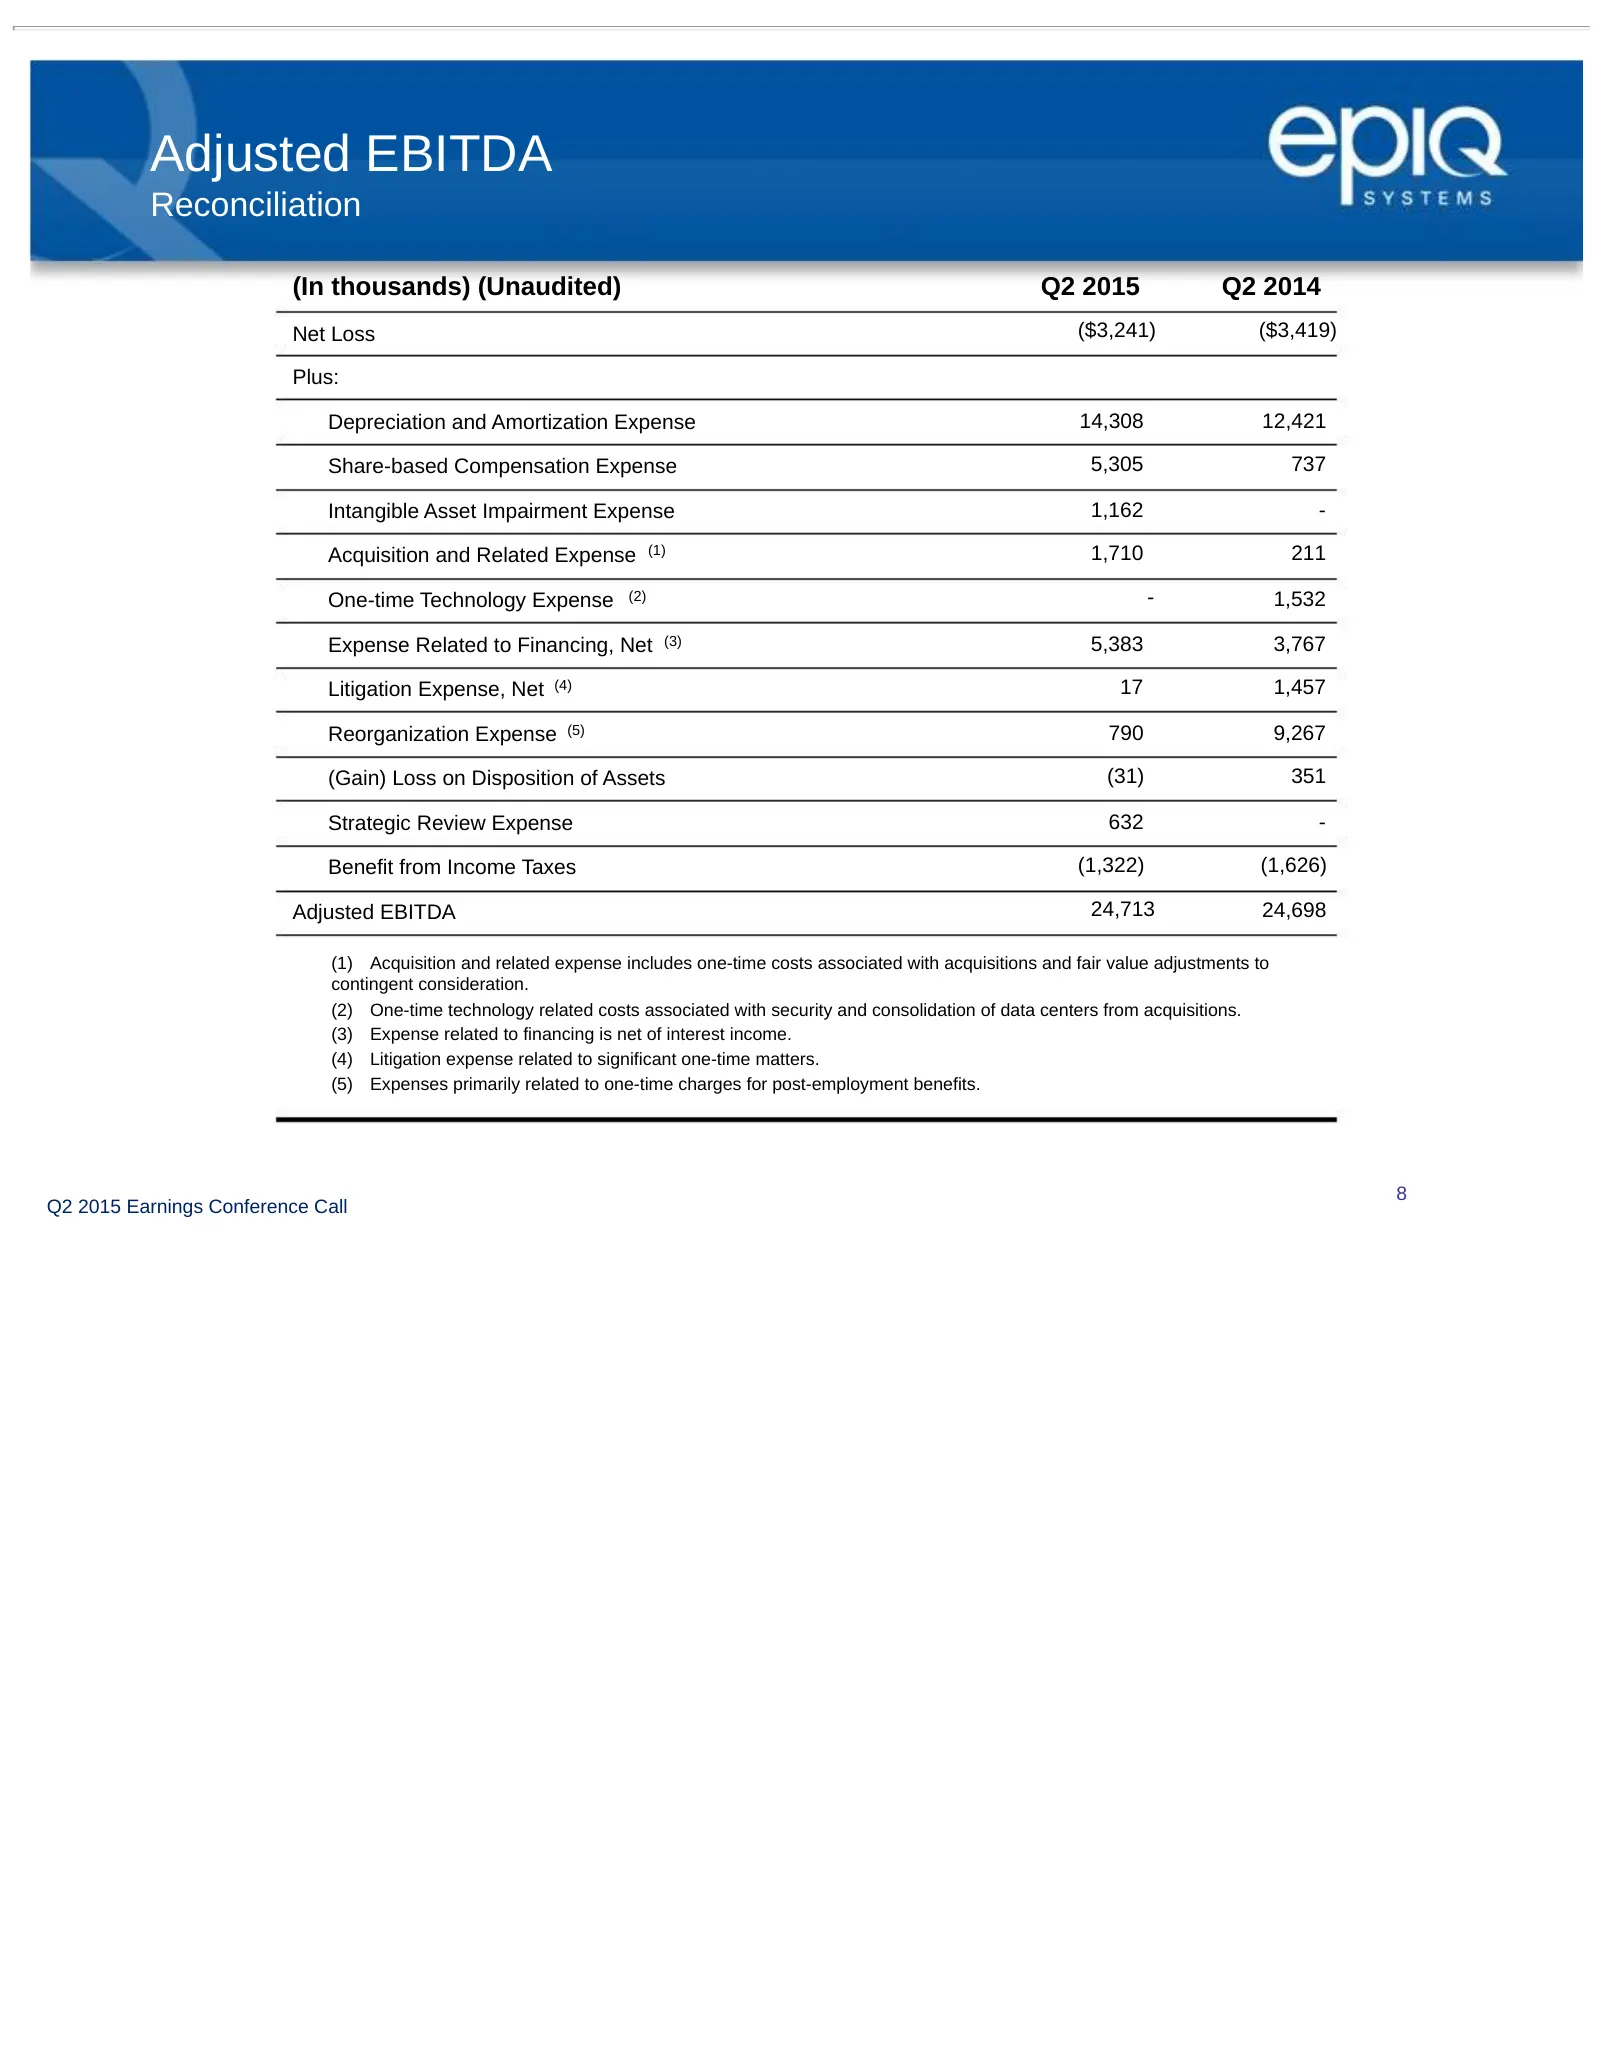
Slide 8: Adjusted EBITDA Reconciliation
Adjusted EBITDA Reconciliation (In thousands) (Unaudited) Q2 2015 Q2 2014 Net Loss ($3,241) ($3,419) Plus: Depreciation and Amortization Expense 14,308 12,421 Share-based Compensation Expense 5,305 737 Intangible Asset Impairment Expense 1,162 - Acquisition and Related Expense (1) 1,710 211 One-time
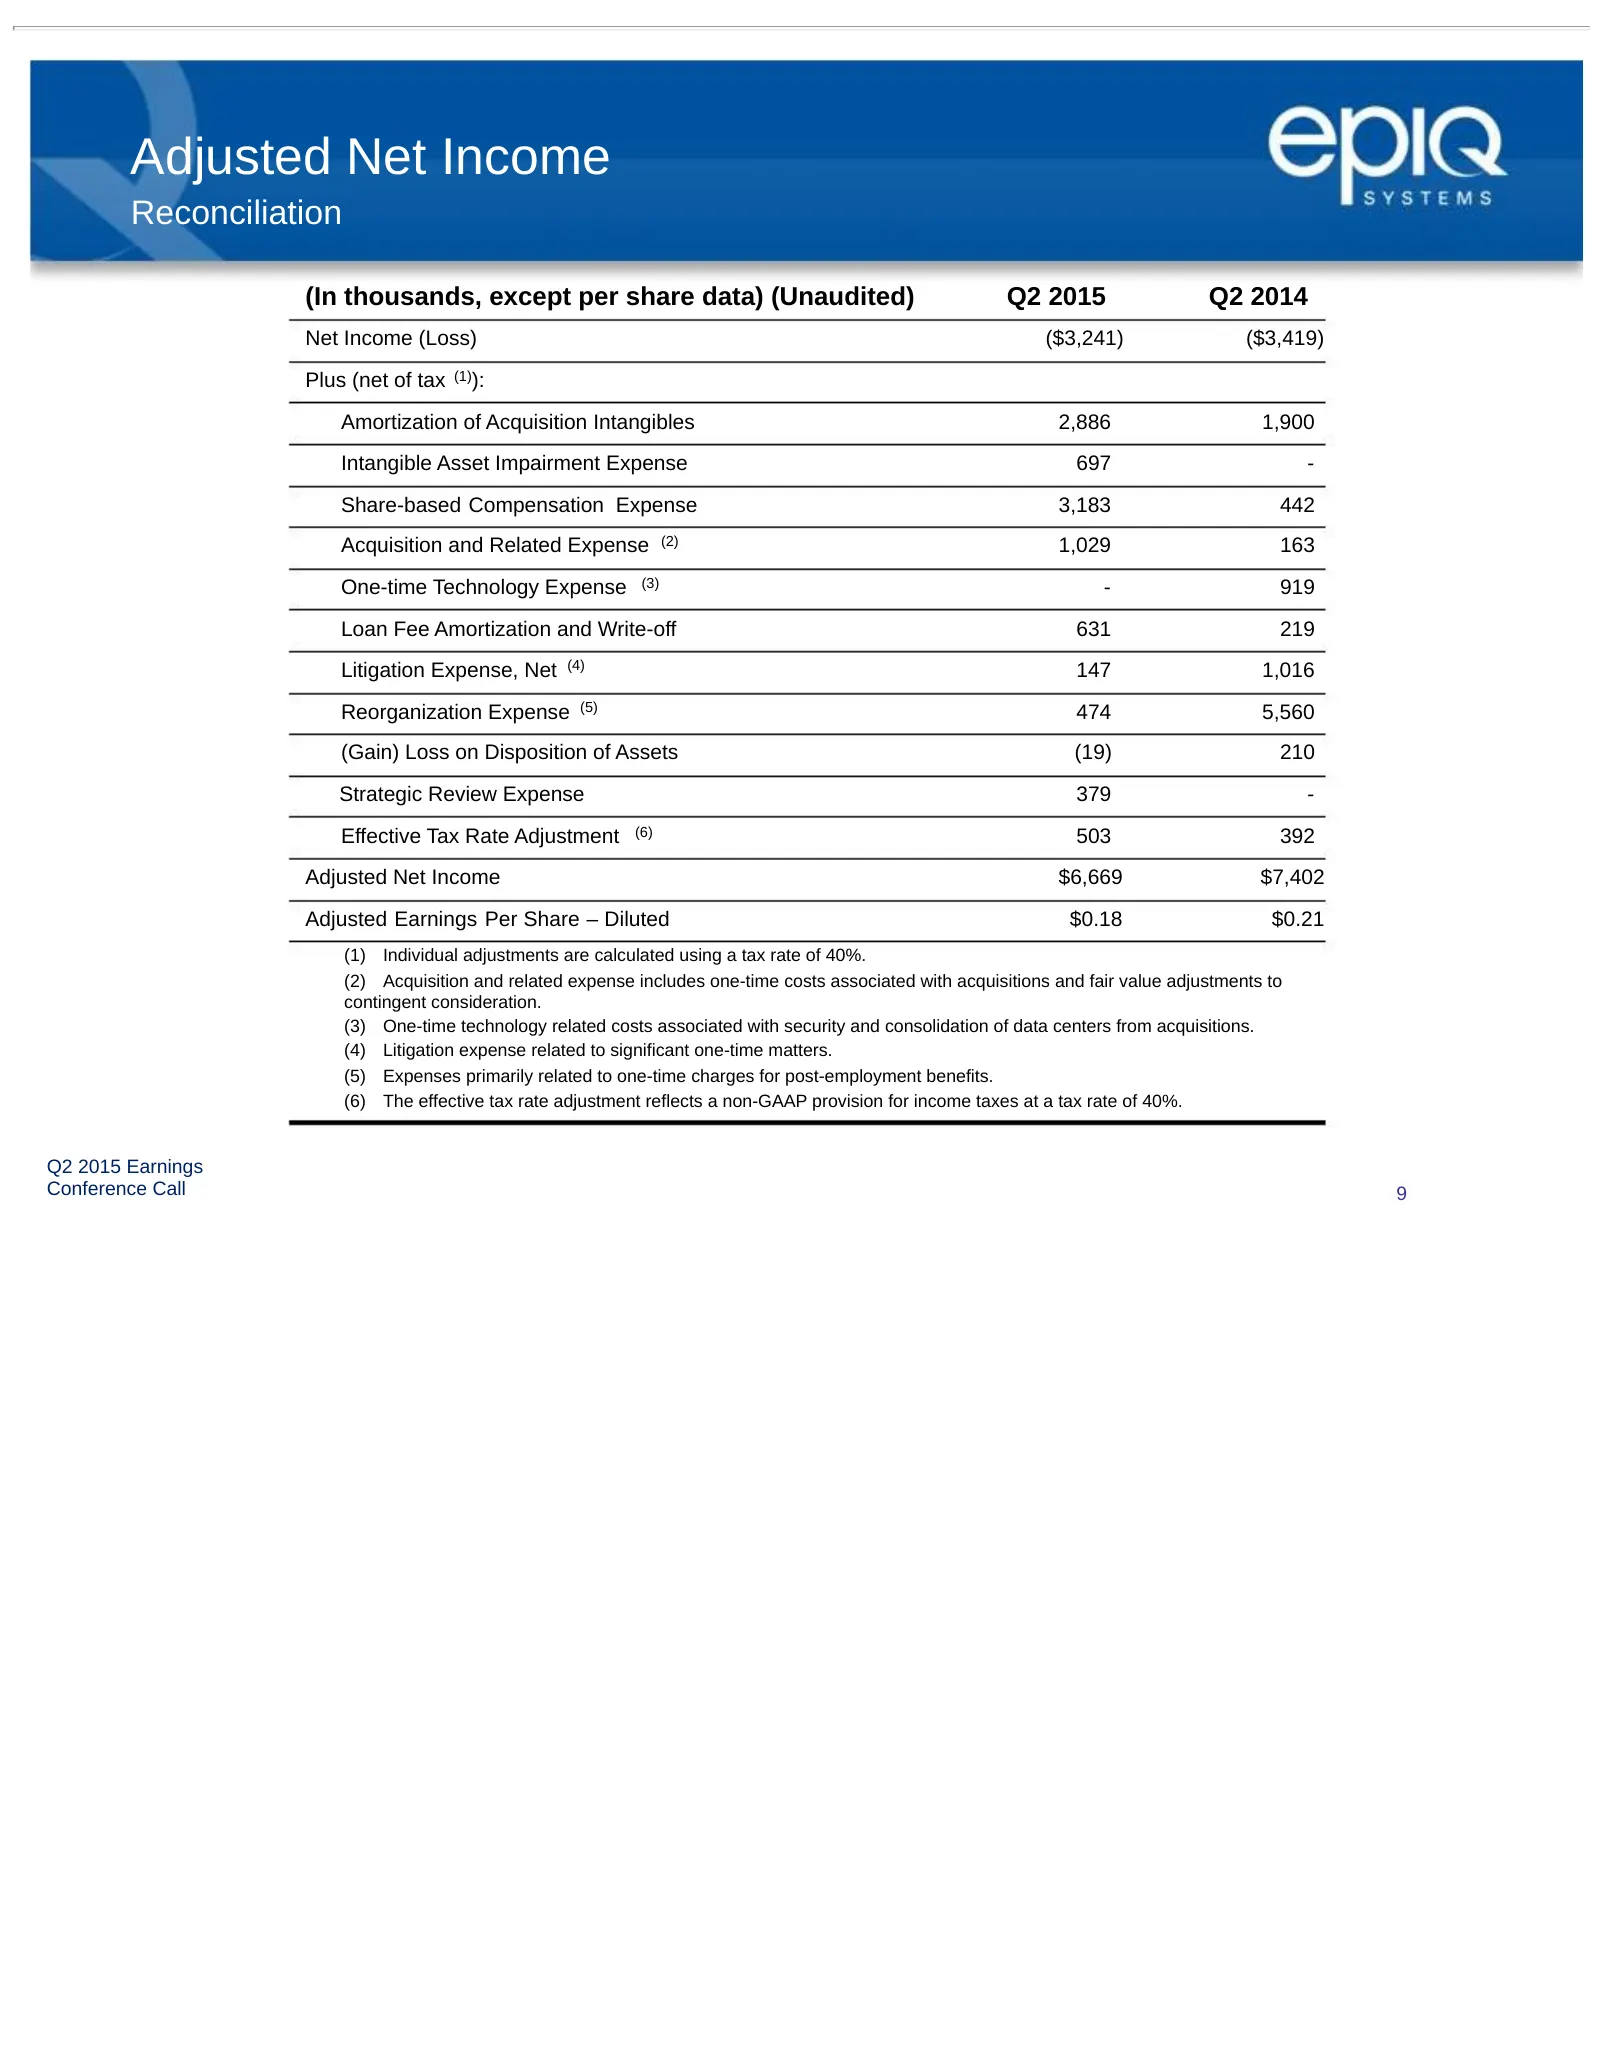
Slide 9: Adjusted Net Income Reconciliation
Adjusted Net Income Reconciliation (In thousands, except per share data) (Unaudited) Q2 2015 Q2 2014 Net Income (Loss) ($3,241) ($3,419) Plus (net of tax (1)): Amortization of Acquisition Intangibles 2,886 1,900 Intangible Asset Impairment Expense 697 - Share-based Compensation Expense 3,183 442 Acq
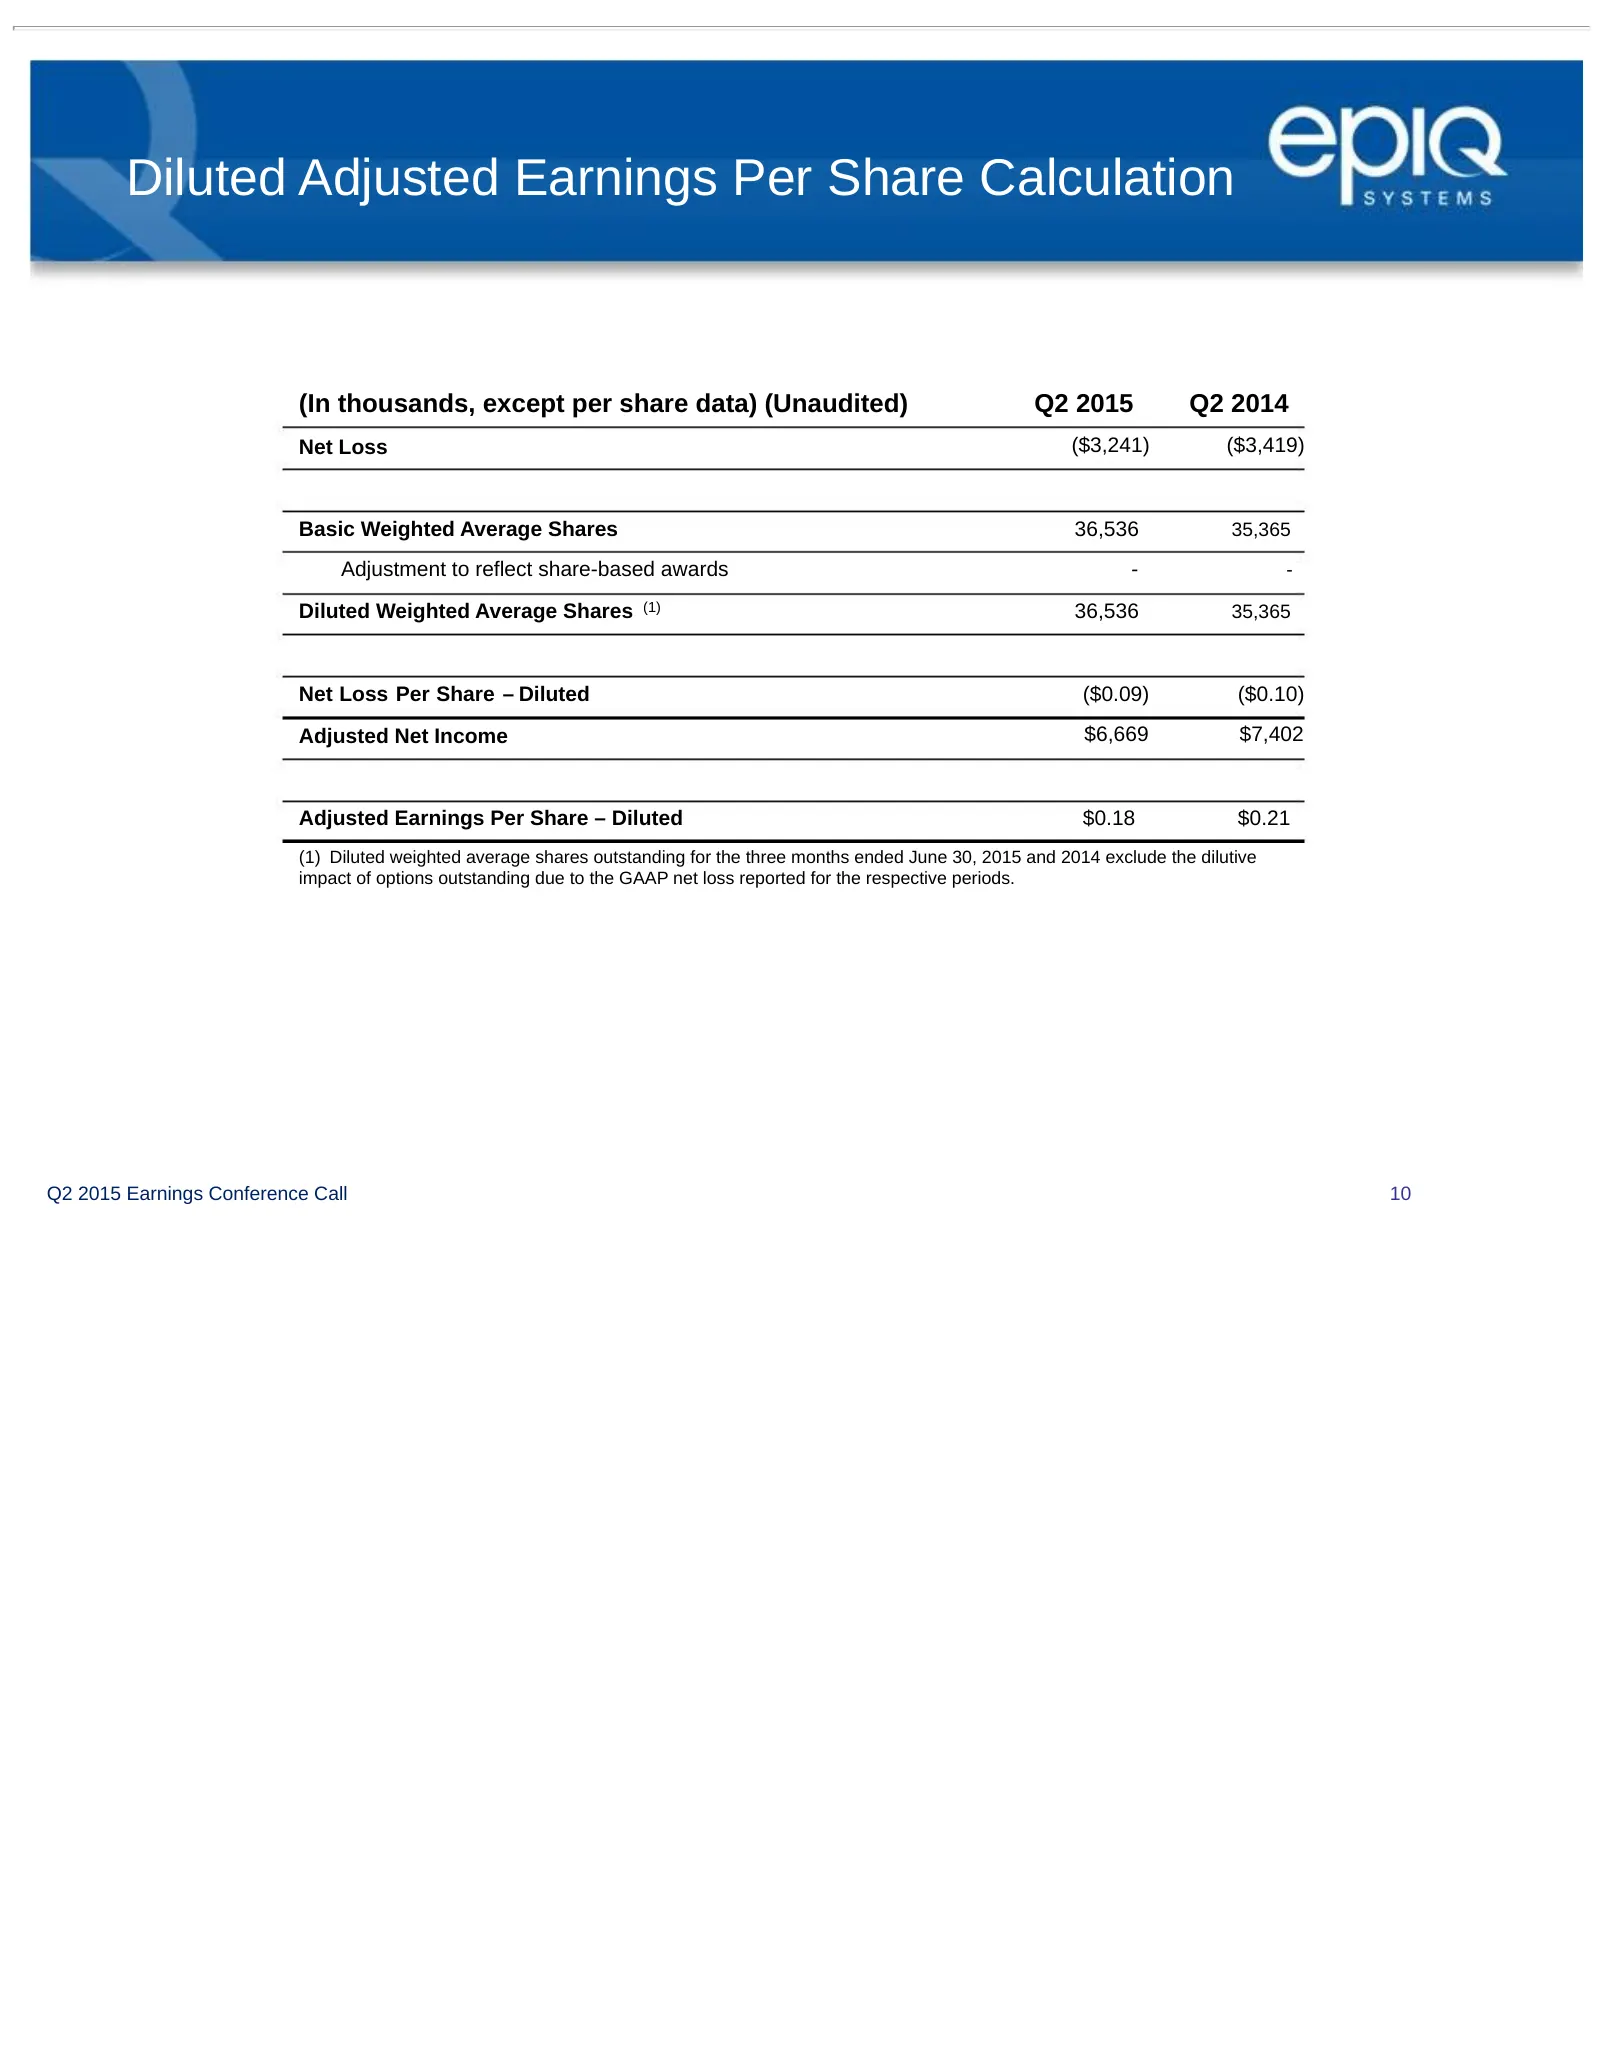
Slide 10: Diluted Adjusted Earnings Per Share Calculation
Diluted Adjusted Earnings Per Share Calculation (In thousands, except per share data) (Unaudited) Q2 2015 Q2 2014 Net Loss ($3,241) ($3,419) Basic Weighted Average Shares 36,536 35,365 Adjustment to reflect share-based awards - - Diluted Weighted Average Shares (1) 36,536 35,365 Net Loss Per Share –
Slide 11: Investor Contacts
Investor Contacts Kelly Bailey Epiq Systems (913) 621-9500 IR@epiqsystems.com Chris Eddy Catalyst Global (212) 924-9800 epiq@catalyst-ir.com NASDAQ: EPIQ www.epiqsystems.com
Source: SEC EDGAR · 8-K filed Aug 3, 2015
More decks from EPIQ Systems Inc
 Q2 2016 Earnings Presentation12 slides · Aug 9, 2016
 Q1 2016 Earnings Presentation12 slides · May 3, 2016
 FY2015 Earnings Presentation13 slides · Mar 1, 2016
 Q3 2015 Earnings Presentation11 slides · Nov 3, 2015
 Q1 2015 Earnings Presentation11 slides · Apr 28, 2015
 FY2014 Earnings Presentation11 slides · Mar 2, 2015