Inland Real Estate — Investor Presentation (May 2005)
39 slides from Inland Real Estate's investor presentation, May 23, 2005
Slide 1: Inland Real Estate Corporation
Inland Real Estate Corporation
Slide 2: Forward Looking Statements
FORWARD LOOKING STATEMENTS ‘These presentation materials contain forward-looking statements. Forward-looking statements are statements that are nat historical, including statements regarding managements intentions, beliefs, expectations, representations, plans or predictions ofthe future, and are ty
Slide 3: Company Overview
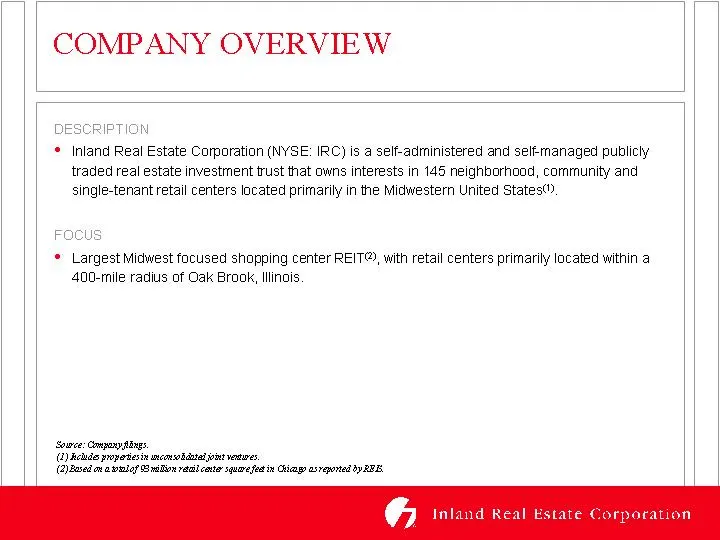
COMPANY OVERVIEW * Inland Real Estate Comoration (NYSE: IRC) is a self-administered and seltmanaged publicly traded real estate investment trust that awns interests in 145 neighborhood, community and single-tenant retail centers located primarily in the Midwestern United States. © Largest Midwest fo
Slide 4: Company Overview: Financial Snapshot
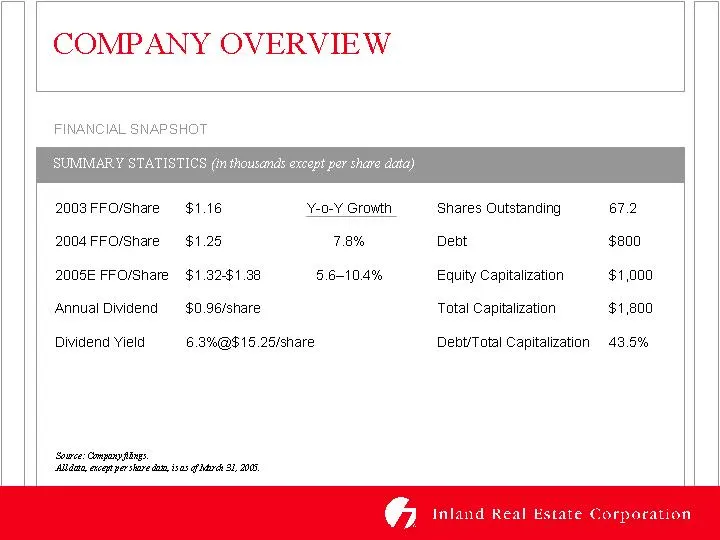
COMPANY OVERVIEW FINANCIAL SNAPSHOT 2003FFO/Share $1.16 Y-0-¥ Growth Shares Outstanding 67.2 2004 FFO/Share $1.25 7.8% Debt $800 2005 FFO/Share $1.32-$1.38 5.6-10.4% Equity Capitalization $1,000 Annual Dividend — $0.96/share Total Capitalization $1,800 Dividend Yield 6.3%@$16.26/share Debt/Total Cap
Slide 5: Inland's Core Strengths
COMPANY OVERVIEW INLAND'S CORE STRENGTHS: * Only shopping center REIT focused exclusively an operating within the attractive Midwest and Chicagoland markets * Proven track record with consistent bottom line growth * Visible growth potential through acquisitions and core partfolia re-leasing * Attrac
Slide 6: Focused Investment Strategy and Portfolio
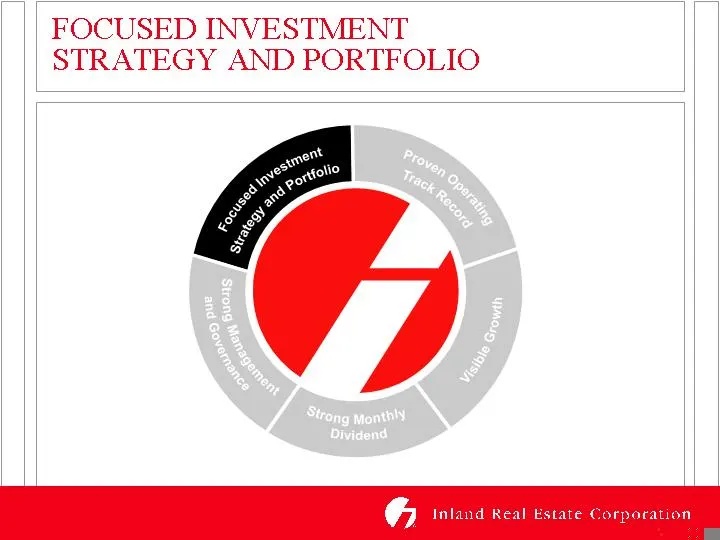
FOCUSED INVESTMENT STRATEGY AND PORTFOLIO
Slide 7: Established Gatekeeper to the Chicagoland Retail Market
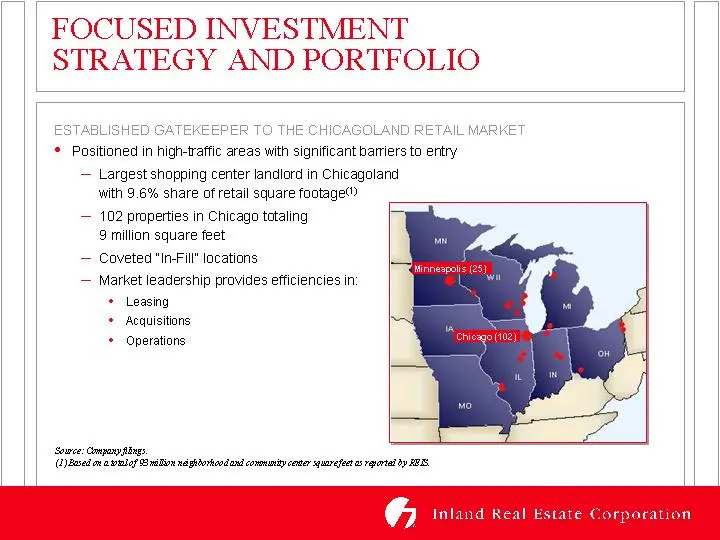
FOCUSED INVESTMENT STRATEGY AND PORTFOLIO ESTABLISHED GATEKEEPER TO THE CHICAGOLAND RETAIL MARKET * Positioned in high-trattic areas with significant bamers to entry — Largest shopping center landlord in Chicagatand with 9.6% share of retail square footage)” — 102 properties in Chicago tetaling 9 mi
Slide 8: Portfolio Snapshot
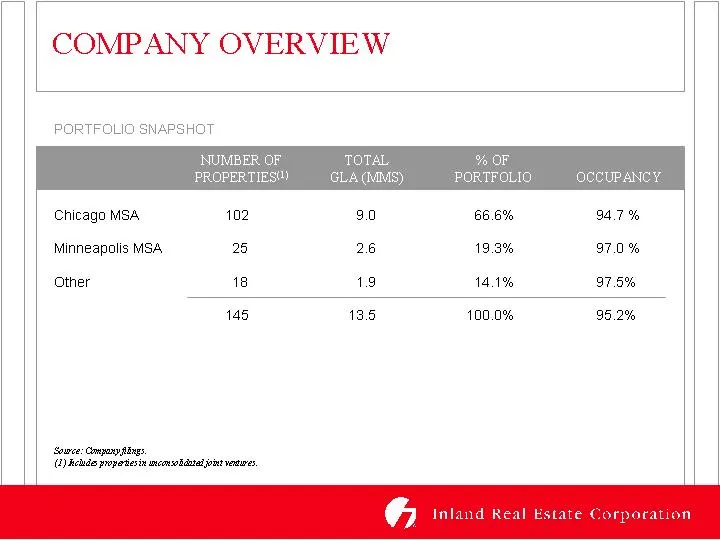
COMPANY OVERVIEW PORTFOLIO SNAPSHOT Chicago MSA 102 90 66.6% 94.7% Minneapolis MSA 25 26 19.3% 97.0% Other 18 19 14.1% 97.5% 145 13.5 100.0% 95.2% Sowce: Copa tgs )Aeude popariesin meowekaanal pie voawes Inland Real poration
Slide 9: Superior Demographics
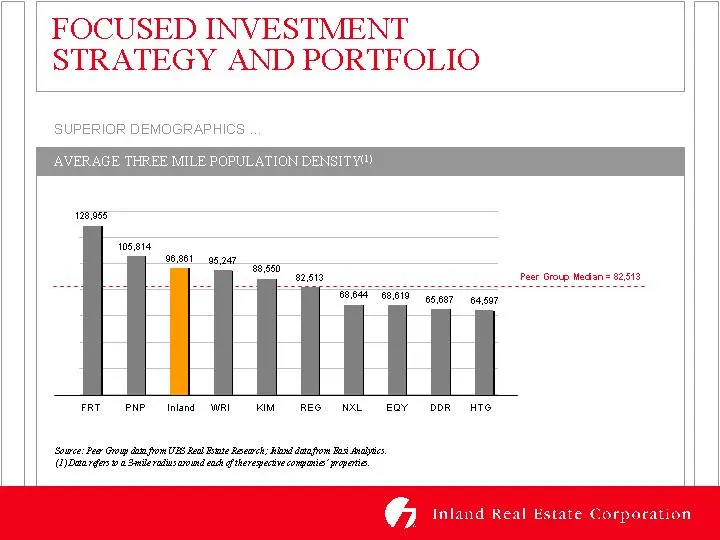
FOCUSED INVESTMENT STRATEGY AND PORTFOLIO SUPERIOR DEMOGRAPHICS 128.985" 105.814 98.861 as 247 2.500 | | | 92519 Peer Group Median = 82,513 FRT PNP Inland WRI KIM REG -NXL DY DDR HTC Sowce: Pee Grom dan fom VIS Rea Bite Raerch; Raed detafiom Ba says. (yaa gas wa Se ralusamound cad gf terepectvecompa
Slide 10: Superior Demographics
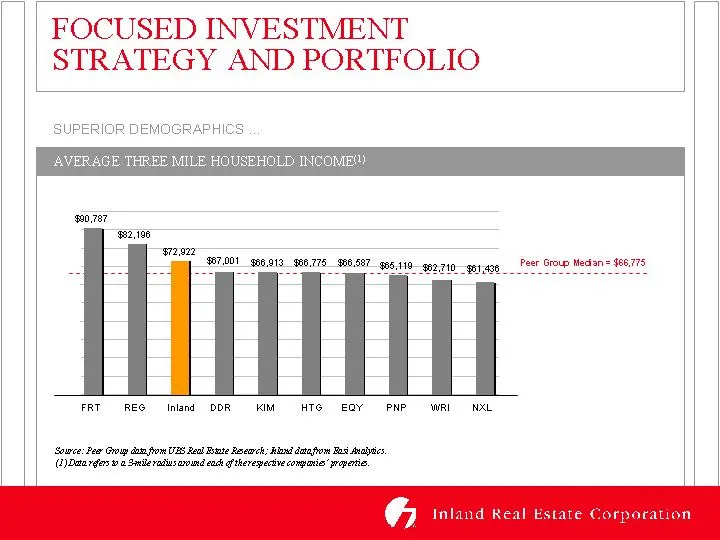
FOCUSED INVESTMENT STRATEGY AND PORTFOLIO SUPERIOR DEMOGRAPHICS Sowce: Pee Grom dan fom VIS Rea Bite Raerch; Raed detafiom Ba says. (yaa gas wa Se ralusamound cad gf terepectvecompatis’ apes
Slide 11: High Quality Diversified Tenant Base
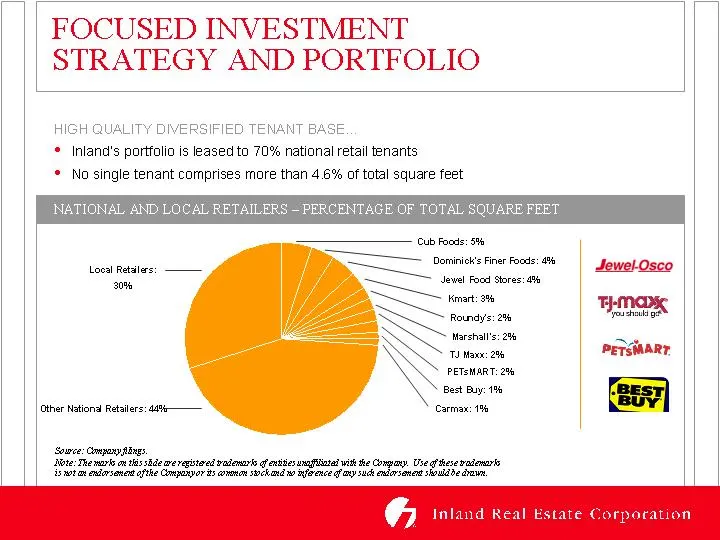
FOCUSED INVESTMENT STRATEGY AND PORTFOLIO HIGH QUALITY DIVERSIFIED TENANT BASE. * Inland's portfalio is leased to 70% national retail tenants * No single tenant comprises more than 4.6% of total square feet AL RETAILER: Local Retalers 06 Ty Maen: 2% PETEMART: 2% Best Buy 1% cara: 1% ther National Re
Slide 12: Leading to Stability of Inland's Underlying Cash Flows
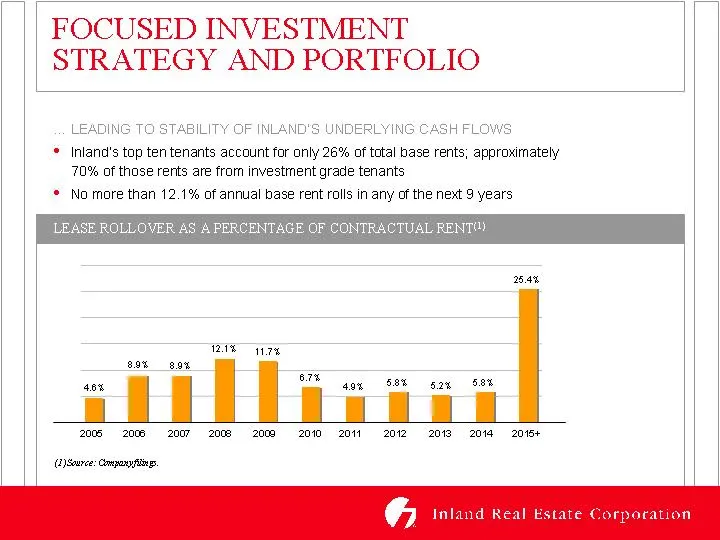
FOCUSED INVESTMENT STRATEGY AND PORTFOLIO LEADING TO STABILITY OF INLAND'S UNDERLYING CASH FLOWS * Inland’s top ten tenants account for only 26% of total base rents; approximately 70% of thase rents are from investment grade tenants © No more than 12.1% of annual base rent rolls in any of the next 9
Slide 13: Tenant Base
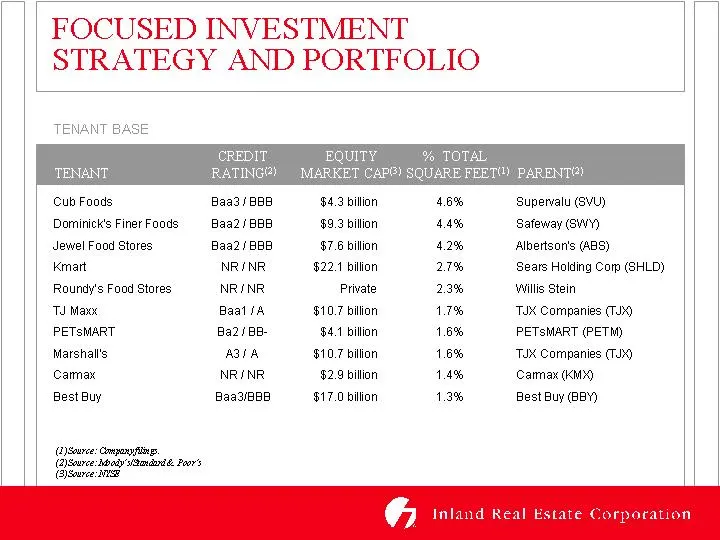
FOCUSED INVESTMENT STRATEGY AND PORTFOLIO TENANT BASE Cub Foods Baa3/BBB $4.3 billion 4.8% Supervalu (SVU) Dominick's Finer Foods Baa BBB $9.3 billion 4.4% Safeway (SWY) Jewel Food Stores Baa2/ BBB 87.6 billion 4.2% Albertson's (ABS) Kmart NRINR, $22.1 billion 27% Sears Holding Com (SHLD) Roundy's F
Slide 14: Focused Investment Strategy and Portfolio
FOCUSED INVESTMENT STRATEGY AND PORTFOLIO
Slide 15: Proven Operating Track Record
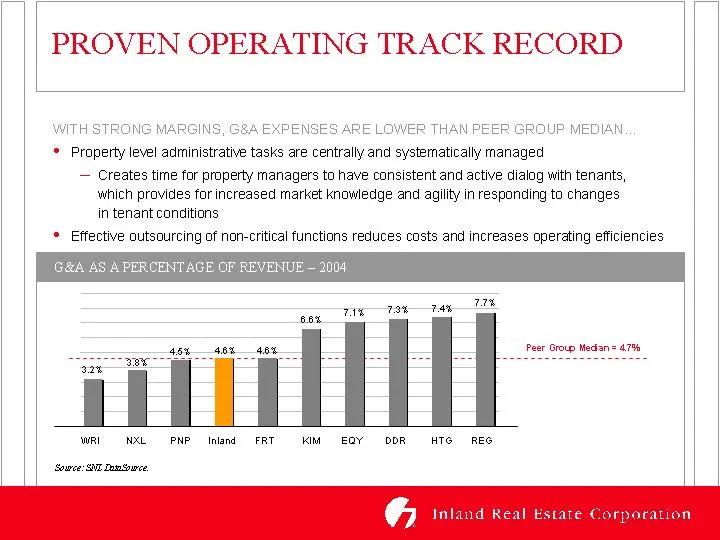
PROVEN OPERATING TRACK RECORD WITH STRONG MARGINS, G&A EXPENSES ARE LOWER THAN PEER GROUP MEDIAN * Property level administrative tasks are centrally and systematically managed — Creates time for property managers to have consistent and active dialog with tenants, which provides for increased market
Slide 16: Consistent Delivery of Attractive Growth
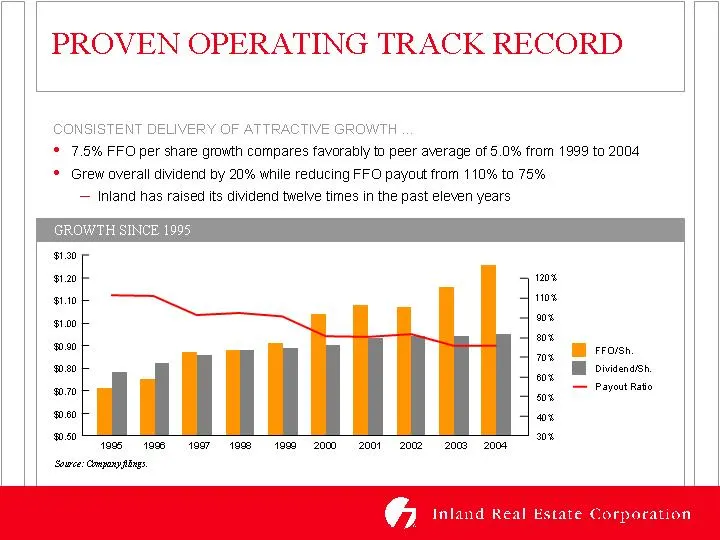
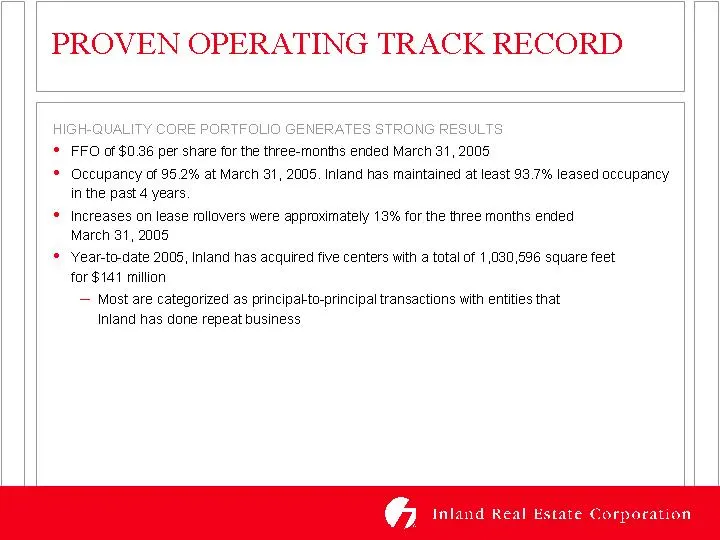
PROVEN OPERATING TRACK RECORD CONSISTENT DELIVERY OF ATTRACTIVE GROWTH * 7.5% FFO per share growth compares favorably to peer average of 8.0% from 1999 to 2004 * Grew overall dividend by 20% while reducing FFO payout fram 110% to 75% — Inland has raised its dividend twelve times in the past eleven y
Slide 17: Link
Link to searchable text of slide shown above
Slide 18: Proven Operating Track Record
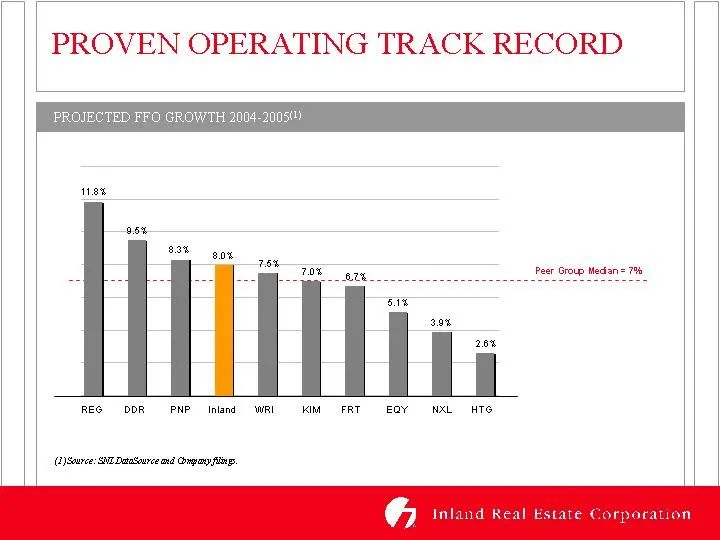
PROVEN OPERATING TRACK RECORD (UpSource: SE DaaSource and nga in. Inland Real Estate Corporation
Slide 19: Focused Investment Strategy and Portfolio
FOCUSED INVESTMENT STRATEGY AND PORTFOLIO
Slide 20: Visible Growth: Re-leasing and Re-tenanting
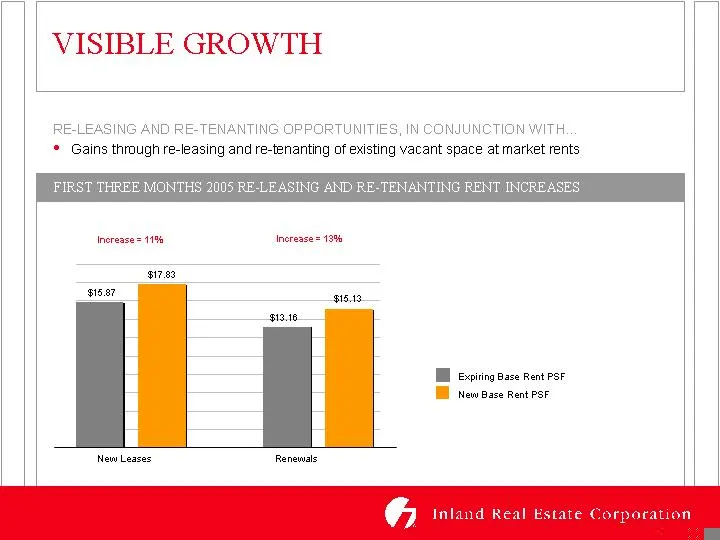
VISIBLE GROWTH RE-LEASING AND RE-TENANTING OPPORTUNITIES, IN CONJUNCTION WITH * Gains through re-leasing and re-tenanting of existing vacant space at market rents RE-LEASING AND RE-TENANTING RENT IN Inoraase= 11% Inoreace= 19% fied 16.87 I expiring Base Rent PSF WHE New Base Rent PSF New Laces Renew
Slide 21: Visible Growth: Attractive Acquisition Opportunities
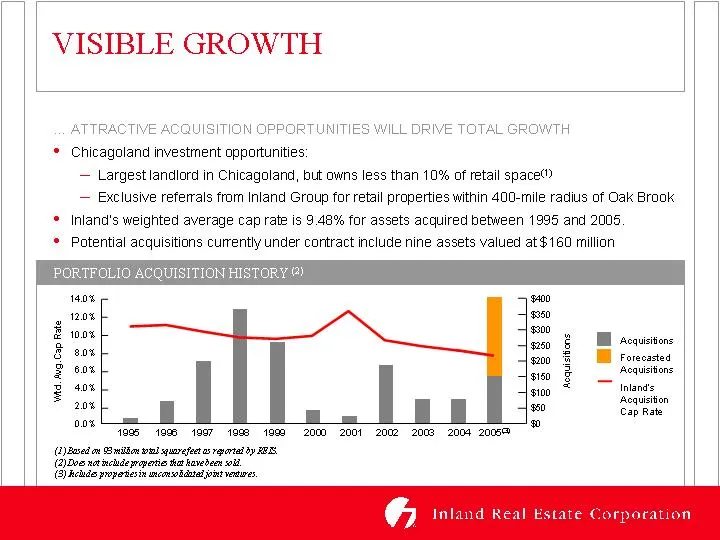
VISIBLE GROWTH ATTRACTIVE ACQUISITION OPPORTUNITIES WILL DRIVE TOTAL GROWTH * Chicagoland investment opportunities: — Largest landlord in Chicagoland, but owns less than 10% of retail space — Exclusive referrals from Inland Group for retall properties within 400-mile radius of Oak Brook * Inland’s w
Slide 22: Visible Growth: NYSTRS Joint Venture
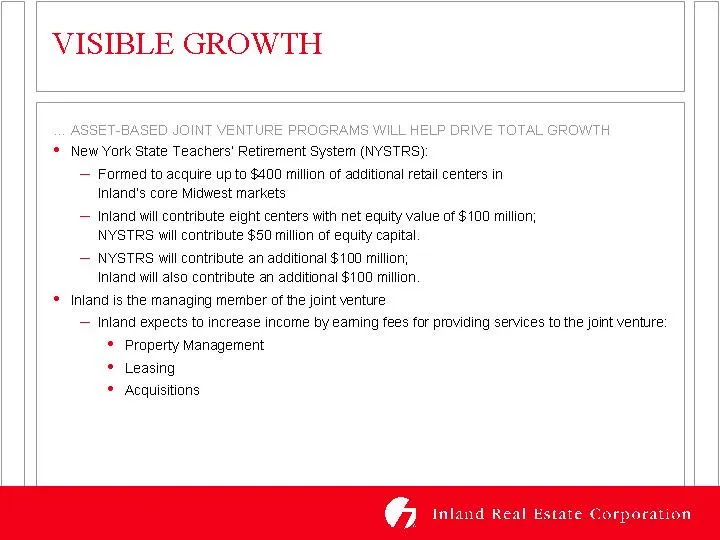
VISIBLE GROWTH © New York State Teachers’ Retirement System (NYSTRS): — Formed to acquire up to $400 million of additional retail centers in Inland’s core Midwest markets — Inland will contribute eight centers with net equity value of $100 million; NYSTRS will contribute $50 million af equity capita
Slide 23: Flexible Financing Options Further Enhance Cash Flow
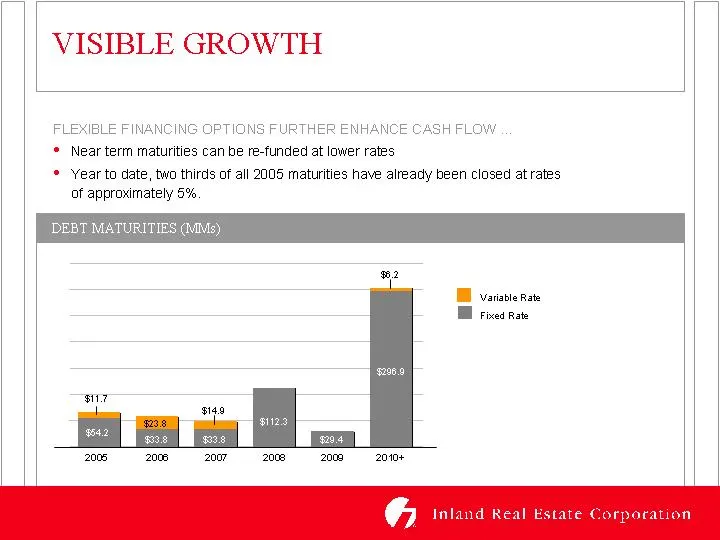
VISIBLE GROWTH FLEXIBLE FINANCING OPTIONS FURTHER ENHANCE CASH FLOW © Near term maturities can be re-funded at lower rates * Year to date, two thirds of all 2005 maturities have already been closed at rates of approximately 5% Variable Rate I Fixed Rate G Inland Real Estate Corporation
Slide 24: Flexible Financing Options Further Enhance Cash Flow
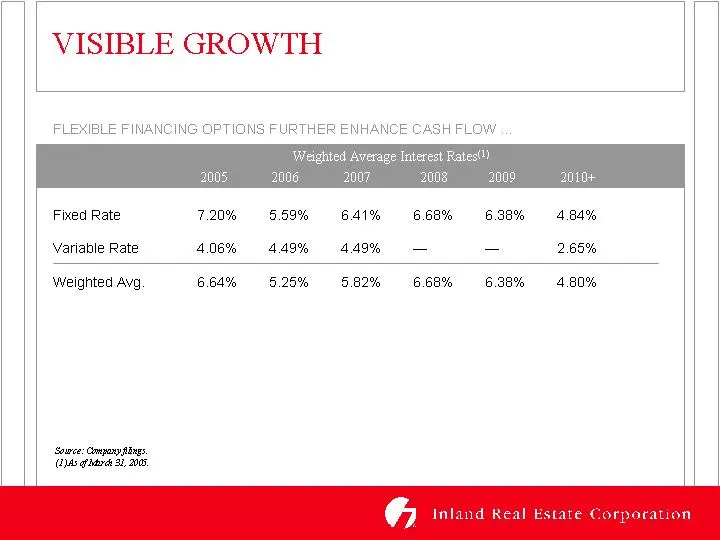
VISIBLE GROWTH FLEXIBLE FINANCING OPTIONS FURTHER ENHANCE CASH FLOW Fixed Rate 7.20% 65.59% 641% 668% 6.38% 4.84% Variable Rate 4.06% 449% 449% — = 2.65% Weighted Avg 6.64% 6.25% 5.82% 6.68% 6.38% 4.80% Sowce: Copa sngs (as ghar 3,20 G Inland Real Estate Corporation
Slide 25: Culminating in Continued Positive FFO Growth
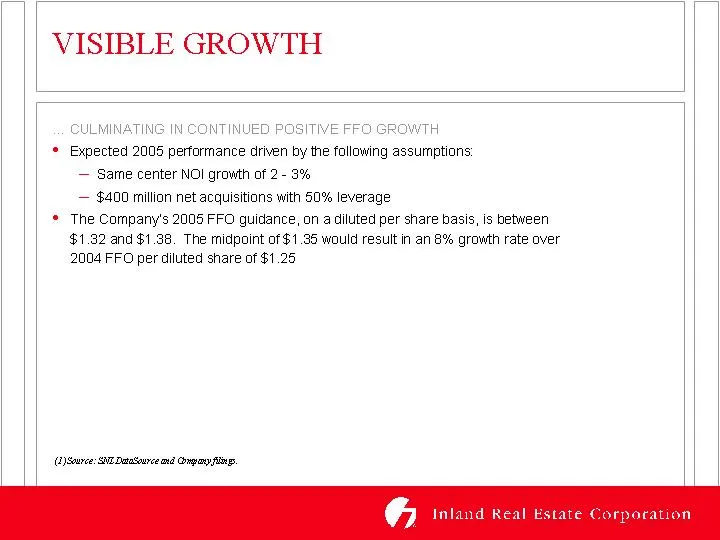
VISIBLE GROWTH CULMINATING IN CONTINUED POSITIVE FFO GROWTH * Expected 2005 performance driven by the following assumptians — Same center NOI growth af 2- 3% — $400 million net acquisitions with 80% leverage * The Company's 2005 FFO guidance, an a diluted per share basis, is between $1.32 and $1.38.
Slide 26: Visible Growth
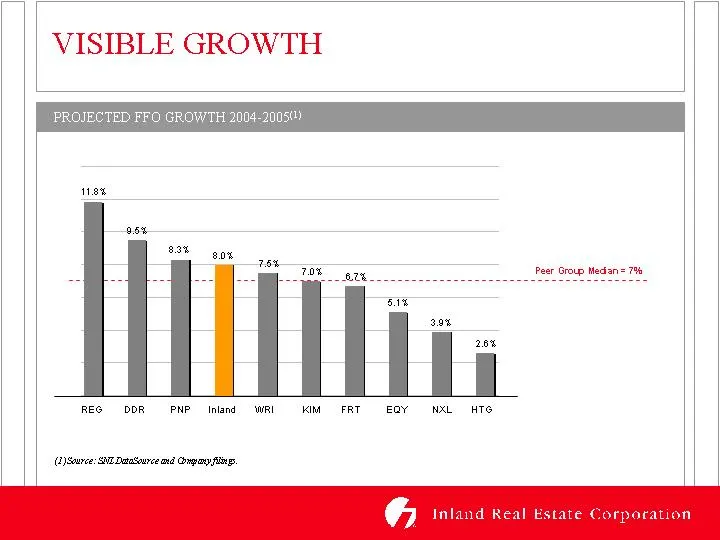
VISIBLE GROWTH REG DDR PNP Inland WRI (UpSource: SE DaaSource and nga in. Inland Real Estate Corporation
Slide 27: Focused Investment Strategy and Portfolio
FOCUSED INVESTMENT STRATEGY AND PORTFOLIO
Slide 28: Conservative Capital Structure
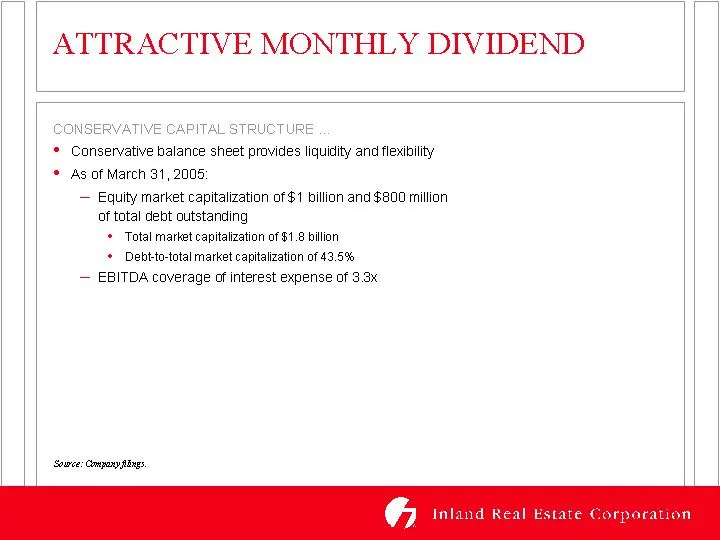
ATTRACTIVE MONTHLY DIVIDEND CONSERVATIVE CAPITAL STRUCTURE * Conservative balance sheet provides liquidity and flexibility * As of March 31, 2005: — Equity market capitalization of $1 billion and $800 million of total debt outstanding + Total market capitalization of $1.8 billion + Debtto-total mark
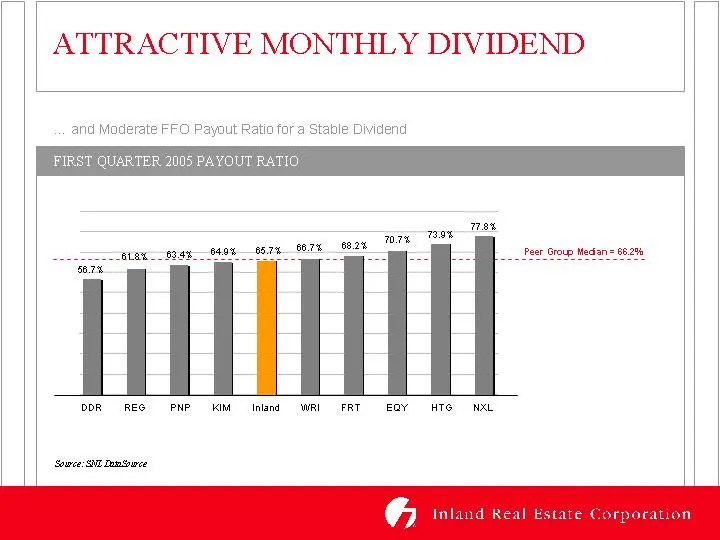
Slide 29: Attractive Monthly Dividend
ATTRACTIVE MONTHLY DIVIDEND and Moderate FFO Payout Ratio fora Stable Dividend YOUT RATIO core 807% 68.25 HUAI DDR RE: KIM Inland WR Sowce ME Dmowce G Inland Real Estate Corporation
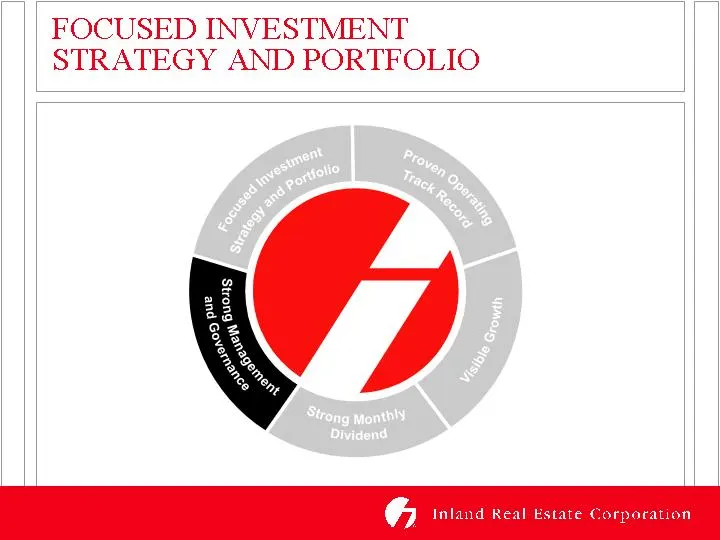
Slide 30: Focused Investment Strategy and Portfolio
FOCUSED INVESTMENT STRATEGY AND PORTFOLIO
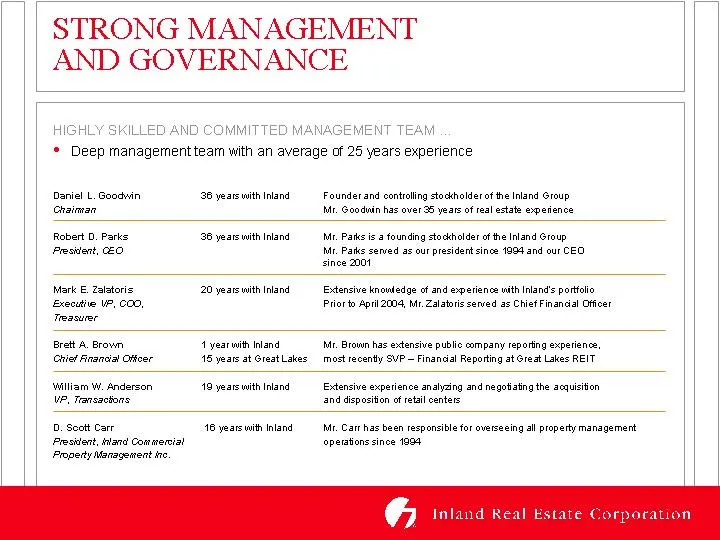
Slide 31: Strong Management and Governance
STRONG MANAGEMENT AND GOVERNANCE * Deep management team with an average of 26 years experience Daniel L. Goodin 26 yearewith Inland Founder and controling stockholder of the Inland Group Chainran Me. Goodnin has over 35 yeats of rea esate experience Robert 0. Parks 26 yearewith inland Mr, Pats ie a
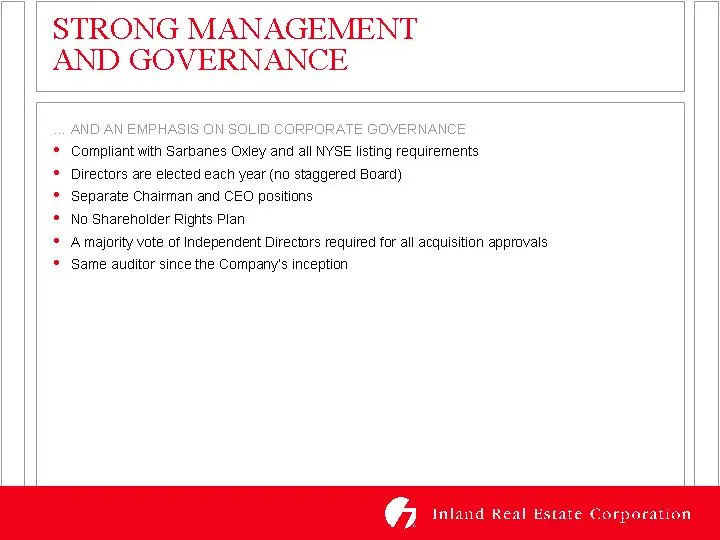
Slide 32: Emphasis on Solid Corporate Governance
STRONG MANAGEMENT AND GOVERNANCE AND AN EMPHASIS ON SOLID CORPORATE GOVERNANCE * Compliant with Sarbanes Oxley and all NYSE listing requirements * Directors are elected each year (na staggered Board) * Separate Chairman and CEO positions * No Shareholder Rights Plan * Amajority vote of Independent D
Slide 33: Strong Management and Governance: Directors
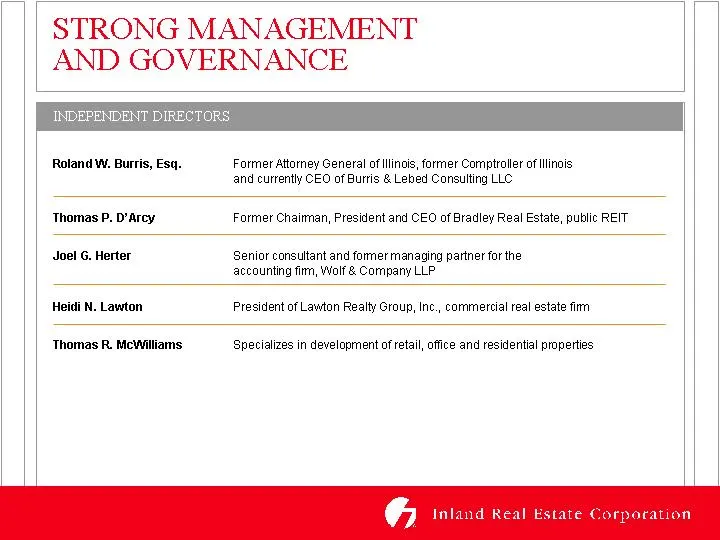
STRONG MANAGEMENT AND GOVERNANCE Roland W. Burris, Esa. Former Attorney General of llincis, farmer Comptroller of Ilinois and currently CEO of Burris & Lebed Consulting LLC Thomas P. D'Arcy Former Chairman, President and CEO of Bradley Real Estate, public REIT Joel G. Herter Senior consultant and fo
Slide 34: Conclusions / Investment Highlights
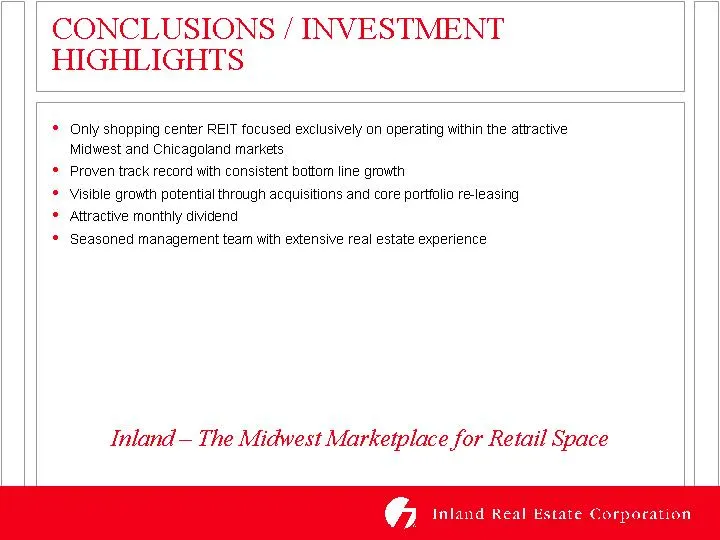
CONCLUSIONS / INVESTMENT HIGHLIGHTS * Only shopping center REIT focused exclusively an operating within the attractive Midwest and Chicagoland markets * Proven track record with consistent bottom line growth * Visible growth potential through acquisitions and core partfolia re-leasing * Attractive m
Slide 35: Appendix
APPENDIX
Slide 36: Appendix: Non-GAAP Financial Measures
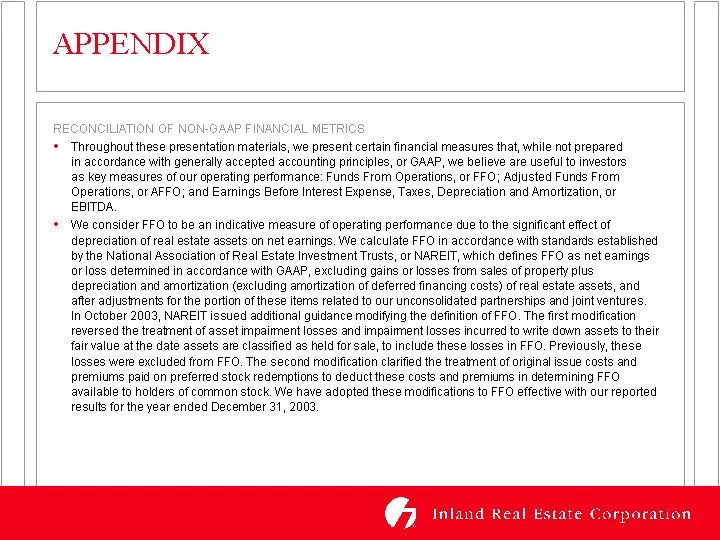
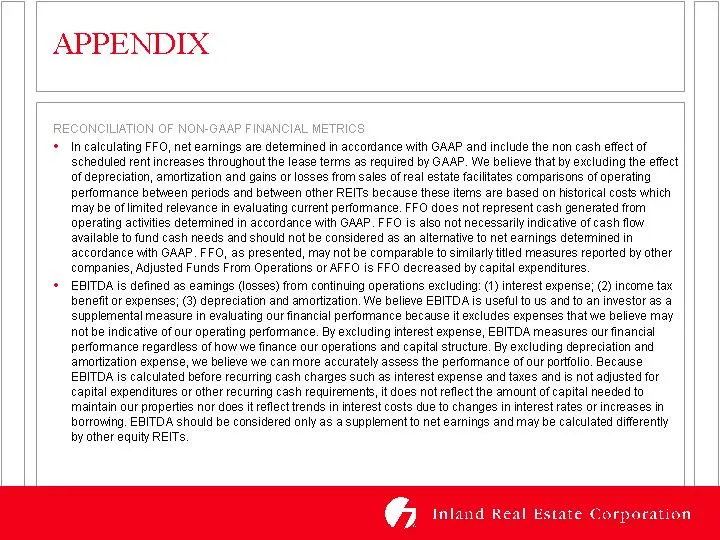
APPENDIX ‘Throughout these presentation materials, we present certain financial measures that, while not prepared in accordance with generally accepted accounting principles, or GAAP, we believe are useful to investors, as key measures of our operating performance: Funds From Operations, or FFO; Adj
Slide 37: Link
Link to searchable text of slide shown above
Slide 38: Reconciliation of Non-GAAP Financial Metrics
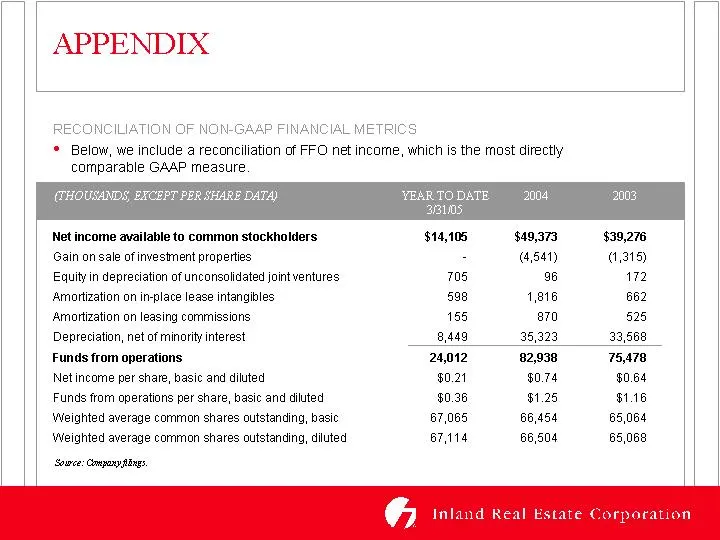
APPENDIX RECONCILIATION OF NON-GAAP FINANCIAL METRICS * Below, we include a reconciliation of FFO net income, which is the most directly comparable GAAP measure Net income available to common stockholders Gain on sale of investment properties Equity in depreciation of unconsolidated joint ventures A
Slide 39: Searchable text section of graphics shown above
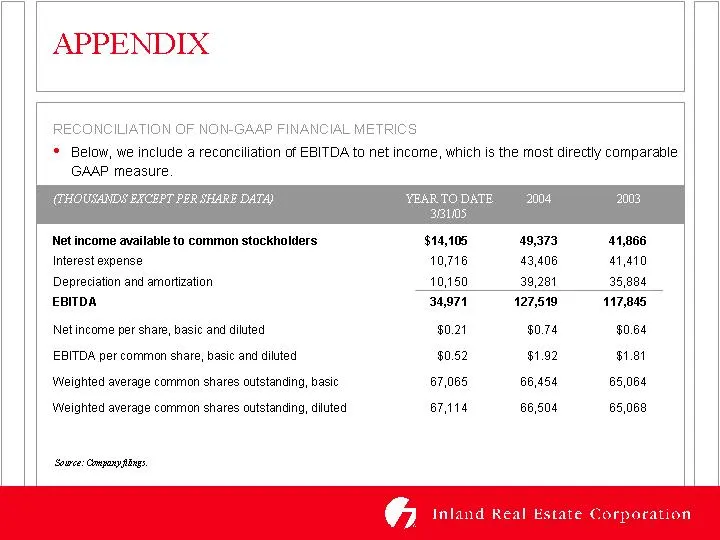
Searchable text section of graphics shown above [ LOG O] Inland Real Estate Corporation Investor Presentation May 2005 FOR WARD LOOKING STATEMENTS • These presentation materials contain forward-looking statements. Forward-looking statements are statements that are not historical, including statement
Source: SEC EDGAR · 8-K filed May 23, 2005
More decks from Inland Real Estate Corp
 Investor Presentation (November 2015)30 slides · Nov 17, 2015
 Investor Presentation (September 2015)29 slides · Sep 16, 2015
 Investor Presentation (June 2015)29 slides · Jun 9, 2015
 Investor Presentation (May 2015)26 slides · May 15, 2015
 Investor Presentation (February 2015)26 slides · Feb 24, 2015
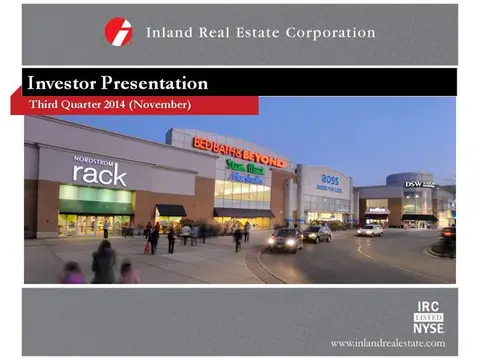 Investor Presentation (November 2014)26 slides · Nov 5, 2014