Inland Real Estate — Investor Presentation (November 2014)
26 slides from Inland Real Estate's investor presentation, Nov 5, 2014
Slide 1: Investor Presentation Third Quarter 2014 (November)
Investor Presentation Third Quarter 2014 (November)
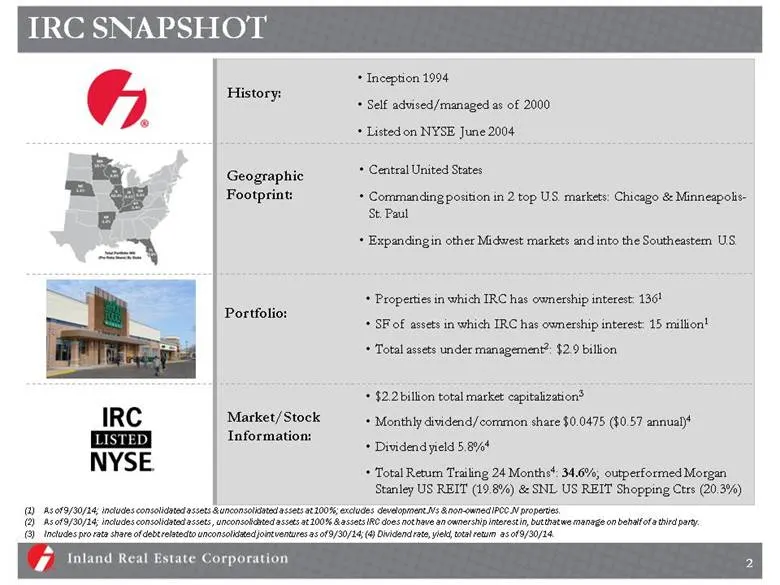
Slide 2: IRC Snapshot
As of 9/30/14; includes consolidated assets & unconsolidated assets at 100%; excludes development JVs & non-owned IPCC JV properties. As of 9/30/14; includes consolidated assets , unconsolidated assets at 100% & assets IRC does not have an ownership interest in, but that we manage on behalf of a thi
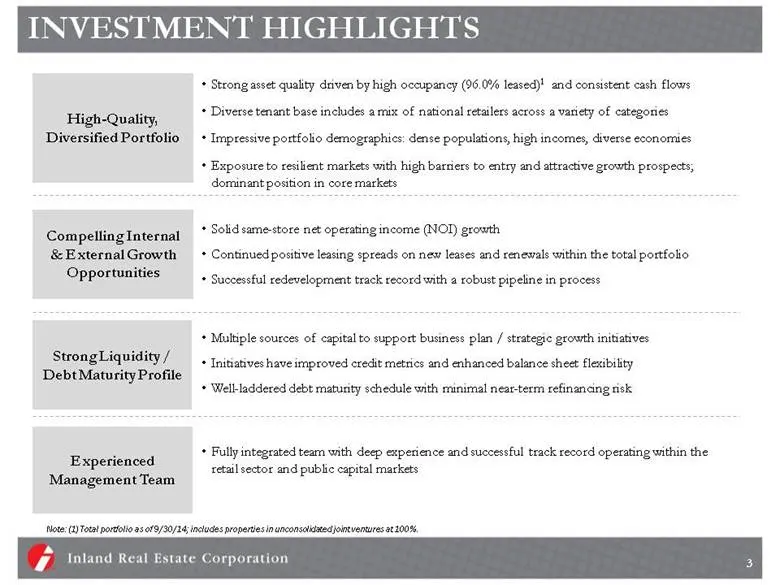
Slide 3: Investment Highlights
INVESTMENT HIGHLIGHTS High-Quality, Diversified Portfolio Strong asset quality driven by high occupancy (96.0% leased)1 and consistent cash flows Diverse tenant base includes a mix of national retailers across a variety of categories Impressive portfolio demographics: dense populations, high incomes
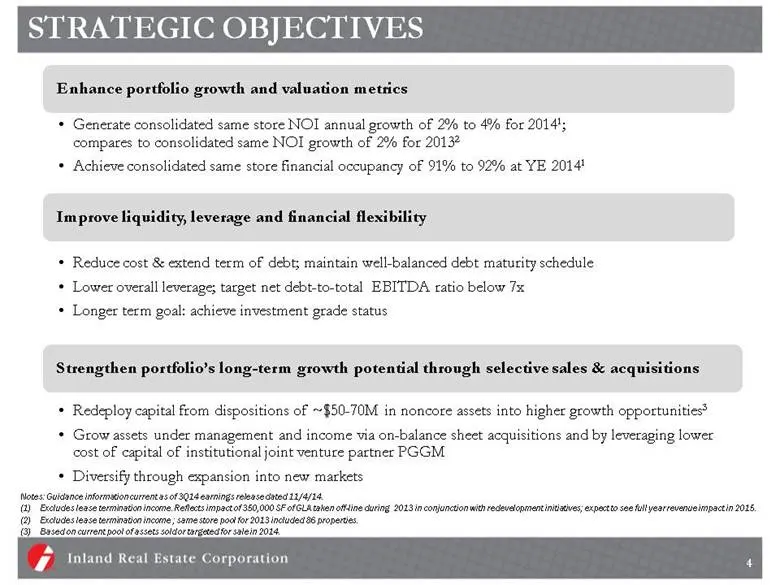
Slide 4: Strategic Objectives
STRATEGIC OBJECTIVES Generate consolidated same store NOI annual growth of 2% to 4% for 20141; compares to consolidated same NOI growth of 2% for 20132 Achieve consolidated same store financial occupancy of 91% to 92% at YE 20141 Enhance portfolio growth and valuation metrics Reduce cost & extend te
Slide 5: High Quality, Stable Portfolio
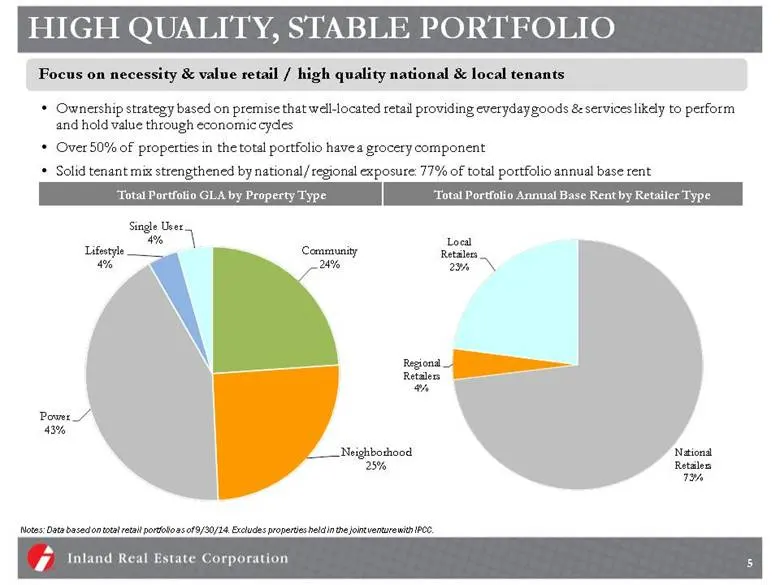
HIGH QUALITY, STABLE PORTFOLIO Ownership strategy based on premise that well-located retail providing everyday goods & services likely to perform and hold value through economic cycles Over 50% of properties in the total portfolio have a grocery component Solid tenant mix strengthened by national/re
Slide 6: Diversified Tenant Base
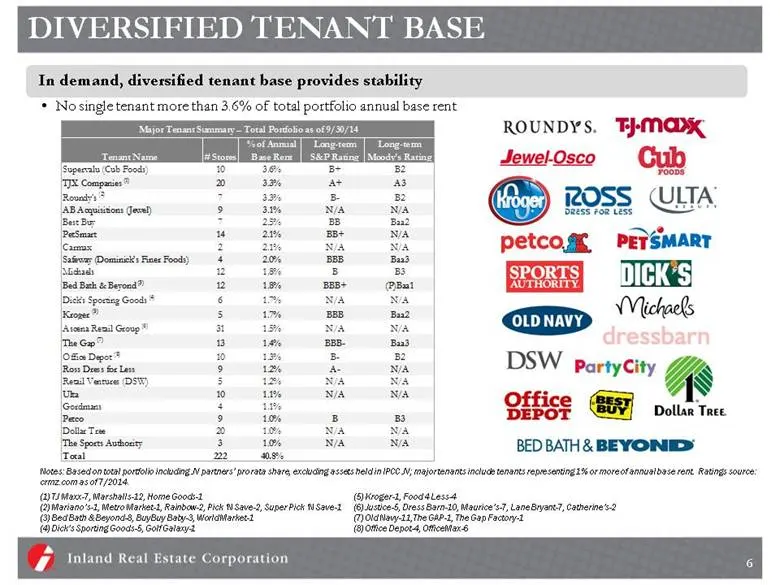
DIVERSIFIED TENANT BASE No single tenant more than 3.6% of total portfolio annual base rent In demand, diversified tenant base provides stability (1) TJ Maxx-7, Marshalls-12, Home Goods-1 (2) Mariano’s-1, Metro Market-1, Rainbow-2, Pick ‘N Save-2, Super Pick ‘N Save-1 (3) Bed Bath & Beyond-8, BuyBuy
Slide 7: Strong Market Demographics
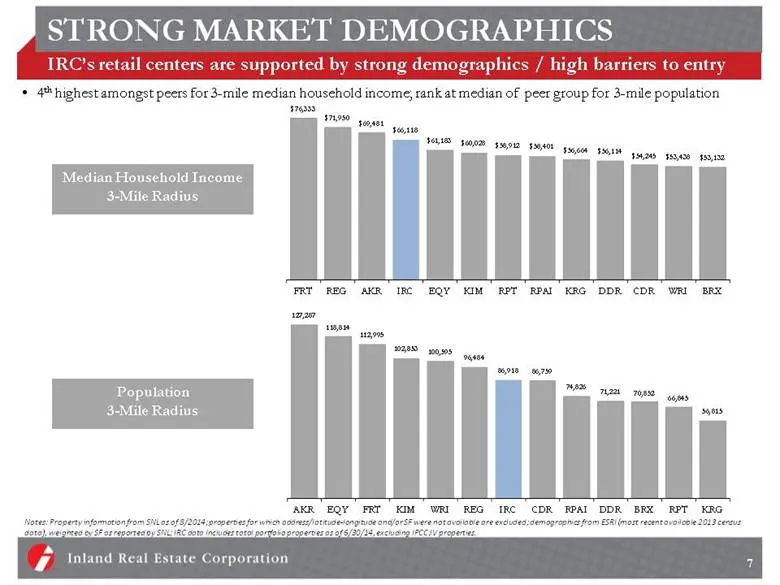
STRONG MARKET DEMOGRAPHICS 7 IRC’s retail centers are supported by strong demographics / high barriers to entry 4th highest amongst peers for 3-mile median household income; rank at median of peer group for 3-mile population Notes: Property information from SNL as of 8/2014; properties for which add
Slide 8: Primary Markets
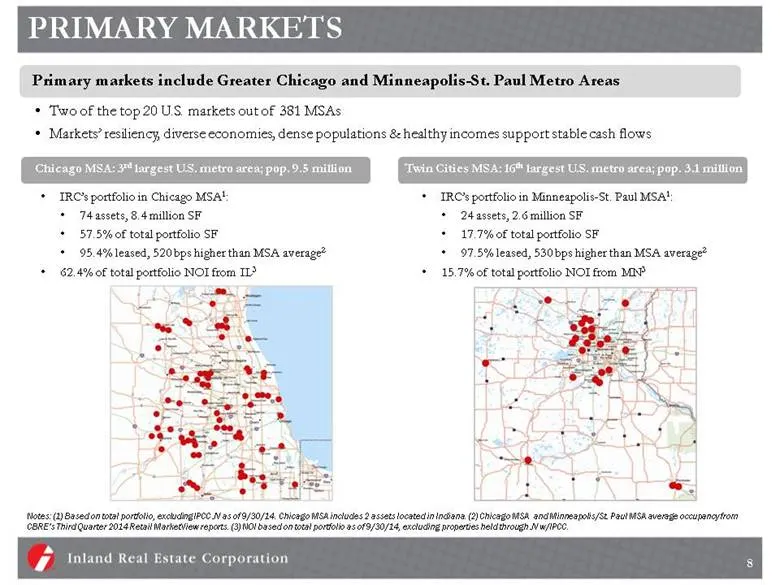
PRIMARY MARKETS Primary markets include Greater Chicago and Minneapolis-St. Paul Metro Areas Two of the top 20 U.S. markets out of 381 MSAs Markets’ resiliency, diverse economies, dense populations & healthy incomes support stable cash flows Notes: (1) Based on total portfolio, excluding IPCC JV as
Slide 9: Dominant REIT in Primary Markets
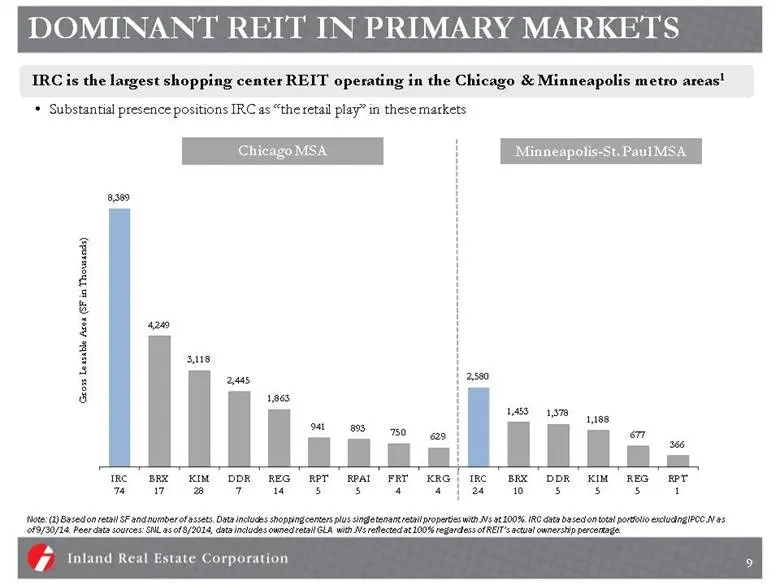
DOMINANT REIT IN PRIMARY MARKETS IRC is the largest shopping center REIT operating in the Chicago & Minneapolis metro areas1 Substantial presence positions IRC as “the retail play” in these markets Minneapolis-St. Paul MSA Note: (1) Based on retail SF and number of assets. Data includes shopping cen
Slide 10: Operating Strategy in Primary Markets
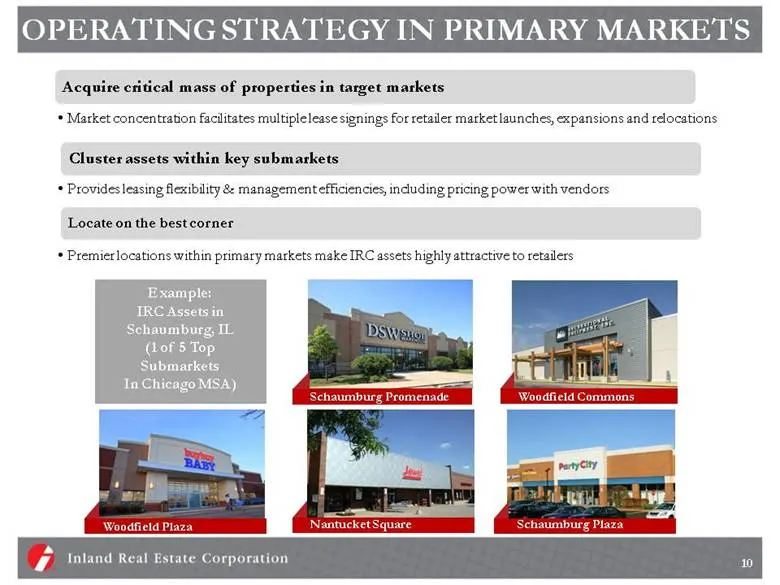
OPERATING STRATEGY IN PRIMARY MARKETS Schaumburg Promenade Woodfield Plaza Woodfield Commons Nantucket Square Example: IRC Assets in Schaumburg, IL (1 of 5 Top Submarkets In Chicago MSA) 10 Schaumburg Plaza
Slide 11: Internal Growth: Positive Rent Spreads
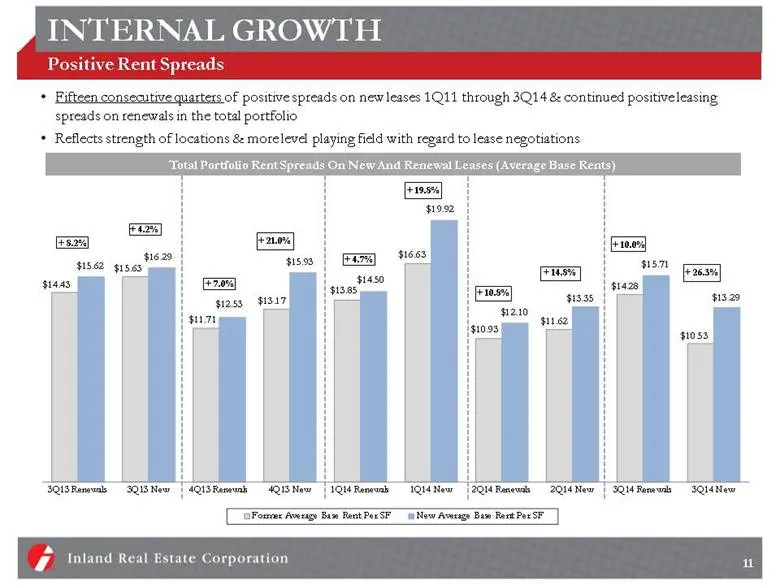
INTERNAL GROWTH Positive Rent Spreads Fifteen consecutive quarters of positive spreads on new leases 1Q11 through 3Q14 & continued positive leasing spreads on renewals in the total portfolio Reflects strength of locations & more level playing field with regard to lease negotiations + 8.2% + 4.2% + 1
Slide 12: Value Creation: Repositioning/Redevelopment Track Record
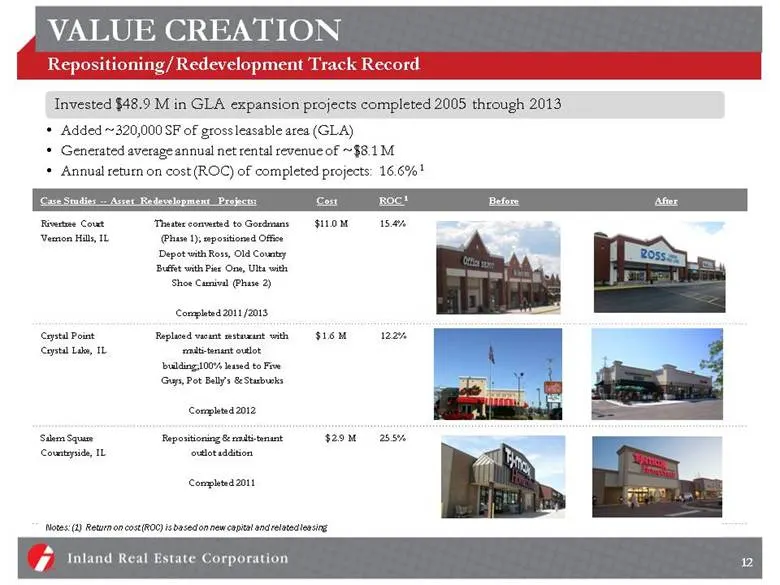
VALUE CREATION Repositioning/Redevelopment Track Record Case Studies -- Asset Redevelopment Projects: Cost ROC 1 Before After Rivertree Court Vernon Hills, IL Theater converted to Gordmans (Phase 1); repositioned Office Depot with Ross, Old Country Buffet with Pier One, Ulta with Shoe Carnival (Phas
Slide 13: Value Creation: Increased Repositioning/Redevelopment Activity
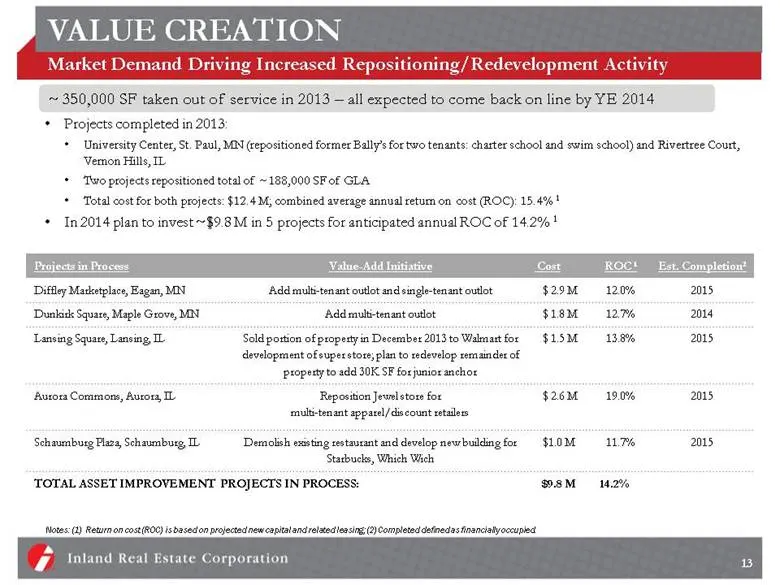
VALUE CREATION Market Demand Driving Increased Repositioning/Redevelopment Activity Notes: (1) Return on cost (ROC) is based on projected new capital and related leasing; (2) Completed defined as financially occupied. 13 Projects completed in 2013: University Center, St. Paul, MN (repositioned forme
Slide 14: Disciplined Investment Strategy
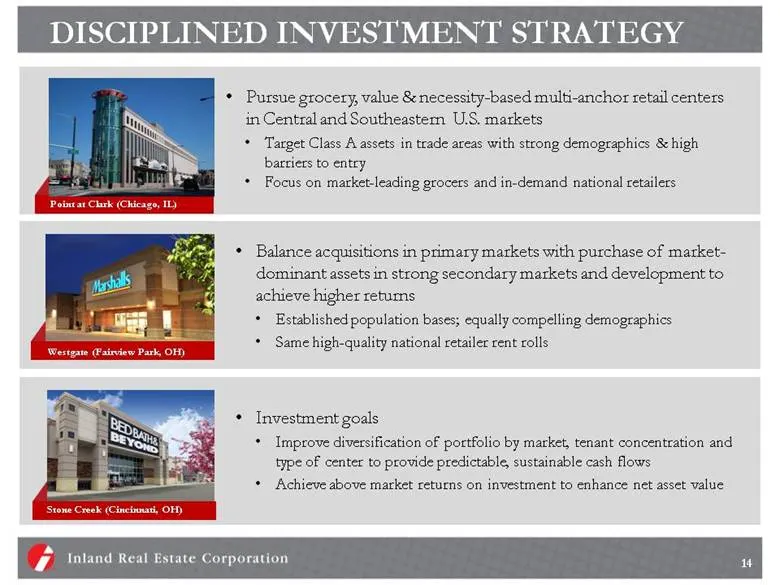
DISCIPLINED INVESTMENT STRATEGY Pursue grocery, value & necessity-based multi-anchor retail centers in Central and Southeastern U.S. markets Target Class A assets in trade areas with strong demographics & high barriers to entry Focus on market-leading grocers and in-demand national retailers Westgat
Slide 15: Acquisition of NYSTRS Interest in JV
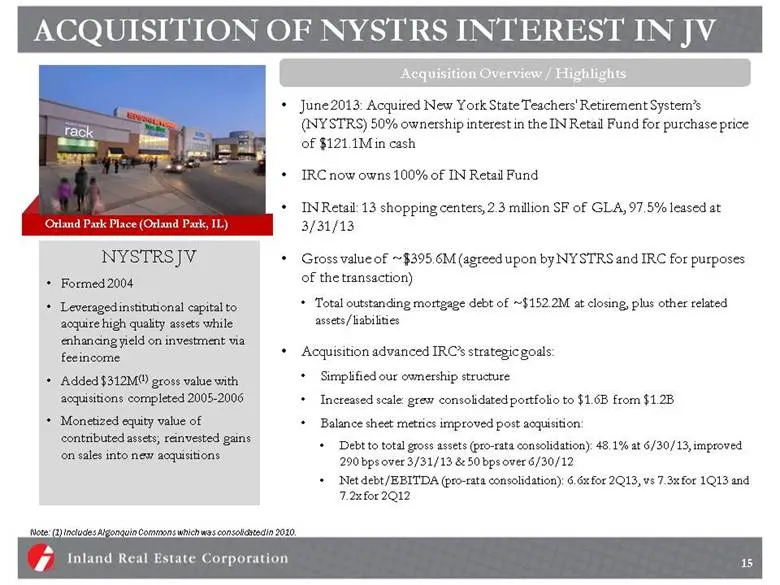
ACQUISITION OF NYSTRS INTEREST IN JV June 2013: Acquired New York State Teachers' Retirement System’s (NYSTRS) 50% ownership interest in the IN Retail Fund for purchase price of $121.1M in cash IRC now owns 100% of IN Retail Fund IN Retail: 13 shopping centers, 2.3 million SF of GLA, 97.5% leased at
Slide 16: Joint Venture Growth Strategies
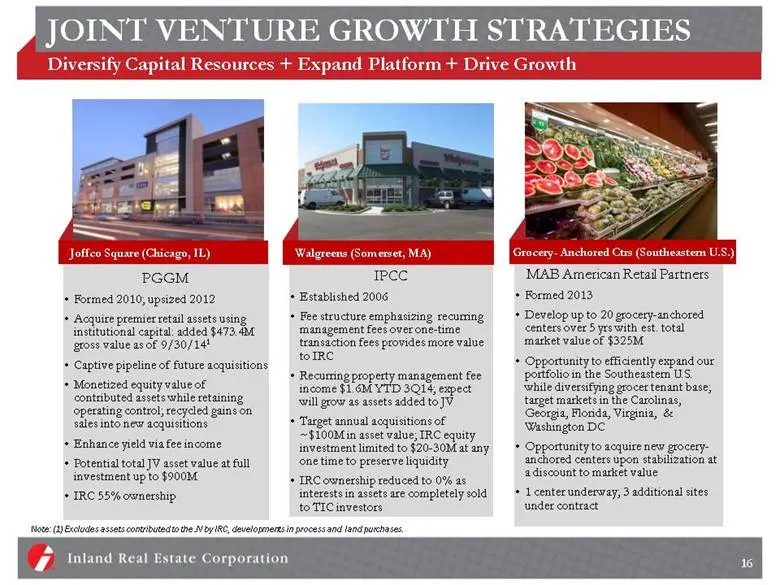
JOINT VENTURE GROWTH STRATEGIES Diversify Capital Resources + Expand Platform + Drive Growth Joffco Square (Chicago, IL) Walgreens (Somerset, MA) 16 Note: (1) Excludes assets contributed to the JV by IRC, developments in process and land purchases. Grocery- Anchored Ctrs (Southeastern U.S.)
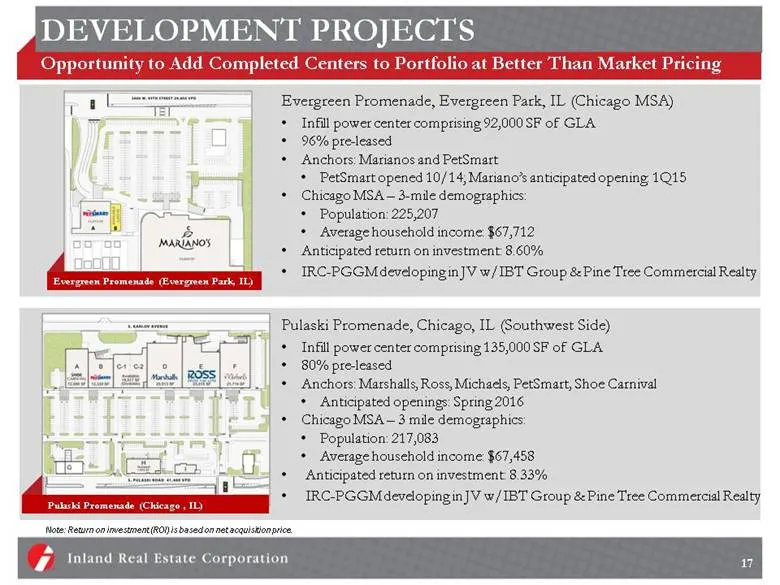
Slide 17: Development Projects
Pulaski Promenade, Chicago, IL (Southwest Side) Infill power center comprising 135,000 SF of GLA 80% pre-leased Anchors: Marshalls, Ross, Michaels, PetSmart, Shoe Carnival Anticipated openings: Spring 2016 Chicago MSA – 3 mile demographics: Population: 217,083 Average household income: $67,458 Antic
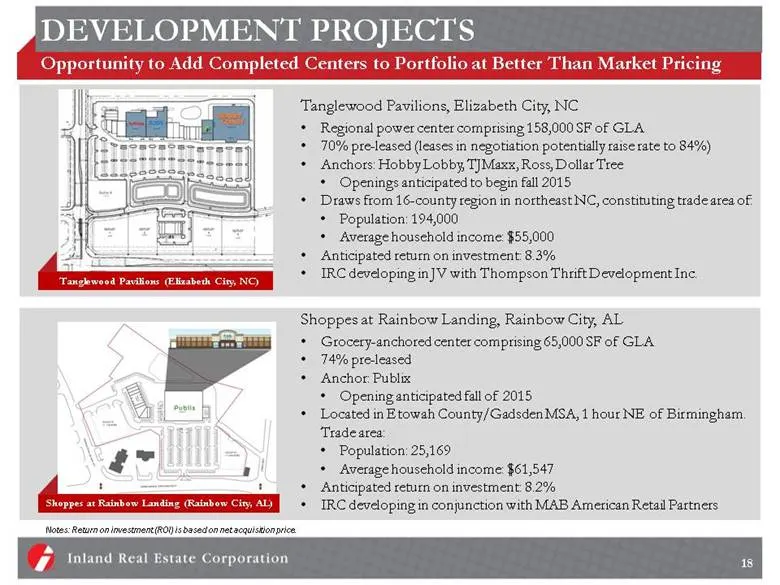
Slide 18: Development Projects
Shoppes at Rainbow Landing, Rainbow City, AL Grocery-anchored center comprising 65,000 SF of GLA 74% pre-leased Anchor: Publix Opening anticipated fall of 2015 Located in Etowah County/Gadsden MSA, 1 hour NE of Birmingham. Trade area: Population: 25,169 Average household income: $61,547 Anticipated
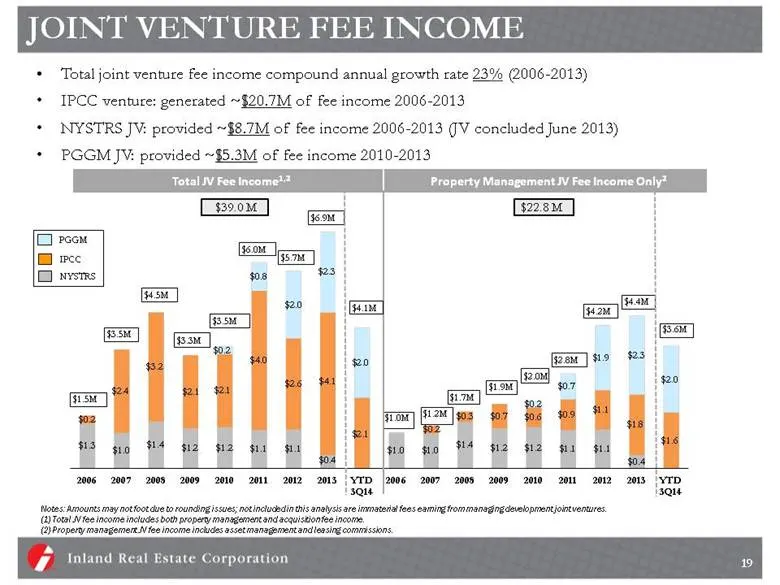
Slide 19: Joint Venture Fee Income
JOINT VENTURE FEE INCOME Total joint venture fee income compound annual growth rate 23% (2006-2013) IPCC venture: generated ~$20.7M of fee income 2006-2013 NYSTRS JV: provided ~$8.7M of fee income 2006-2013 (JV concluded June 2013) PGGM JV: provided ~$5.3M of fee income 2010-2013 $3.5M $3.3M $1.5M $
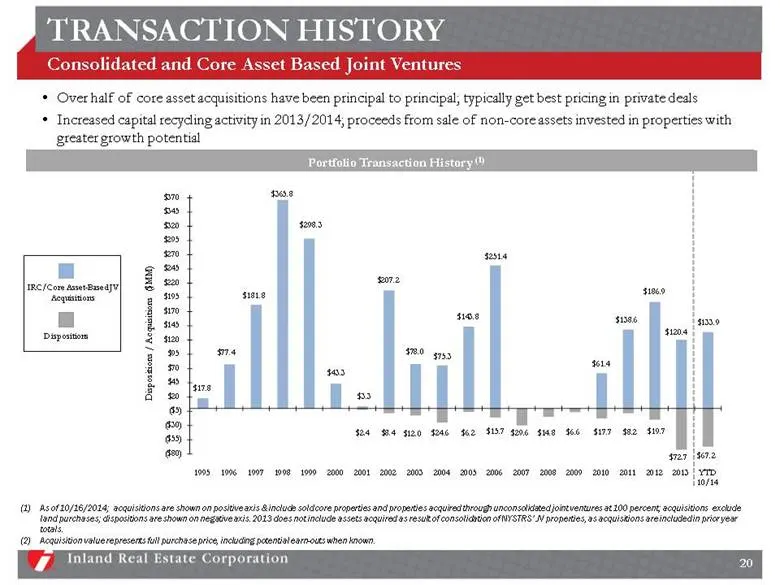
Slide 20: Transaction History
TRANSACTION HISTORY Consolidated and Core Asset Based Joint Ventures Over half of core asset acquisitions have been principal to principal; typically get best pricing in private deals Increased capital recycling activity in 2013/2014; proceeds from sale of non-core assets invested in properties with
Slide 21: Balance Sheet Initiatives
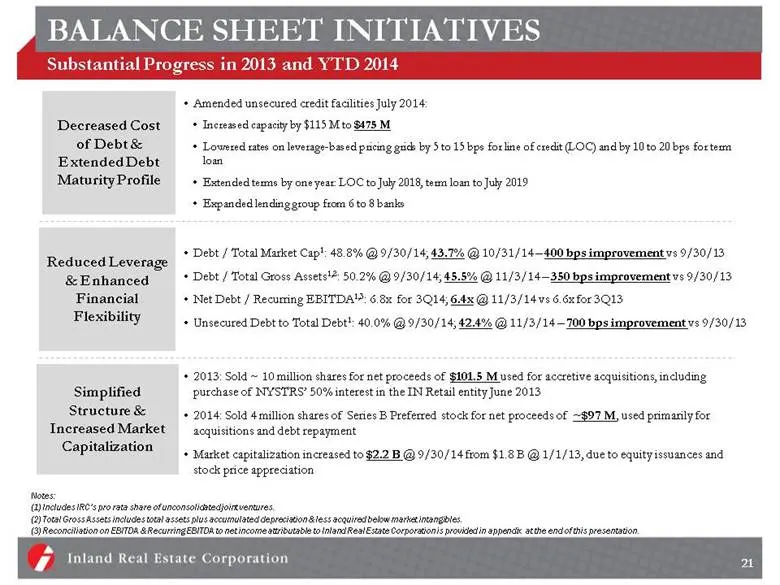
BALANCE SHEET INITIATIVES Substantial Progress in 2013 and YTD 2014 Simplified Structure & Increased Market Capitalization 2013: Sold ~ 10 million shares for net proceeds of $101.5 M used for accretive acquisitions, including purchase of NYSTRS’ 50% interest in the IN Retail entity June 2013 2014: S
Slide 22: Consolidated Debt Maturities
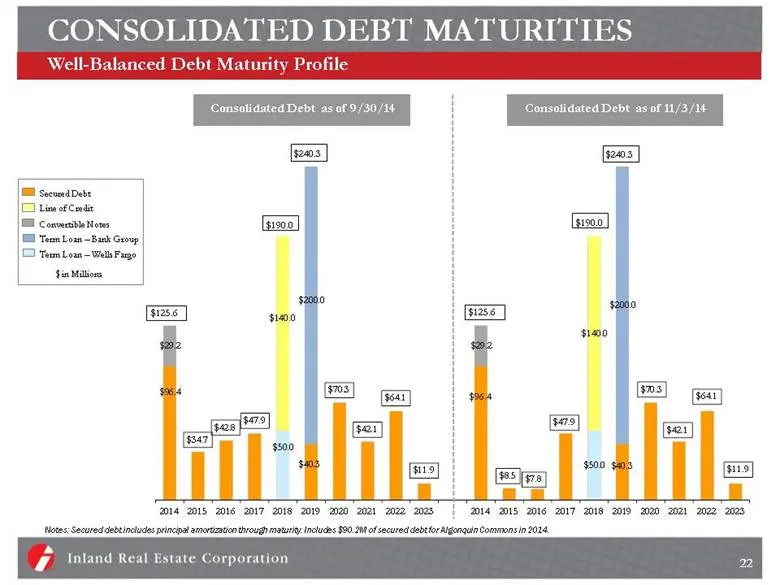
CONSOLIDATED DEBT MATURITIES Well-Balanced Debt Maturity Profile Consolidated Debt as of 9/30/14 Notes: Secured debt includes principal amortization through maturity. Includes $90.2M of secured debt for Algonquin Commons in 2014. $240.3 $190.0 $125.6 22 Secured Debt Term Loan – Wells Fargo Term Loan
Slide 23: Investment Summary
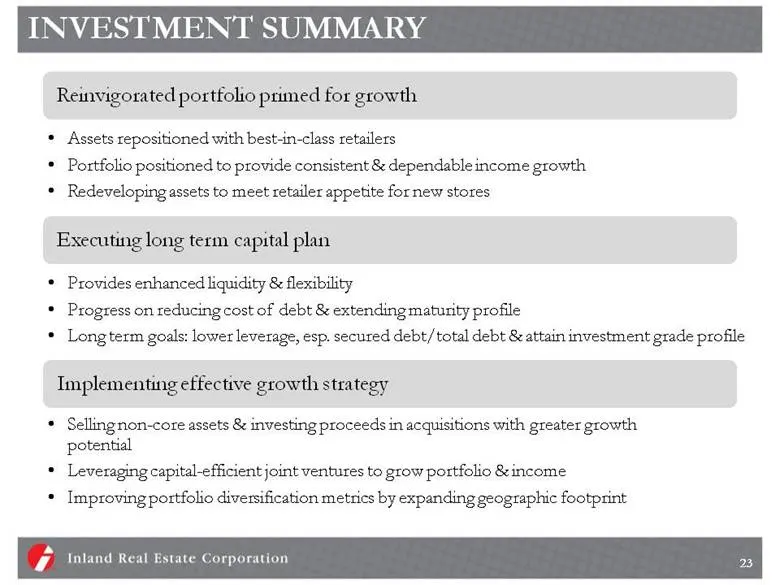
INVESTMENT SUMMARY Assets repositioned with best-in-class retailers Portfolio positioned to provide consistent & dependable income growth Redeveloping assets to meet retailer appetite for new stores Reinvigorated portfolio primed for growth Provides enhanced liquidity & flexibility Progress on reduc
Slide 24: Experienced Leadership Team
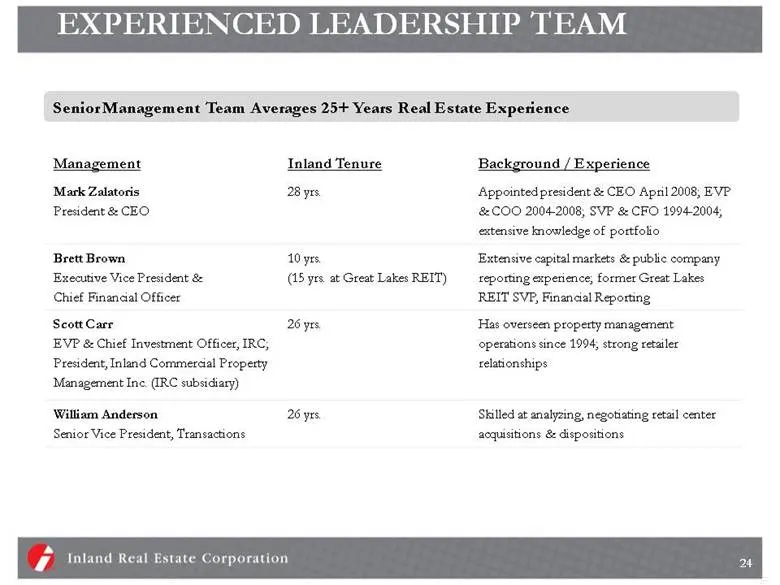
EXPERIENCED LEADERSHIP TEAM Management Inland Tenure Background / Experience Mark Zalatoris President & CEO 28 yrs. Appointed president & CEO April 2008; EVP & COO 2004-2008; SVP & CFO 1994-2004; extensive knowledge of portfolio Brett Brown Executive Vice President & Chief Financial Officer 10 yrs.
Slide 25: Appendix: EBITDA Definition
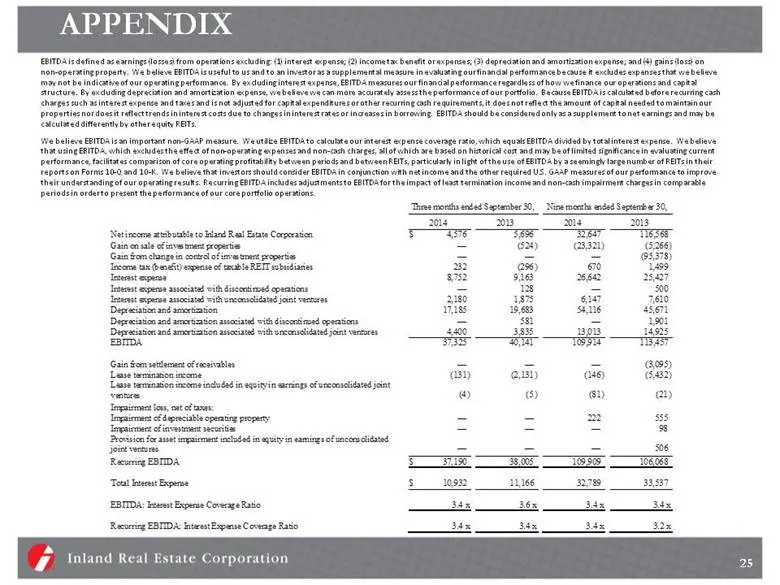
APPENDIX 25 EBITDA is defined as earnings (losses) from operations excluding: (1) interest expense; (2) income tax benefit or expenses; (3) depreciation and amortization expense; and (4) gains (loss) on non-operating property. We believe EBITDA is useful to us and to an investor as a supplemental me
Slide 26: Forward-Looking Statements
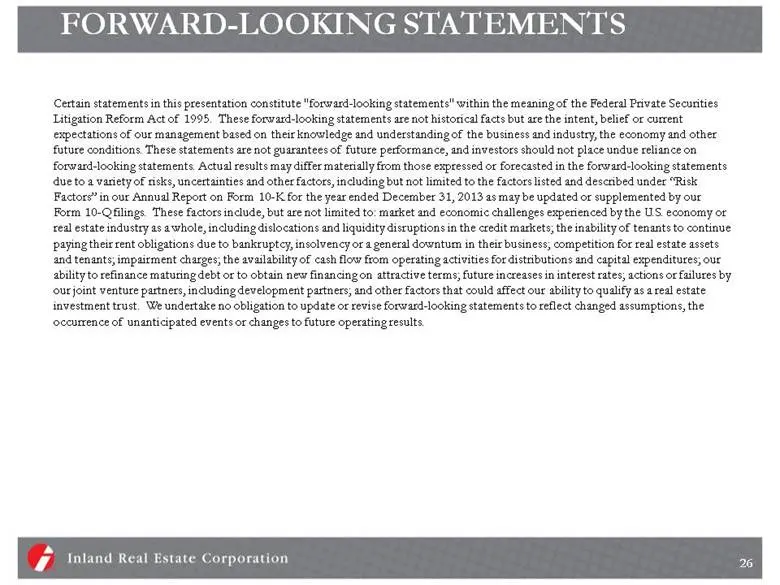
FORWARD-LOOKING STATEMENTS Certain statements in this presentation constitute "forward-looking statements" within the meaning of the Federal Private Securities Litigation Reform Act of 1995. These forward-looking statements are not historical facts but are the intent, belief or current expectations
Source: SEC EDGAR · 8-K filed Nov 5, 2014
More decks from Inland Real Estate Corp
 Investor Presentation (November 2015)30 slides · Nov 17, 2015
 Investor Presentation (September 2015)29 slides · Sep 16, 2015
 Investor Presentation (June 2015)29 slides · Jun 9, 2015
 Investor Presentation (May 2015)26 slides · May 15, 2015
 Investor Presentation (February 2015)26 slides · Feb 24, 2015
 Investor Presentation (September 2014)24 slides · Sep 10, 2014