Inland Real Estate — Investor Presentation (February 2015)
26 slides from Inland Real Estate's investor presentation, Feb 24, 2015
Slide 1: Investor Presentation Fourth Quarter 2014
Investor Presentation Fourth Quarter 2014 (February 2015)
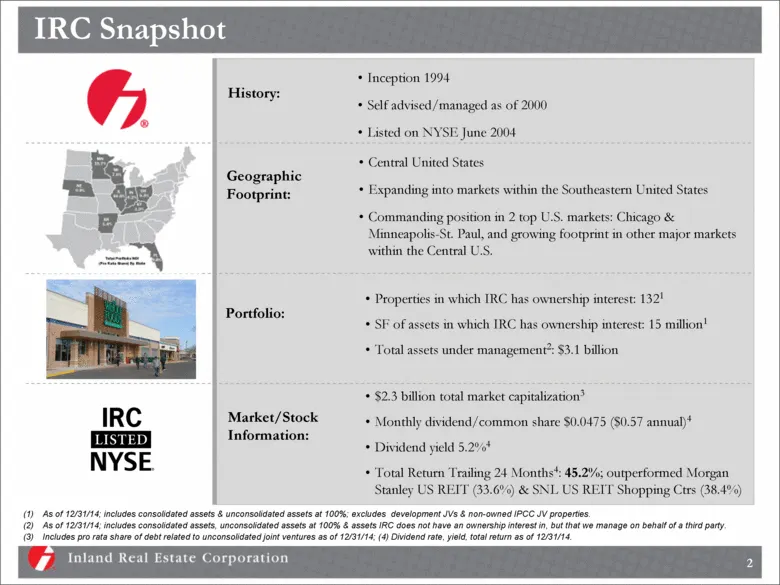
Slide 2: IRC Snapshot
As of 12/31/14; includes consolidated assets & unconsolidated assets at 100%; excludes development JVs & non-owned IPCC JV properties. As of 12/31/14; includes consolidated assets, unconsolidated assets at 100% & assets IRC does not have an ownership interest in, but that we manage on behalf of a th
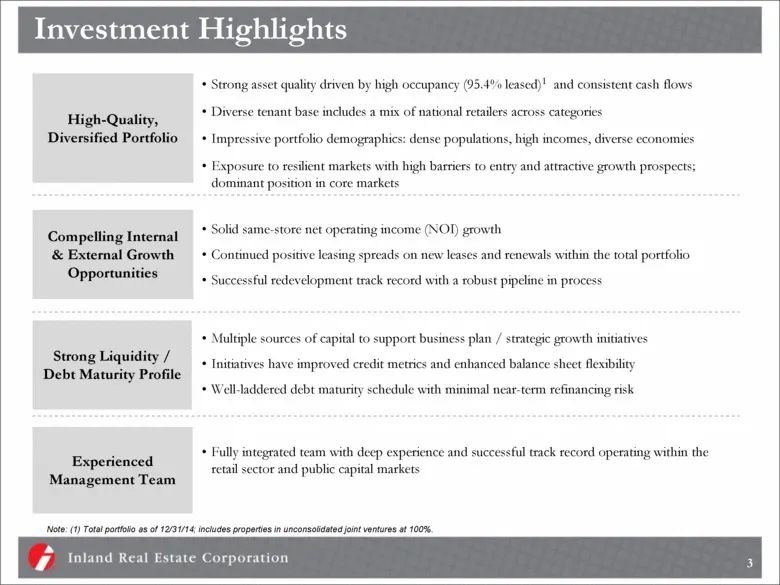
Slide 3: Investment Highlights
Investment Highlights High-Quality, Diversified Portfolio Strong asset quality driven by high occupancy (95.4% leased)1 and consistent cash flows Diverse tenant base includes a mix of national retailers across categories Impressive portfolio demographics: dense populations, high incomes, diverse eco
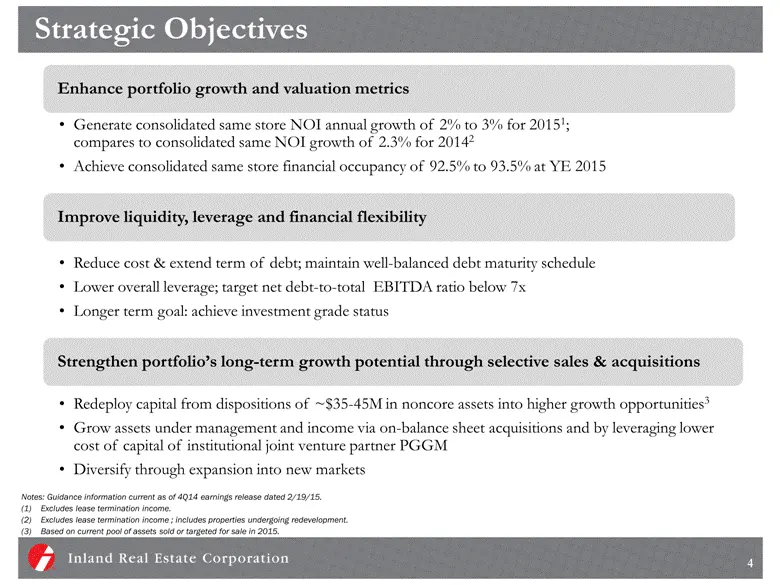
Slide 4: Strategic Objectives
Strategic Objectives Generate consolidated same store NOI annual growth of 2% to 3% for 20151; compares to consolidated same NOI growth of 2.3% for 20142 Achieve consolidated same store financial occupancy of 92.5% to 93.5% at YE 2015 Enhance portfolio growth and valuation metrics Reduce cost & exte
Slide 5: High Quality, Stable Portfolio
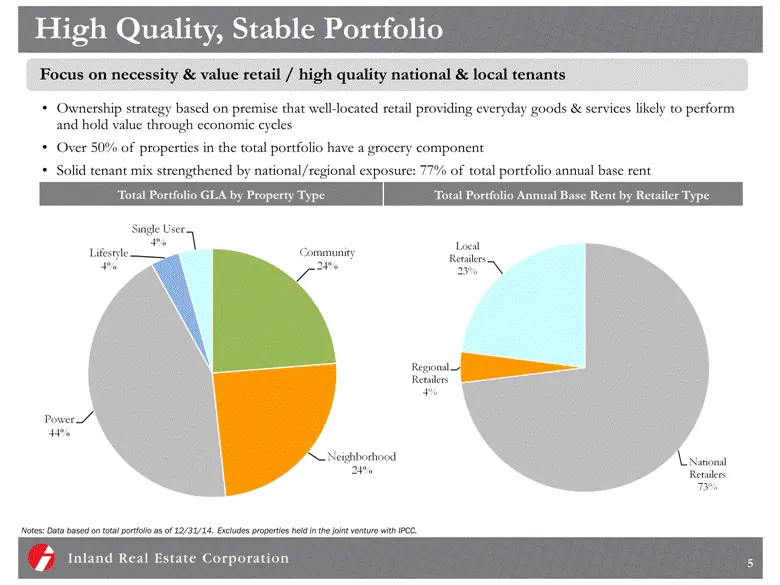
High Quality, Stable Portfolio Ownership strategy based on premise that well-located retail providing everyday goods & services likely to perform and hold value through economic cycles Over 50% of properties in the total portfolio have a grocery component Solid tenant mix strengthened by national/re
Slide 6: Diversified Tenant Base
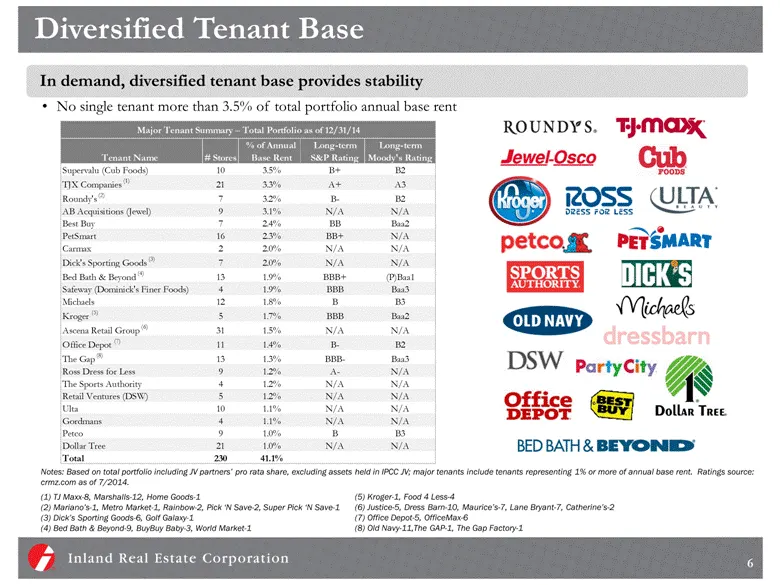
Diversified Tenant Base No single tenant more than 3.5% of total portfolio annual base rent In demand, diversified tenant base provides stability (1) TJ Maxx-8, Marshalls-12, Home Goods-1 (2) Mariano’s-1, Metro Market-1, Rainbow-2, Pick ‘N Save-2, Super Pick ‘N Save-1 (3) Dick’s Sporting Goods-6, Go
Slide 7: Strong Market Demographics
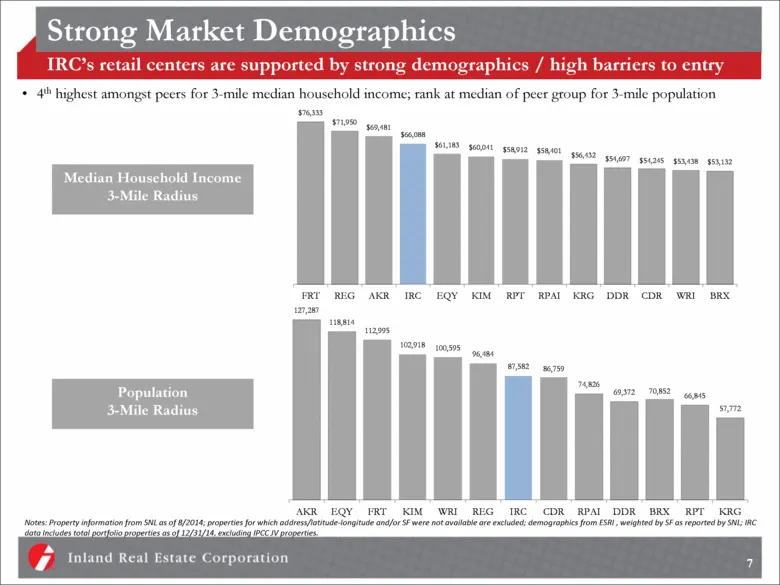
Strong Market Demographics 7 IRC’s retail centers are supported by strong demographics / high barriers to entry 4th highest amongst peers for 3-mile median household income; rank at median of peer group for 3-mile population Notes: Property information from SNL as of 8/2014; properties for which add
Slide 8: Primary Markets
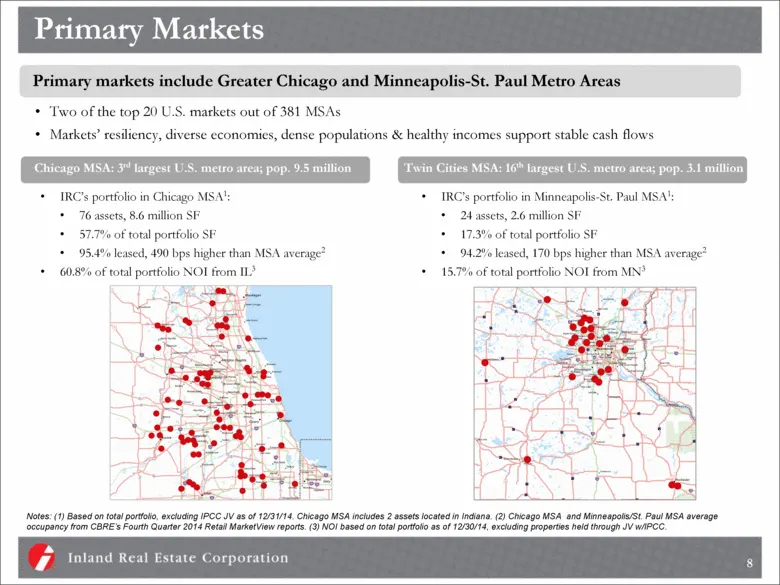
Primary Markets Primary markets include Greater Chicago and Minneapolis-St. Paul Metro Areas Two of the top 20 U.S. markets out of 381 MSAs Markets’ resiliency, diverse economies, dense populations & healthy incomes support stable cash flows Notes: (1) Based on total portfolio, excluding IPCC JV as
Slide 9: Dominant REIT In Primary Markets
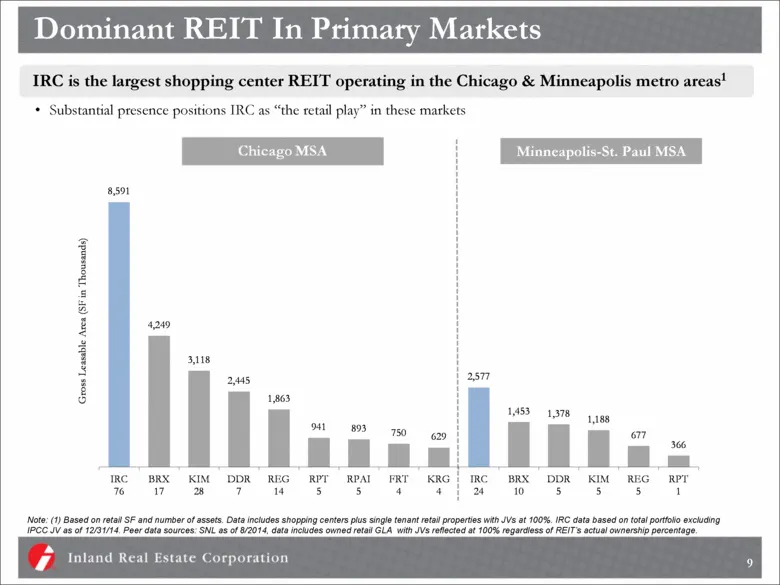
Dominant REIT In Primary Markets IRC is the largest shopping center REIT operating in the Chicago & Minneapolis metro areas1 Substantial presence positions IRC as “the retail play” in these markets Minneapolis-St. Paul MSA Note: (1) Based on retail SF and number of assets. Data includes shopping cen
Slide 10: Operating Strategy in Major Markets
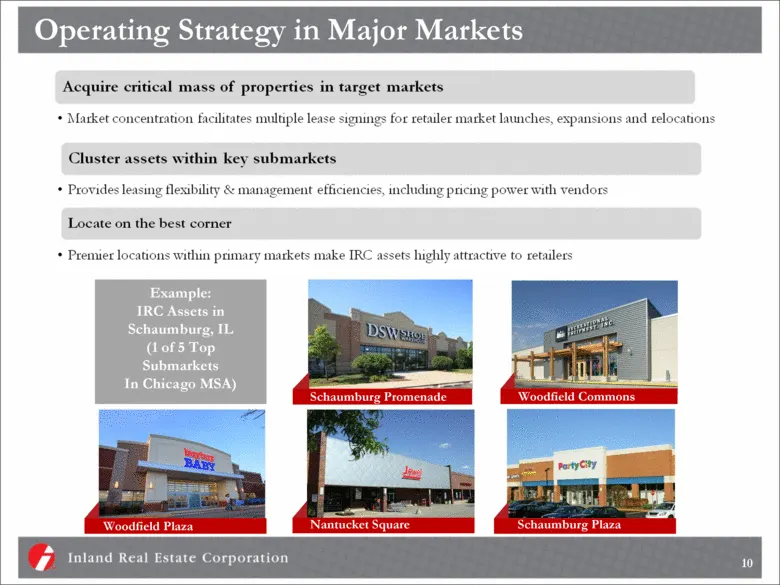
Operating Strategy in Major Markets Schaumburg Promenade Woodfield Plaza Woodfield Commons Nantucket Square Example: IRC Assets in Schaumburg, IL (1 of 5 Top Submarkets In Chicago MSA) 10 Schaumburg Plaza
Slide 11: Internal Growth Positive Rent Spreads
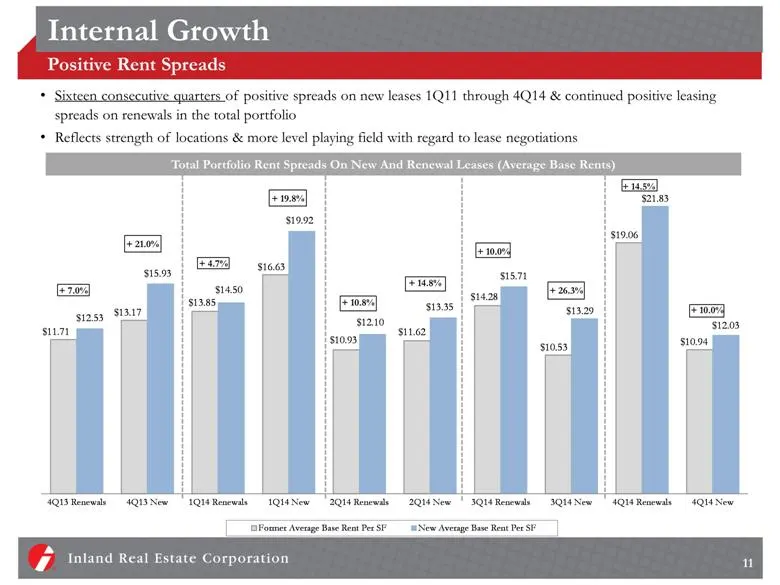
Internal Growth Positive Rent Spreads Sixteen consecutive quarters of positive spreads on new leases 1Q11 through 4Q14 & continued positive leasing spreads on renewals in the total portfolio Reflects strength of locations & more level playing field with regard to lease negotiations + 14.5% + 10.0% +
Slide 12: Value Creation Repositioning/Redevelopment Track Record
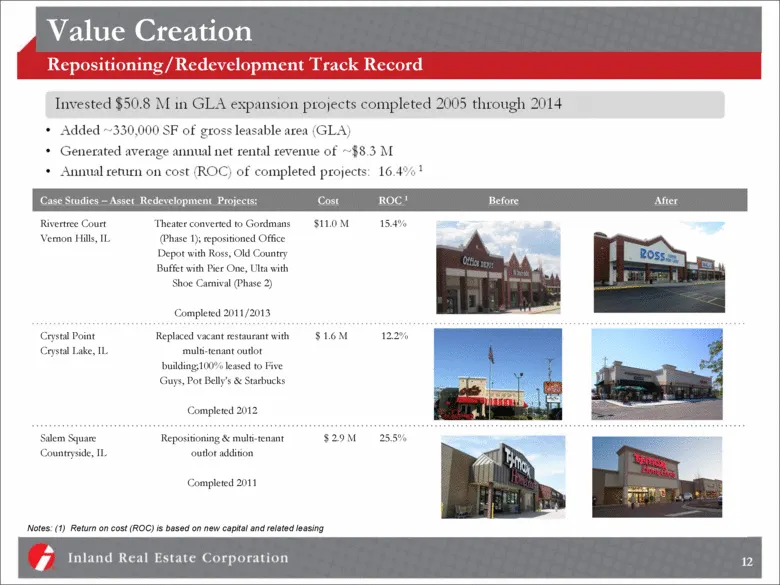
Value Creation Repositioning/Redevelopment Track Record Case Studies – Asset Redevelopment Projects: Cost ROC 1 Before After Rivertree Court Vernon Hills, IL Theater converted to Gordmans (Phase 1); repositioned Office Depot with Ross, Old Country Buffet with Pier One, Ulta with Shoe Carnival (Phase
Slide 13: Market Demand Driving Increased Redevelopment Activity
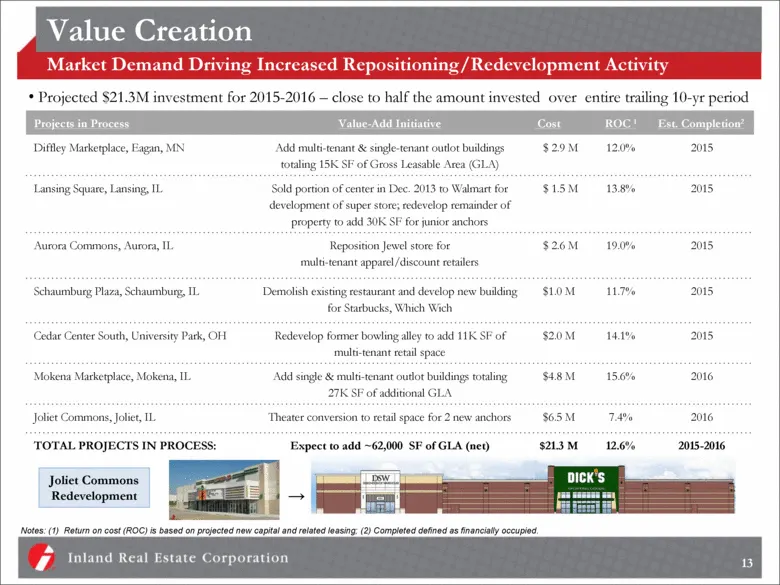
Value Creation Market Demand Driving Increased Repositioning/Redevelopment Activity Notes: (1) Return on cost (ROC) is based on projected new capital and related leasing; (2) Completed defined as financially occupied. 13 Projected $21.3M investment for 2015-2016 – close to half the amount invested o
Slide 14: Disciplined Investment Strategy
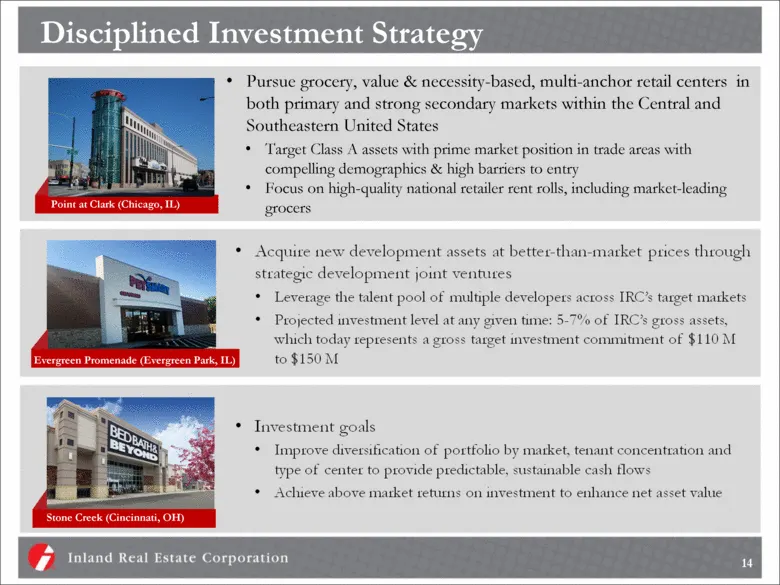
Disciplined Investment Strategy Pursue grocery, value & necessity-based, multi-anchor retail centers in both primary and strong secondary markets within the Central and Southeastern United States Target Class A assets with prime market position in trade areas with compelling demographics & high barr
Slide 15: Acquisition Of NYSTRS Interest In JV
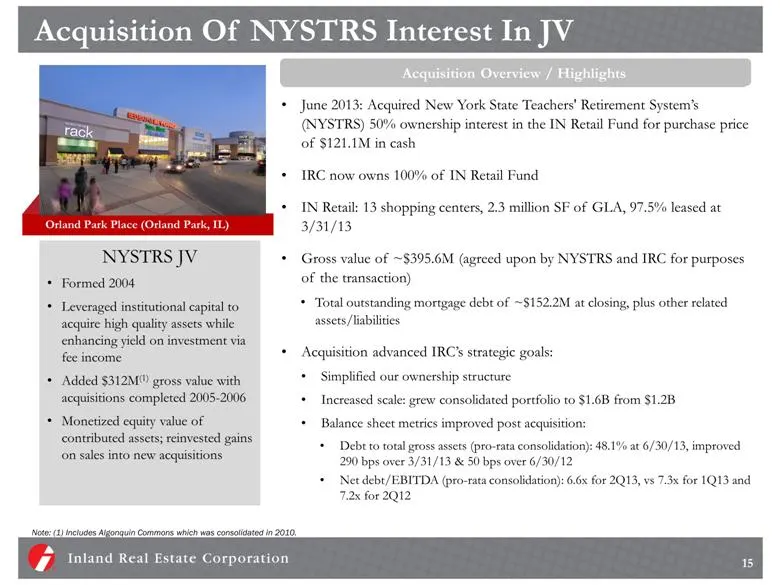
15 Acquisition Of NYSTRS Interest In JV NYSTRS JV Formed 2004 Leveraged institutional capital to acquire high quality assets while enhancing yield on investment via fee income Added $312M(1) gross value with acquisitions completed 2005-2006 Monetized equity value of contributed assets; reinvested ga
Slide 16: Joint Venture Growth Strategies
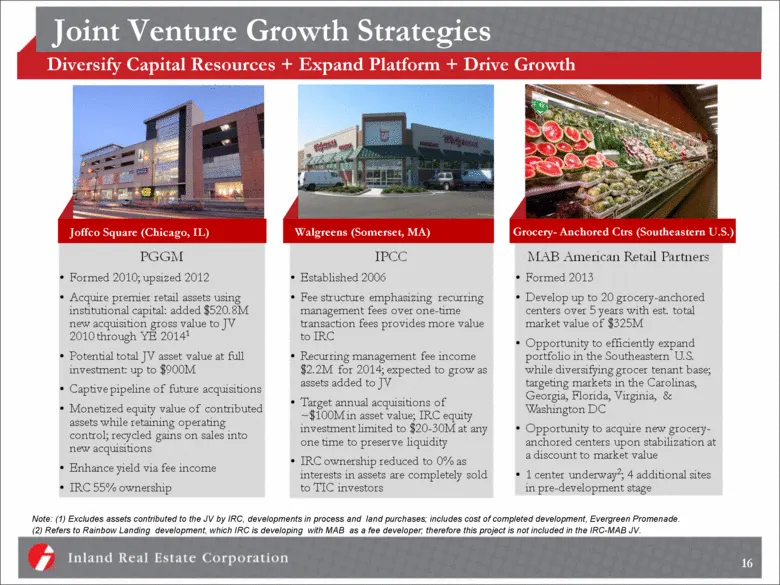
Joint Venture Growth Strategies Diversify Capital Resources + Expand Platform + Drive Growth Joffco Square (Chicago, IL) Walgreens (Somerset, MA) 16 Note: (1) Excludes assets contributed to the JV by IRC, developments in process and land purchases; includes cost of completed development, Evergreen P
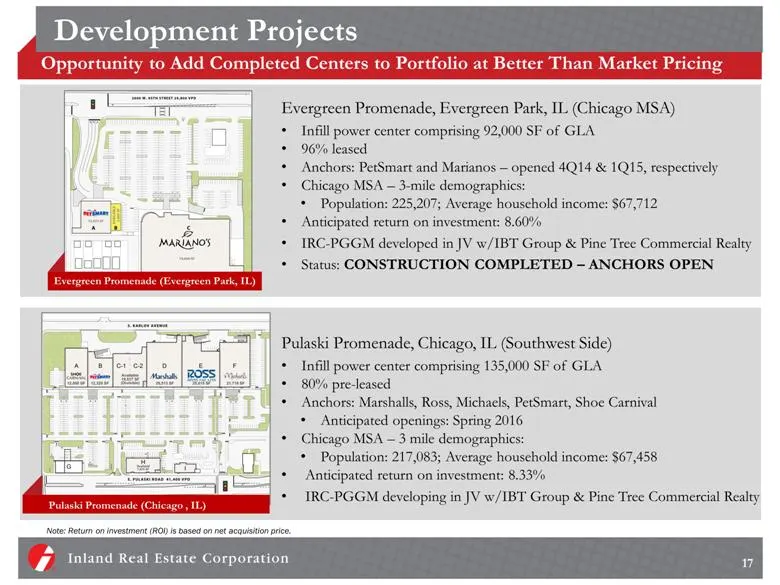
Slide 17: Development Projects
Pulaski Promenade, Chicago, IL (Southwest Side) Infill power center comprising 135,000 SF of GLA 80% pre-leased Anchors: Marshalls, Ross, Michaels, PetSmart, Shoe Carnival Anticipated openings: Spring 2016 Chicago MSA – 3 mile demographics: Population: 217,083; Average household income: $67,458 Anti
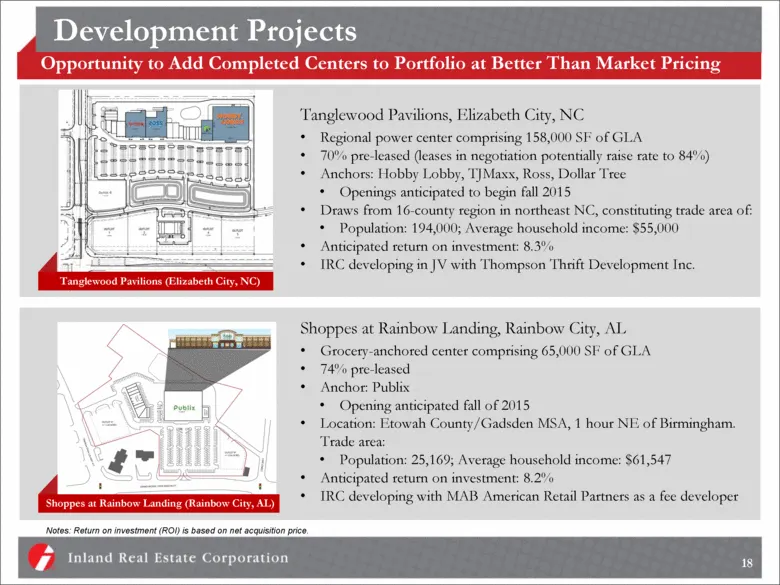
Slide 18: Development Projects
Shoppes at Rainbow Landing, Rainbow City, AL Grocery-anchored center comprising 65,000 SF of GLA 74% pre-leased Anchor: Publix Opening anticipated fall of 2015 Location: Etowah County/Gadsden MSA, 1 hour NE of Birmingham. Trade area: Population: 25,169; Average household income: $61,547 Anticipated
Slide 19: Joint Venture Fee Income
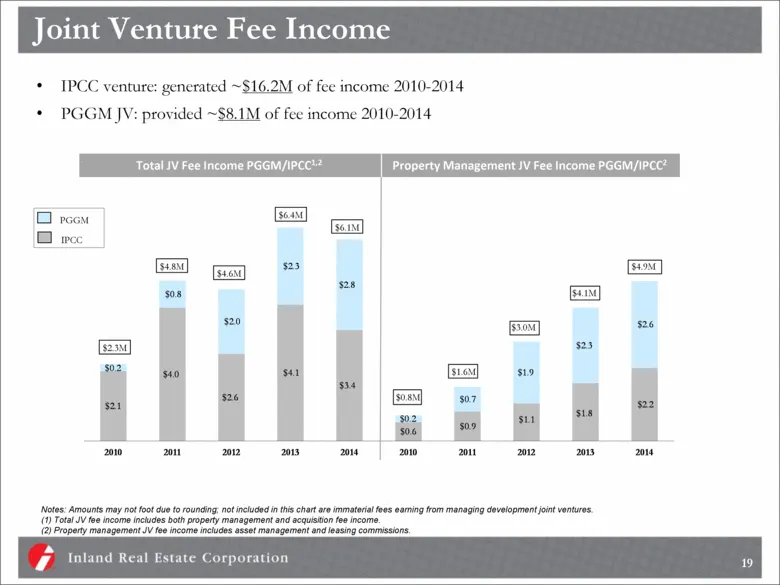
Joint Venture Fee Income IPCC venture: generated ~$16.2M of fee income 2010-2014 PGGM JV: provided ~$8.1M of fee income 2010-2014 Notes: Amounts may not foot due to rounding; not included in this chart are immaterial fees earning from managing development joint ventures. (1) Total JV fee income incl
Slide 20: Transaction History
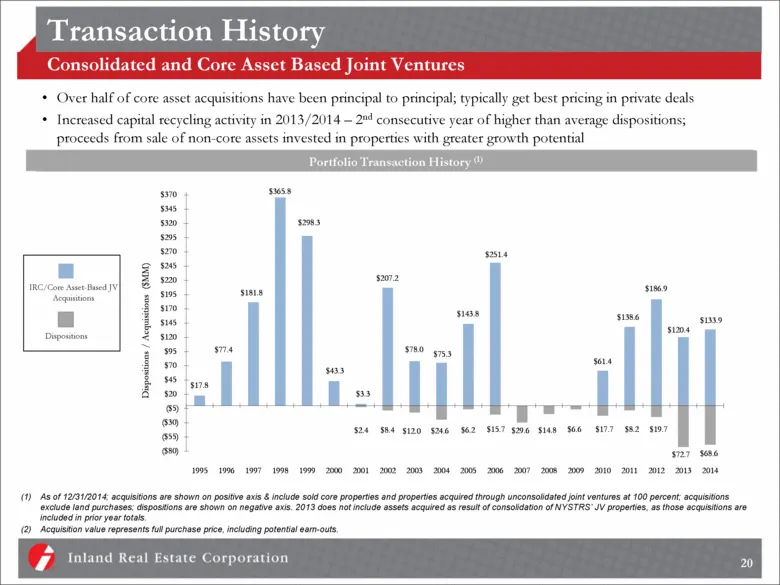
Transaction History Consolidated and Core Asset Based Joint Ventures Over half of core asset acquisitions have been principal to principal; typically get best pricing in private deals Increased capital recycling activity in 2013/2014 – 2nd consecutive year of higher than average dispositions; procee
Slide 21: Issued Equity with Attractive Terms
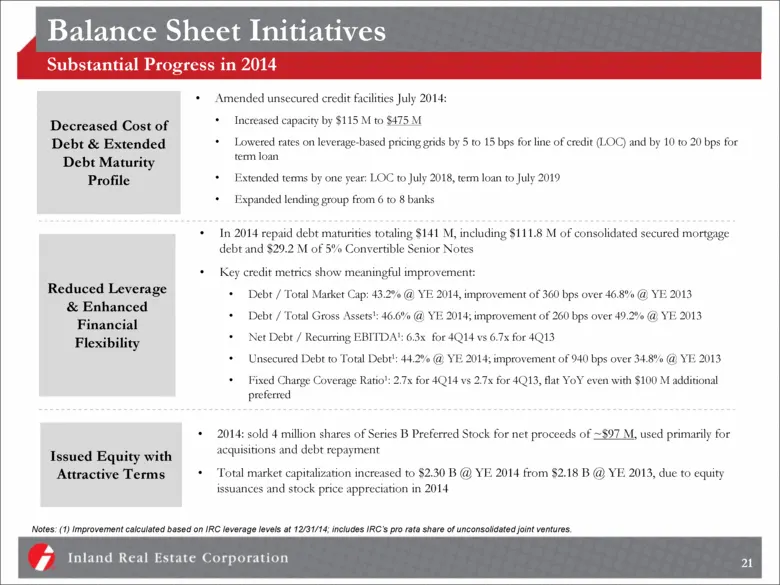
Issued Equity with Attractive Terms 2014: sold 4 million shares of Series B Preferred Stock for net proceeds of ~$97 M, used primarily for acquisitions and debt repayment Total market capitalization increased to $2.30 B @ YE 2014 from $2.18 B @ YE 2013, due to equity issuances and stock price apprec
Slide 22: Consolidated Debt Maturities
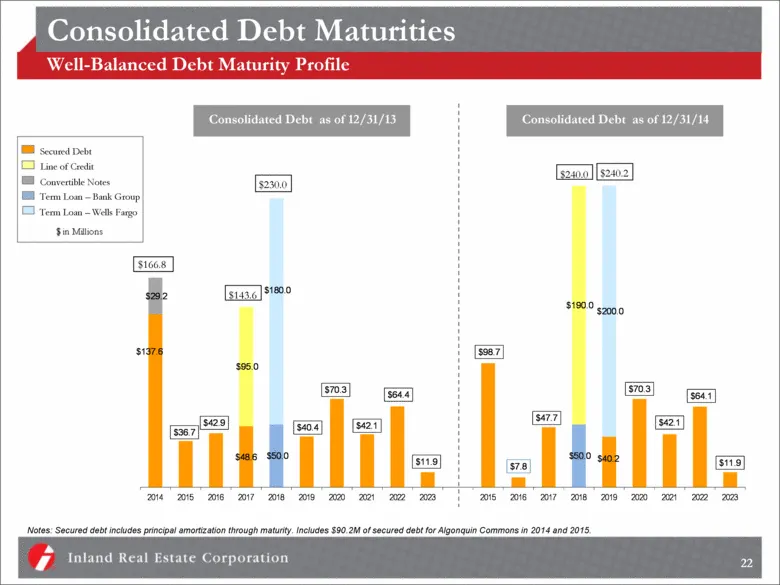
Consolidated Debt Maturities Well-Balanced Debt Maturity Profile 22 Notes: Secured debt includes principal amortization through maturity. Includes $90.2M of secured debt for Algonquin Commons in 2014 and 2015. Consolidated Debt as of 12/31/13 Consolidated Debt as of 12/31/14 $230.0 $143.6 $166.8 $24
Slide 23: Investment Summary
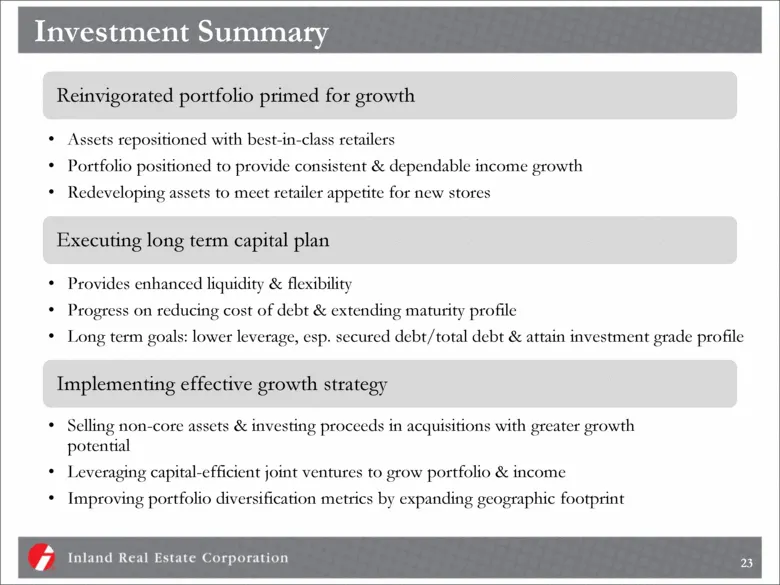
Investment Summary Assets repositioned with best-in-class retailers Portfolio positioned to provide consistent & dependable income growth Redeveloping assets to meet retailer appetite for new stores Reinvigorated portfolio primed for growth Provides enhanced liquidity & flexibility Progress on reduc
Slide 24: Experienced Leadership Team
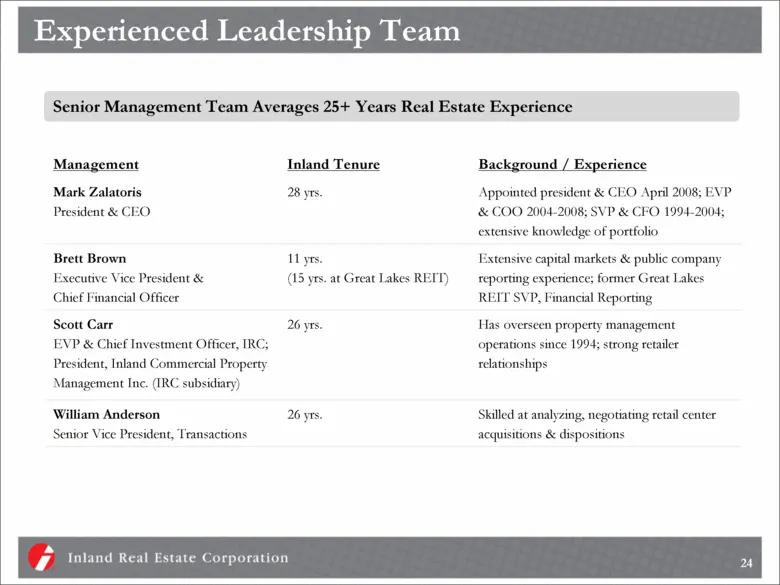
Experienced Leadership Team Management Inland Tenure Background / Experience Mark Zalatoris President & CEO 28 yrs. Appointed president & CEO April 2008; EVP & COO 2004-2008; SVP & CFO 1994-2004; extensive knowledge of portfolio Brett Brown Executive Vice President & Chief Financial Officer 11 yrs.
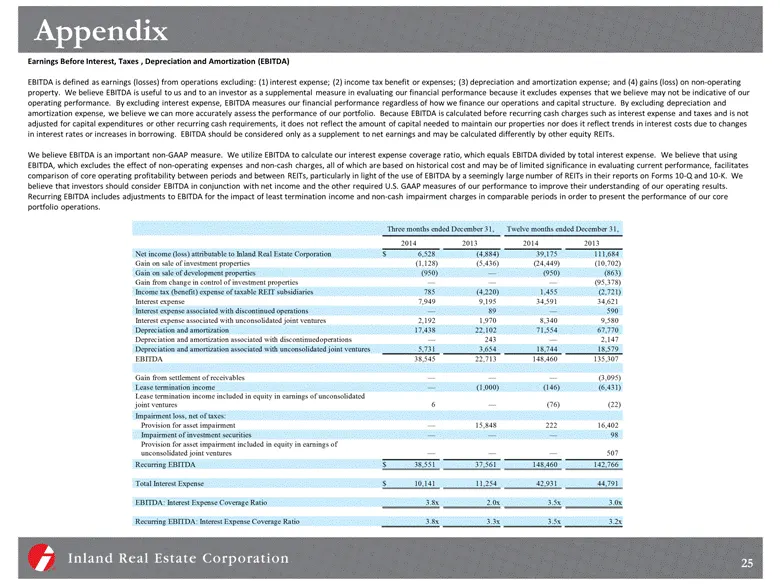
Slide 25: Appendix: EBITDA
Appendix 25 Earnings Before Interest, Taxes , Depreciation and Amortization (EBITDA) EBITDA is defined as earnings (losses) from operations excluding: (1) interest expense; (2) income tax benefit or expenses; (3) depreciation and amortization expense; and (4) gains (loss) on non-operating property.
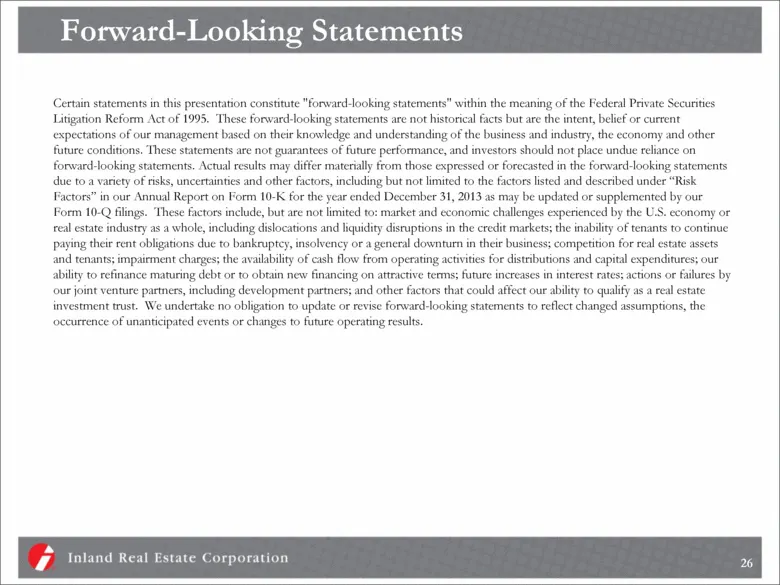
Slide 26: Forward-Looking Statements
Forward-Looking Statements Certain statements in this presentation constitute "forward-looking statements" within the meaning of the Federal Private Securities Litigation Reform Act of 1995. These forward-looking statements are not historical facts but are the intent, belief or current expectations
Source: SEC EDGAR · 8-K filed Feb 24, 2015
More decks from Inland Real Estate Corp
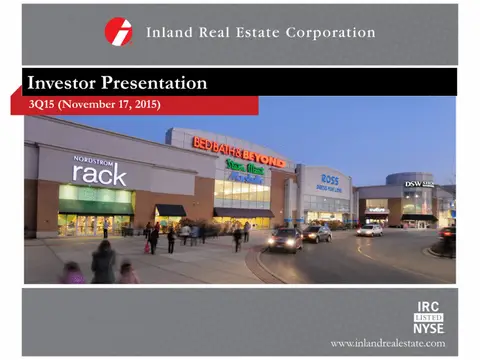 Investor Presentation (November 2015)30 slides · Nov 17, 2015
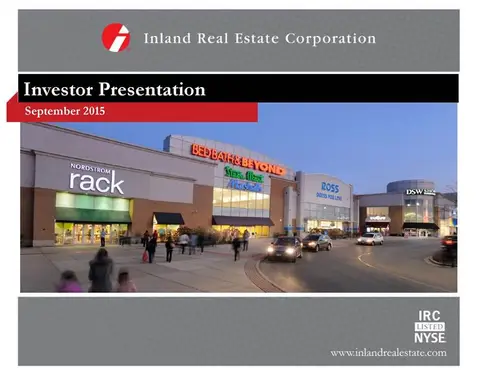 Investor Presentation (September 2015)29 slides · Sep 16, 2015
 Investor Presentation (June 2015)29 slides · Jun 9, 2015
 Investor Presentation (May 2015)26 slides · May 15, 2015
 Investor Presentation (November 2014)26 slides · Nov 5, 2014
 Investor Presentation (September 2014)24 slides · Sep 10, 2014