GR. Sarantis S.A. · ATHEX:SAR
GR. Sarantis — Sarantis Group — Investor Presentation (April 2021)
28 slides from GR. Sarantis's investor presentation, April 2021

Slide 1: Corporate Presentation April 2021
Corporate Presentation April 2021
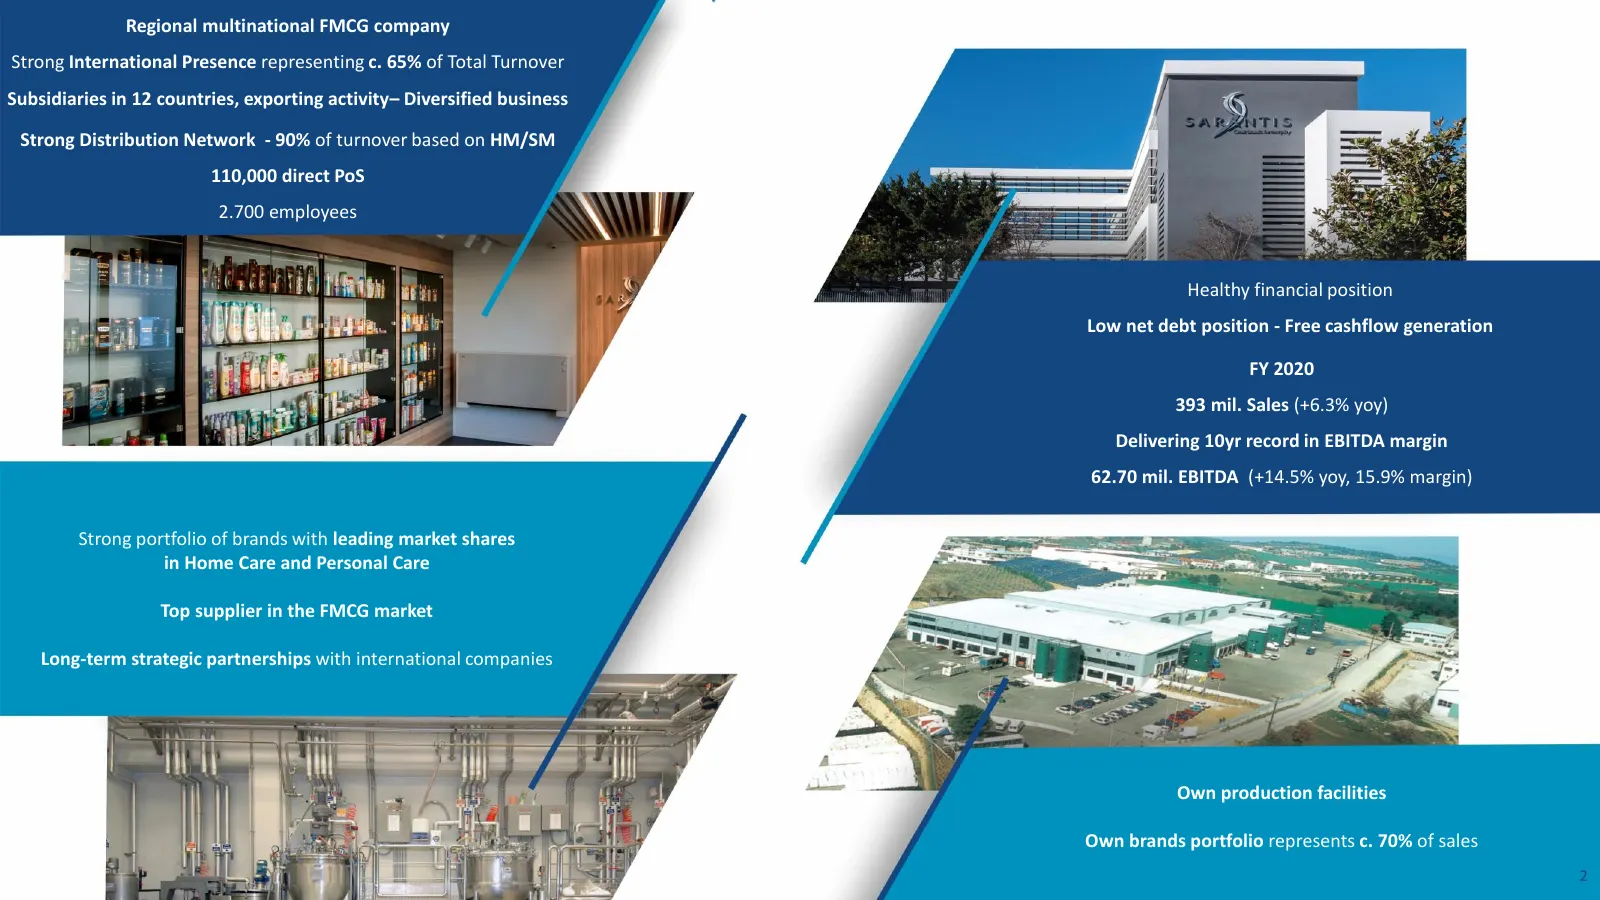
Slide 2: Regional multinational FMCG company
Regional multinational FMCG company Strong International Presence representing c. 65% of Total Turnover Subsidiaries in 12 countries, exporting activity– Diversified business Strong Distribution Network - 90% of turnover based on HM/SM 110,000 direct PoS 2.700 employees Healthy financial position Lo
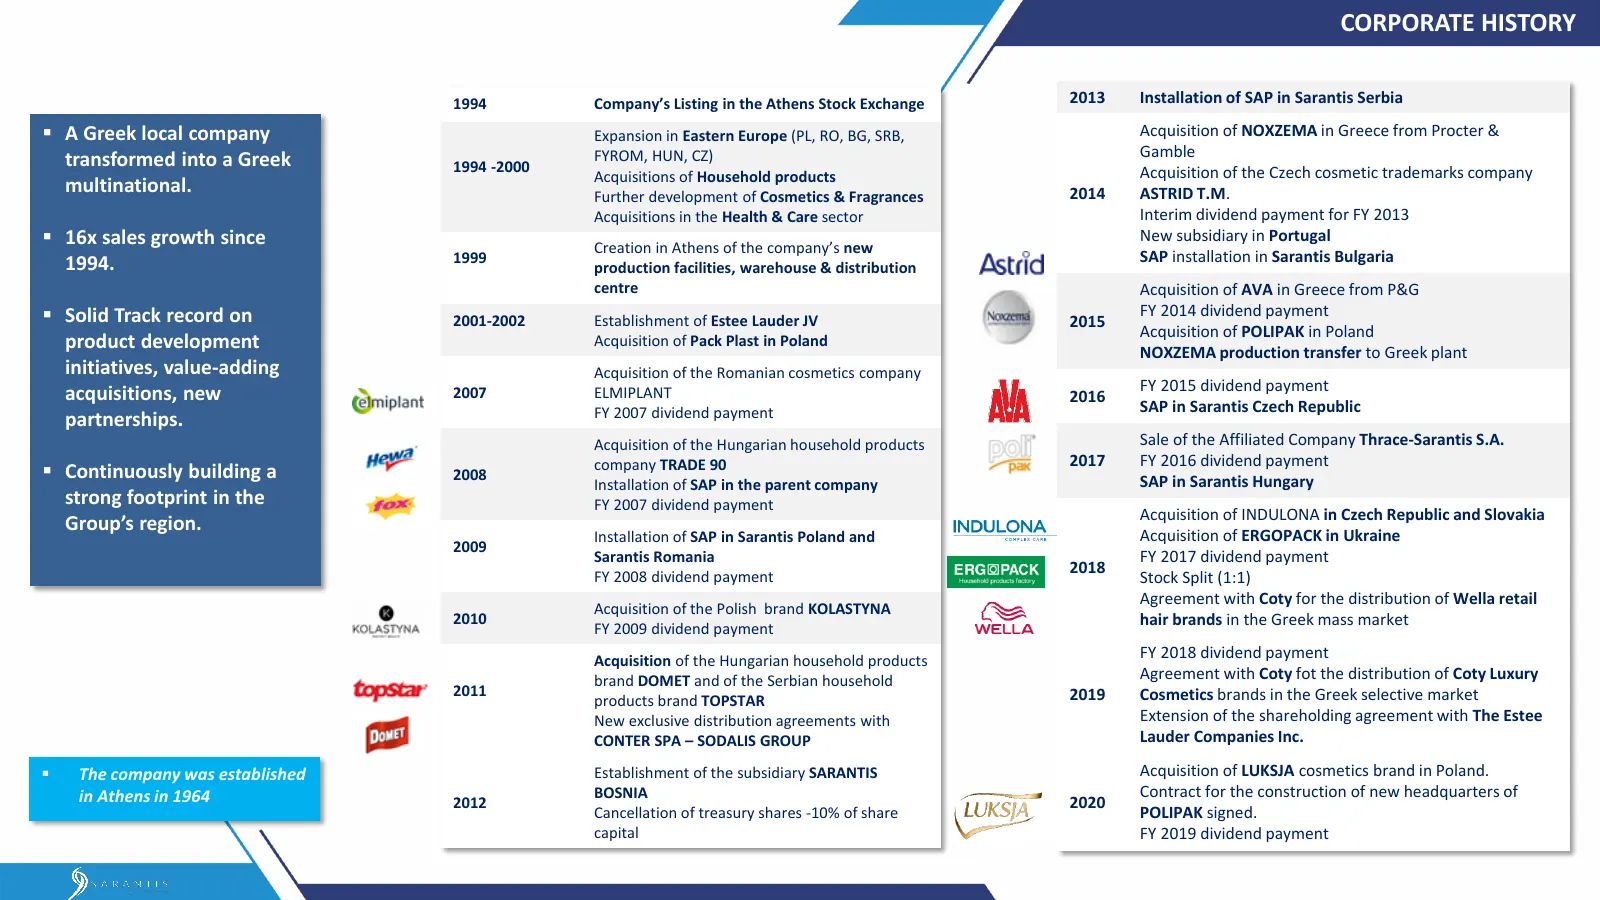
Slide 3: Corporate History
CORPORATE HISTORY 1994 Company’s Listing in the Athens Stock Exchange 2013 Installation of SAP in Sarantis Serbia ▪ A Greek local company Expansion in Eastern Europe (PL, RO, BG, SRB, Acquisition of NOXZEMA in Greece from Procter & transformed into a Greek FYROM, HUN, CZ) Gamble 1994 -2000 Acquisiti
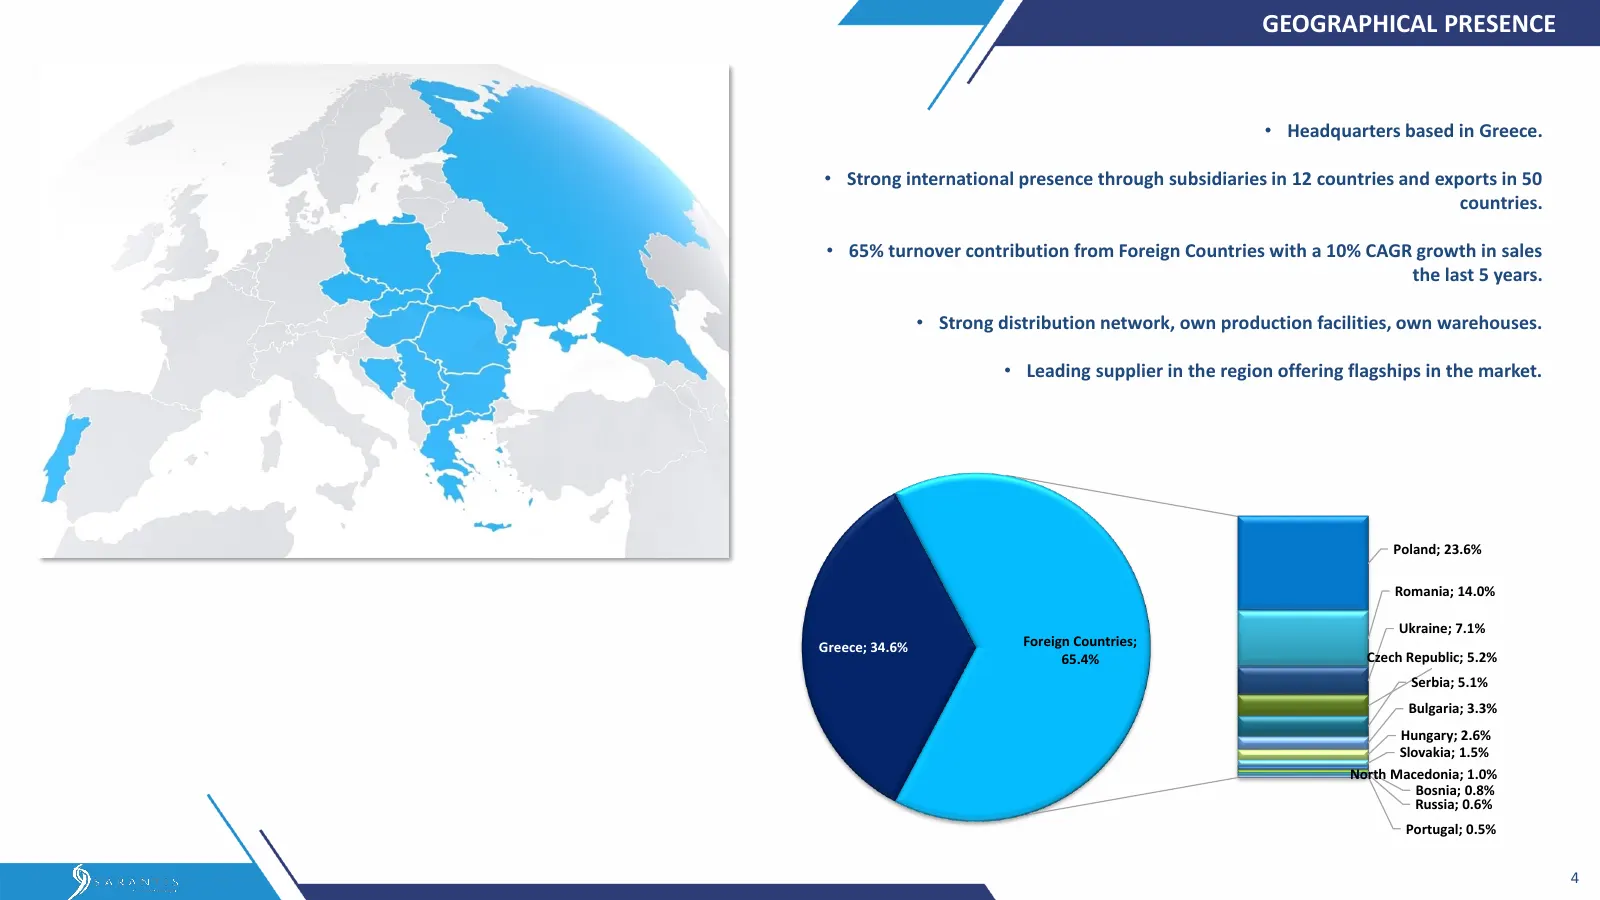
Slide 4: Geographical Presence
GEOGRAPHICAL PRESENCE • Headquarters based in Greece. • Strong international presence through subsidiaries in 12 countries and exports in 50 countries. • 65% turnover contribution from Foreign Countries with a 10% CAGR growth in sales the last 5 years. • Strong distribution network, own production f
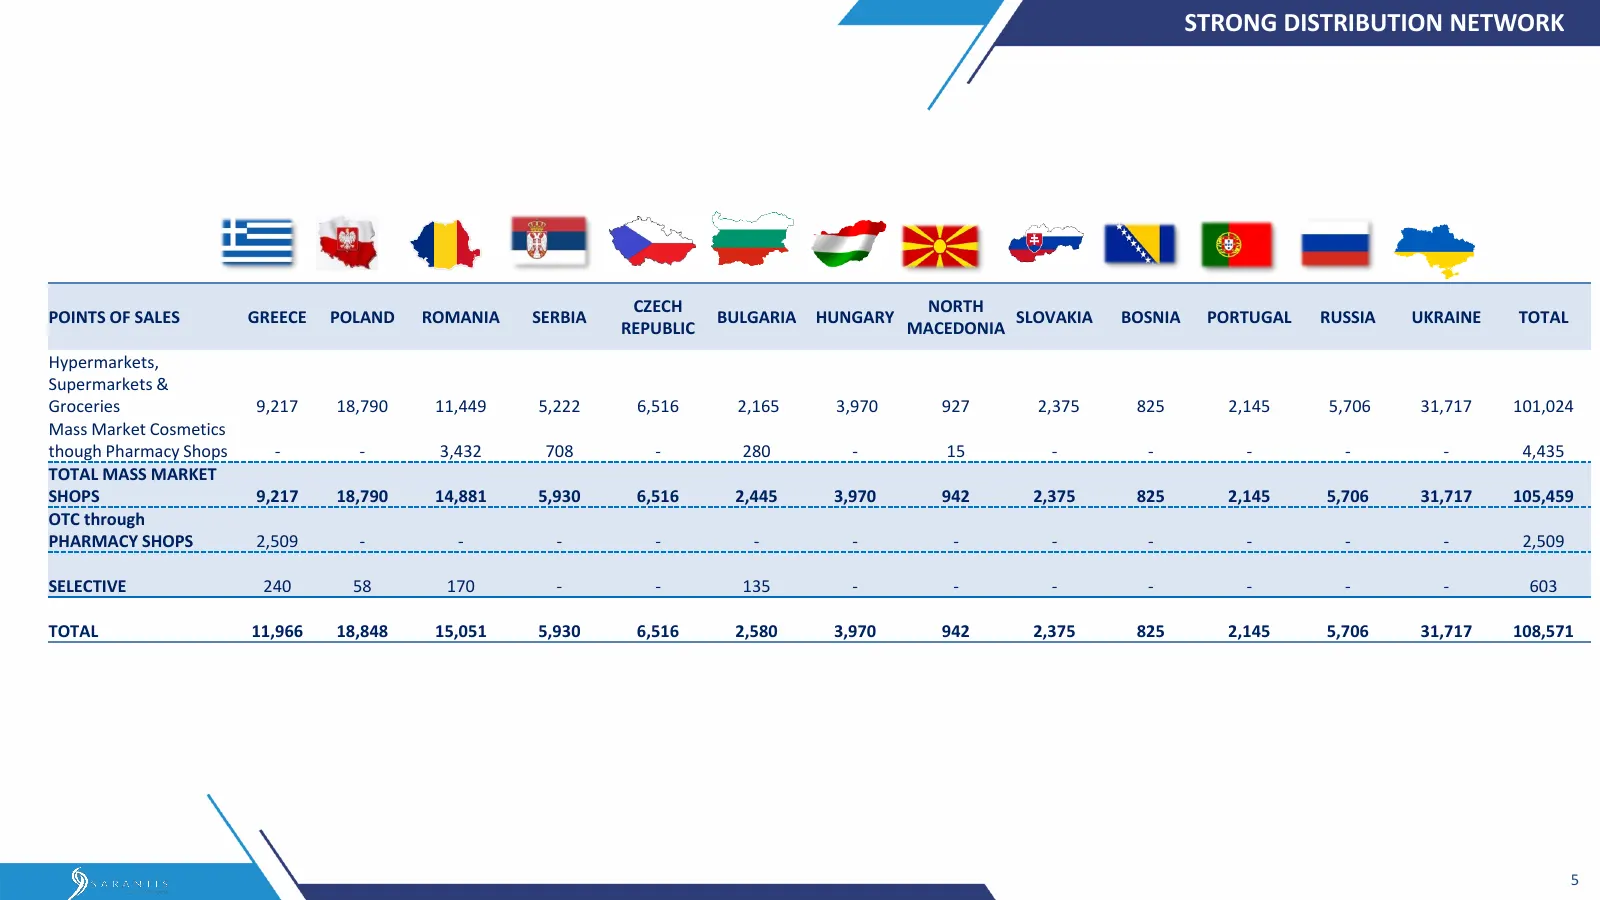
Slide 5: Strong Distribution Network
STRONG DISTRIBUTION NETWORK CZECH NORTH POINTS OF SALES GREECE POLAND ROMANIA SERBIA BULGARIA HUNGARY SLOVAKIA BOSNIA PORTUGAL RUSSIA UKRAINE TOTAL REPUBLIC MACEDONIA Hypermarkets, Supermarkets & Groceries 9,217 18,790 11,449 5,222 6,516 2,165 3,970 927 2,375 825 2,145 5,706 31,717 101,024 Mass Mark
Slide 6: Production Plants
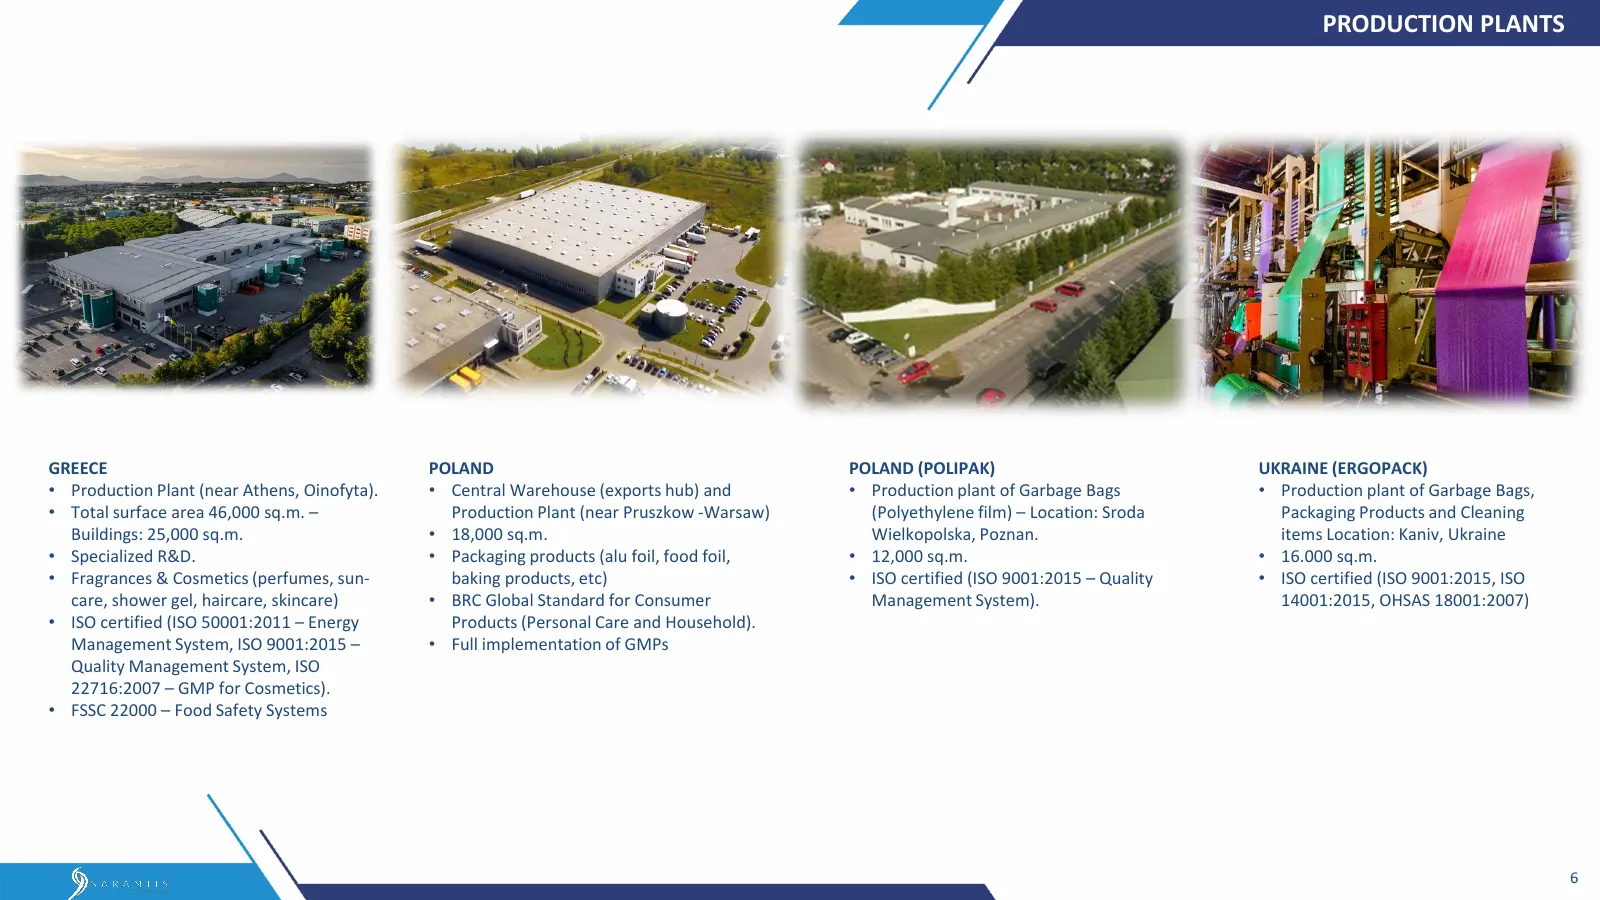
PRODUCTION PLANTS GREECE POLAND POLAND (POLIPAK) UKRAINE (ERGOPACK) • Production Plant (near Athens, Oinofyta). • Central Warehouse (exports hub) and • Production plant of Garbage Bags • Production plant of Garbage Bags, • Total surface area 46,000 sq.m. – Production Plant (near Pruszkow -Warsaw) (P
Slide 7: Top Supplier of Key Accounts
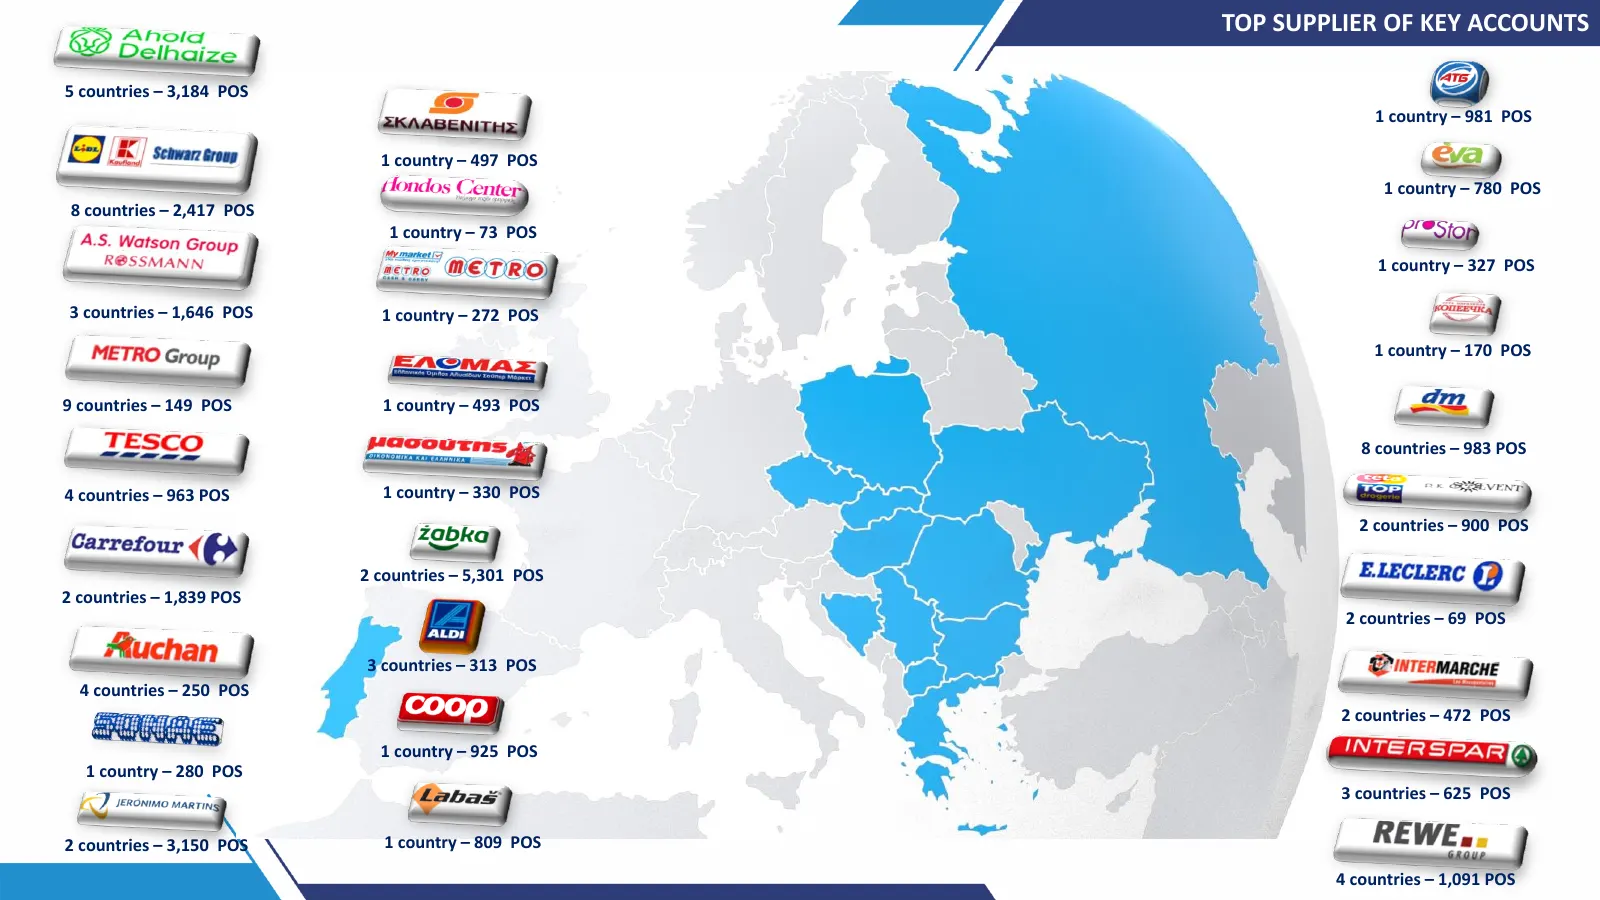
TOP SUPPLIER OF KEY ACCOUNTS 5 countries – 3,184 POS 1 country – 981 POS 1 country – 497 POS 1 country – 780 POS 8 countries – 2,417 POS 1 country – 73 POS 1 country – 327 POS 3 countries – 1,646 POS 1 country – 272 POS 1 country – 170 POS 9 countries – 149 POS 1 country – 493 POS 8 countries – 983
Slide 8: Sarantis Brand Portfolio
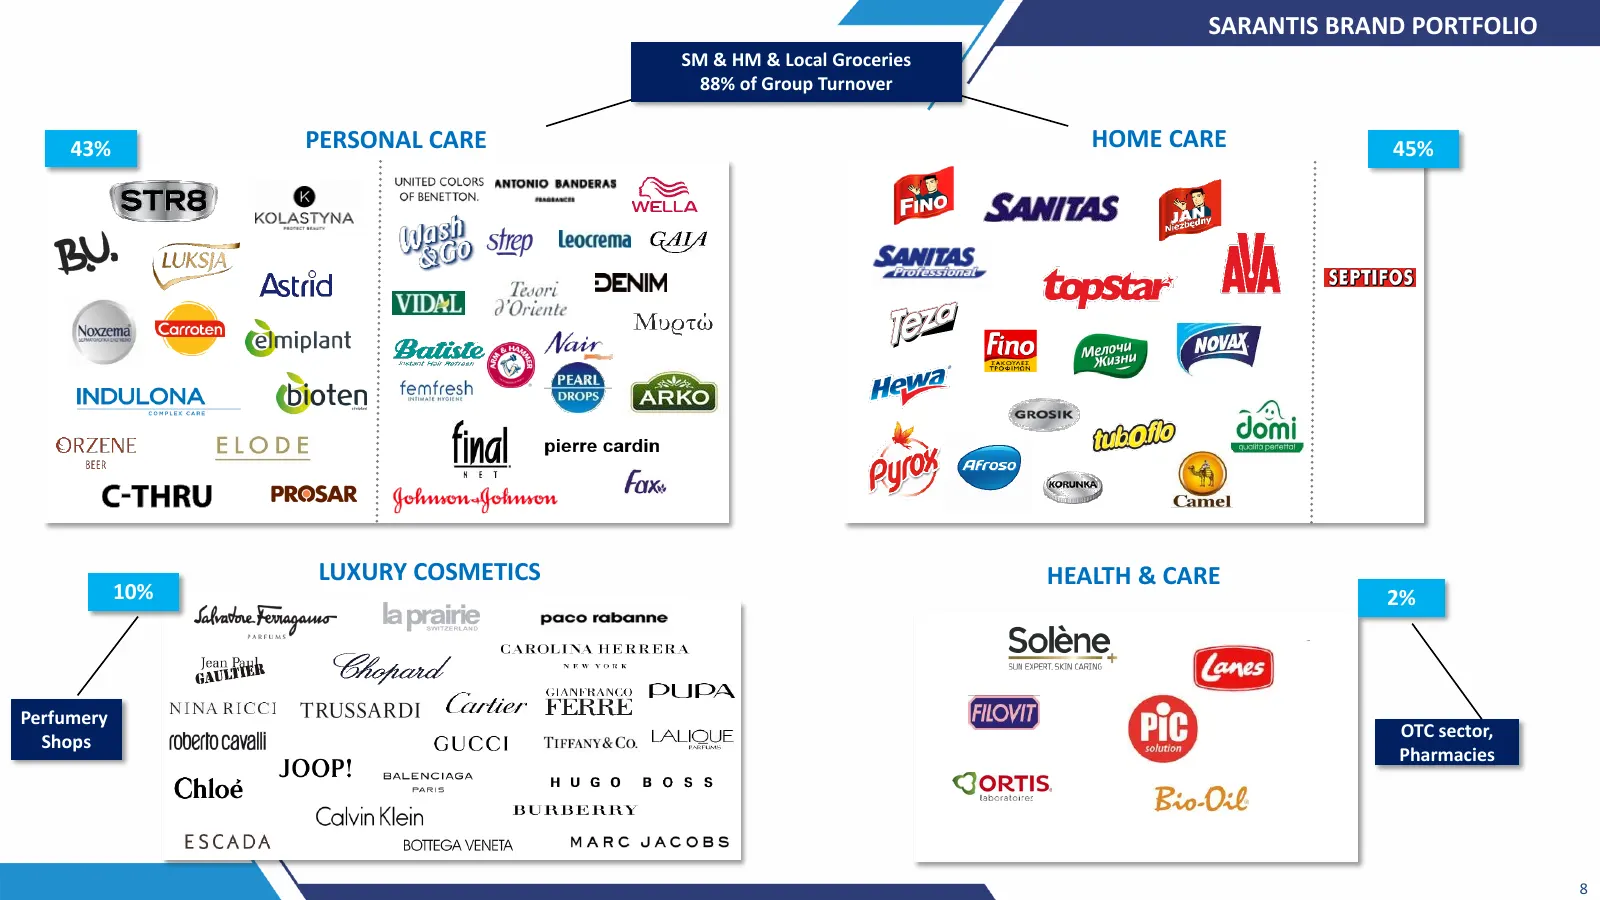
SARANTIS BRAND PORTFOLIO SM & HM & Local Groceries 88% of Group Turnover 43% PERSONAL CARE HOME CARE 45% LUXURY COSMETICS HEALTH & CARE 10% 2% Perfumery OTC sector, Shops Pharmacies 8
Slide 9: Own Brand Portfolio - Cosmetics
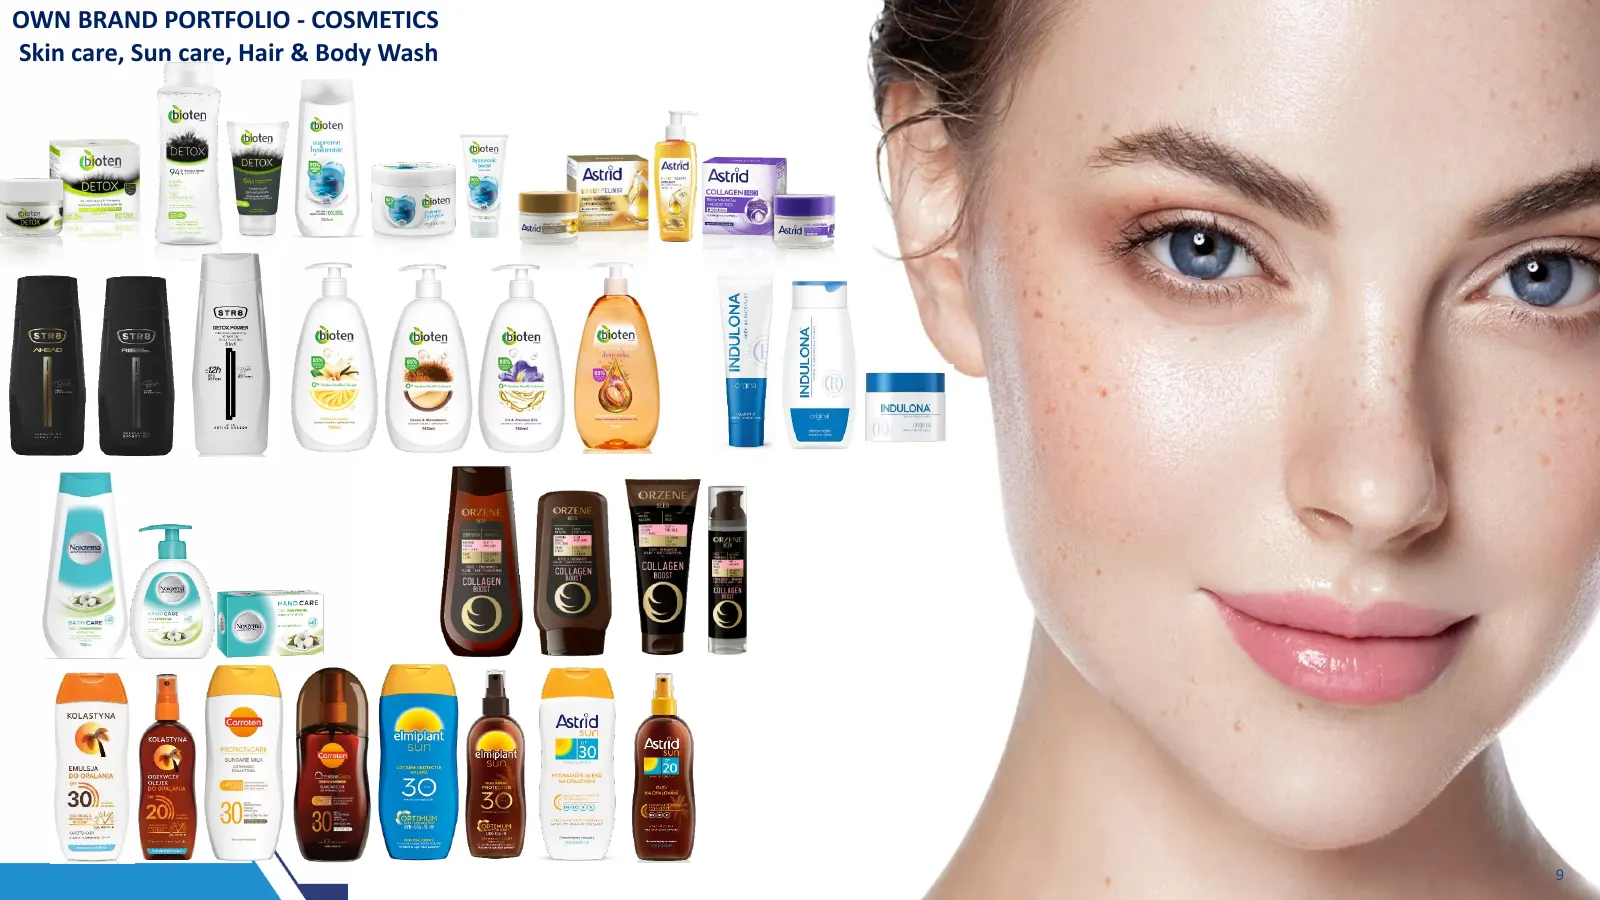
OWN BRAND PORTFOLIO - COSMETICS Skin care, Sun care, Hair & Body Wash 9
Slide 10: Own Brand Portfolio – Toiletries
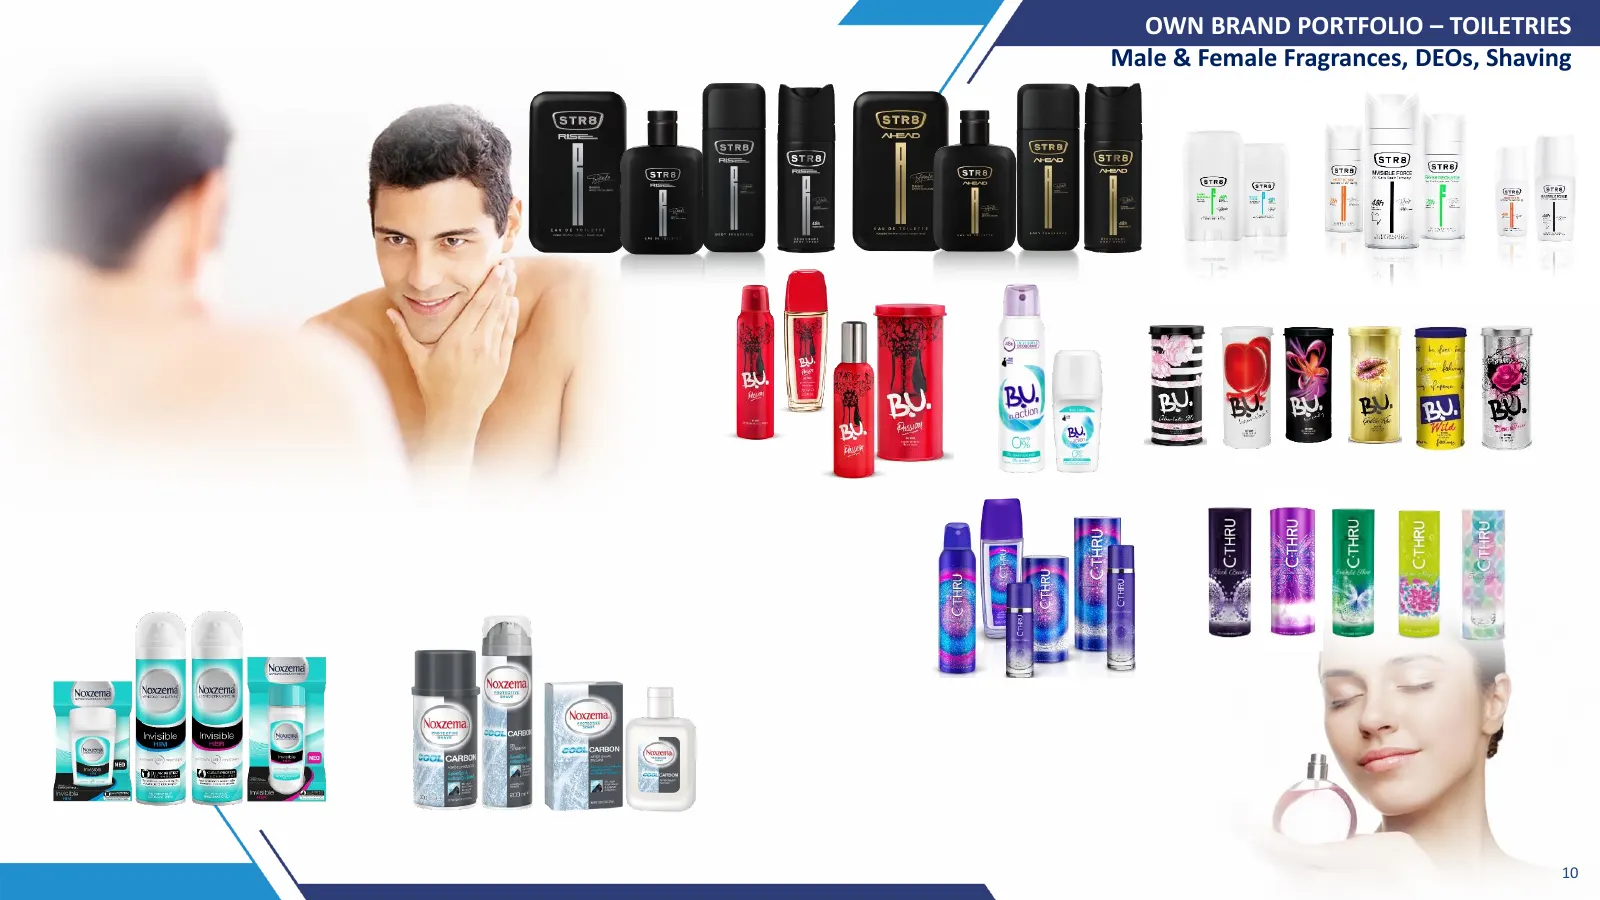
OWN BRAND PORTFOLIO – TOILETRIES Male & Female Fragrances, DEOs, Shaving 10
Slide 11: Own Brand Portfolio – Household Products
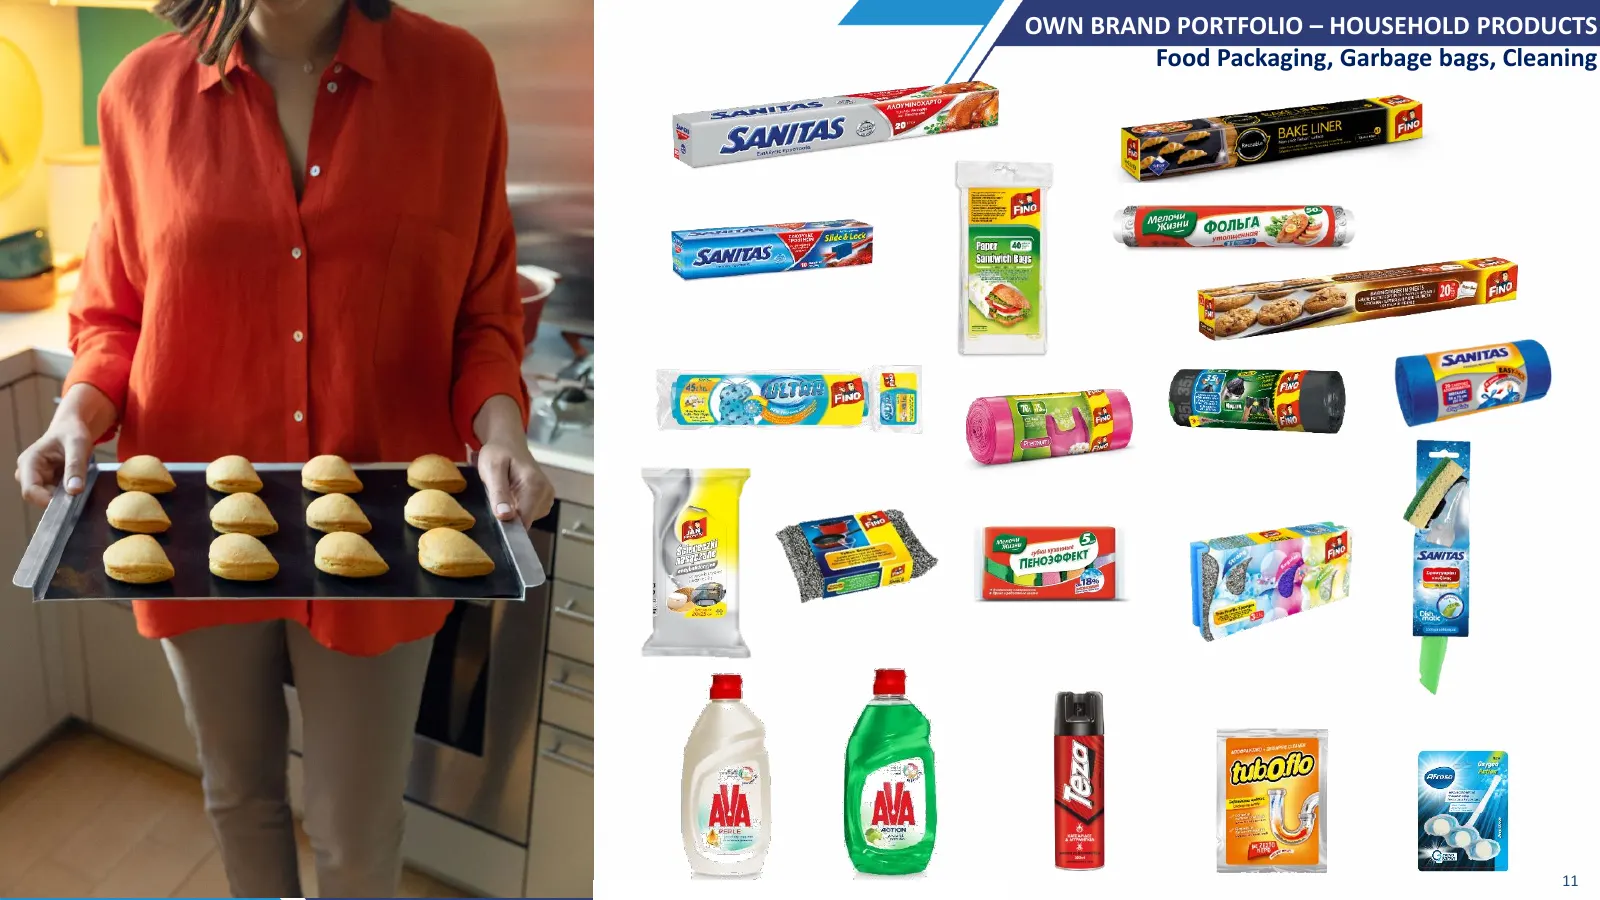
OWN BRAND PORTFOLIO – HOUSEHOLD PRODUCTS Food Packaging, Garbage bags, Cleaning 11
Slide 12: Strategy Overview
I Strategy Overview me
Slide 13: Growth Drivers
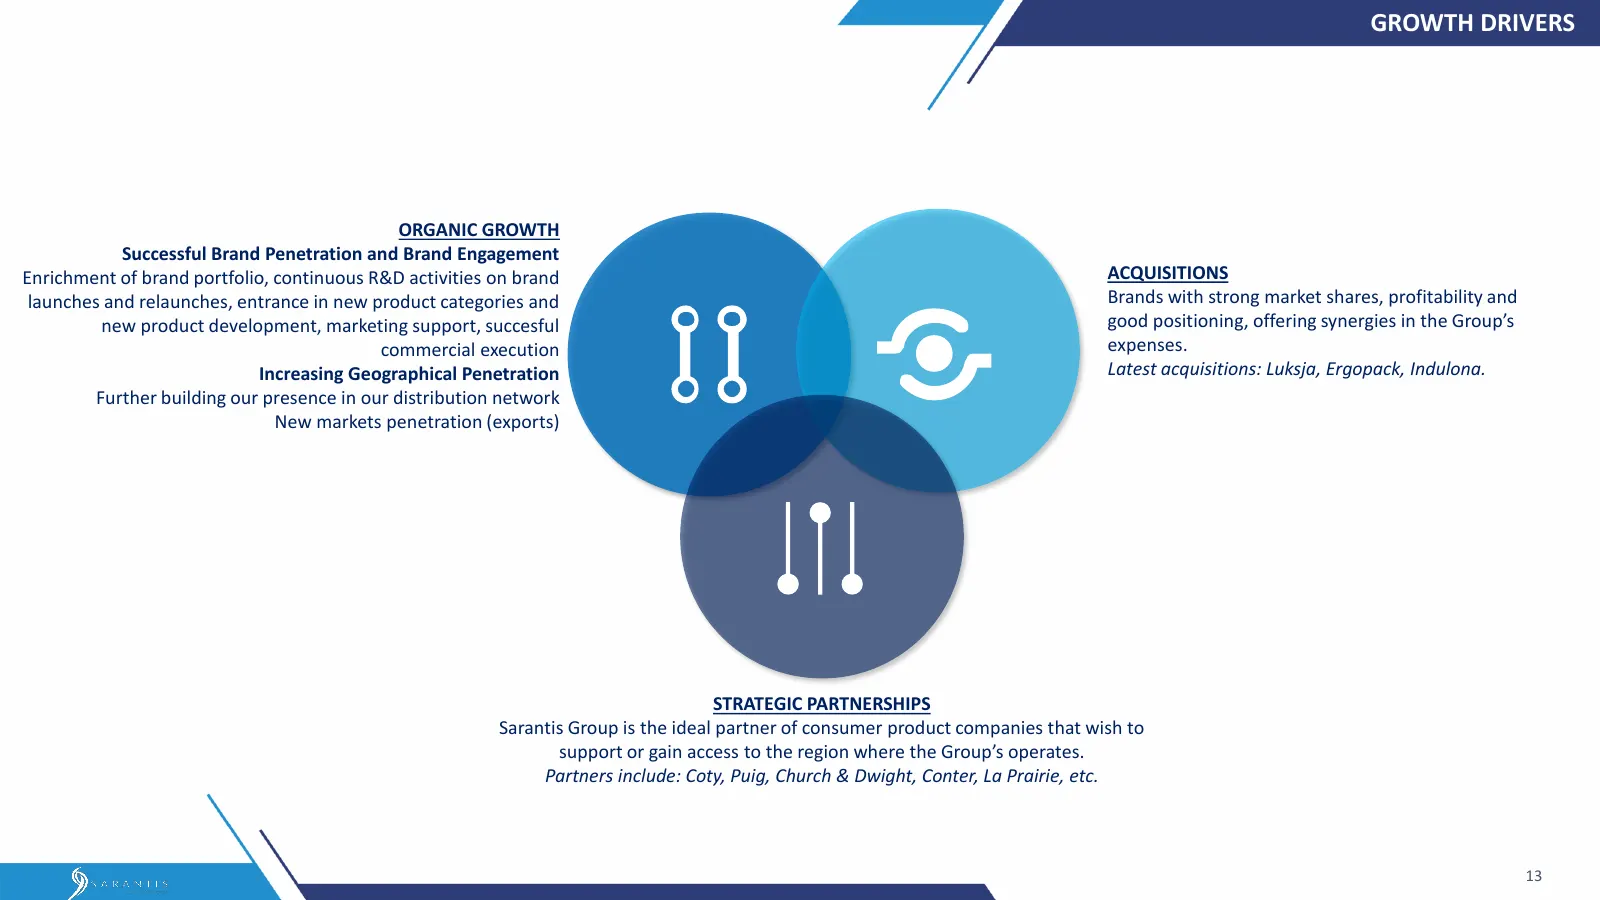
GROWTH DRIVERS Acquisitions ORGANIC GROWTH Successful Brand Penetration and Brand Engagement Enrichment of brand portfolio, continuous R&D activities on brand ACQUISITIONS launches and relaunches, entrance in new product categories and Brands with strong market shares, profitability and new product
Slide 14: Latest Acquisitions
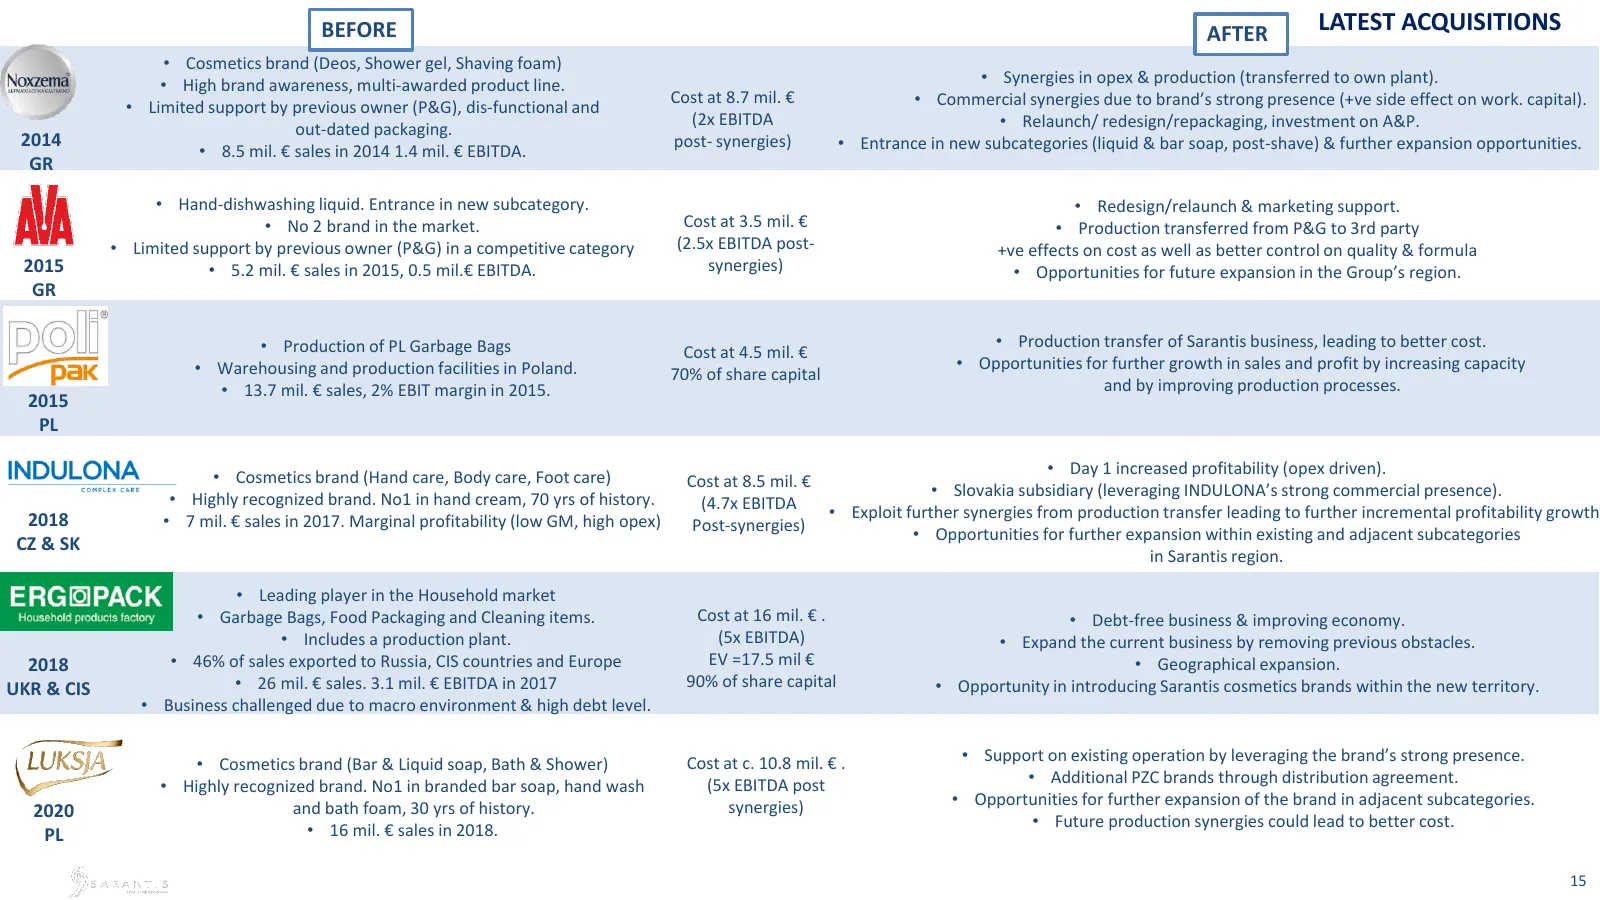
BEFORE AFTER LATEST ACQUISITIONS • Cosmetics brand (Deos, Shower gel, Shaving foam) • High brand awareness, multi-awarded product line. • Synergies in opex & production (transferred to own plant). • Limited support by previous owner (P&G), dis-functional and Cost at 8.7 mil. € • Commercial synergies
Slide 15: Strategic Partnerships
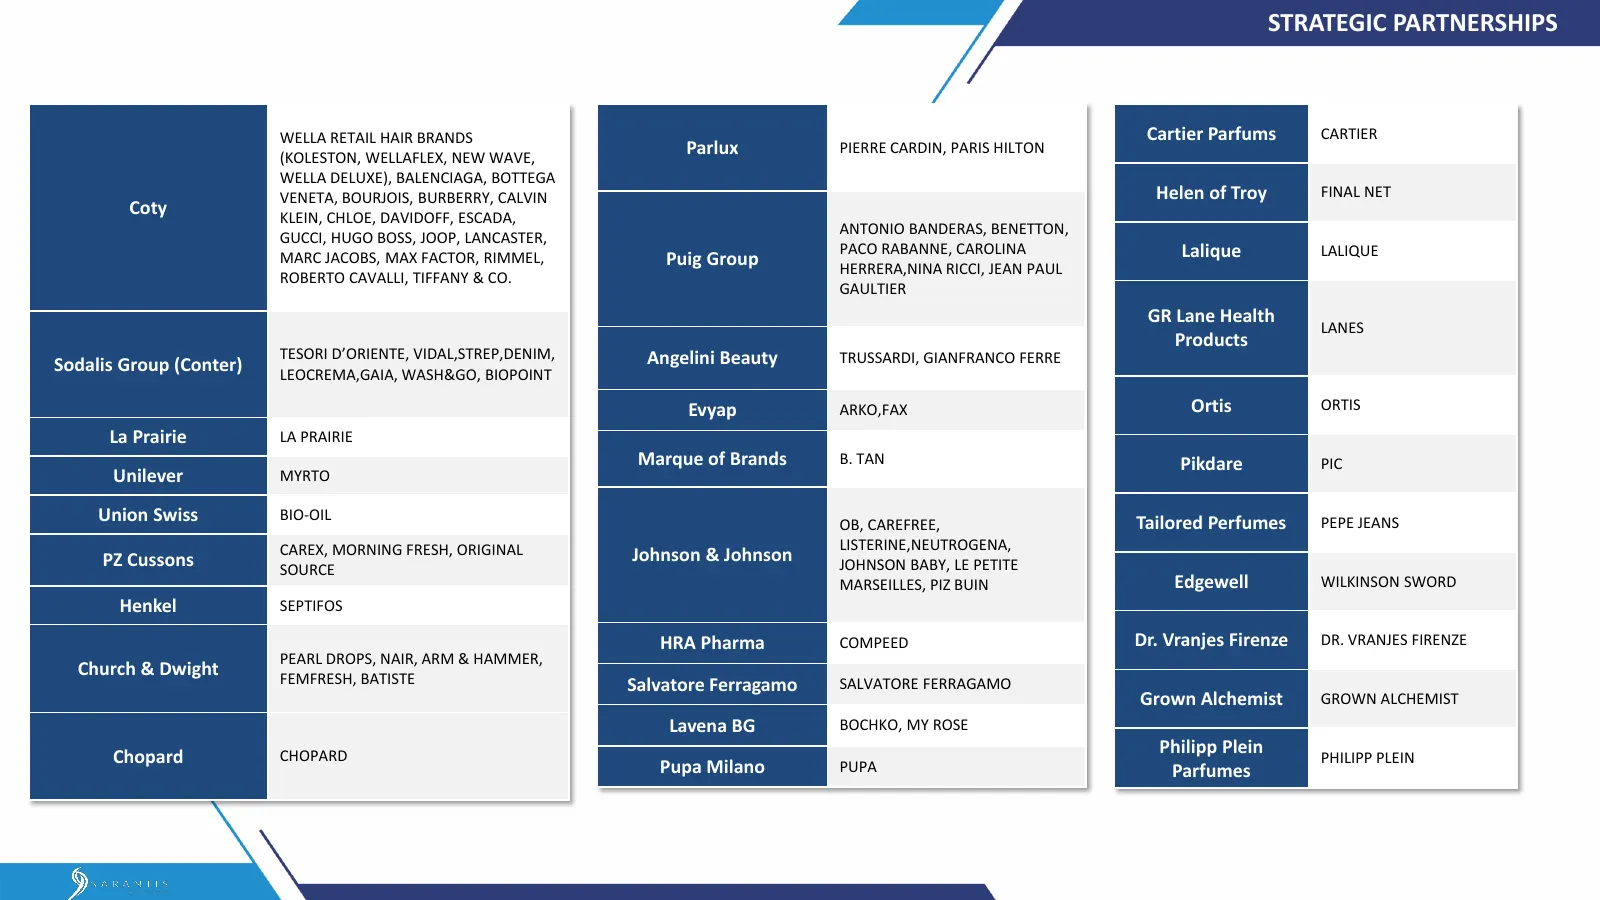
STRATEGIC PARTNERSHIPS WELLA RETAIL HAIR BRANDS Cartier Parfums CARTIER (KOLESTON, WELLAFLEX, NEW WAVE, Parlux PIERRE CARDIN, PARIS HILTON WELLA DELUXE), BALENCIAGA, BOTTEGA VENETA, BOURJOIS, BURBERRY, CALVIN Helen of Troy FINAL NET Coty KLEIN, CHLOE, DAVIDOFF, ESCADA, ANTONIO BANDERAS, BENETTON, GU
Slide 16: Financial Results
I Financial Results me
Slide 17: P&L Statement
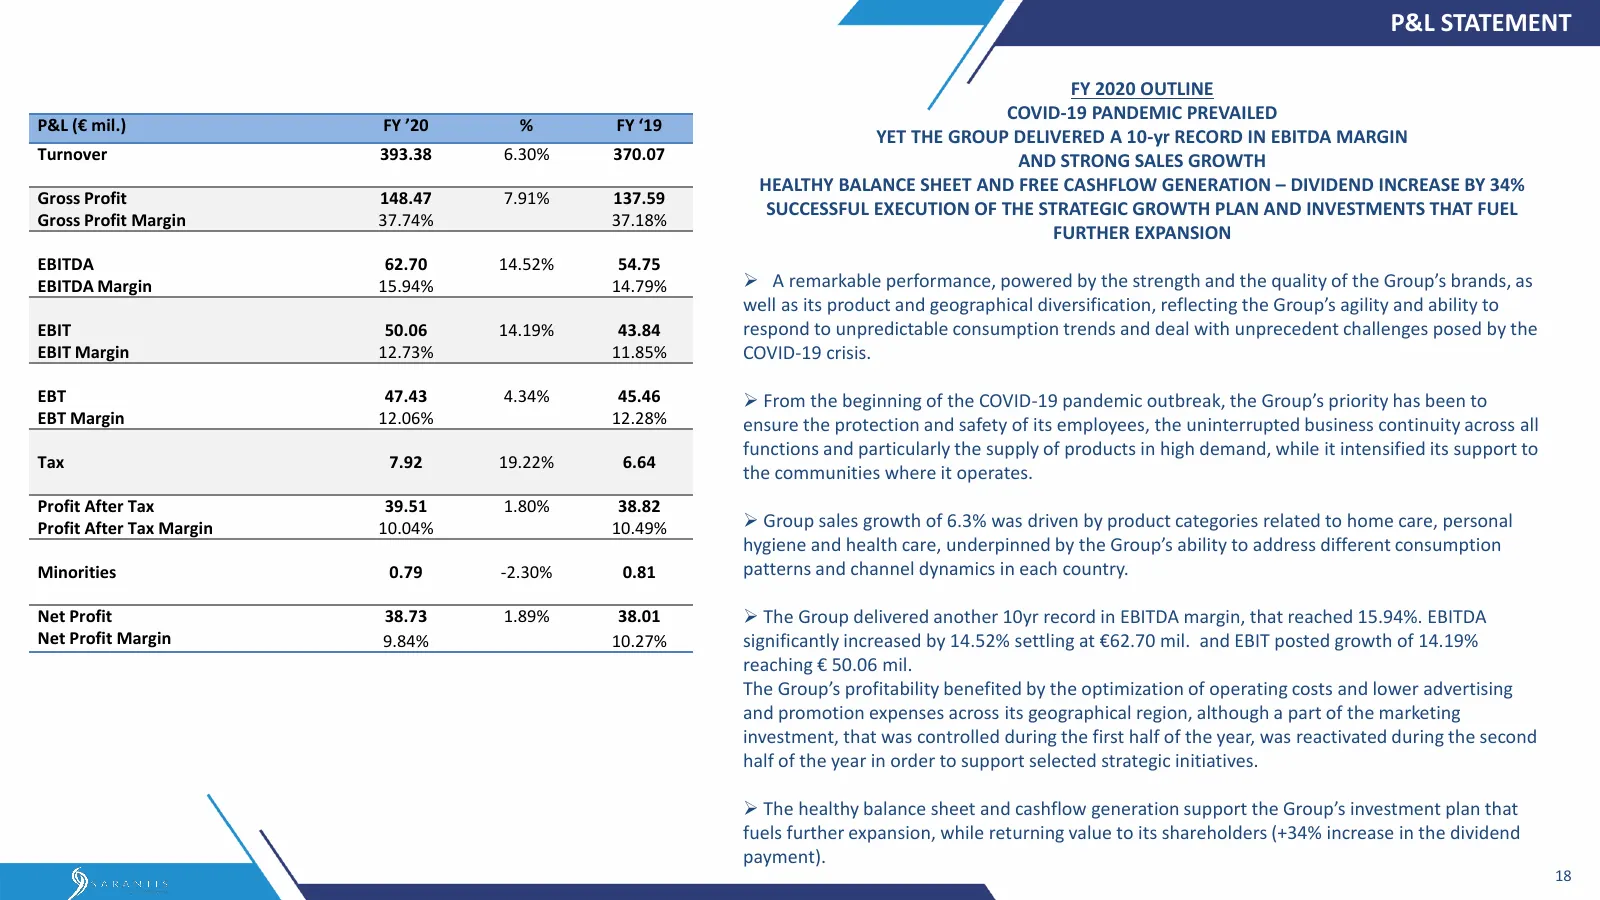
P&L STATEMENT FY 2020 OUTLINE COVID-19 PANDEMIC PREVAILED P&L (€ mil.) FY ’20 % FY ‘19 YET THE GROUP DELIVERED A 10-yr RECORD IN EBITDA MARGIN Turnover 393.38 6.30% 370.07 AND STRONG SALES GROWTH HEALTHY BALANCE SHEET AND FREE CASHFLOW GENERATION – DIVIDEND INCREASE BY 34% Gross Profit 148.47 7.91%
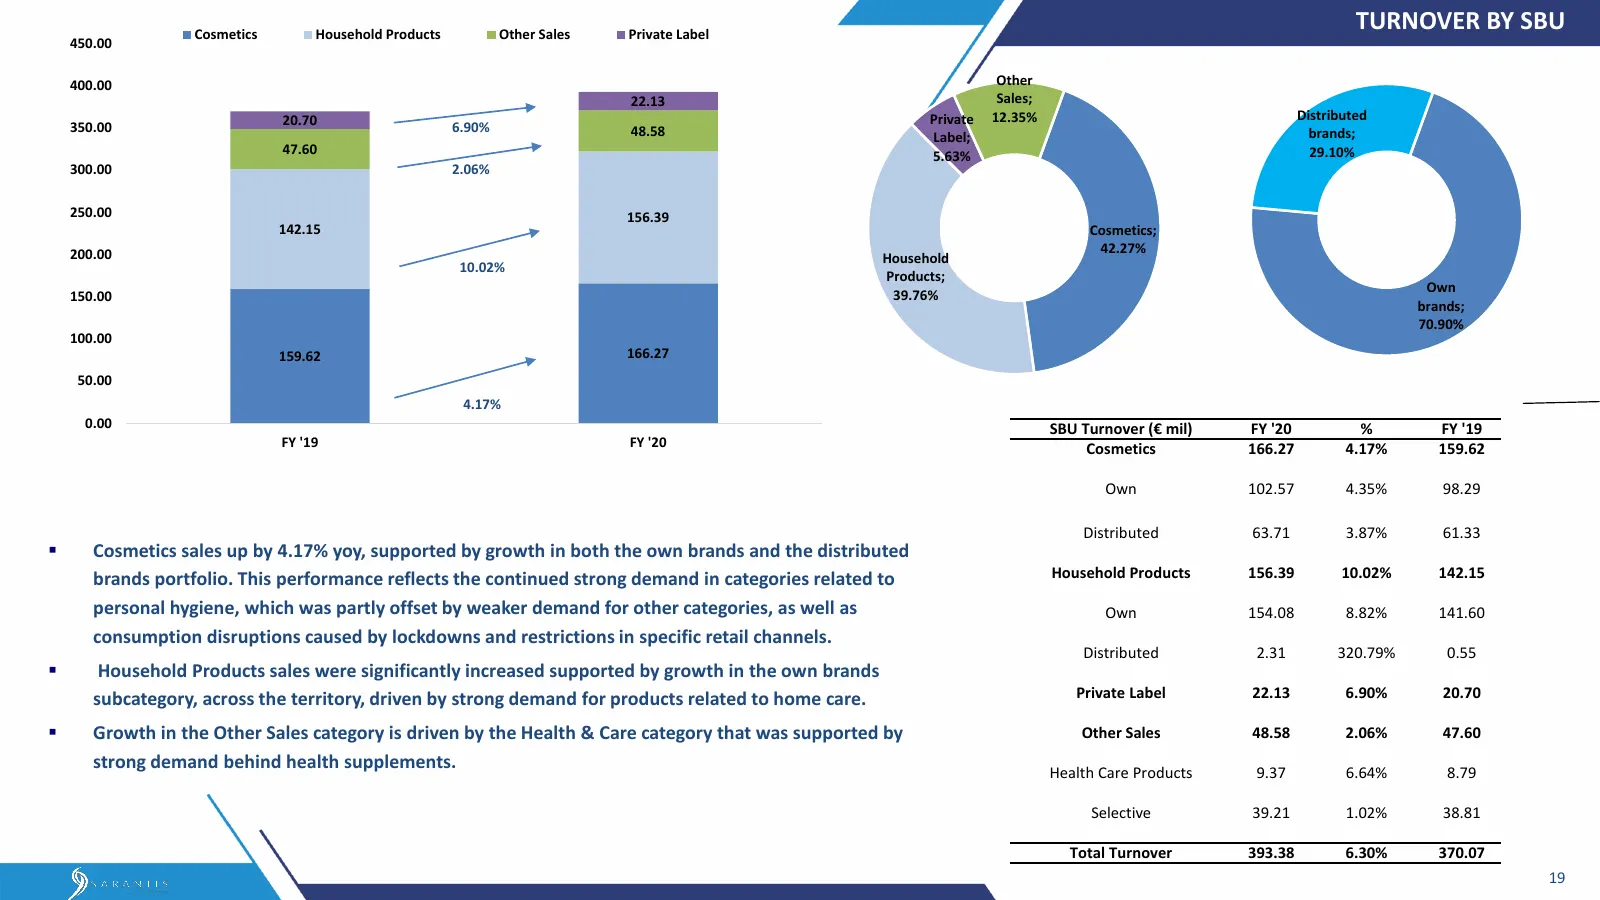
Slide 18: Turnover by SBU
Cosmetics Household Products Other Sales Private Label TURNOVER BY SBU 450.00 400.00 Other 22.13 Sales; 20.70 Private 12.35% Distributed 350.00 6.90% 48.58 brands; Label; 47.60 5.63% 29.10% 300.00 2.06% 250.00 156.39 142.15 Cosmetics; 200.00 42.27% Household 10.02% Products; 39.76% Own 150.00 brands
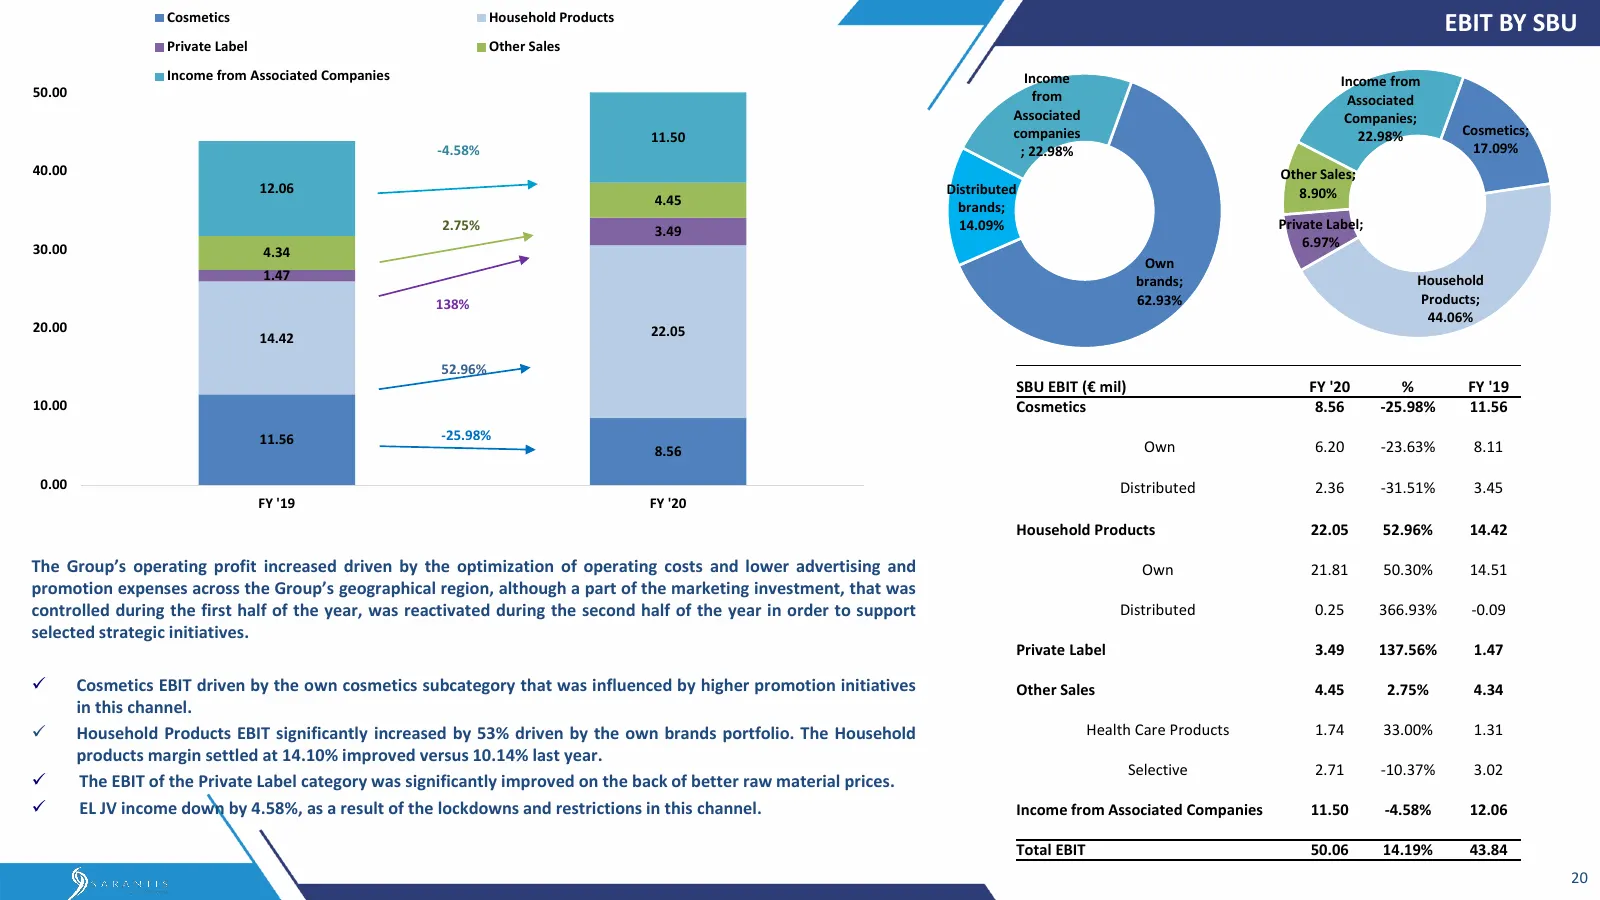
Slide 19: EBIT by SBU
Cosmetics Household Products EBIT BY SBU Private Label Other Sales Income from Associated Companies Income Income from 50.00 from Associated Associated Companies; 11.50 companies 22.98% Cosmetics; -4.58% ; 22.98% 17.09% 40.00 Other Sales; 12.06 Distributed 8.90% 4.45 brands; 2.75% 3.49 14.09% Privat
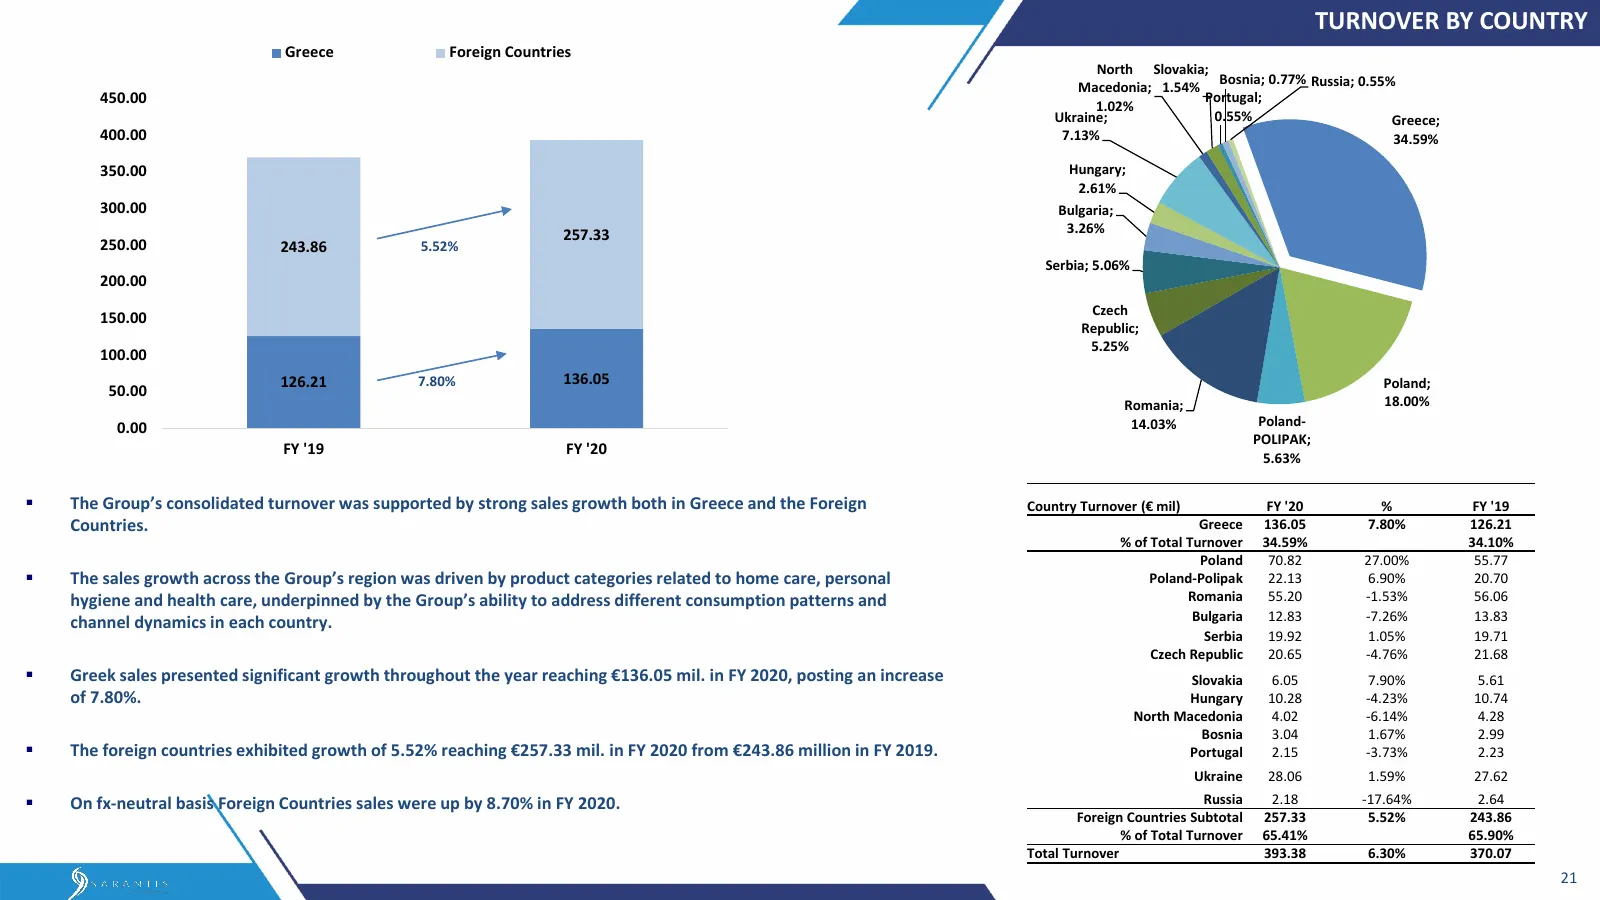
Slide 20: Turnover by Country
TURNOVER BY COUNTRY Greece Foreign Countries North Slovakia; Bosnia; 0.77% Russia; 0.55% Macedonia; 1.54% 450.00 1.02% Portugal; Ukraine; 0.55% Greece; 400.00 7.13% 34.59% 350.00 Hungary; 2.61% 300.00 Bulgaria; 257.33 3.26% 250.00 243.86 5.52% Serbia; 5.06% 200.00 Czech 150.00 Republic; 5.25% 100.00
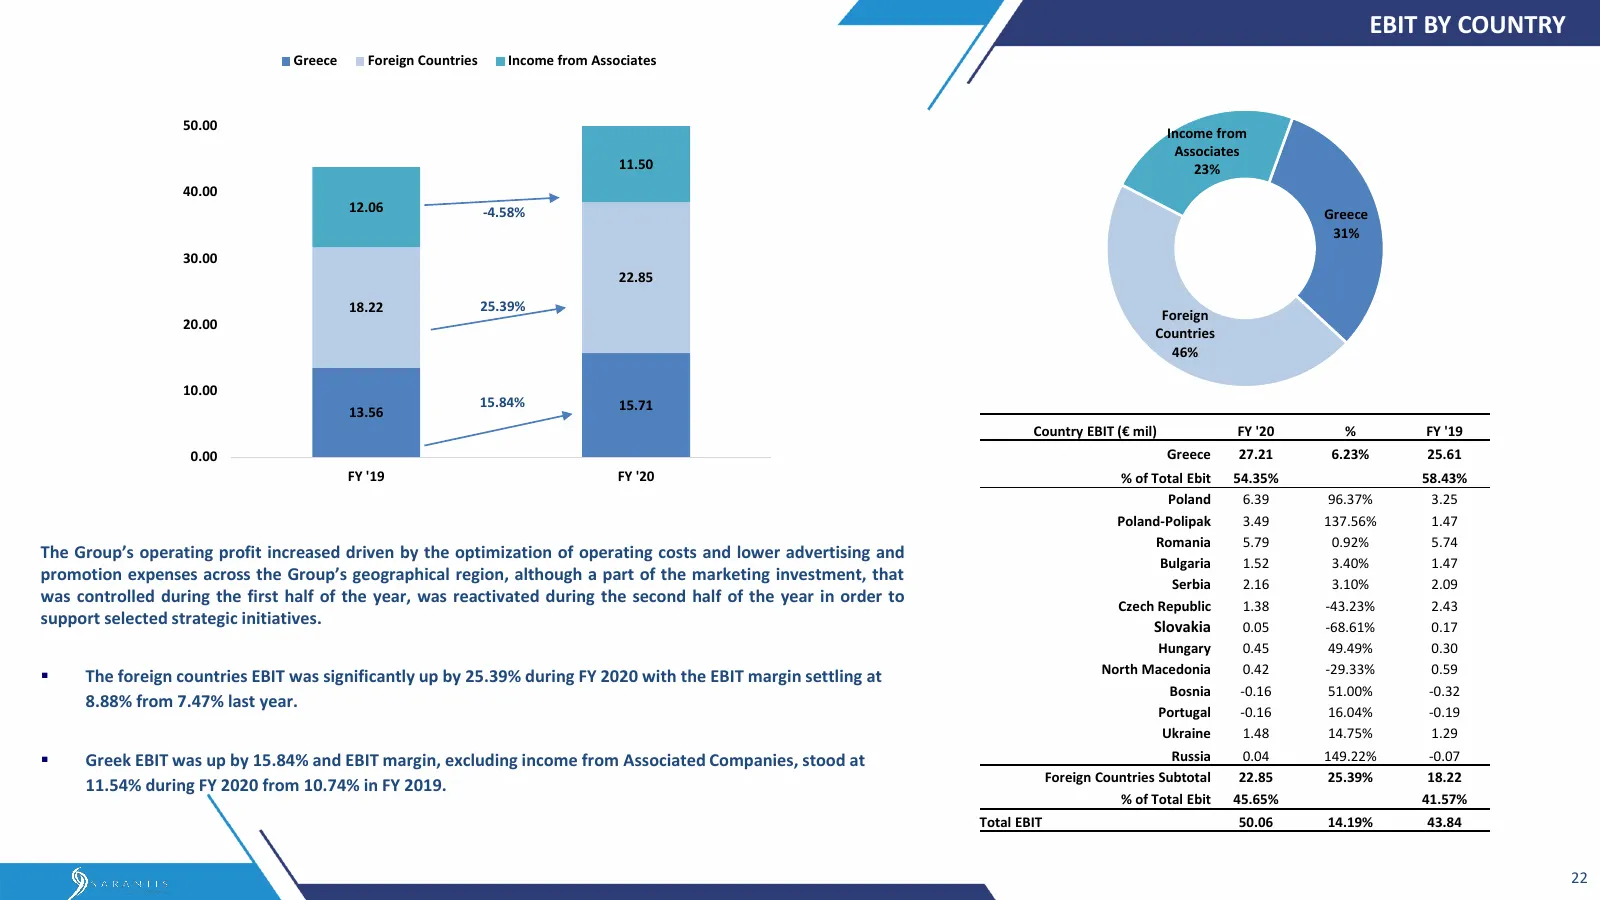
Slide 21: EBIT by Country
EBIT BY COUNTRY Greece Foreign Countries Income from Associates 50.00 Income from Associates 11.50 23% 40.00 12.06 -4.58% Greece 31% 30.00 22.85 18.22 25.39% Foreign 20.00 Countries 46% 10.00 15.84% 15.71 13.56 Country ΕΒΙΤ (€ mil) FY '20 % FY '19 0.00 Greece 27.21 6.23% 25.61 FY '19 FY '20 % of Tot
Slide 22: Balance Sheet & Cashflow
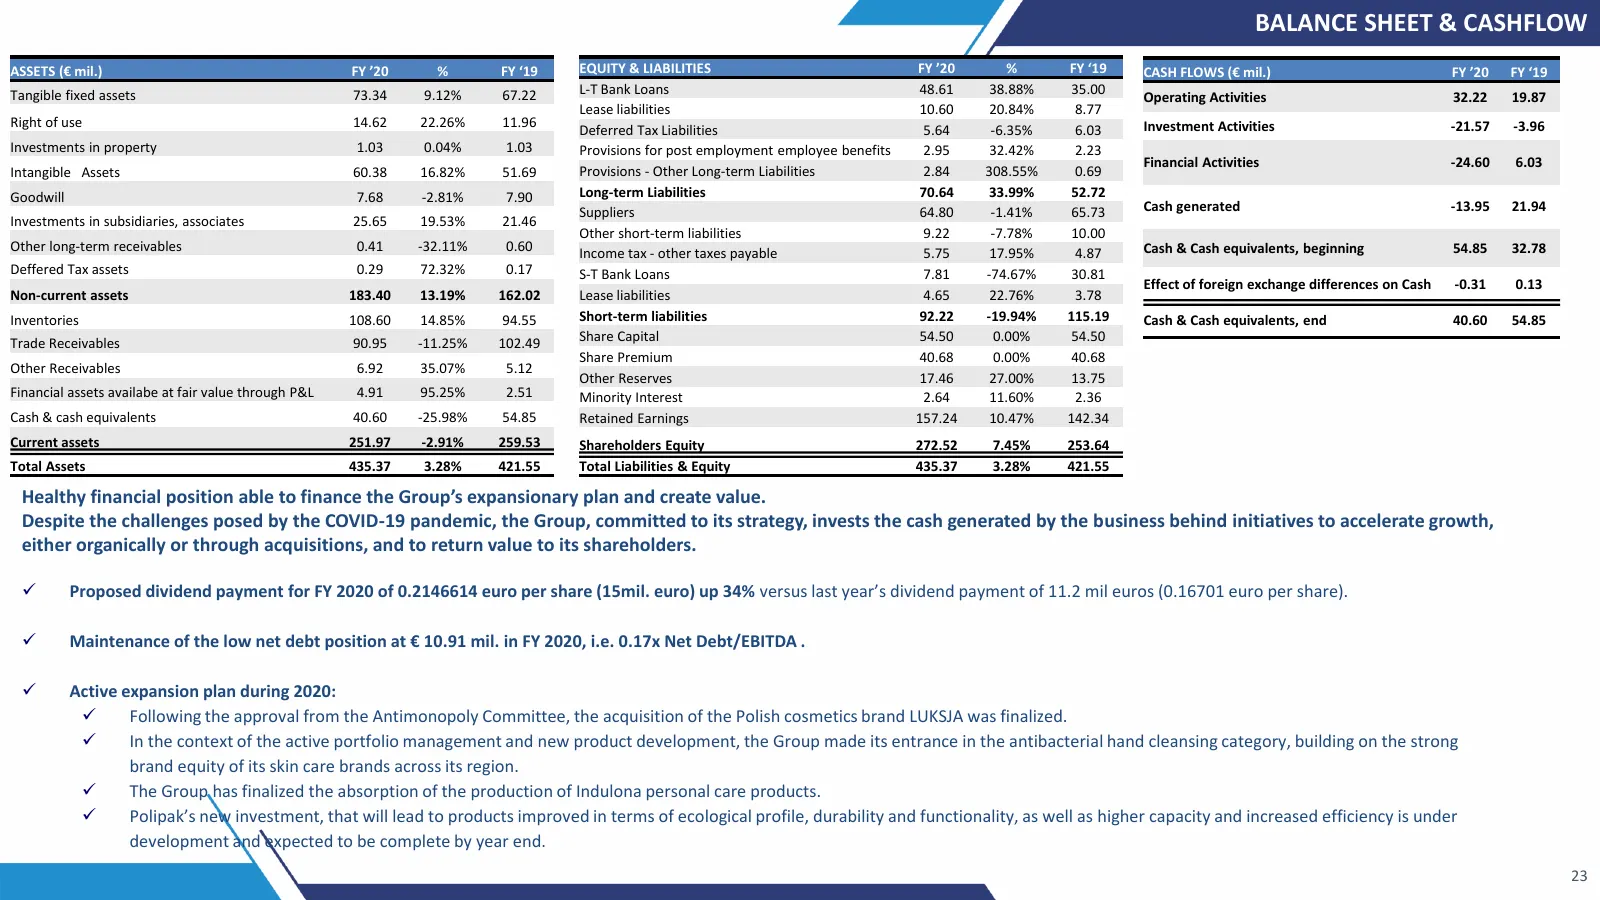
BALANCE SHEET & CASHFLOW ASSETS (€ mil.) FY ’20 % FY ‘19 EQUITY & LIABILITIES FY ’20 % FY ‘19 CASH FLOWS (€ mil.) FY ’20 FY ‘19 Tangible fixed assets 73.34 9.12% 67.22 L-T Bank Loans 48.61 38.88% 35.00 Operating Activities 32.22 19.87 Lease liabilities 10.60 20.84% 8.77 Right of use 14.62 22.26% 11.
Slide 23: Financial Highlights
I Financial Highlights me
Slide 24: Financial Highlights
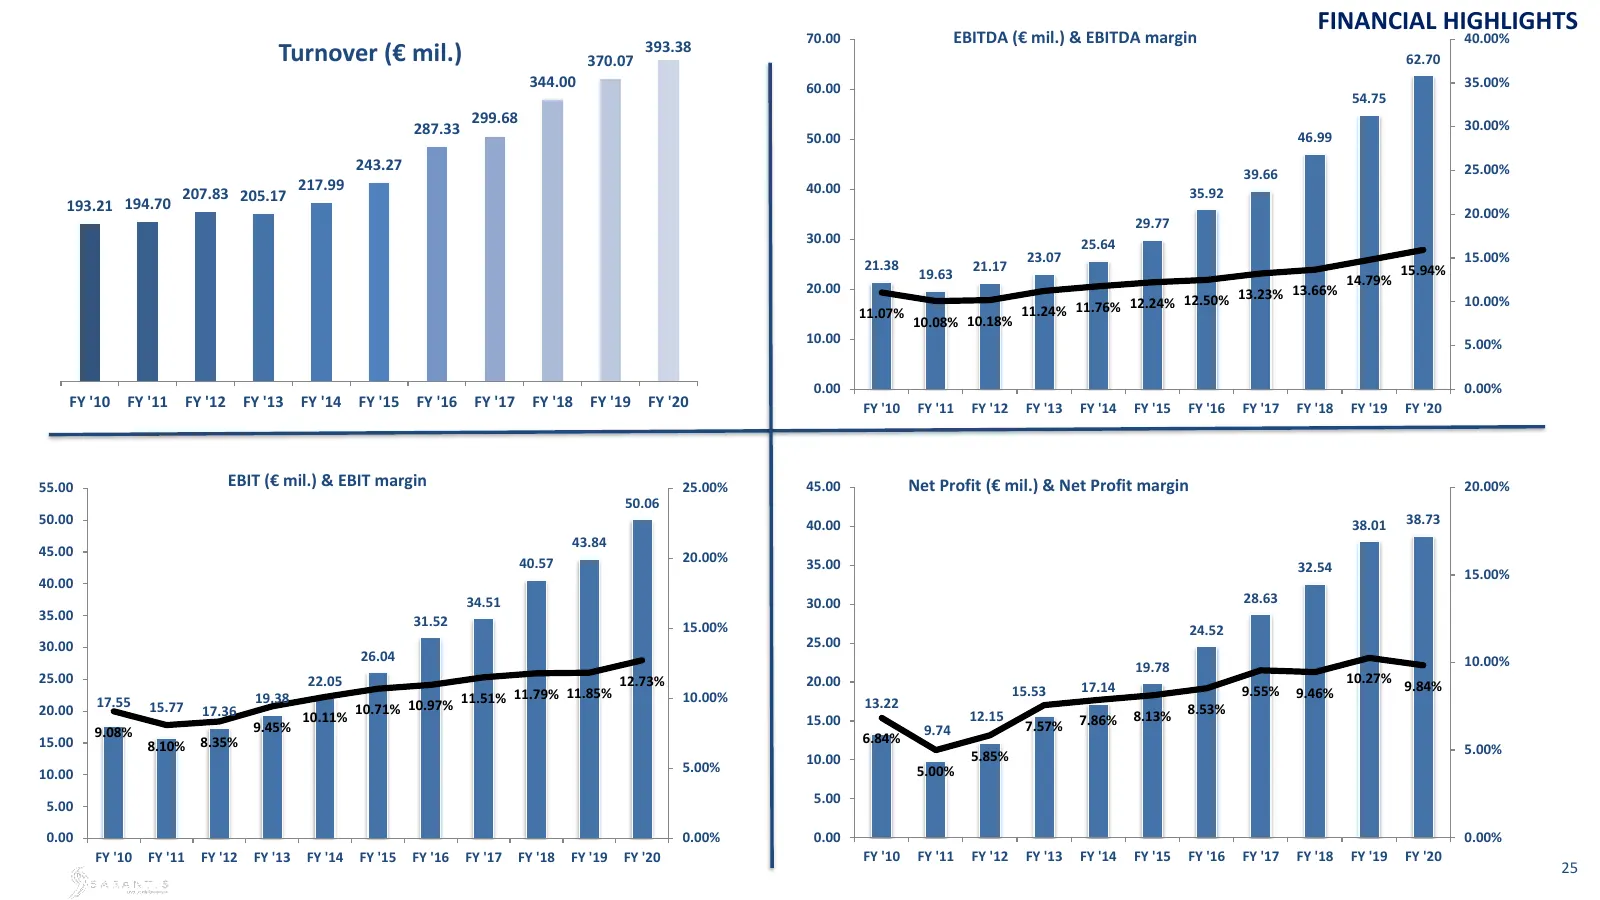
FINANCIAL HIGHLIGHTS 393.38 70.00 EBITDA (€ mil.) & EBITDA margin 40.00% Turnover (€ mil.) 370.07 62.70 344.00 60.00 35.00% 54.75 299.68 30.00% 287.33 50.00 46.99 243.27 25.00% 39.66 217.99 40.00 207.83 205.17 35.92 193.21 194.70 20.00% 29.77 30.00 25.64 23.07 15.00% 21.38 21.17 15.94% 19.63 14.79%
Slide 25: Net Debt Evolution
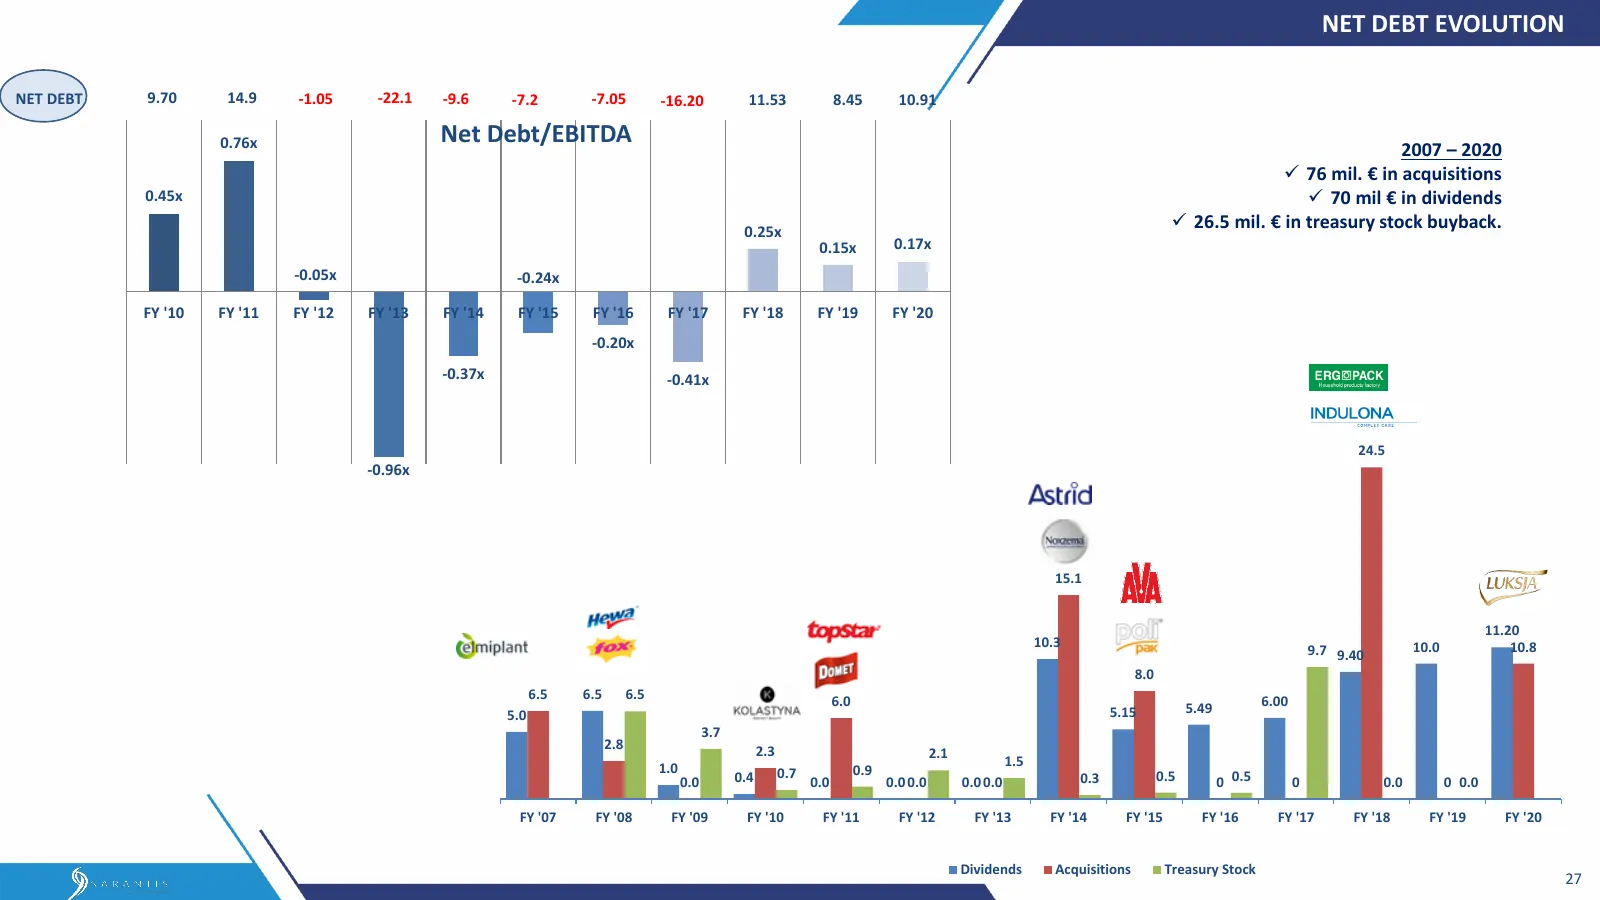
NET DEBT EVOLUTION NET DEBT 9.70 14.9 -1.05 -22.1 -9.6 -7.2 -7.05 -16.20 11.53 8.45 10.91 0.76x Net Debt/EBITDA 2007 – 2020 ✓ 76 mil. € in acquisitions 0.45x ✓ 70 mil € in dividends 0.25x ✓ 26.5 mil. € in treasury stock buyback. 0.15x 0.17x -0.05x -0.24x FY '10 FY '11 FY '12 FY '13 FY '14 FY '15 FY
Slide 26: Sustainable Cashflow Generation
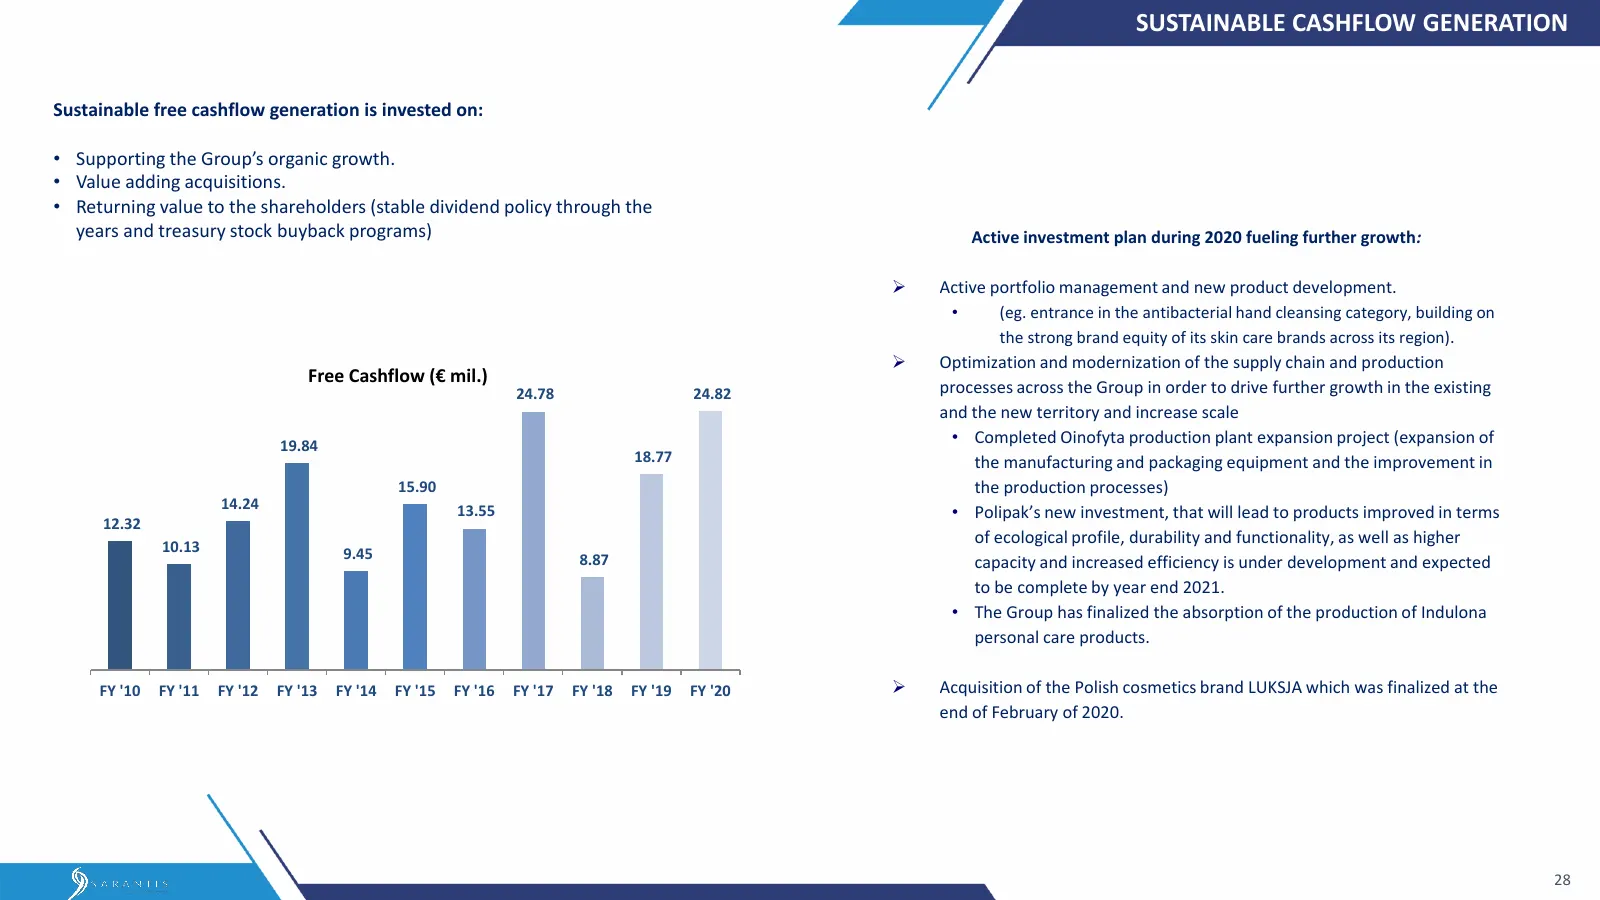
SUSTAINABLE CASHFLOW GENERATION Sustainable free cashflow generation is invested on: • Supporting the Group’s organic growth. • Value adding acquisitions. • Returning value to the shareholders (stable dividend policy through the years and treasury stock buyback programs) Active investment plan durin
Slide 27: Relative Price since Jan/2012
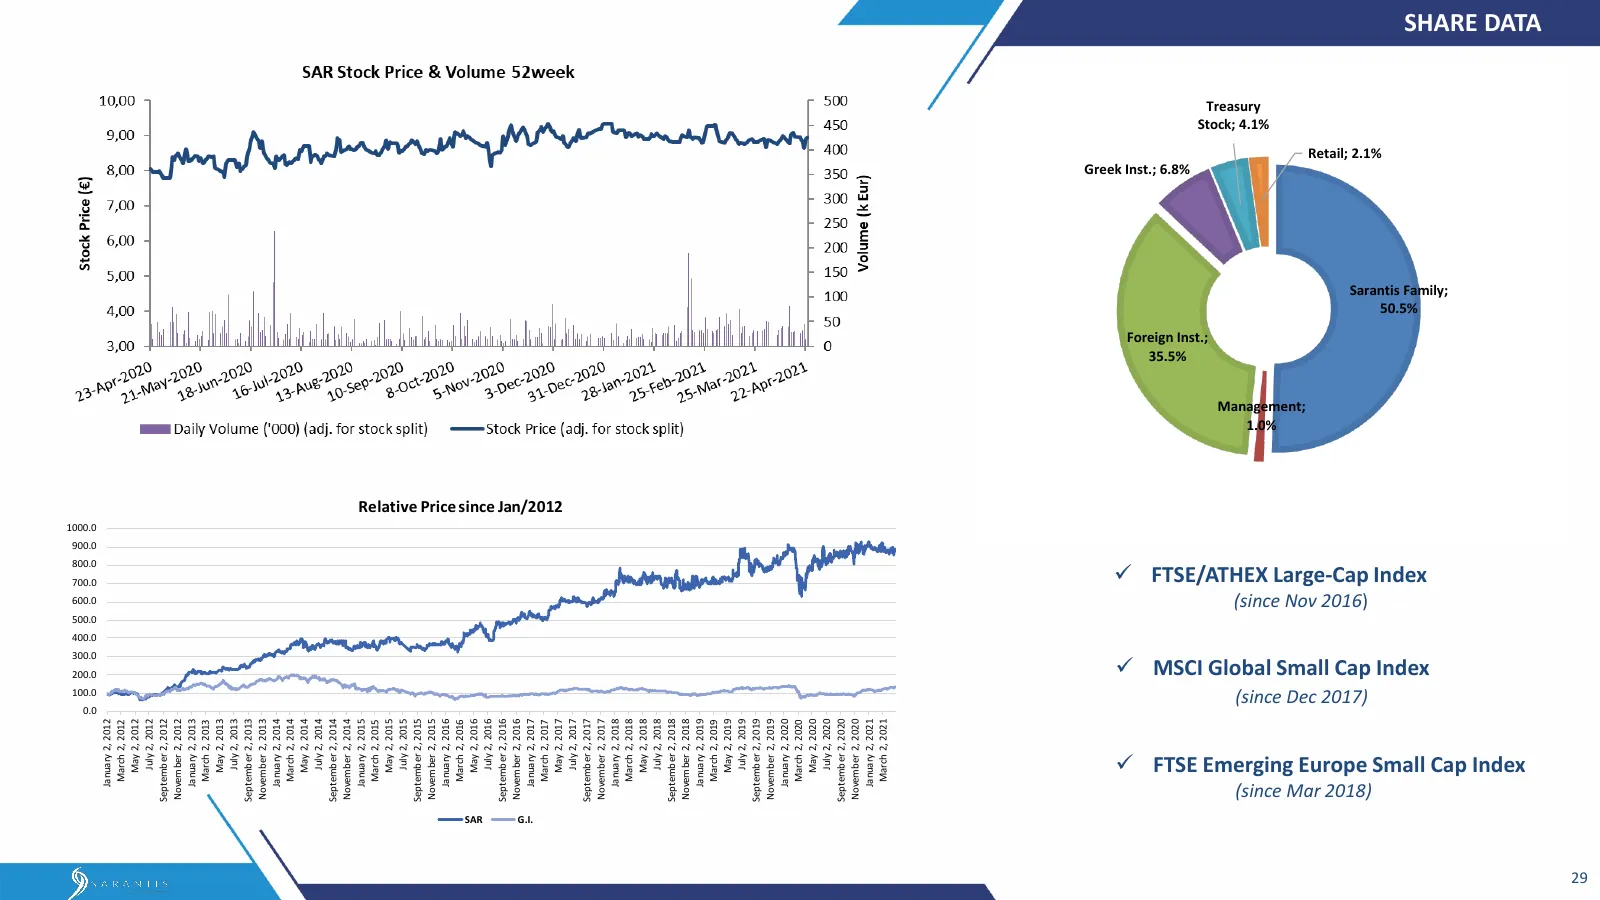
1000.0 100.0 200.0 300.0 400.0 500.0 600.0 700.0 800.0 900.0 0.0 January 2, 2012 March 2, 2012 May 2, 2012 July 2, 2012 September 2, 2012 November 2, 2012 January 2, 2013 March 2, 2013 May 2, 2013 July 2, 2013 September 2, 2013 November 2, 2013 January 2, 2014 March 2, 2014 May 2, 2014 July 2, 2014
Slide 28: Contact Disclaimer
Contact Website: http://ir.sarantis.gr/ Investor Relations department: Eleni Pappa, Investor Relations & Corporate Communications Director Tel: +30 210 6173065 Email: epappa@sarantisgroup.com Disclaimer This presentation was prepared by Sarantis Group. Information contained herein has been obtained
Source: Internet Archive copy of sarantisgroup.com
More decks from GR. Sarantis S.A.
 H1 2026 Earnings Presentation21 slides · Sep 9, 2026
 Investor Presentation (May 2026)36 slides · May 2026
 Investor Presentation (April 2026)36 slides · April 2026
 FY2025 Earnings Presentation21 slides · Mar 12, 2026
 Investor Presentation (January 2026)33 slides · January 2026
 Investor Presentation (December 2025)33 slides · December 2025