Sysmex Corporation · TSE:6869
Sysmex — FY2007 Earnings Presentation
26 slides from Sysmex's earnings presentation, May 2008
Slide 1: FY2007 Business Results
A Unique & Global Healthcare Testing Company FY2007 Business Results Financial Highlights and Future Opportunities Hisashi Ietsugu President and CEO SYSMEX CORPORATION
Slide 2: Contents
Contents n FY2007 Financial Highlights n FY2008 Opportunities Consolidated Earnings Forecast Forwardlooking Statements This material contains forwardlooking statements about Sysmex Corporation and its group companies (the Sysmex Group). These forwardlooking statements are based on current judgmen
Slide 3: FY2007 Financial Highlights
FY2007 Financial Highlights • Financial Highlights • Topics • Breakdown of Net Sales and Ordinary Income • Breakdown of Balance Sheet • Consolidated Cash Flow • Projected Dividend A Unique & Global Healthcare Testing Company
Slide 4: Financial Highlights
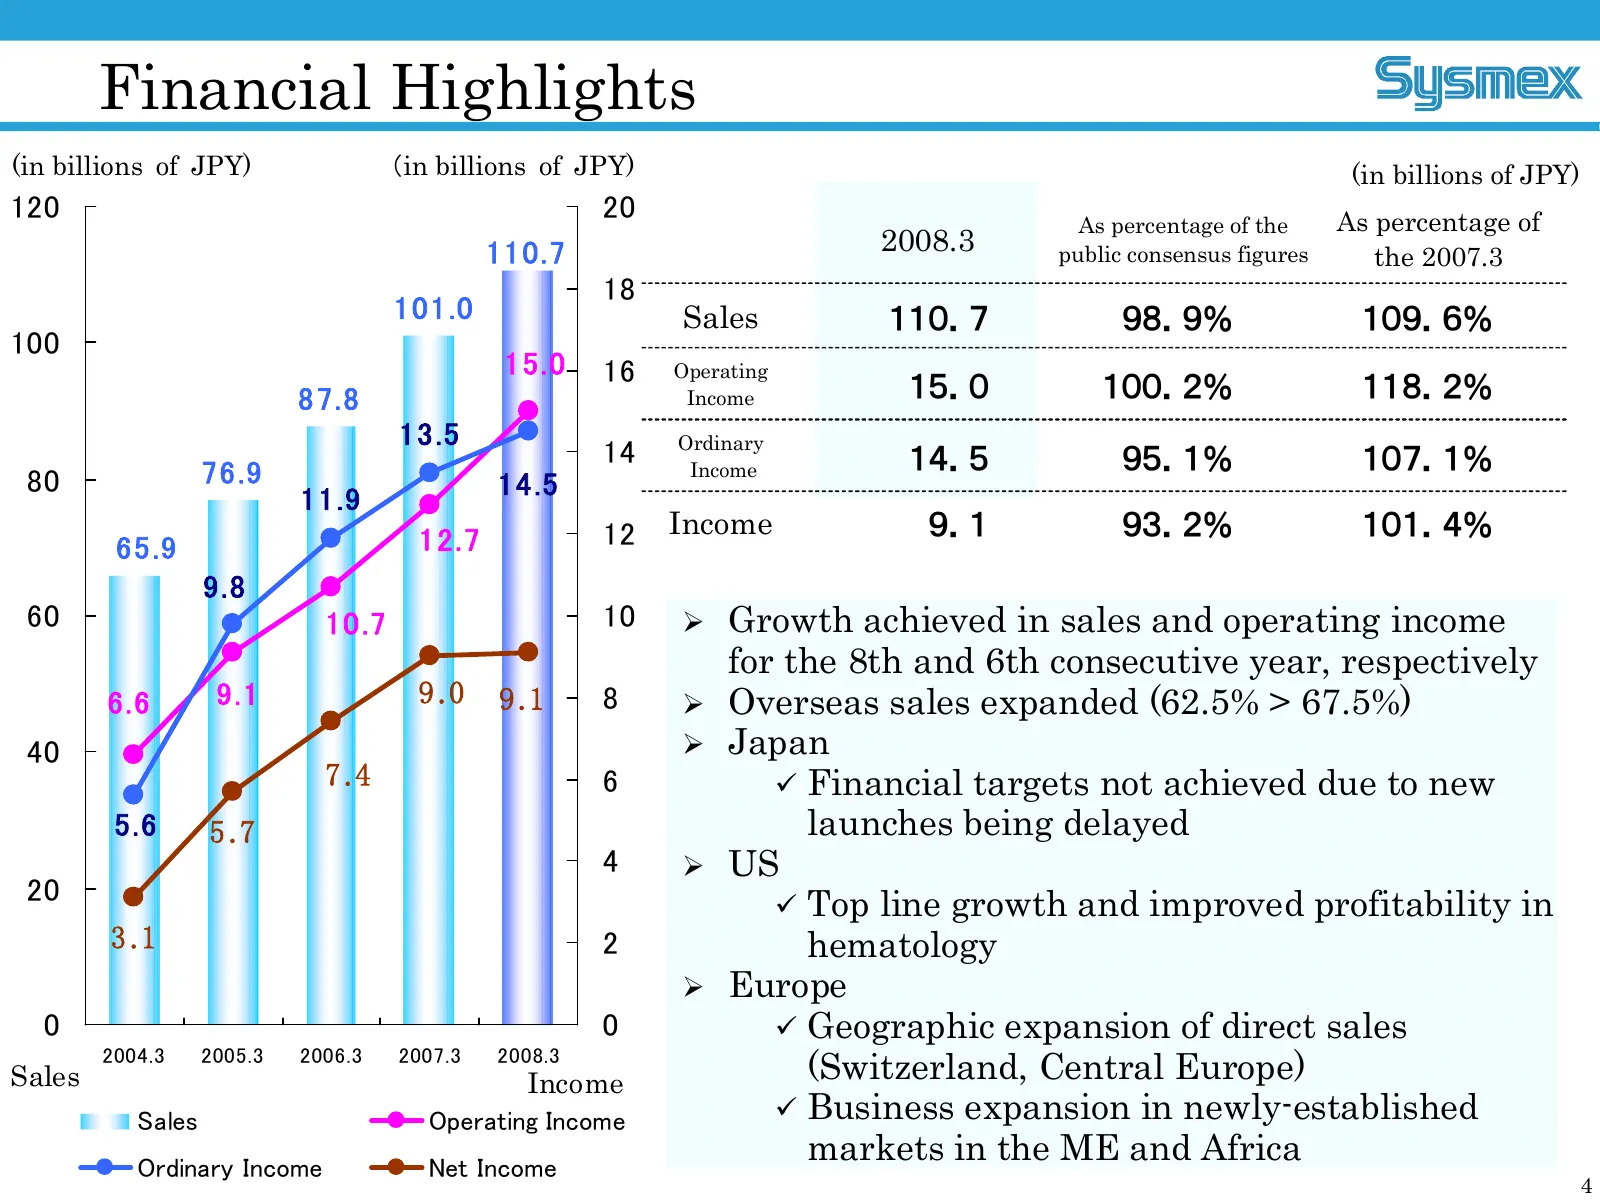
Financial Highlights (in billions of JPY) (in billions of JPY) (in billions of JPY) 120 20 As percentage of the As percentage of 110.7 2008.3 public consensus figures the 2007.3 18 101.0 Sales 110.7 98.9% 109.6% 100 15.0 16 Operating 87.8 Income 15.0 100.2% 118.2% 13.5 Ordinary 14 14.5 95.1% 107.1%
Slide 5: Topics
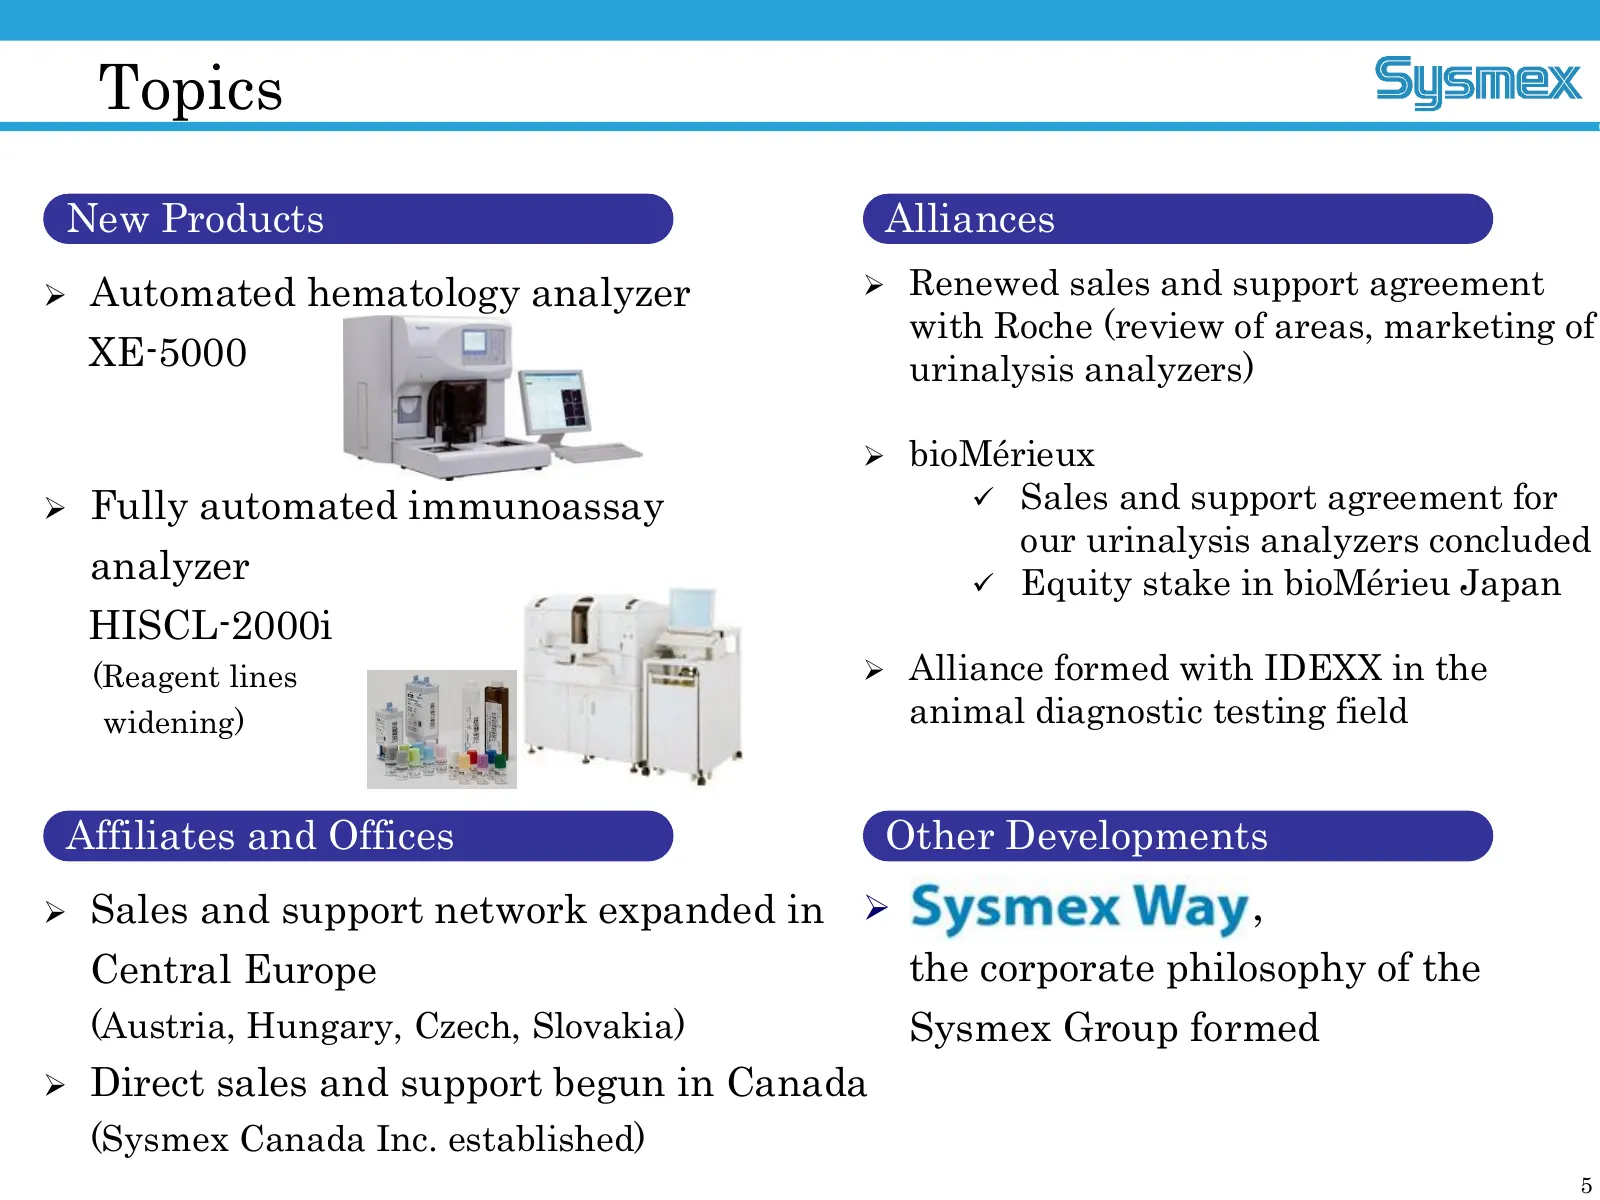
Topics New Products Alliances Ø Automated hematology analyzer Ø Renewed sales and support agreement with Roche (review of areas, marketing of XE5000 urinalysis analyzers) Ø bioMérieux Ø Fully automated immunoassay ü Sales and support agreement for our urinalysis analyzers concluded analyzer ü Equit
Slide 6: Breakdown of Net Sales and Ordinary Income
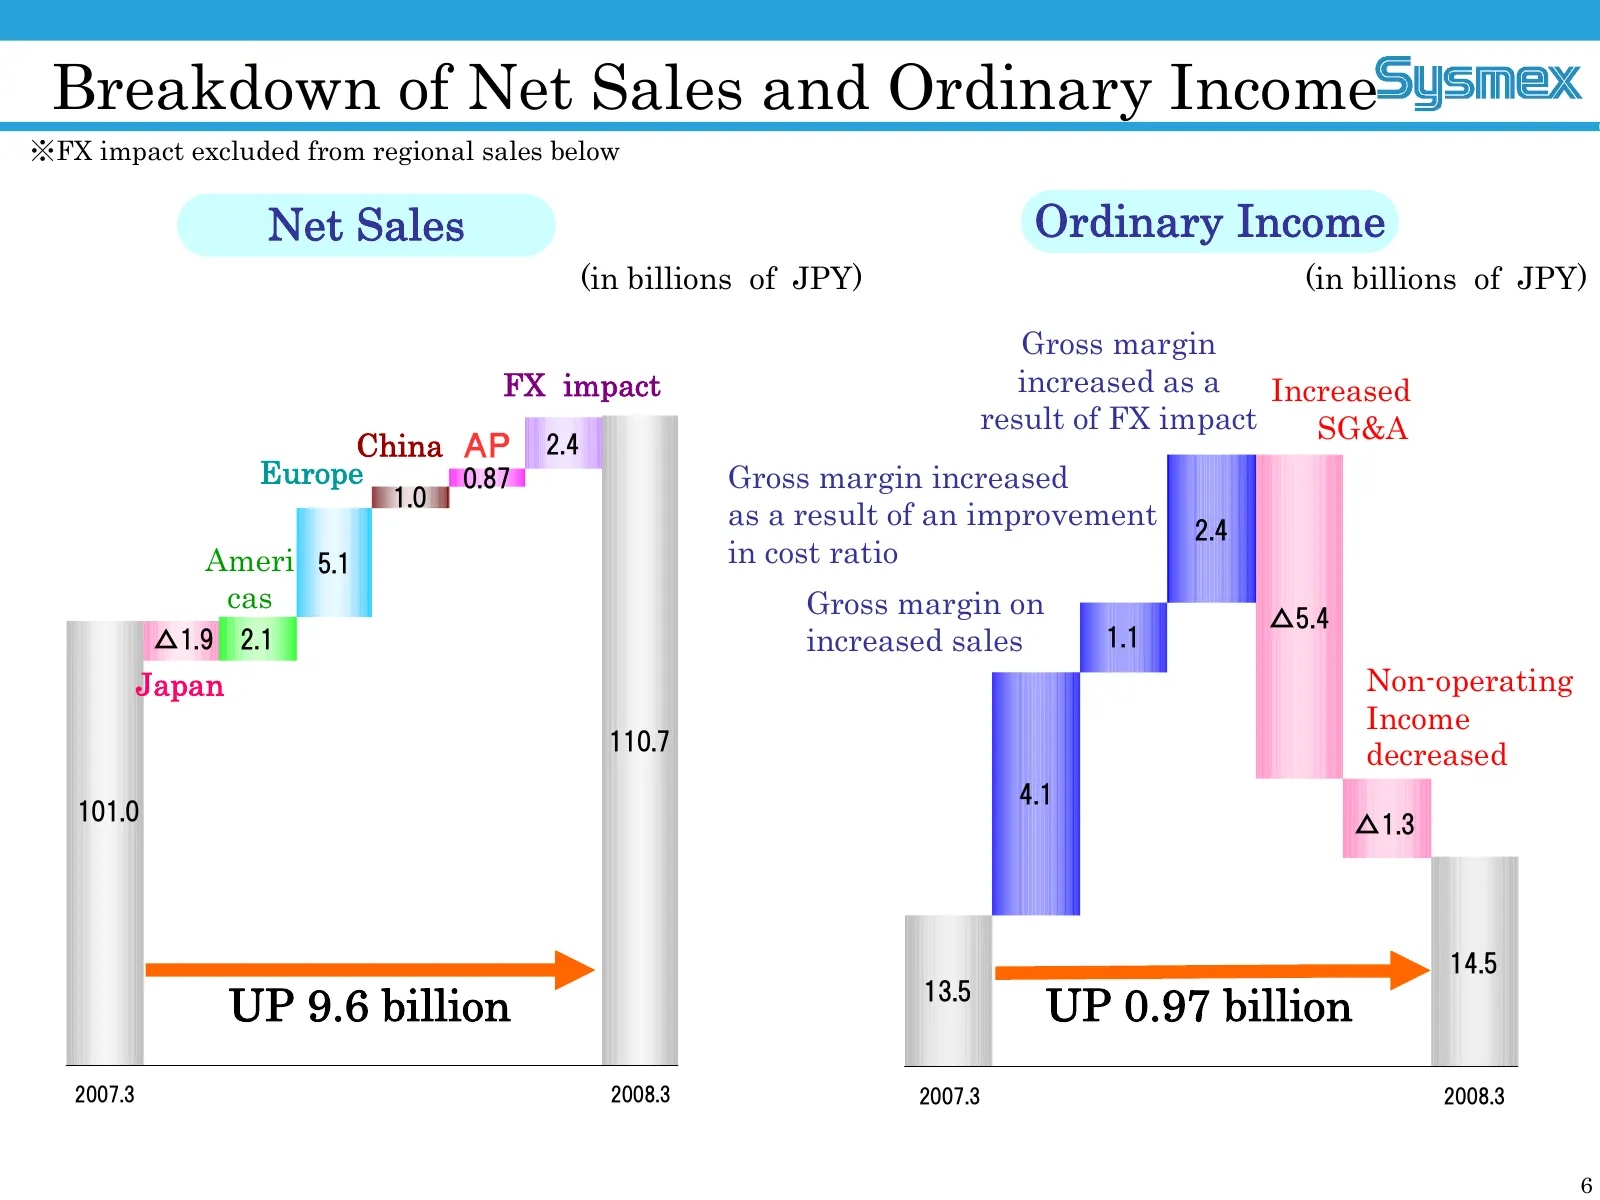
Breakdown of Net Sales and Ordinary Income ※FX impact excluded from regional sales below Net Sales Ordinary Income (in billions of JPY) (in billions of JPY) Gross margin FX impact increased as a Increased result of FX impact SG&A China AP 2.4 Europe 0.87 Gross margin increased 1.0 as a result of an
Slide 7: Breakdown of Balance Sheet
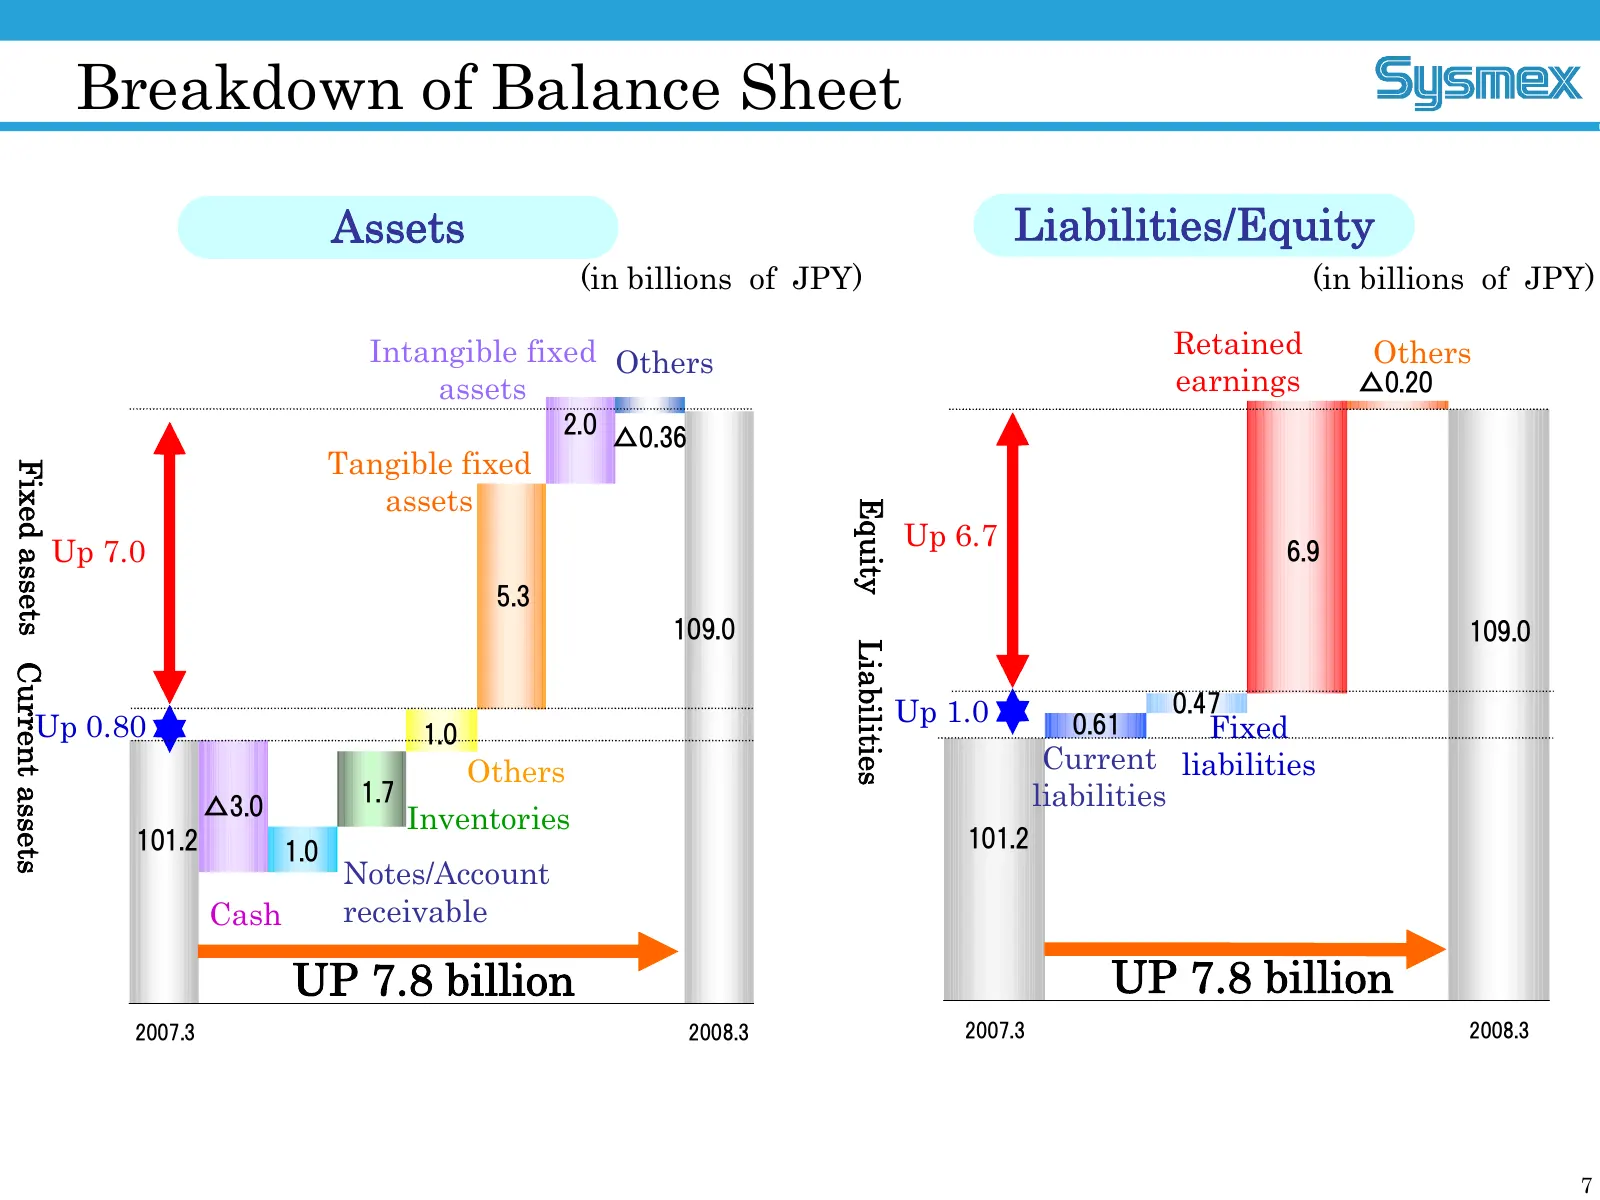
Breakdown of Balance Sheet Assets Liabilities/Equity (in billions of JPY) (in billions of JPY) Intangible fixed Others Retained Others assets earnings △0.20 2.0 △0.36 Tangible fixed Fixed assets Current assets assets Equity Up 6.7 6.9 Up 7.0 5.3 109.0 109.0 Liabilities Up 1.0 0.47 Up 0.80 1.0 0.61 F
Slide 8: Consolidated Cash Flow
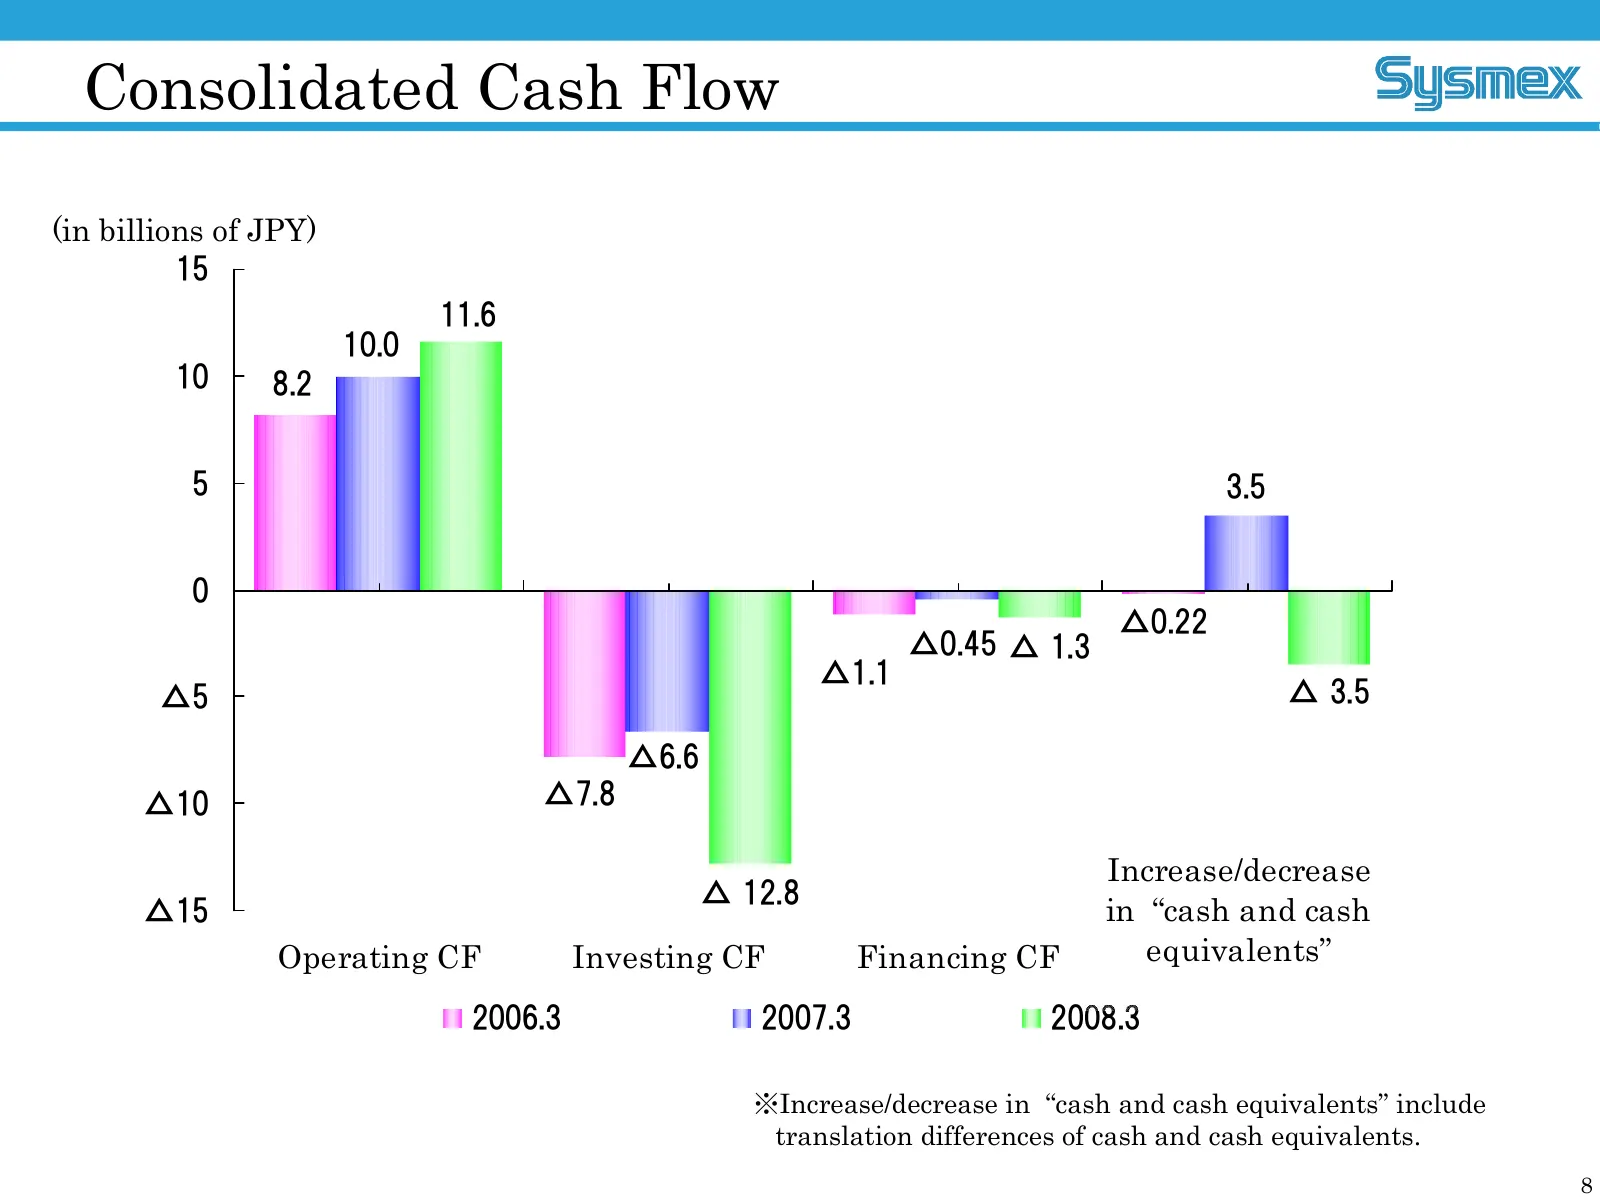
Consolidated Cash Flow (in billions of JPY) 15 11.6 10.0 10 8.2 5 3.5 0 △0.22 △0.45 △ 1.3 △1.1 △5 △ 3.5 △6.6 △10 △7.8 Increase/decrease △ 12.8 △15 in “cash and cash Operating CF Investing CF Financing CF equivalents” 2006.3 2007.3 2008.3 ※Increase/decrease in “cash and cash equivalents” include tran
Slide 9: Projected Dividend
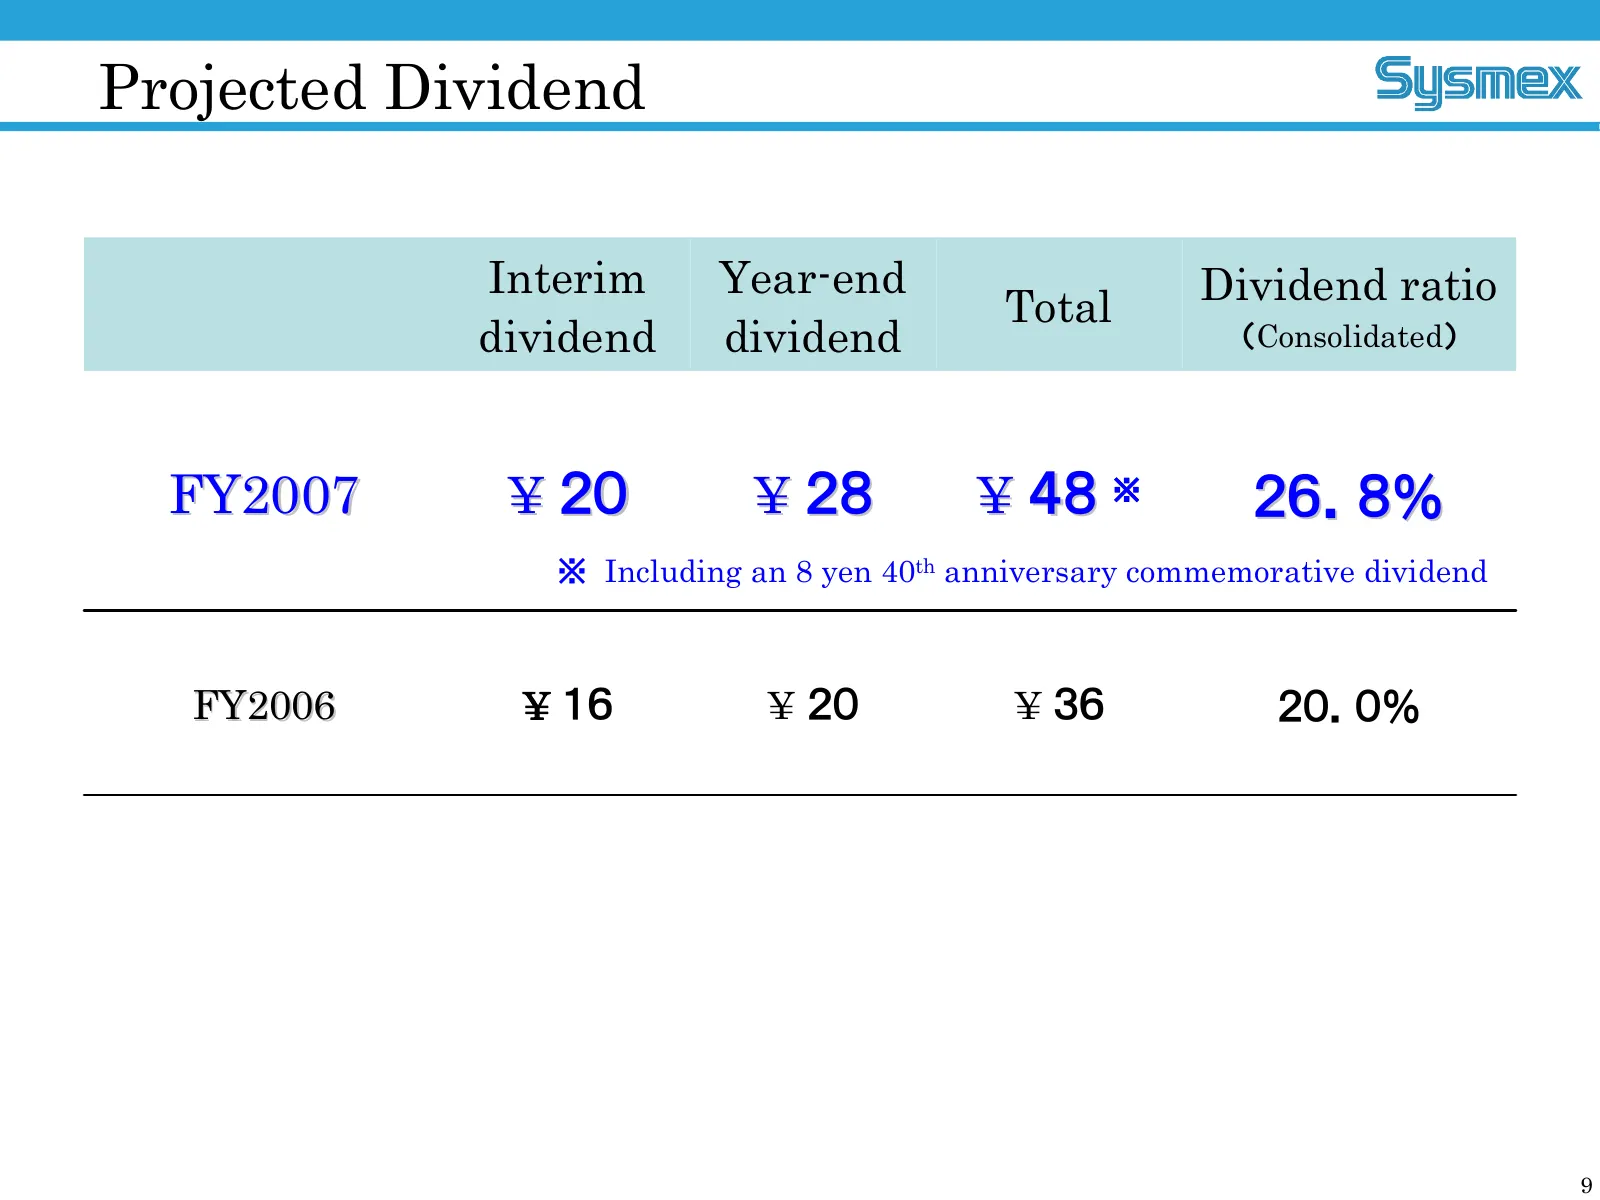
Projected Dividend Interim Yearend Dividend ratio Total dividend dividend (Consolidated) FY2007 ¥ 20 ¥ 28 ¥ 48 ※ 26.8% ※ Including an 8 yen 40th anniversary commemorative dividend FY2006 ¥ 16 ¥ 20 ¥ 36 20.0% 9
Slide 10: Opportunities for FY2008
Opportunities for FY2008 • External Environment • LongTerm Vision and Core Strategies • Approaches in Each Geographical Segment • Programs for the Life Science Business • Progress in R&D A Unique & Global Healthcare Testing Company
Slide 11: External Environment
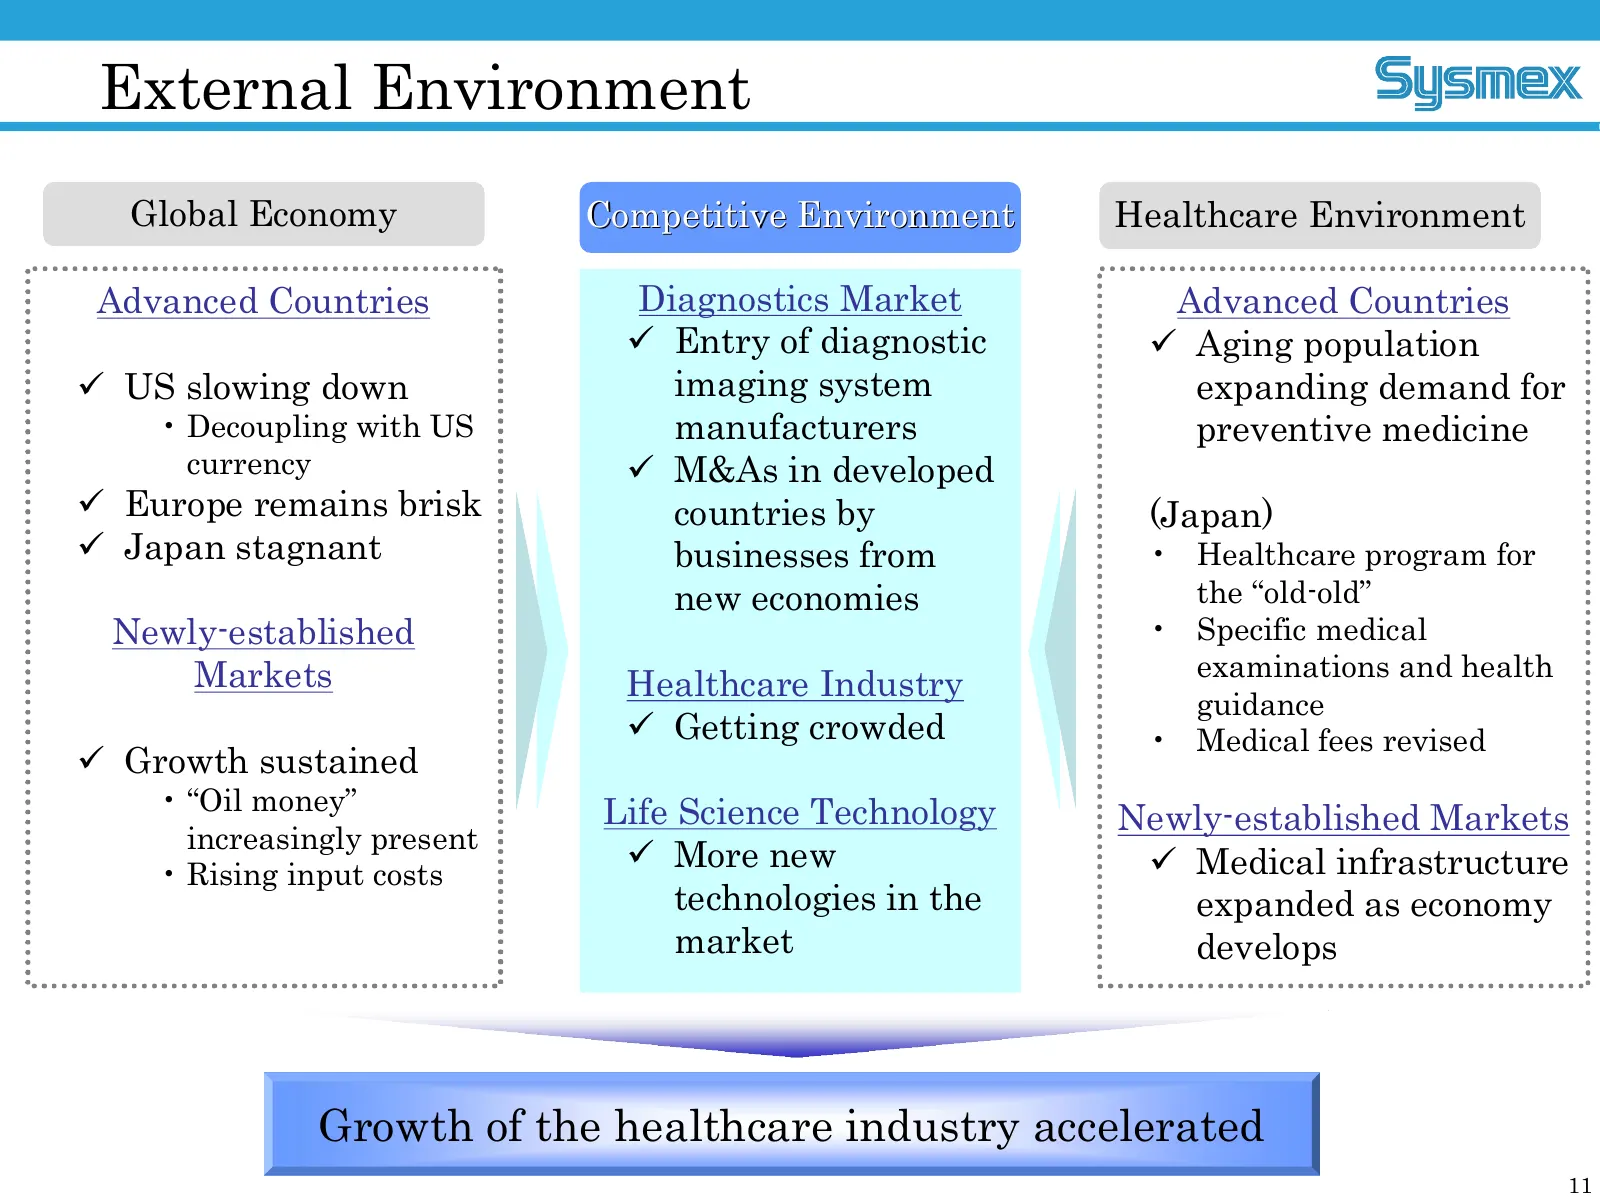
External Environment Global Economy Competitive Environment Environment Healthcare Environment Advanced Countries Diagnostics Market Advanced Countries ü Entry of diagnostic ü Aging population ü US slowing down imaging system expanding demand for • Decoupling with US manufacturers preventive medicin
Slide 12: Environmental Shifts in Japan's Diagnostics Market
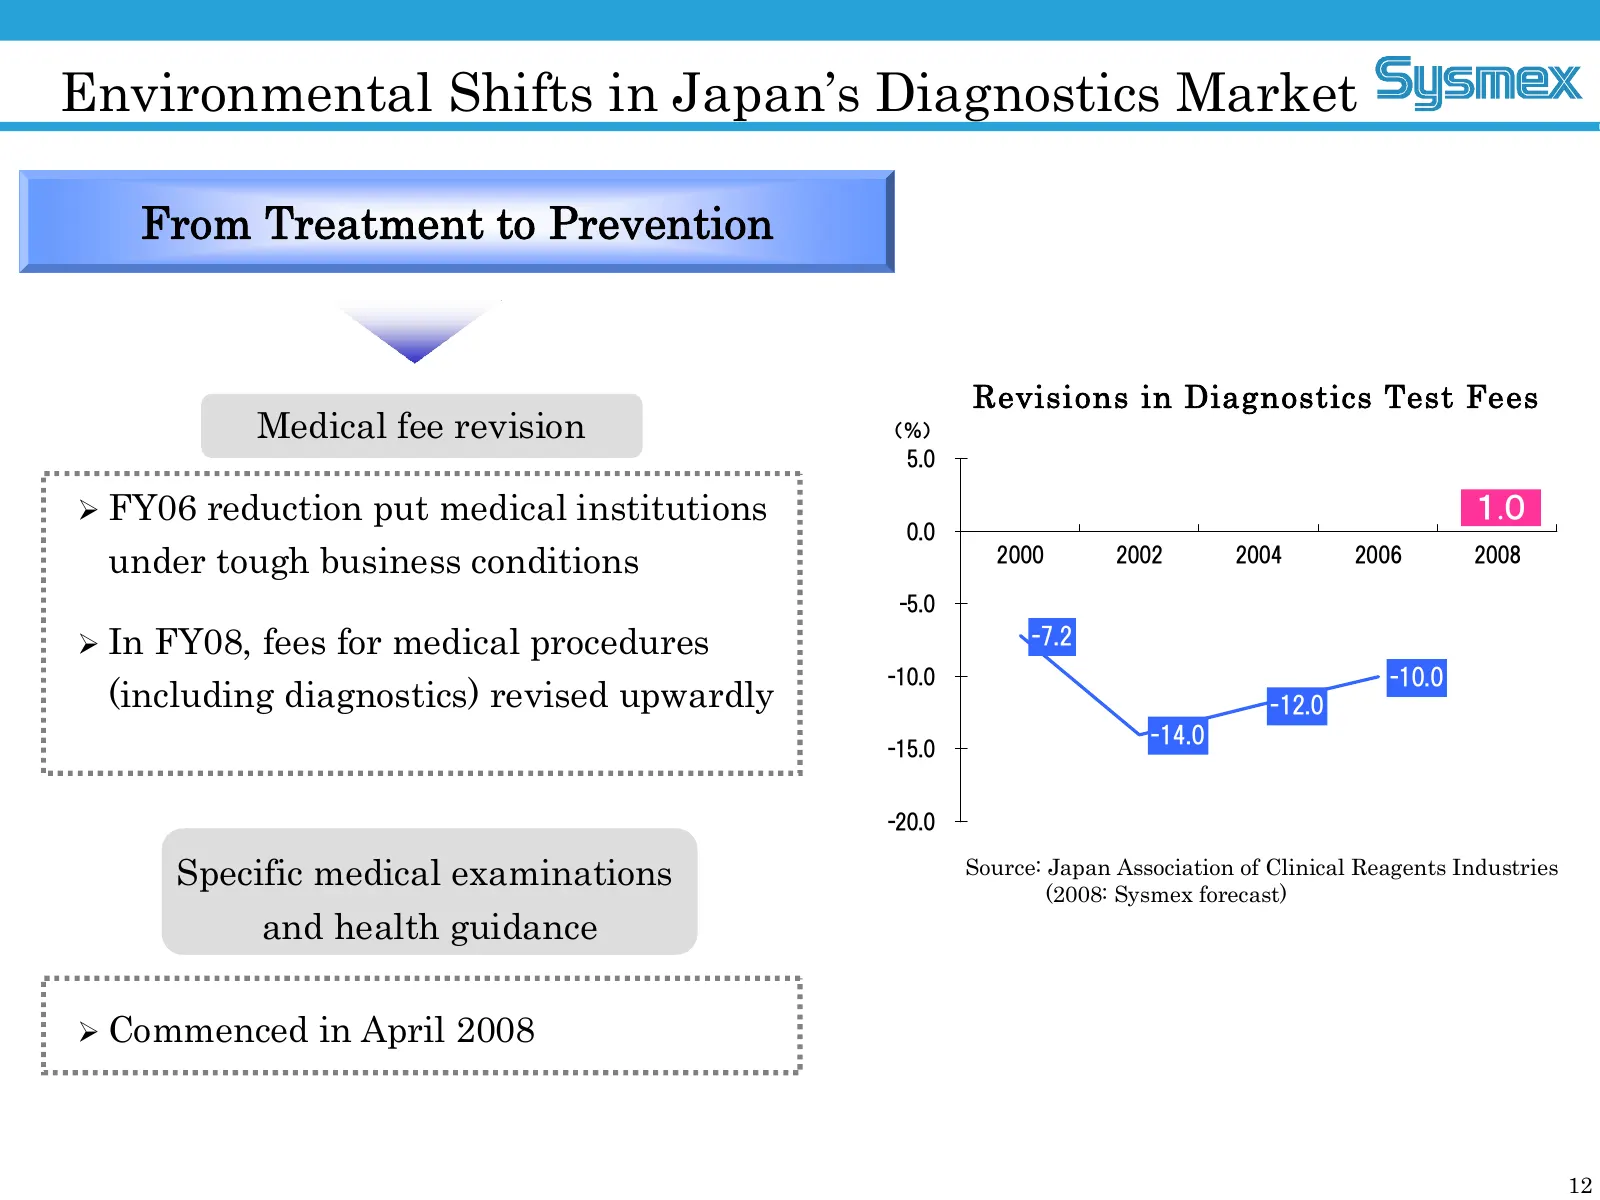
Environmental Shifts in Japan’s Diagnostics Market From Treatment to Prevention Revisions in Diagnostics Test Fees Medical fee revision (%) 5.0 Ø FY06 reduction put medical institutions 1.0 0.0 under tough business conditions 2000 2002 2004 2006 2008 -5.0 Ø In FY08, fees for medical procedures -7.2
Slide 13: Long-term Vision and Core Strategies
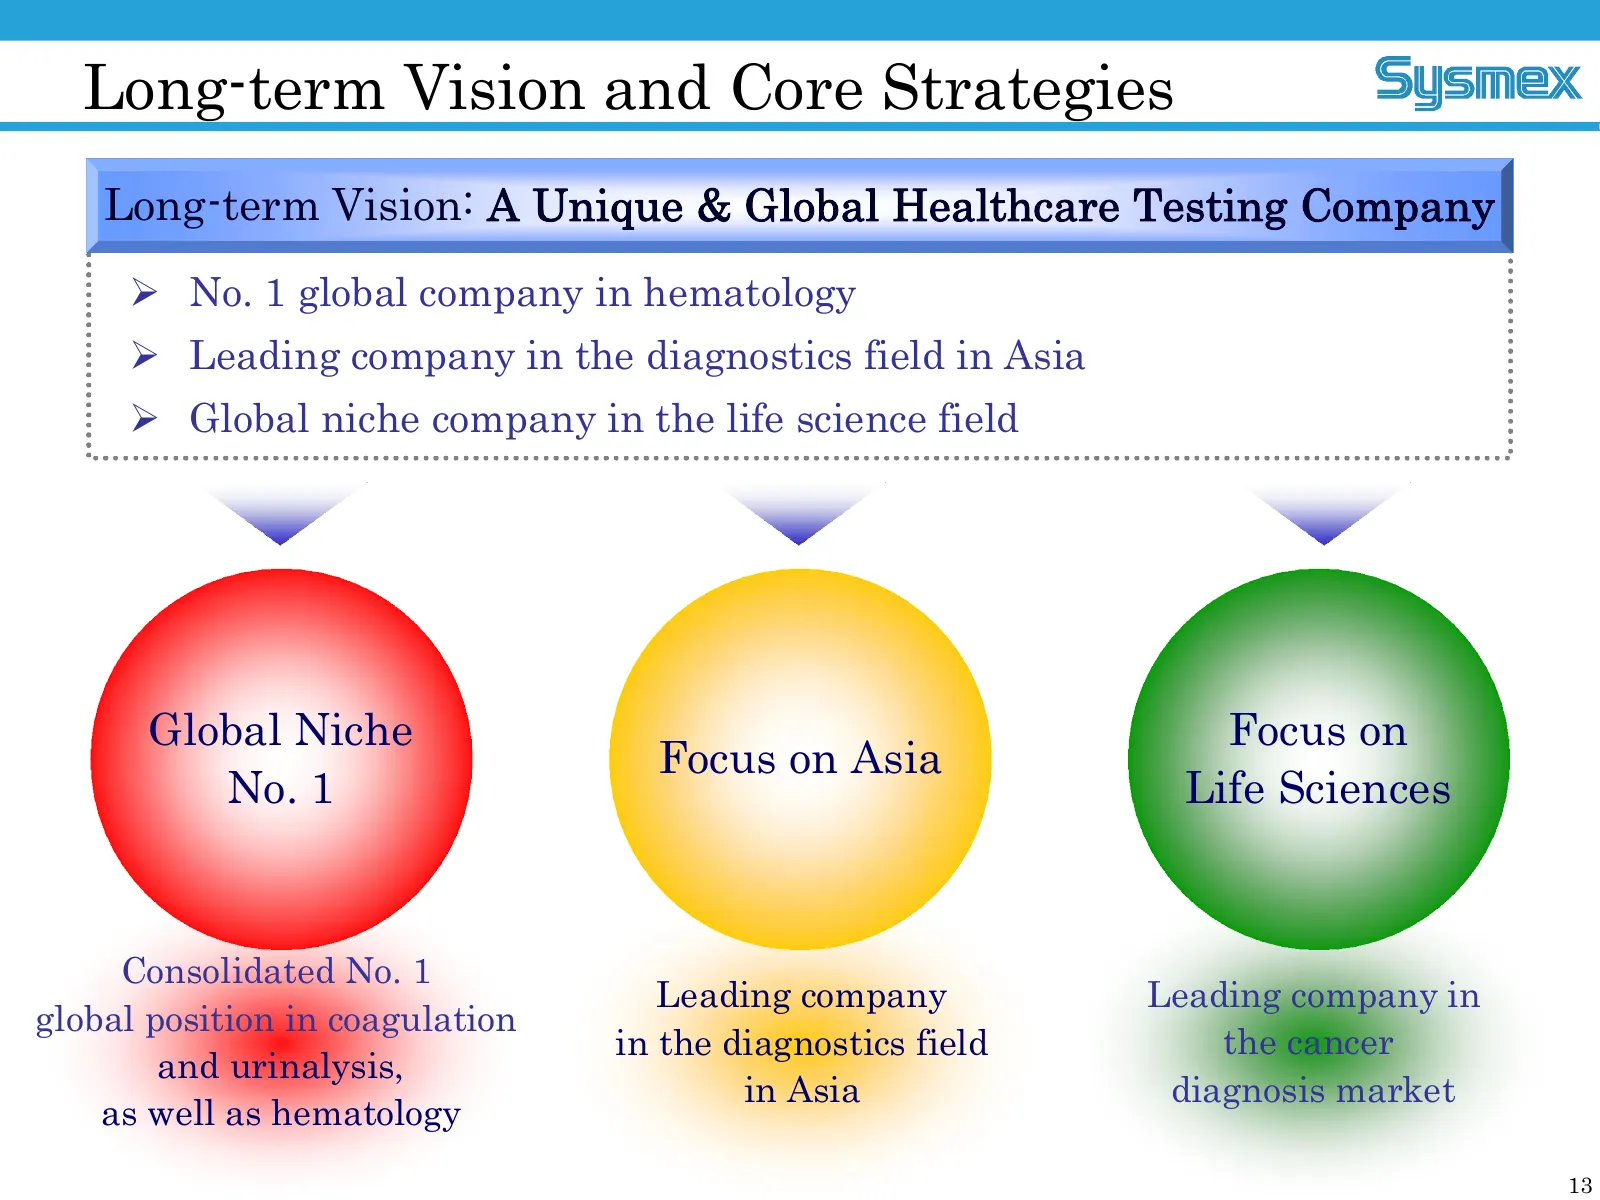
Longterm Vision and Core Strategies Longterm Vision: A Unique & Global Healthcare Testing Company Ø No. 1 global company in hematology Ø Leading company in the diagnostics field in Asia Ø Global niche company in the life science field Global Niche Focus on Focus on Asia No. 1 Life Sciences Consoli
Slide 14: 40th Anniversary Commemorative Event
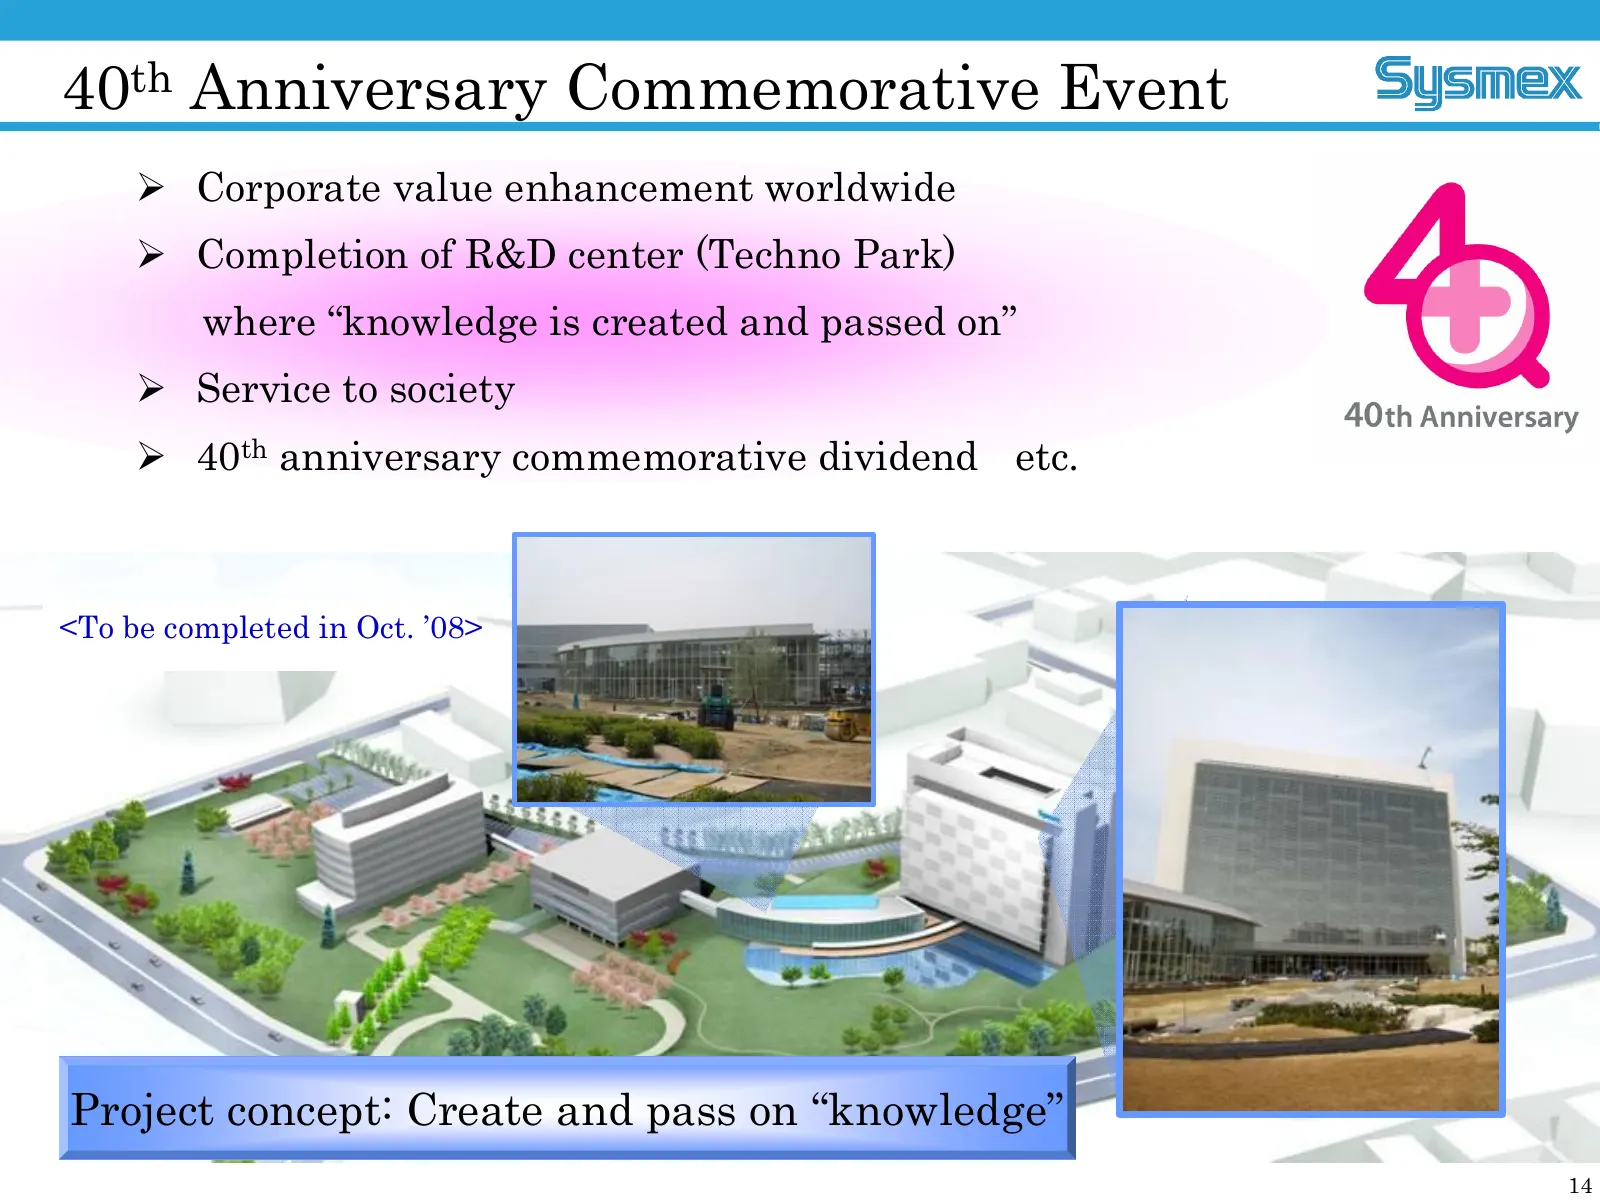
40th Anniversary Commemorative Event Ø Corporate value enhancement worldwide Ø Completion of R&D center (Techno Park) where “knowledge is created and passed on” Ø Service to society Ø 40th anniversary commemorative dividend etc. <To be completed in Oct. ’08> Project concept: Create and pass on “know
Slide 15: Geographic Segment Information (Japan)
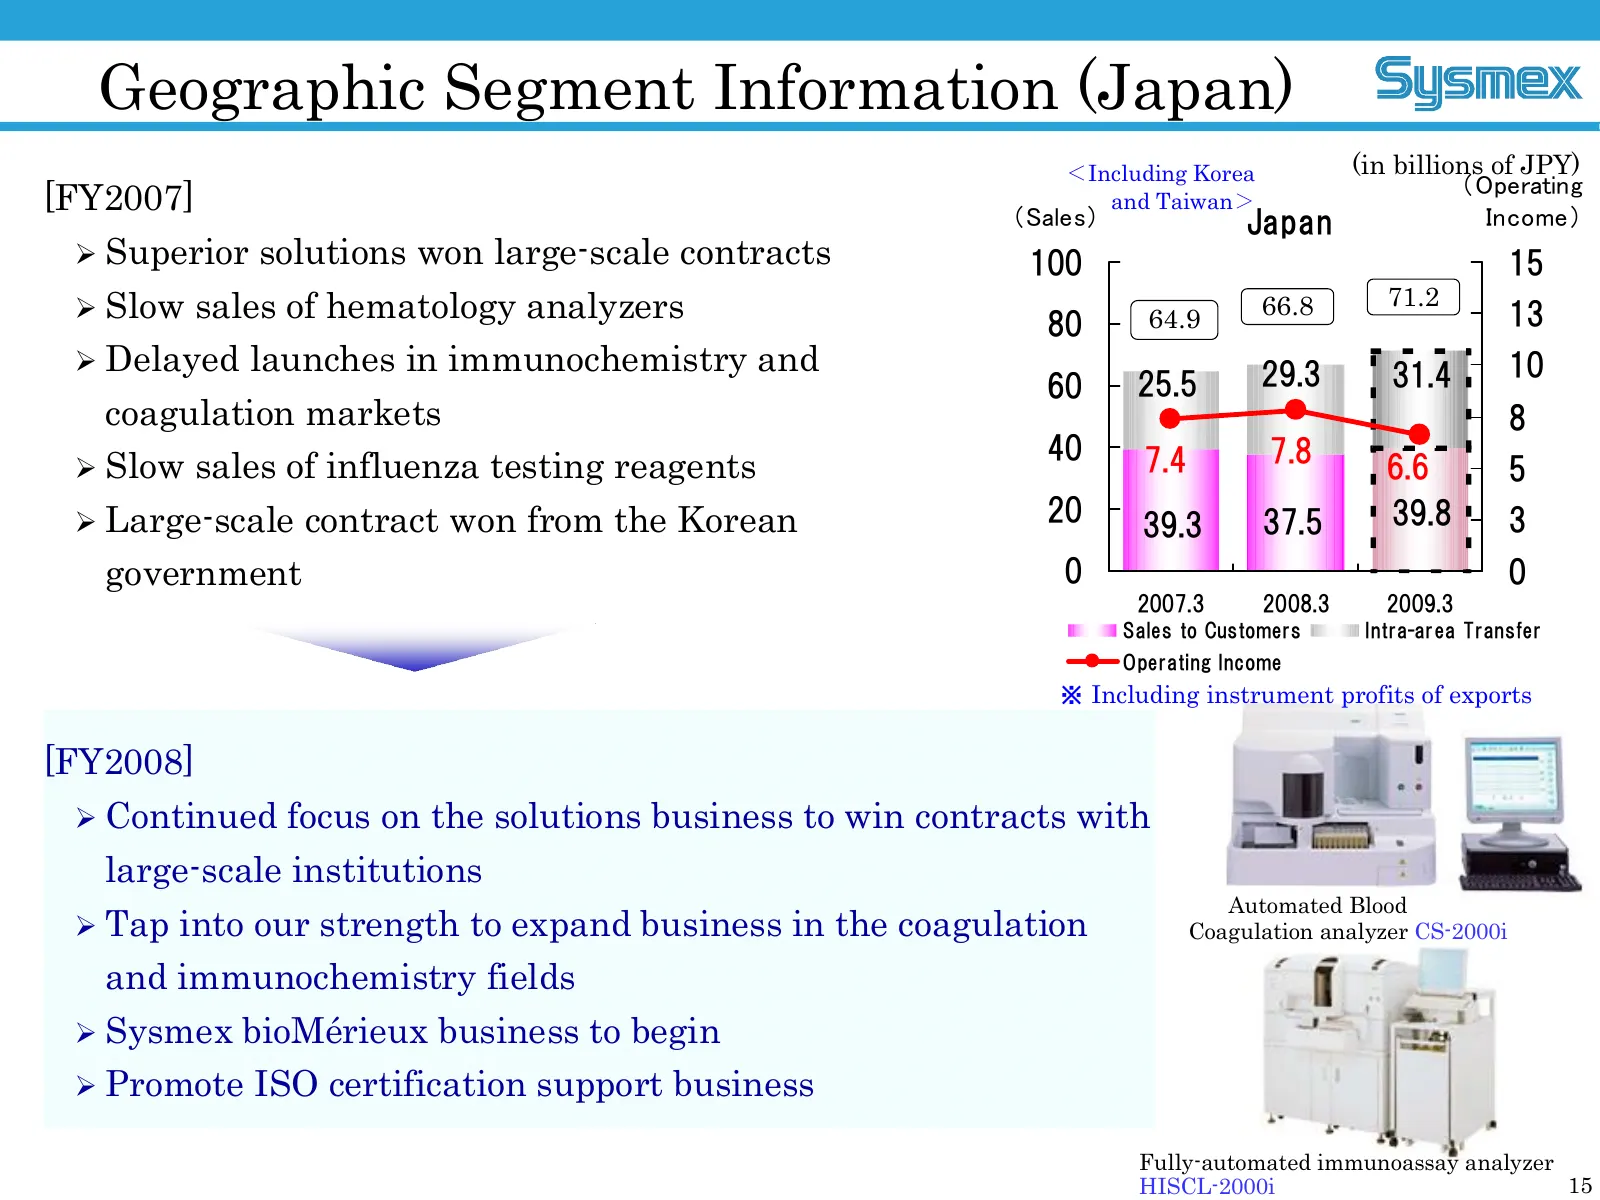
Geographic Segment Information (Japan) <Including Korea (in billions of JPY) (Operating [FY2007] (Sales) and Taiwan> Income) Japan Ø Superior solutions won largescale contracts 100 15 Ø Slow sales of hematology analyzers 66.8 71.2 80 64.9 13 Ø Delayed launches in immunochemistry and 10 60 25.5 29.3
Slide 16: Geographic Segment Information (Americas)
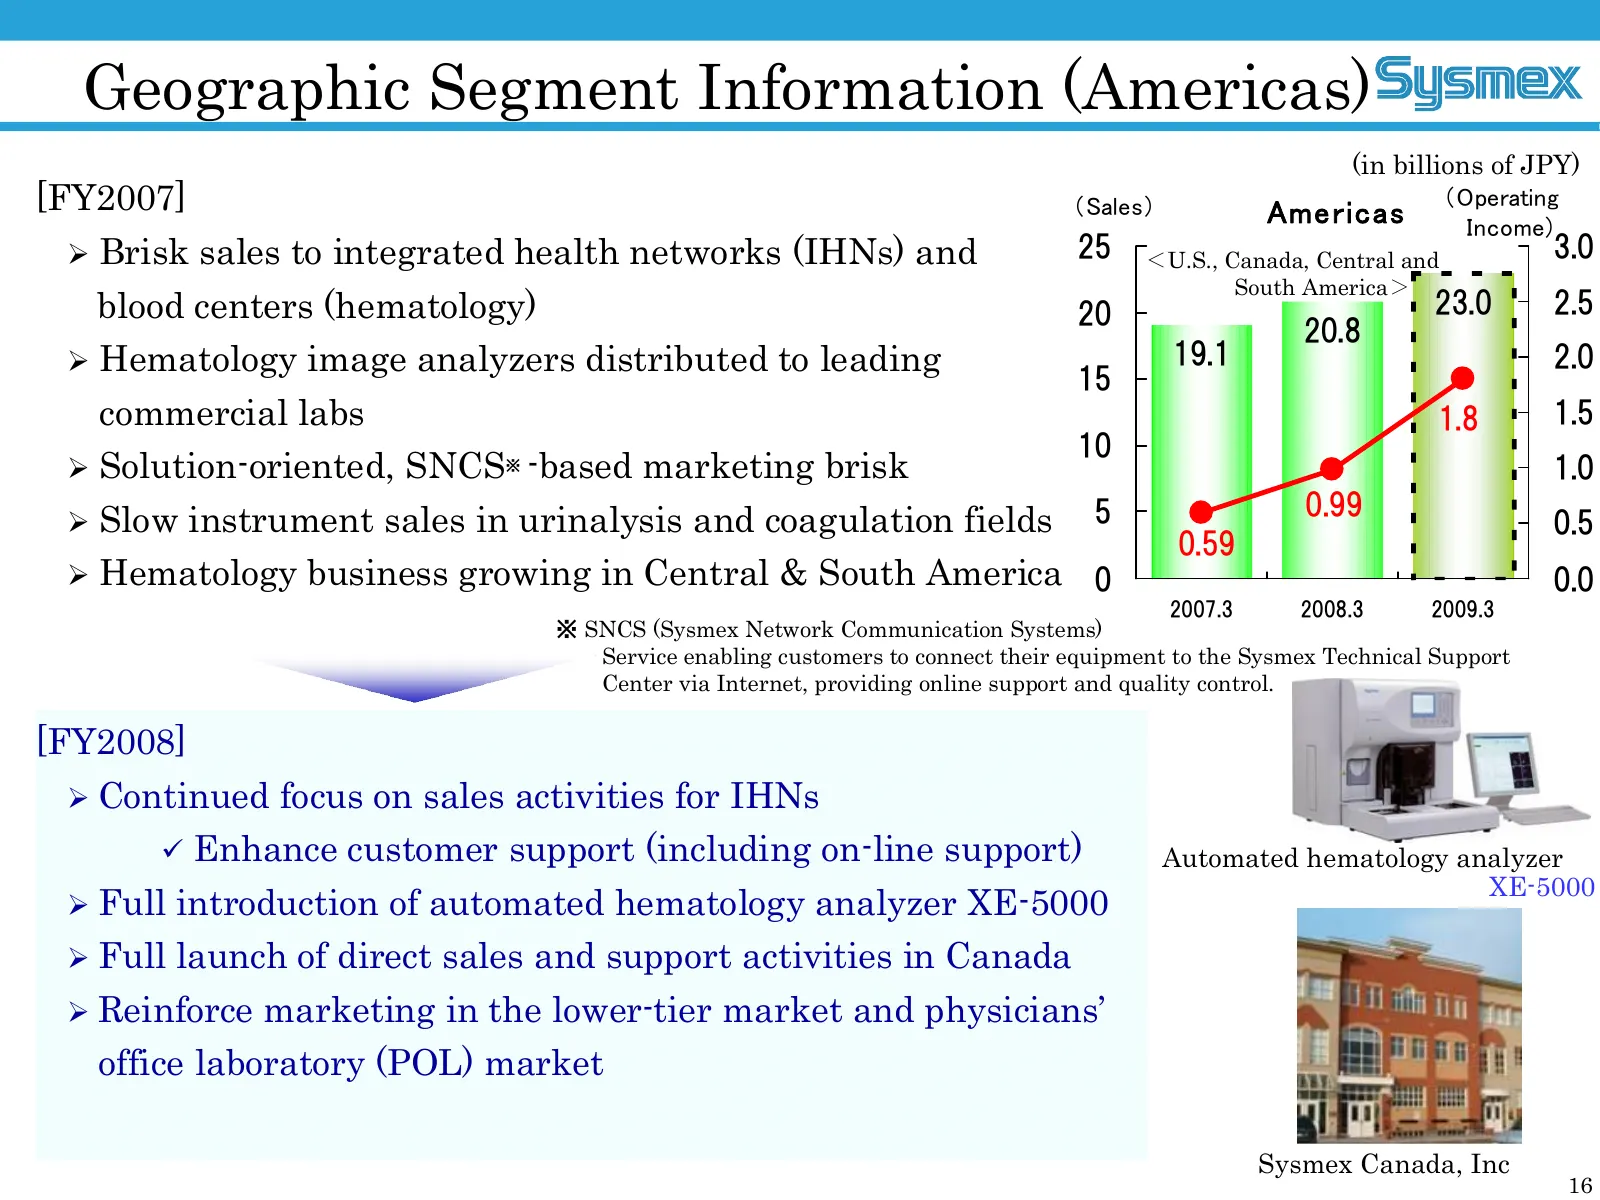
Geographic Segment Information (Americas) (in billions of JPY) [FY2007] (Sales) Americas (Operating Income) Ø Brisk sales to integrated health networks (IHNs) and 25 <U.S., Canada, Central and 3.0 South America> blood centers (hematology) 20 23.0 2.5 20.8 Ø Hematology image analyzers distributed to
Slide 17: Geographic Segment Information (Europe)
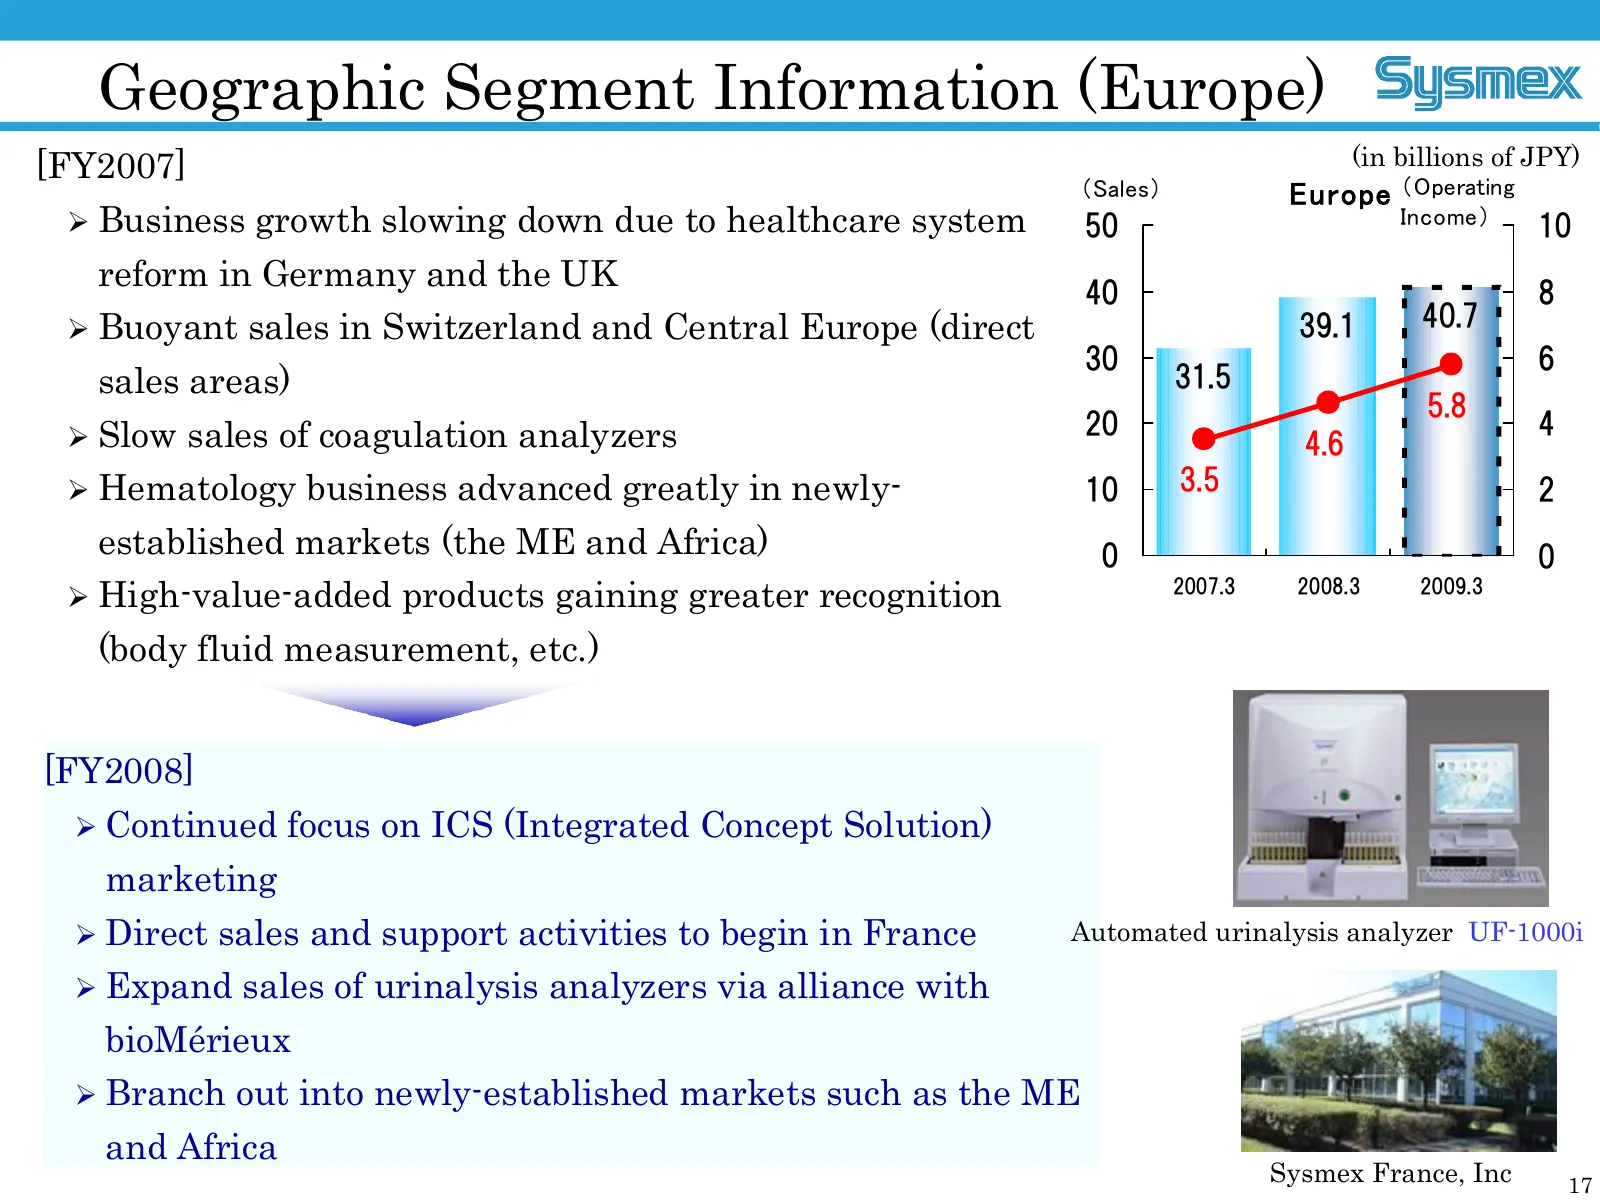
Geographic Segment Information (Europe) [FY2007] (in billions of JPY) (Sales) Europe (Operating Ø Business growth slowing down due to healthcare system Income) 50 10 reform in Germany and the UK 40 8 Ø Buoyant sales in Switzerland and Central Europe (direct 39.1 40.7 30 6 sales areas) 31.5 5.8 Ø Slo
Slide 18: Geographic Segment Information (China)
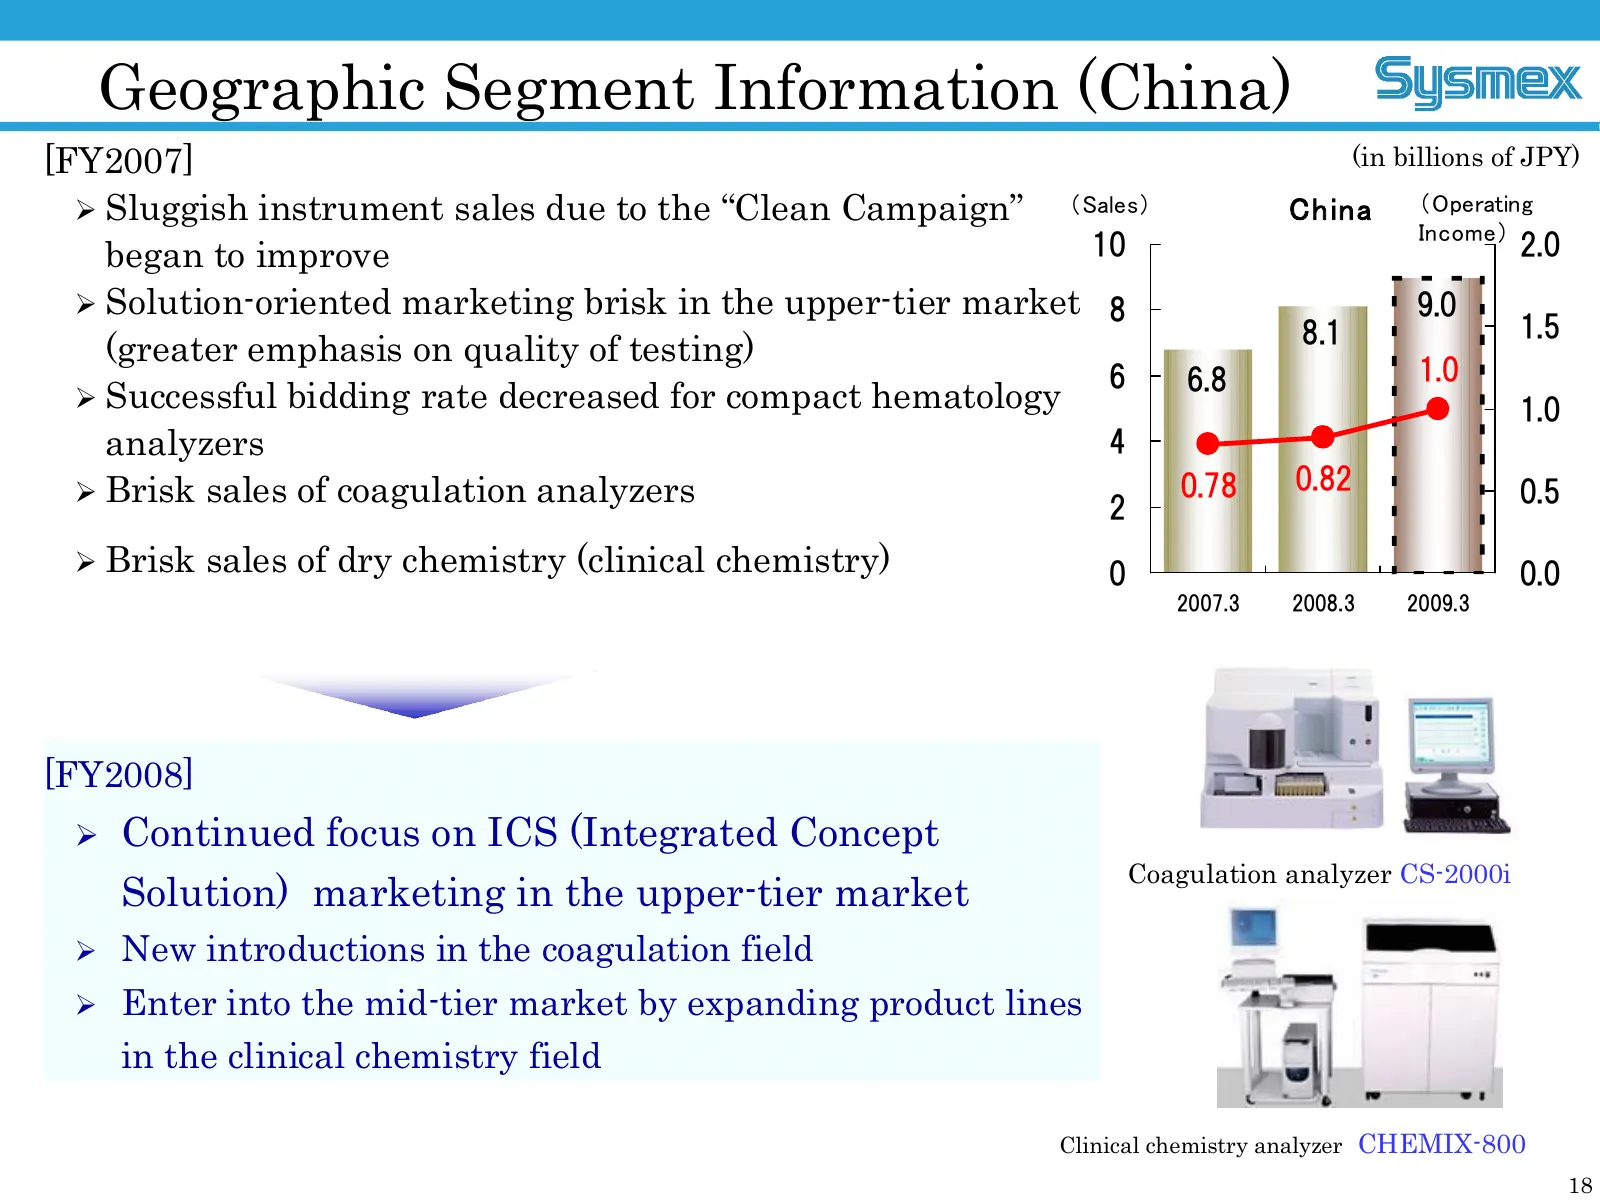
Geographic Segment Information (China) [FY2007] (in billions of JPY) Ø Sluggish instrument sales due to the “Clean Campaign” (Sales) China (Operating Income) began to improve 10 2.0 Ø Solutionoriented marketing brisk in the uppertier market 8 9.0 8.1 1.5 (greater emphasis on quality of testing) 6
Slide 19: Geographical Segment Information (AP)
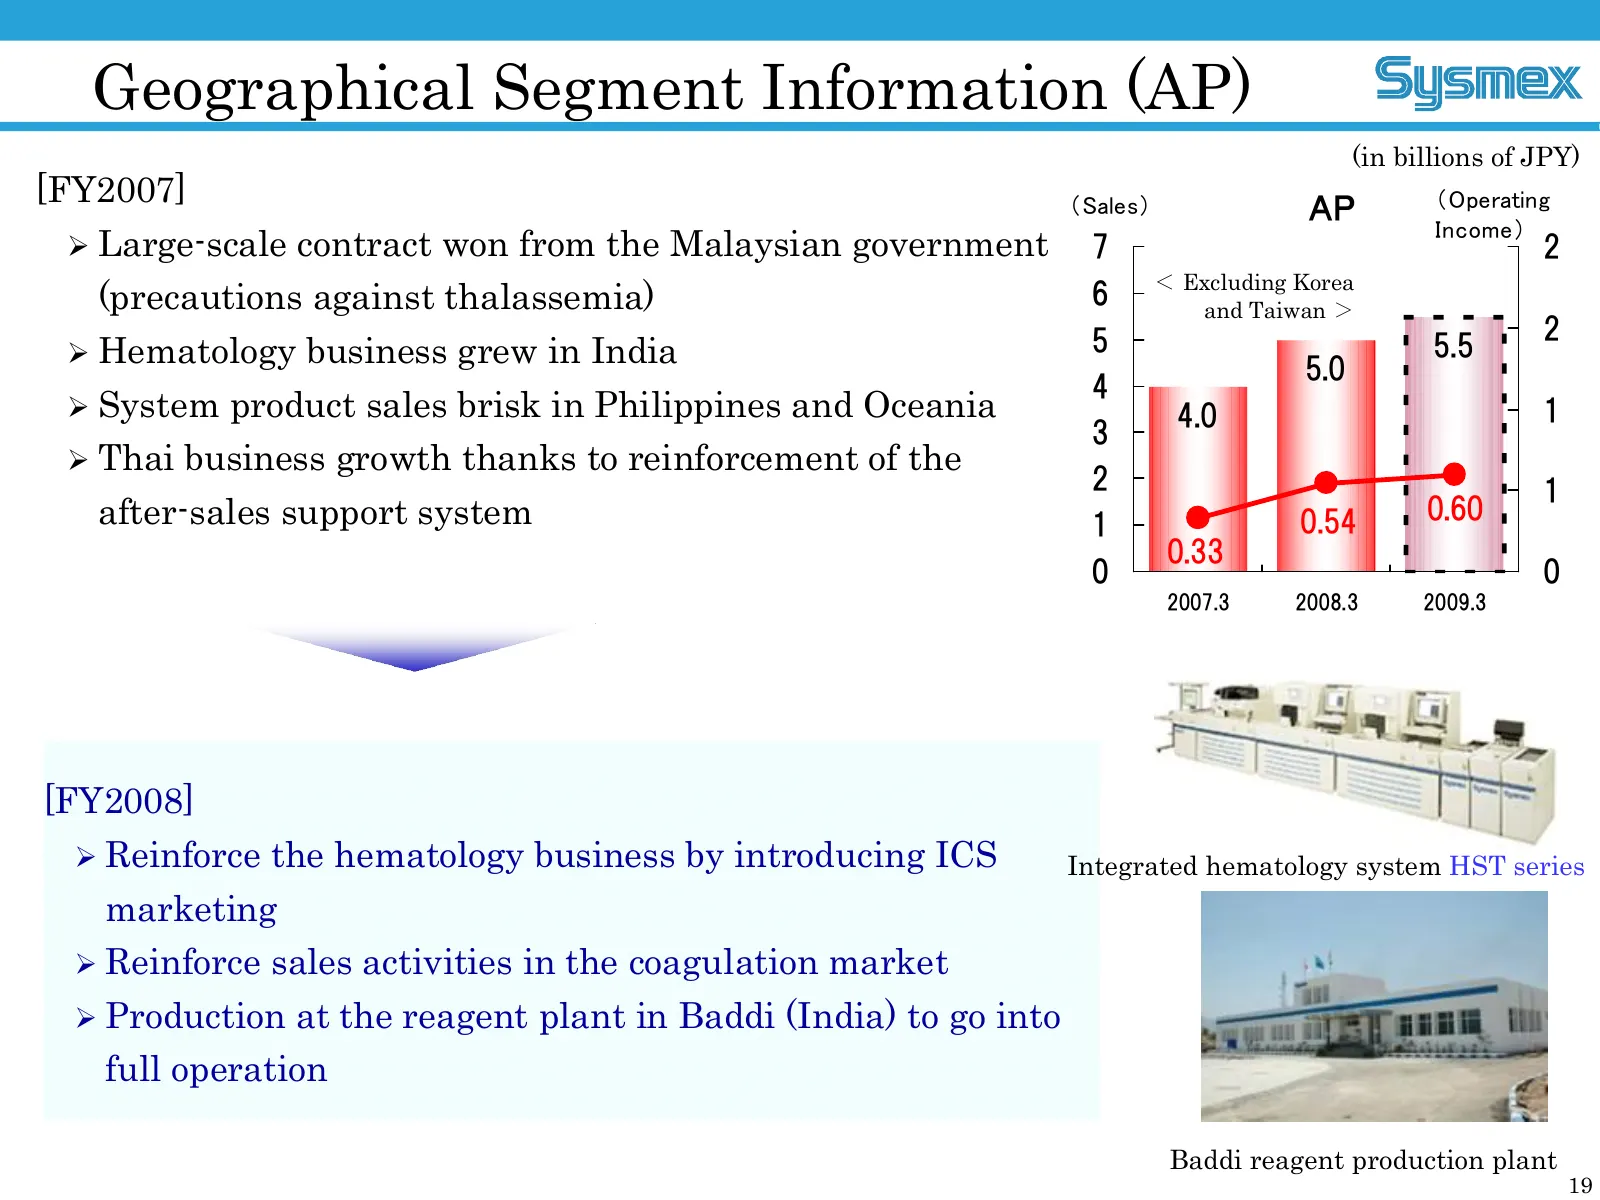
Geographical Segment Information (AP) (in billions of JPY) [FY2007] (Operating (Sales) AP Income) Ø Largescale contract won from the Malaysian government 7 2 < Excluding Korea (precautions against thalassemia) 6 and Taiwan > 5 2 Ø Hematology business grew in India 5.5 5.0 4 Ø System product sales b
Slide 20: Programs for the Life Science Business
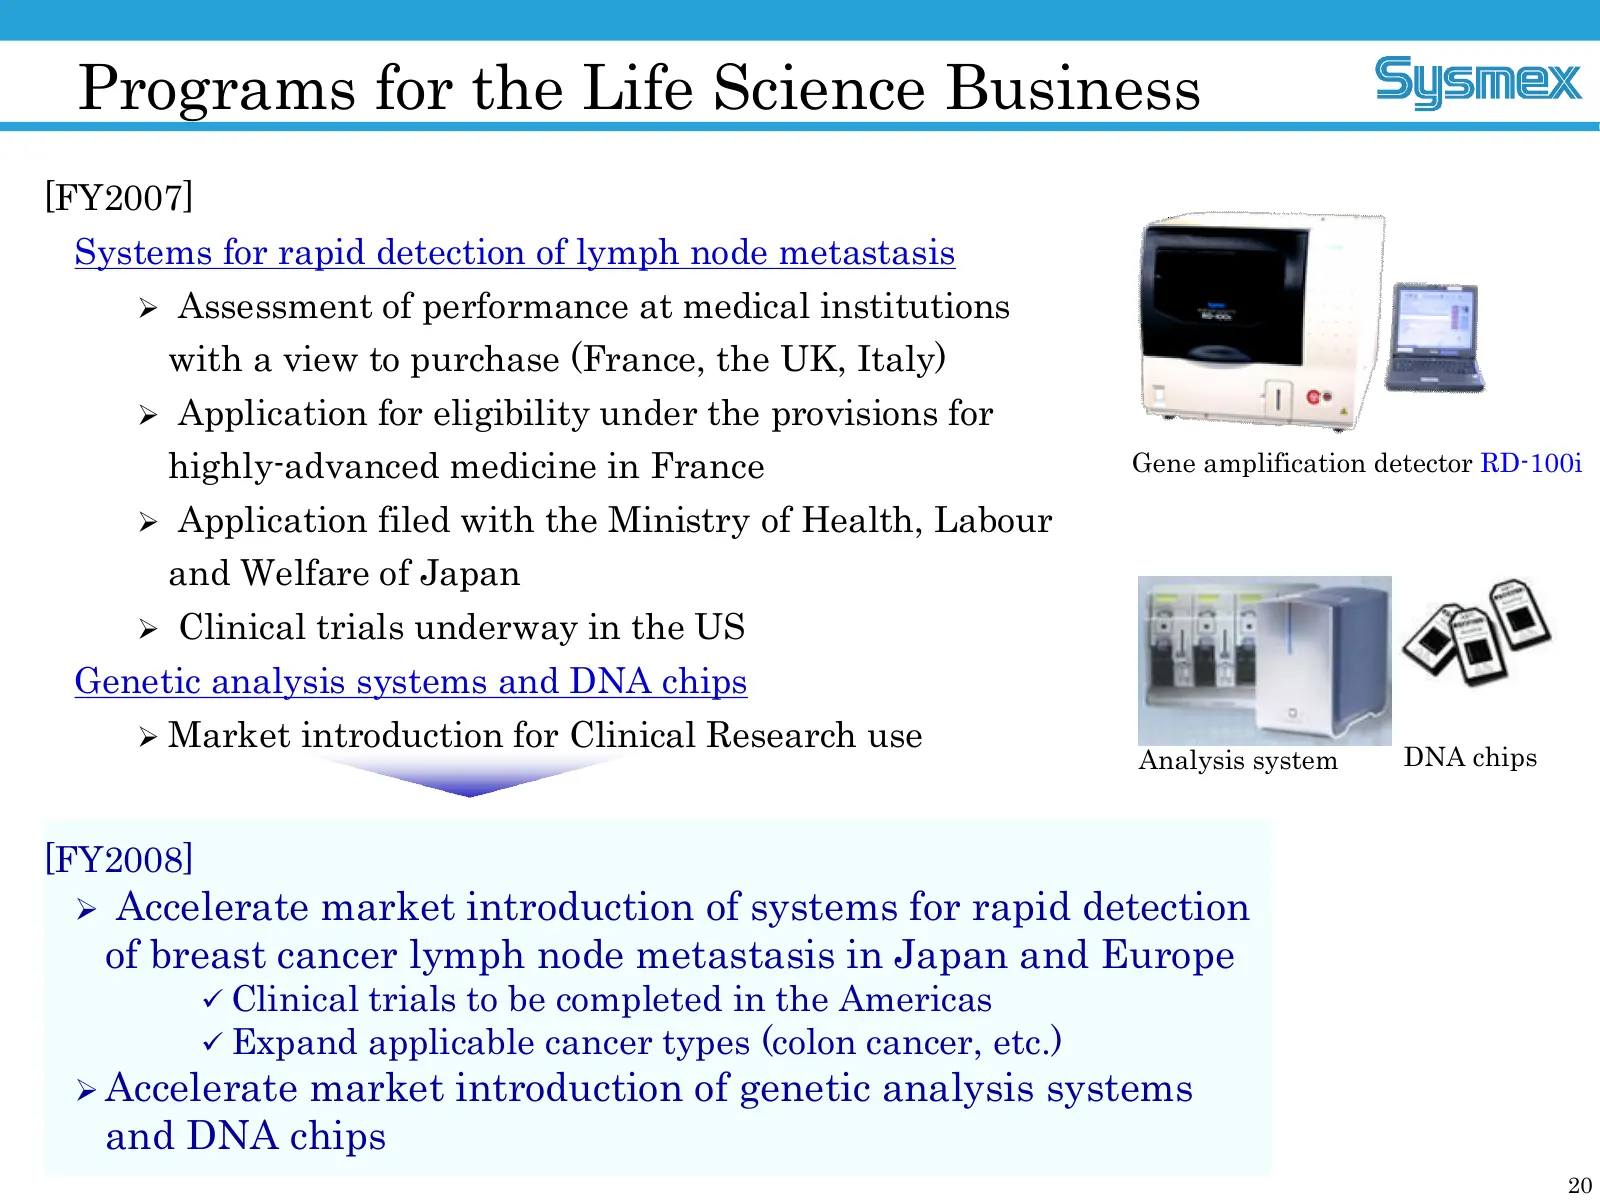
Programs for the Life Science Business [FY2007] Systems for rapid detection of lymph node metastasis Ø Assessment of performance at medical institutions with a view to purchase (France, the UK, Italy) Ø Application for eligibility under the provisions for highlyadvanced medicine in France Gene ampl
Slide 21: Progress in R&D (Life Science)
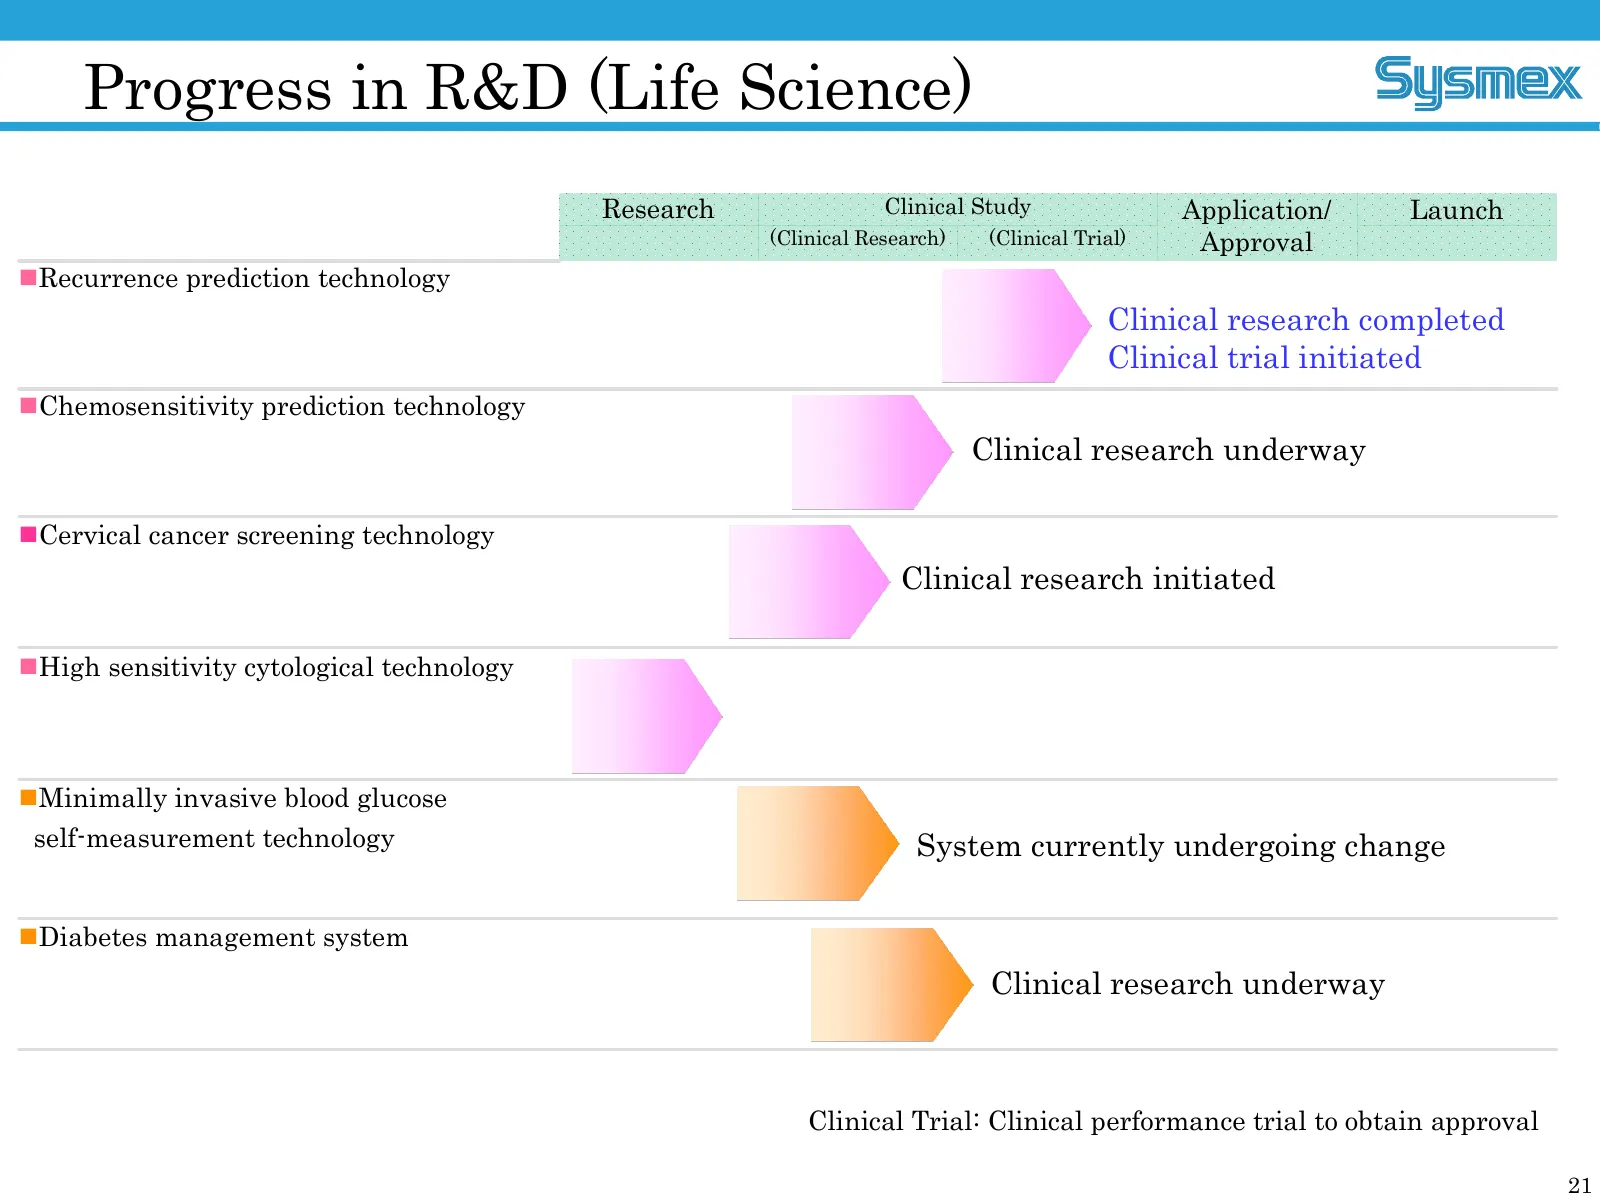
Progress in R&D (Life Science) Research Clinical Study Application/ Launch (Clinical Research) (Clinical Trial) Approval nRecurrence prediction technology Clinical research completed Clinical trial initiated nChemosensitivity prediction technology Clinical research underway nCervical cancer screenin
Slide 22: FY2008 Consolidated Earnings Forecast
FY2008 Consolidated Earnings Forecast • Consolidated Earnings Forecast • Projected Dividend A Unique & Global Healthcare Testing Company
Slide 23: FY2008 Consolidated Earnings Forecast
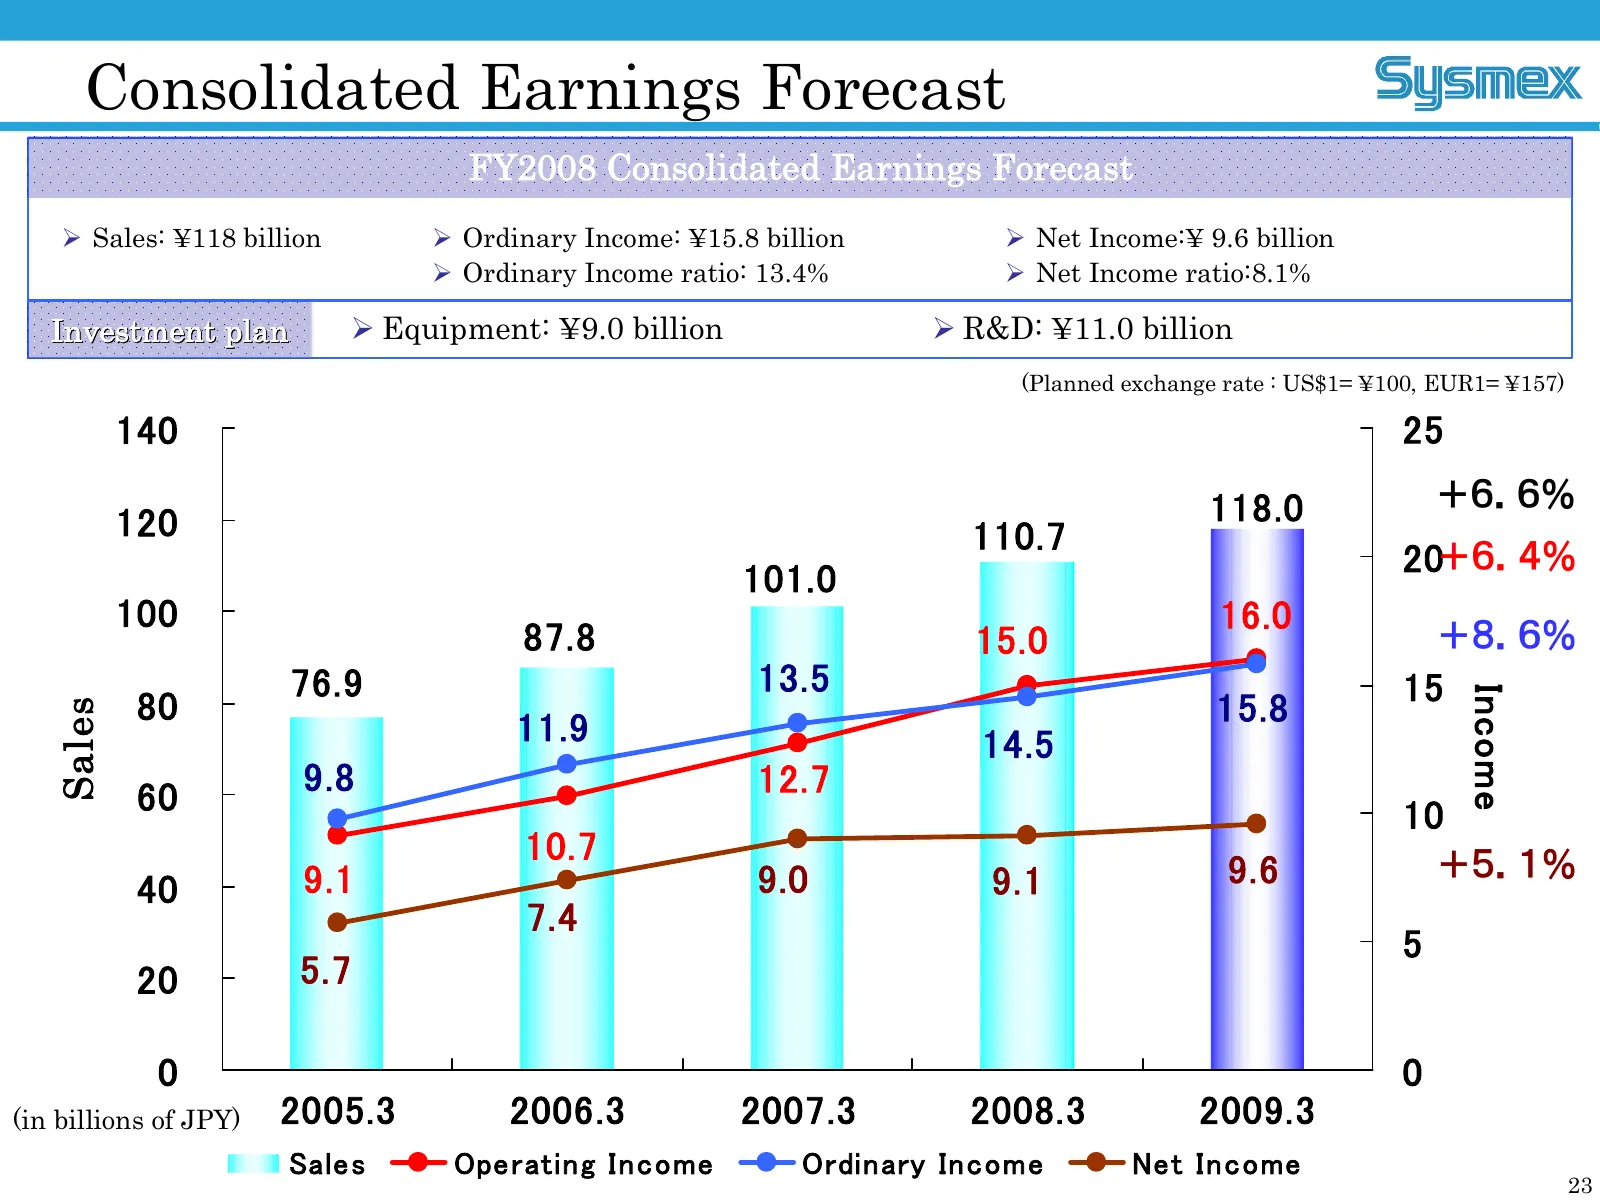
Consolidated Earnings Forecast FY2008 Consolidated Earnings Forecast Ø Sales: ¥118 billion Ø Ordinary Income: ¥15.8 billion Ø Net Income:¥ 9.6 billion Ø Ordinary Income ratio: 13.4% Ø Net Income ratio:8.1% Investment plan Ø Equipment: ¥9.0 billion Ø R&D: ¥11.0 billion (Planned exchange rate : US$1=
Slide 24: Factors Behind Earnings Forecast
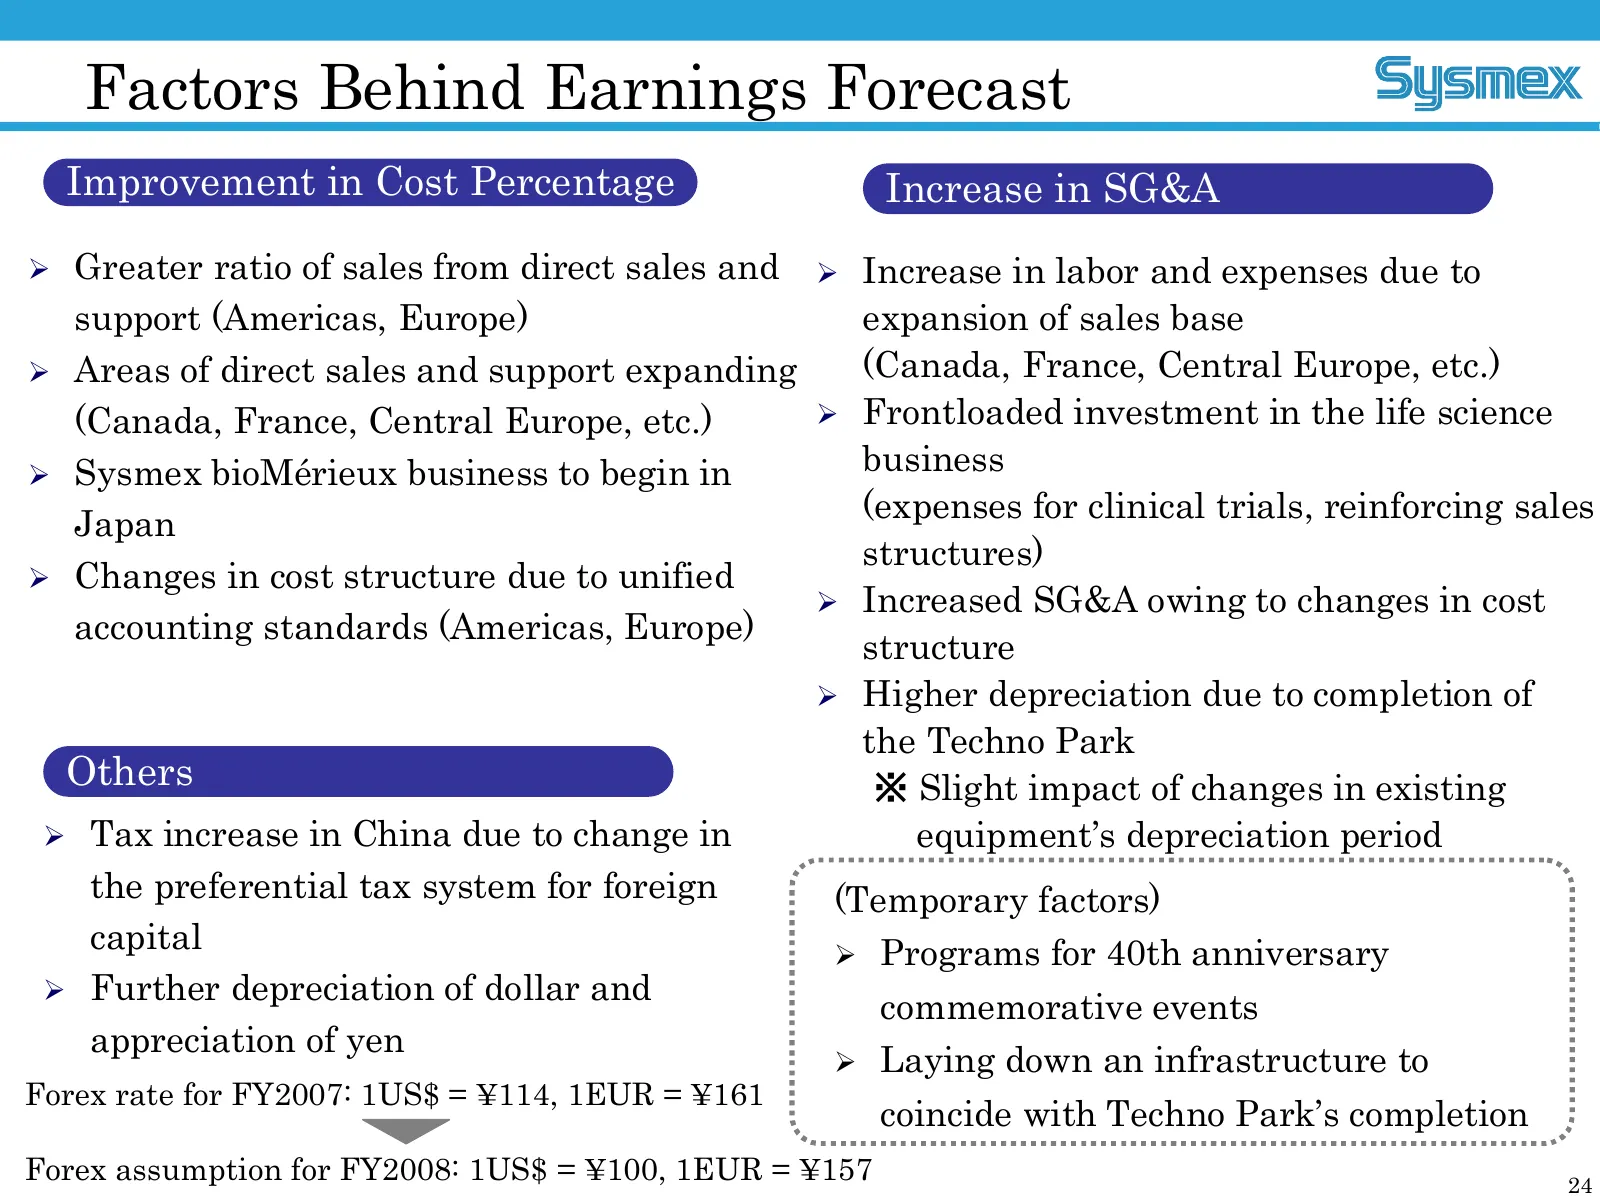
Factors Behind Earnings Forecast Improvement in Cost Percentage Increase in SG&A Ø Greater ratio of sales from direct sales and Ø Increase in labor and expenses due to support (Americas, Europe) expansion of sales base Ø Areas of direct sales and support expanding (Canada, France, Central Europe, et
Slide 25: Projected Dividend
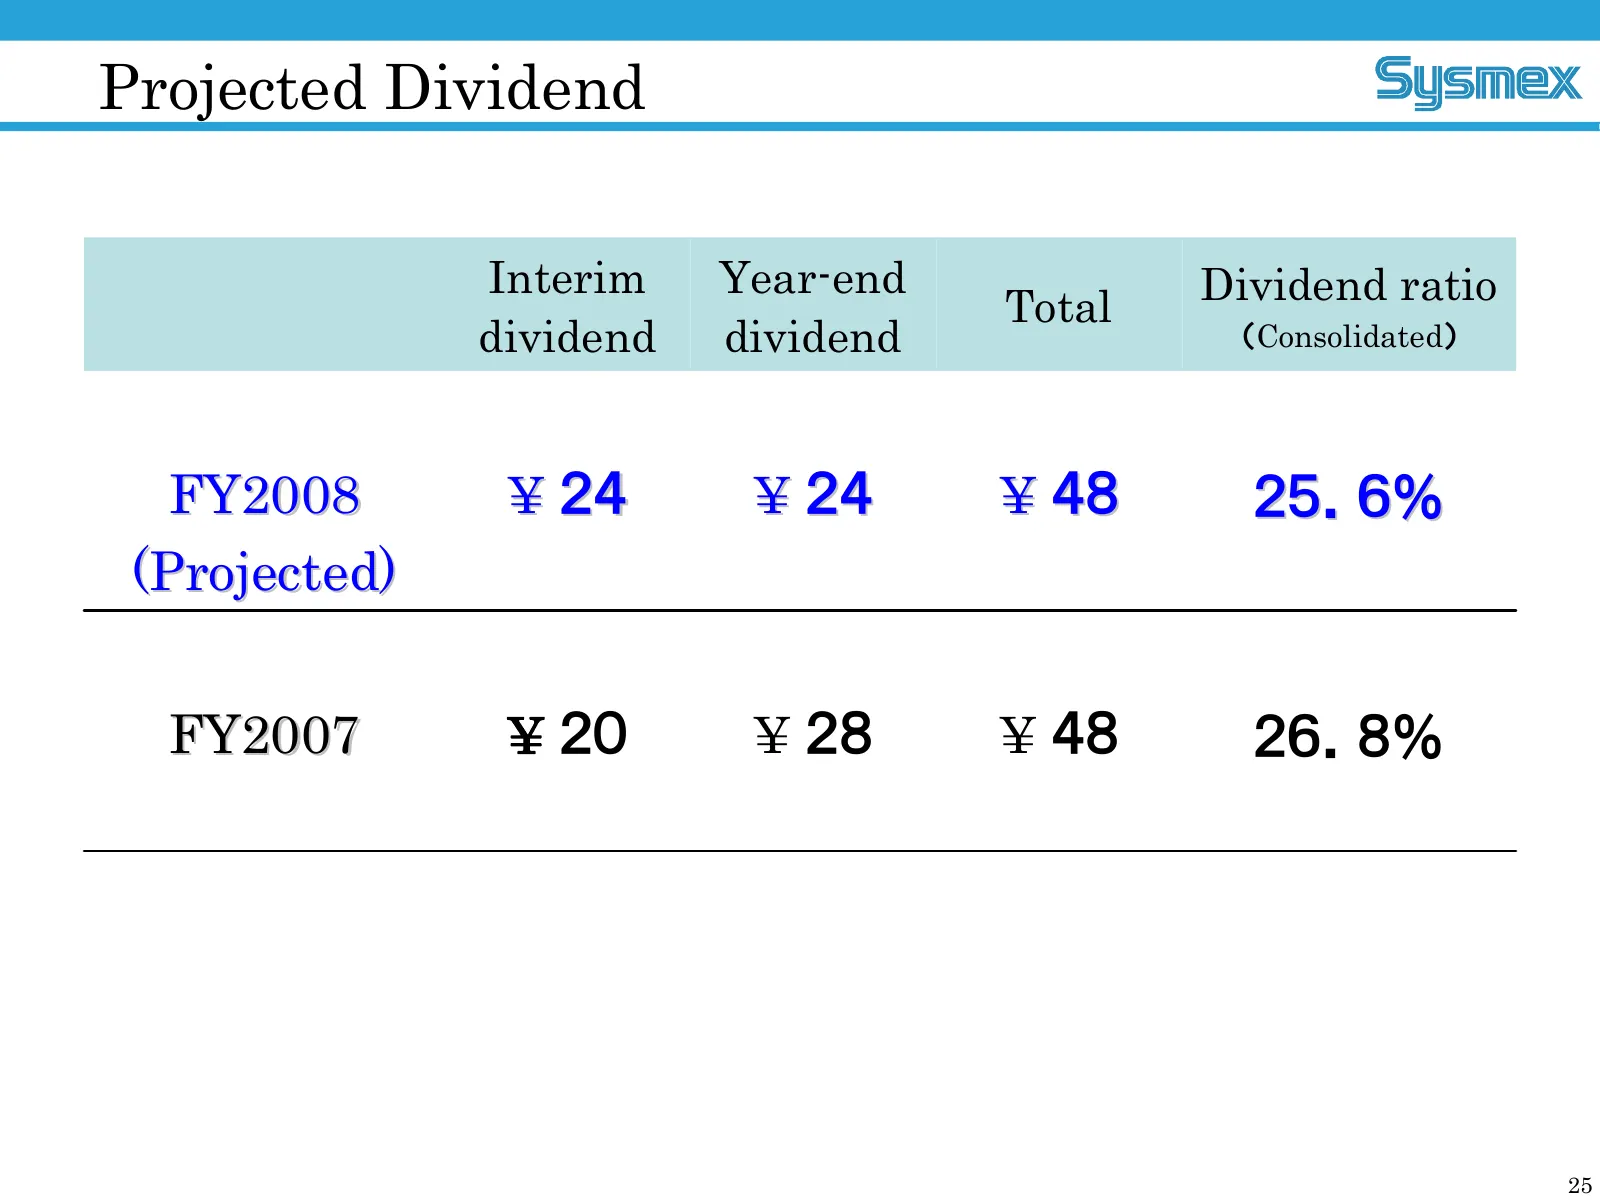
Projected Dividend Interim Yearend Dividend ratio Total dividend dividend (Consolidated) FY2008 ¥ 24 ¥ 24 ¥ 48 25.6% (Projected) FY2007 ¥ 20 ¥ 28 ¥ 48 26.8% 25
Slide 26: Challenging the Frontiers of Healthcare Testing
Forwardlooking Statements This material contains forwardlooking statements about Sysmex Corporation and its group companies (the Sysmex Group). These forwardlooking statements are based on the current judgments and assumptions of the Sysmex Group in light of the information currently available to
Source: Internet Archive copy of sysmex.co.jp
More decks from Sysmex Corporation
 Investor Presentation (November 2026)43 slides · Nov 10, 2026
 Q1 FY2027 Earnings Presentation33 slides · Aug 7, 2026
 Investor Presentation (2025)43 slides · 2025
 FY2011 Earnings Presentation23 slides · May 10, 2012
 FY2012 Earnings Presentation23 slides · May 10, 2012
 9M FY2012 Earnings Presentation12 slides · Feb 3, 2012