Sysmex Corporation · TSE:6869
Sysmex — FY2011 Earnings Presentation
23 slides from Sysmex's earnings presentation, May 10, 2012
Slide 1: Business Results for the Fiscal Year Ended March 31, 2012
Business Results for the Fiscal Year Ended March 31, 2012 Sysmex Corporation Hisashi Ietsugu, g , President and CEO May 10, 2012
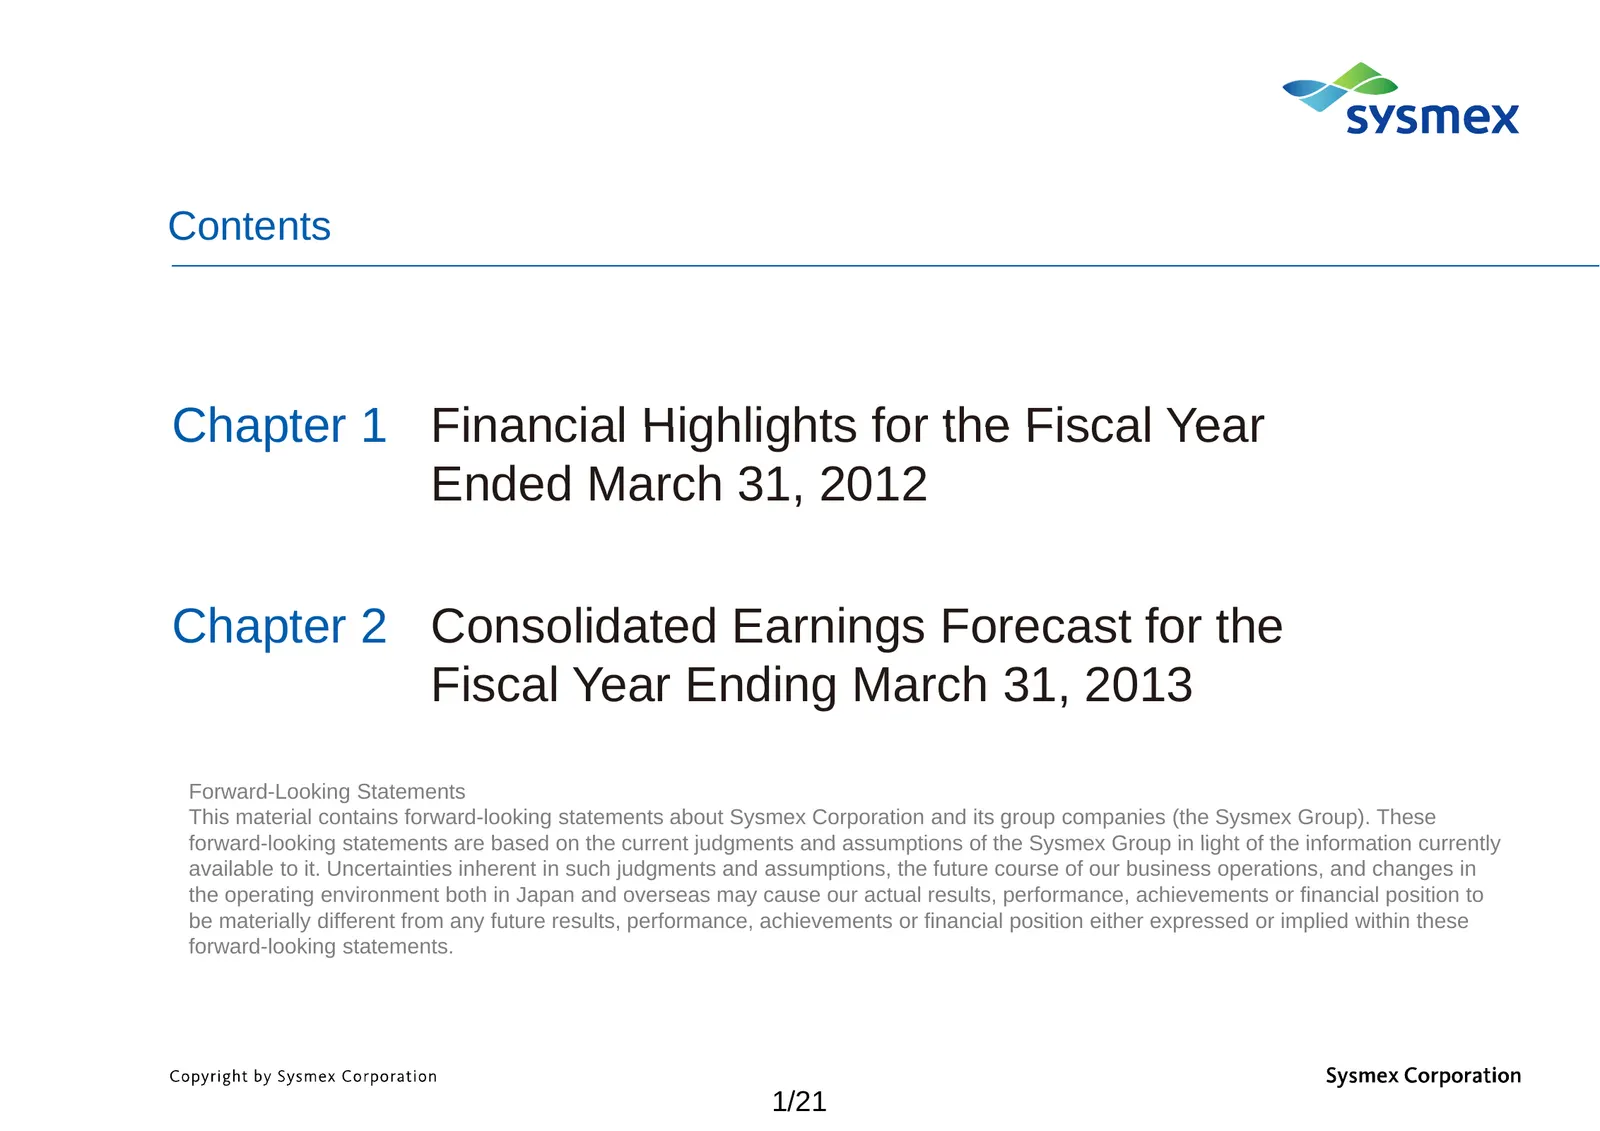
Slide 2: Contents and Forward-Looking Statements
Contents Chapter 1 Financial Highlights for the Fiscal Year Ended March 31, 2012 Chapter 2 Consolidated Earnings Forecast for the g March 31,, 2013 Fiscal Year Ending Forward-Looking Statements This material contains forward-looking statements about Sysmex Corporation and its group companies (the Sy
Slide 3: Chapter 1 Financial Highlights for the Fiscal Year Ended March 31, 2012
Chapter 1 Financial Highlights for the Fiscal Year Ended March 31, 2012
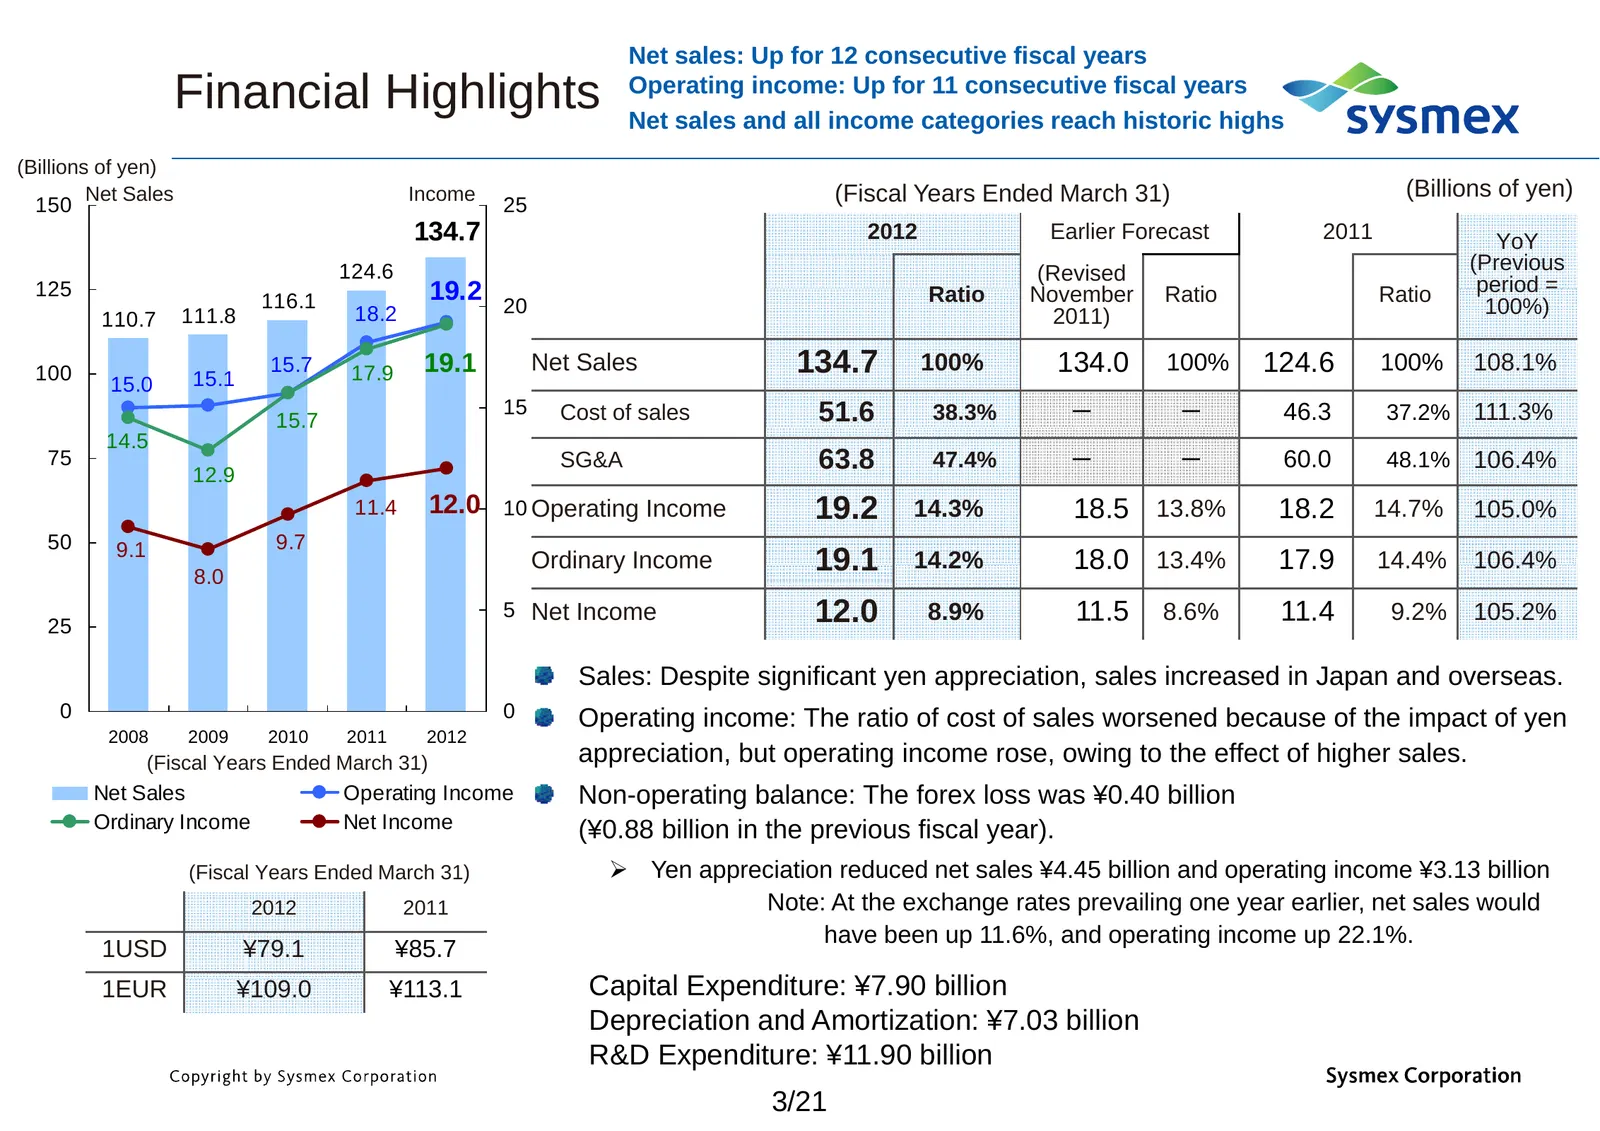
Slide 4: Financial Highlights
Net sales: Up for 12 consecutive fiscal years Financial Highlights Operating income: Up for 11 consecutive fiscal years Net sales and all income categories reach historic highs (Billions of yen) Net Sales Income (Fiscal Years Ended March 31) (Billions of yen) 150 25 134.7 2012 Earlier Forecast 2011
Slide 5: Breakdown of Net Sales and Operating Income
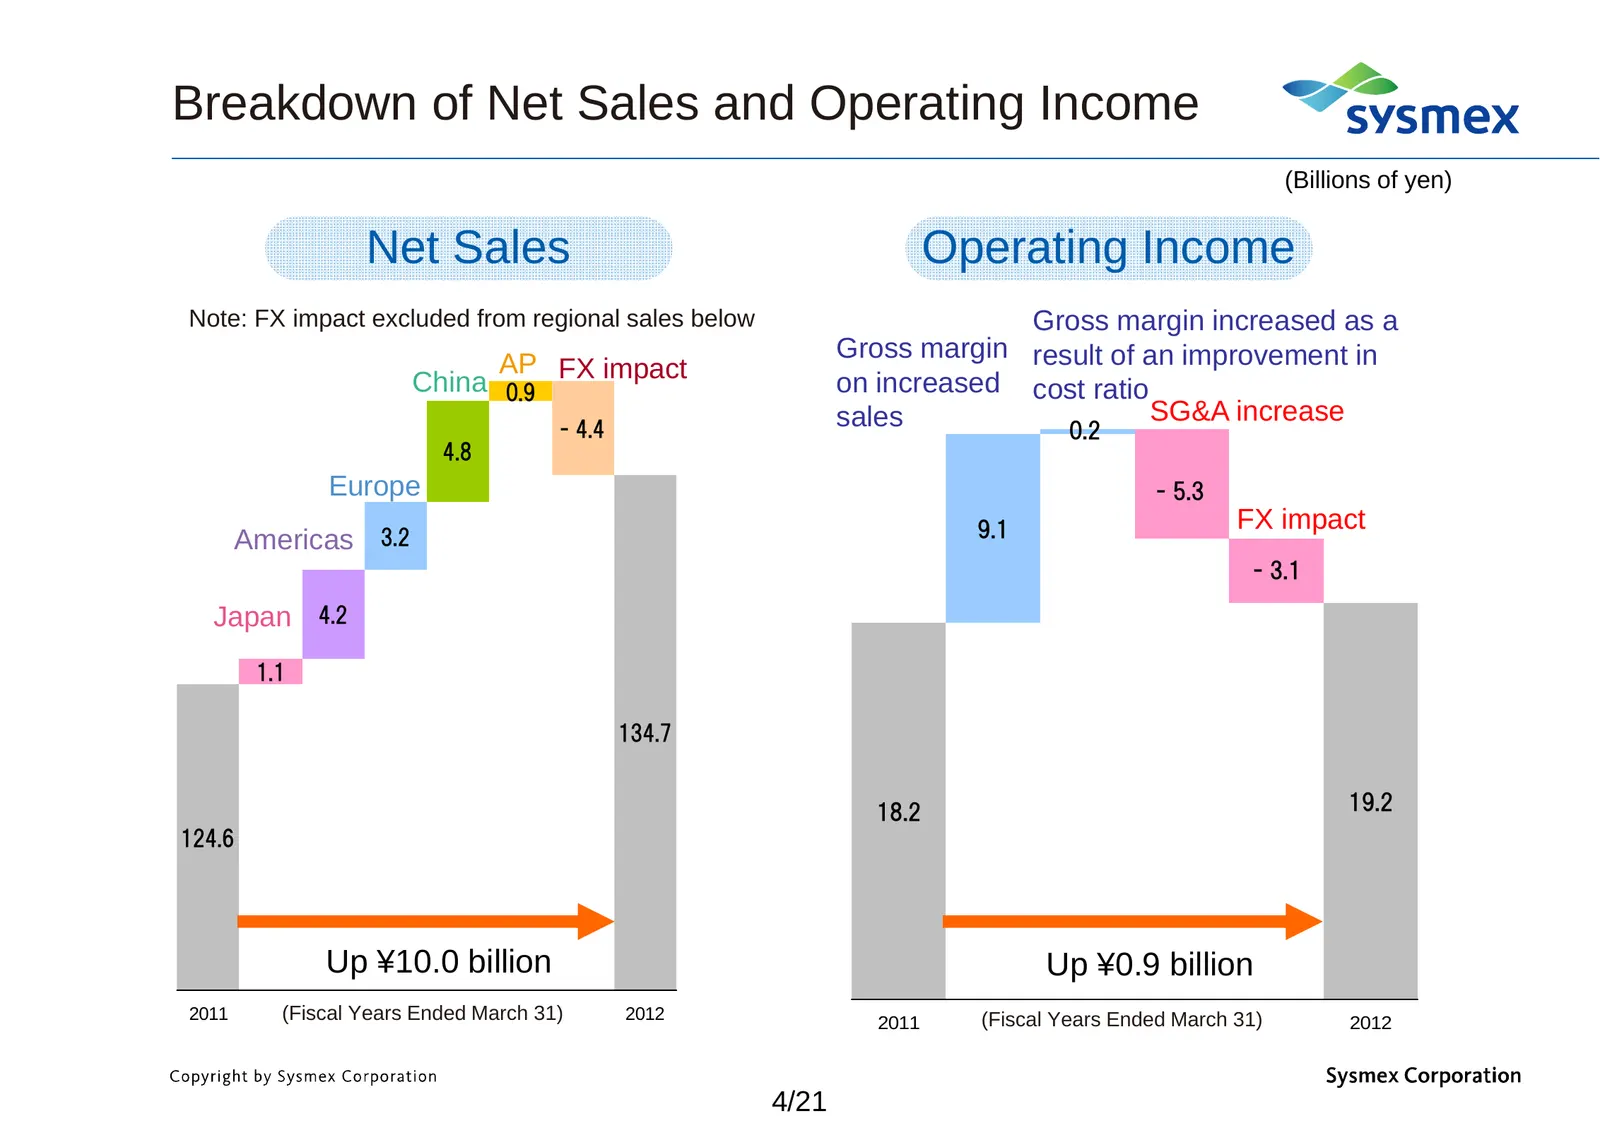
Breakdown of Net Sales and Operating Income (Billions of yen) Net Sales Operating Income Note: FX impact excluded from regional sales below Gross margin increased as a Gross margin result of an improvement in AP China 0.9 FX impact on increased cost ratio sales sa es SG&A increase - 4.4 44 02 0.2 4.
Slide 6: Breakdown of Assets and Liabilities/Equity
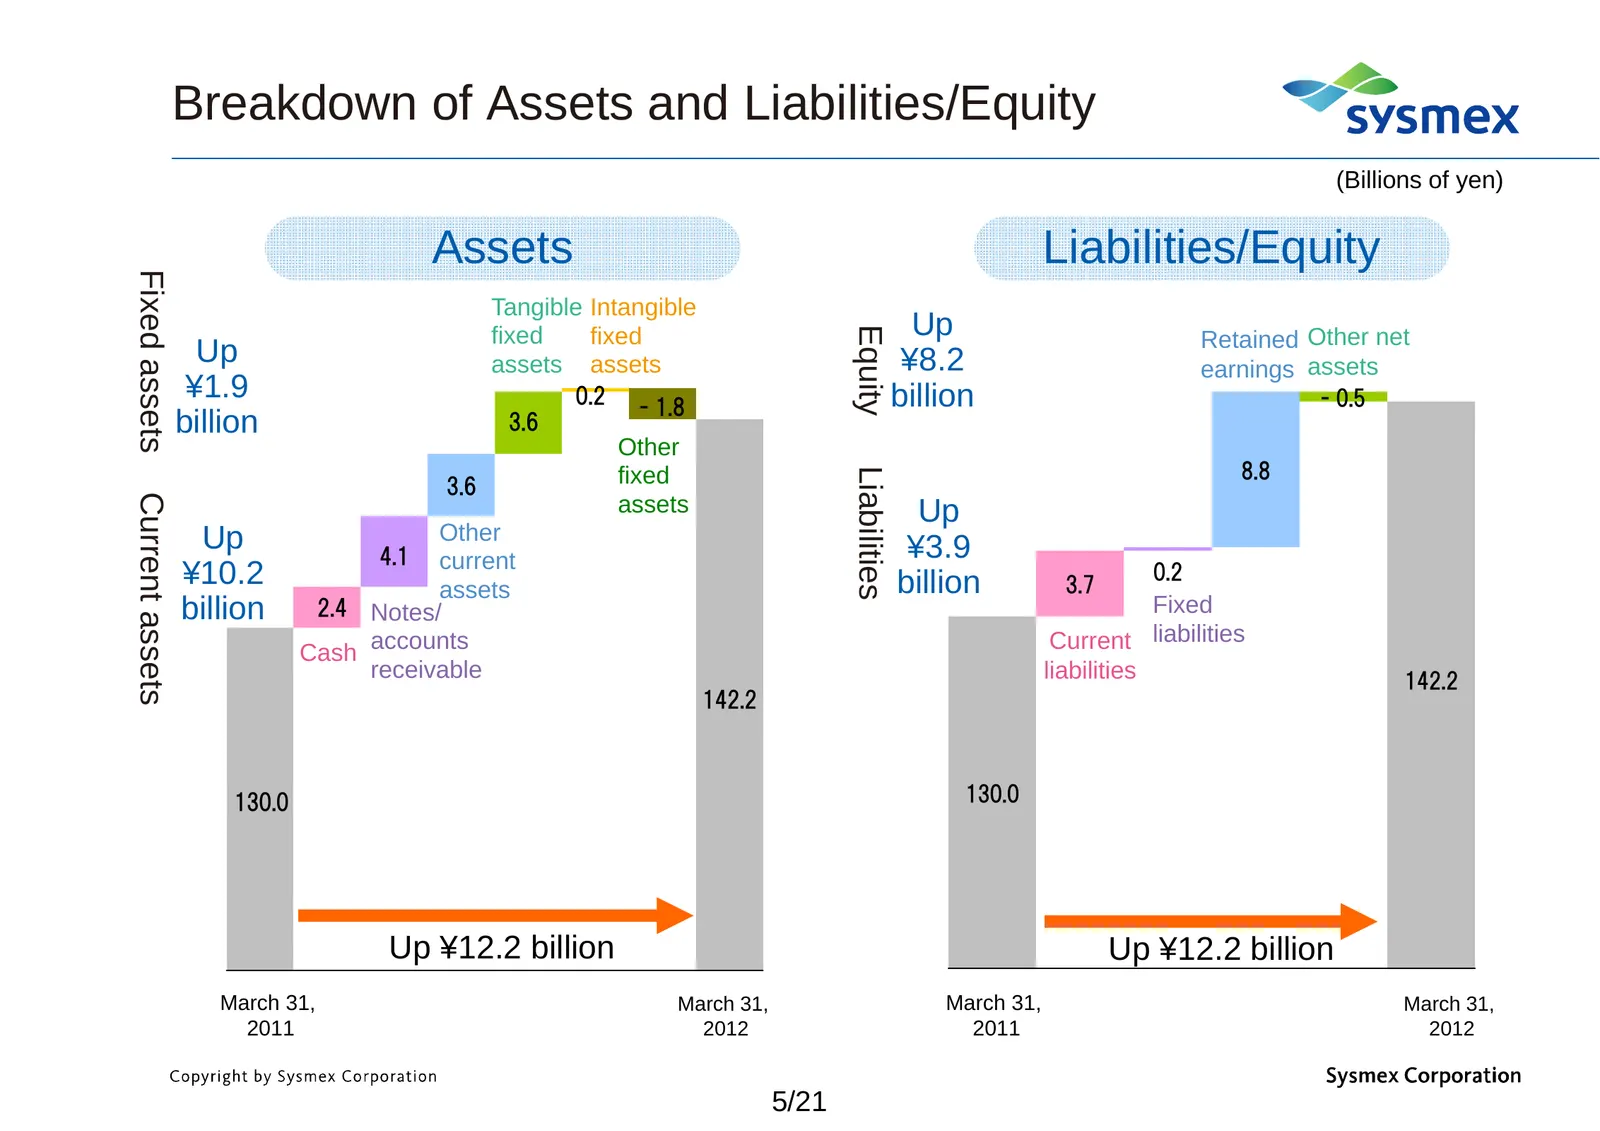
Breakdown of Assets and Liabilities/Equity (Billions of yen) Assets Liabilities/Equity Fixed assets Tangible Intangible Up Equity fixed fixed Retained Other net Up assets assets ¥8.2 earnings assets ¥1.9 0.2 - 1.8 billion - 0.5 billion 36 3.6 Other 8.8 Liabilities 3.6 fixed Curre assets Up Up Other
Slide 7: Consolidated Cash Flows
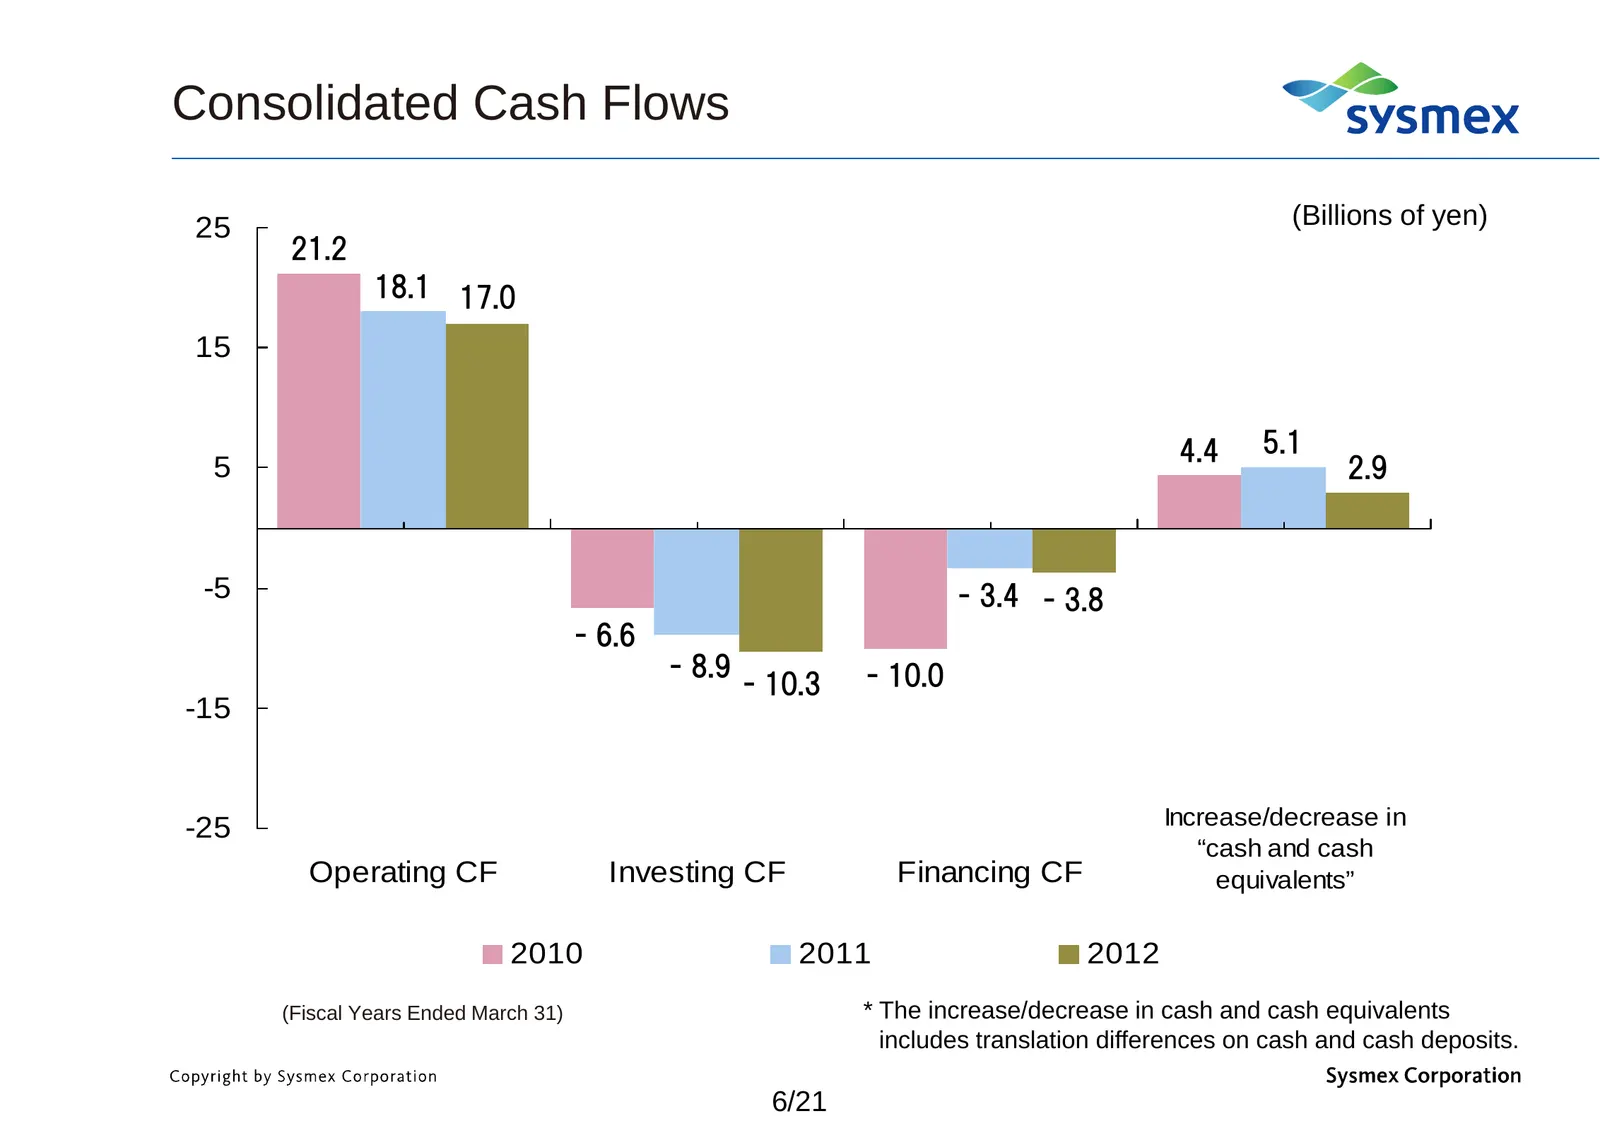
Consolidated Cash Flows 25 (Billions of yen) 21.2 18 1 17.0 18.1 17 0 15 4.4 5.1 5 2.9 -5 - 3.4 - 3.8 - 6.6 - 8.9 - 10.0 - 10.3 -15 15 -25 Increase/decrease in “ “cash h andd cashh Operating CF Investing CF Financing CF equivalents” 2010 2011 2012 (Fiscal Years Ended March 31) * The increase/decreas
Slide 8: Topics (1) (Fiscal Year Ended March 31, 2012)
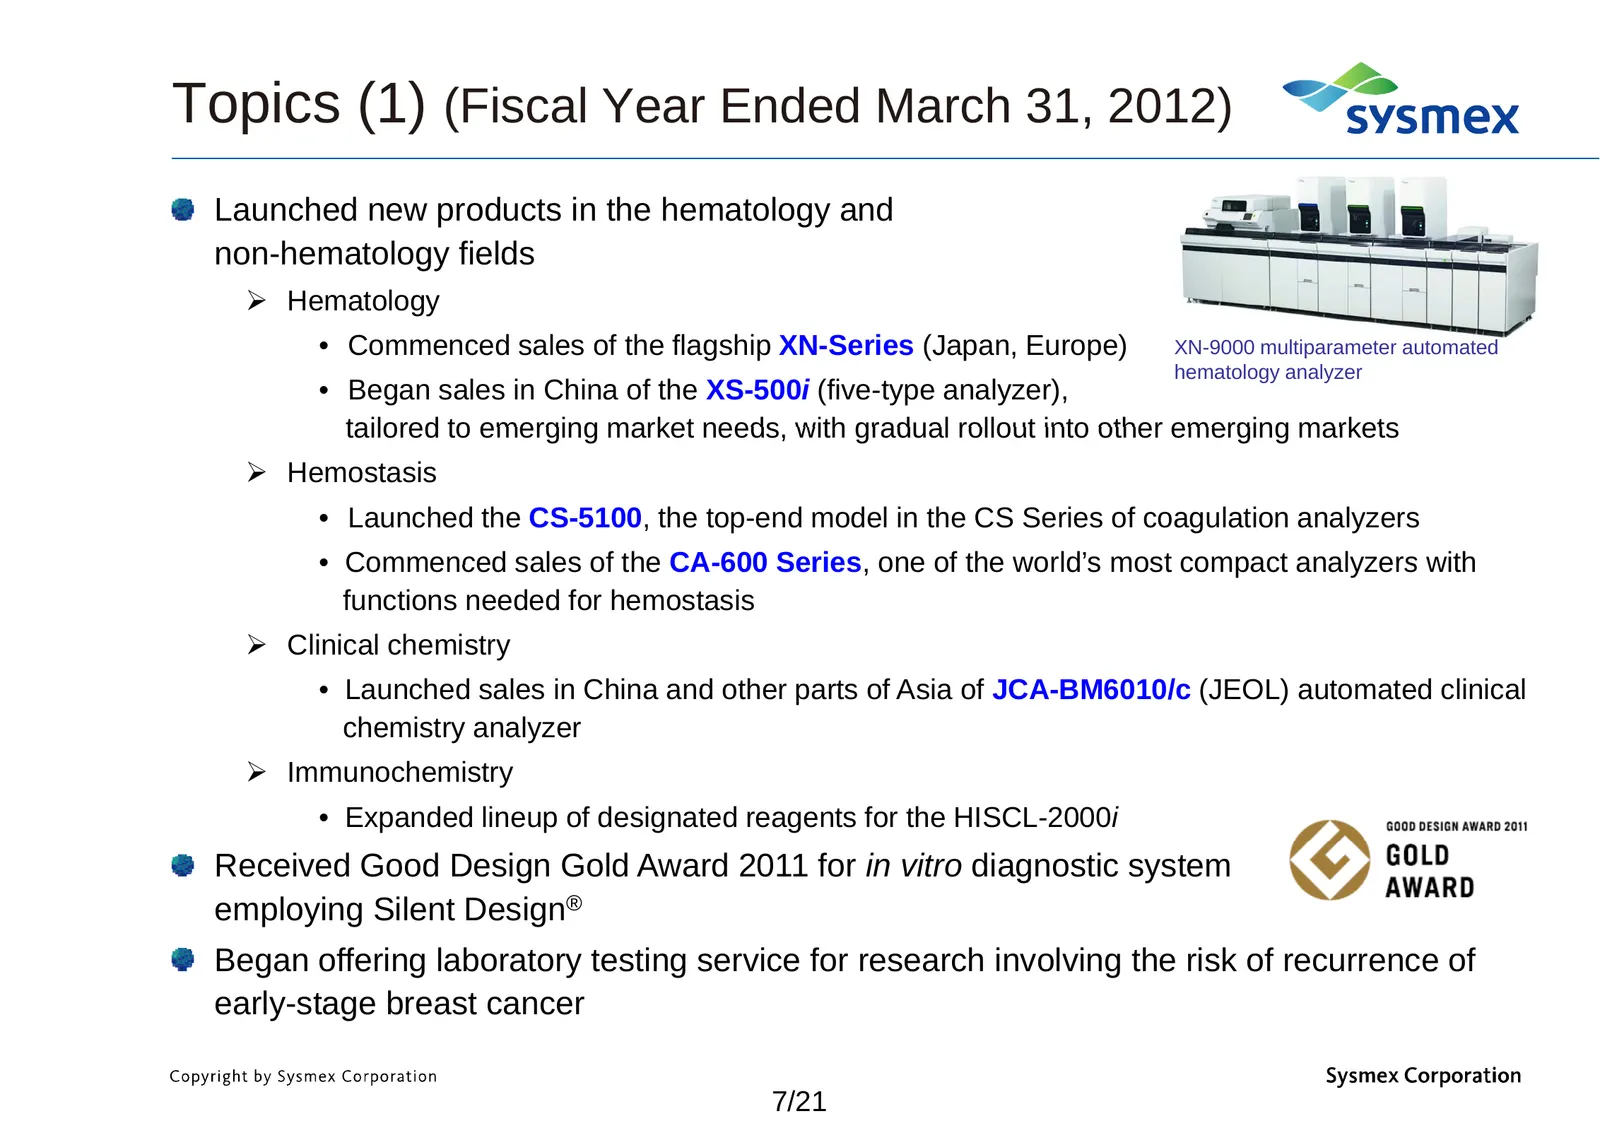
Topics (1) (Fiscal Year Ended March 31, 2012) Launched new products in the hematology and non-hematology fields Hematology • Commenced sales of the flagship XN-Series (Japan, Europe) XN-9000 multiparameter automated hematology analyzer • Began sales in China of the XS-500i (five-type analyzer), ta
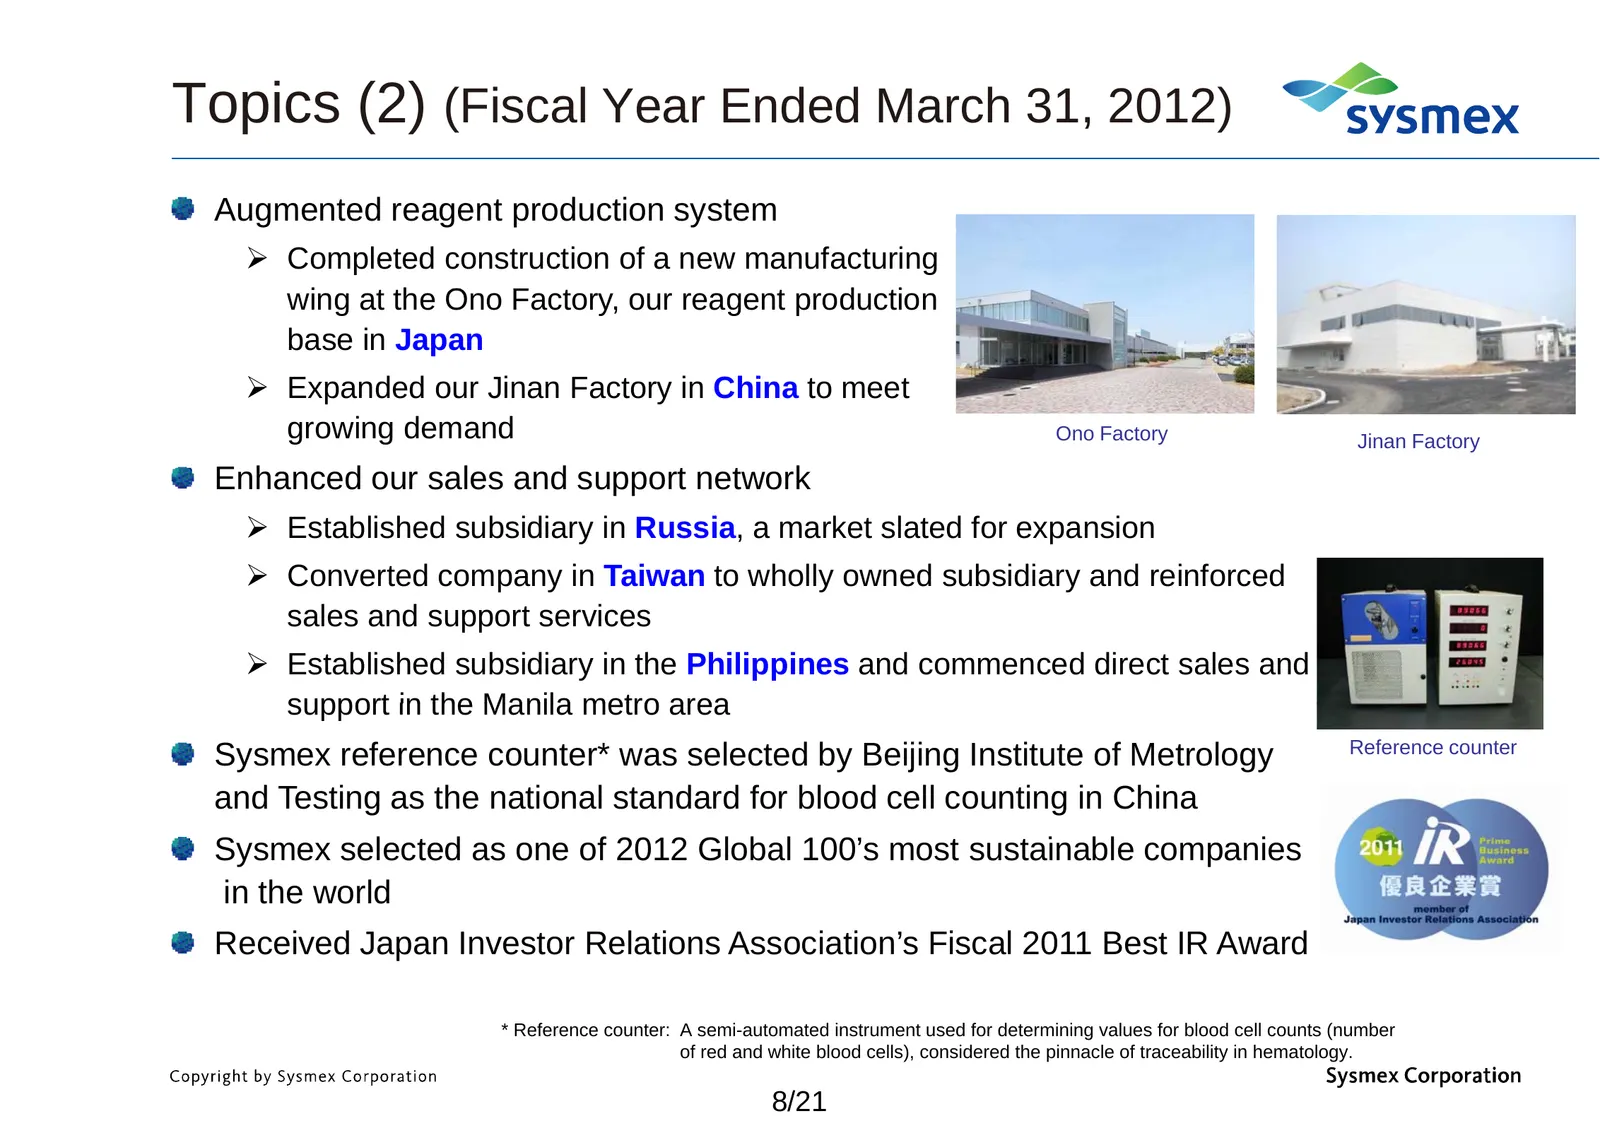
Slide 9: Topics (2) (Fiscal Year Ended March 31, 2012)
Topics (2) (Fiscal Year Ended March 31, 2012) Augmented reagent production system Completed construction of a new manufacturing wing i att th the O Ono Factory, F t our reagentt production d ti base in Japan Expanded our Jinan Factory in China to meet growing demand O Factory Ono F t Jinan Facto
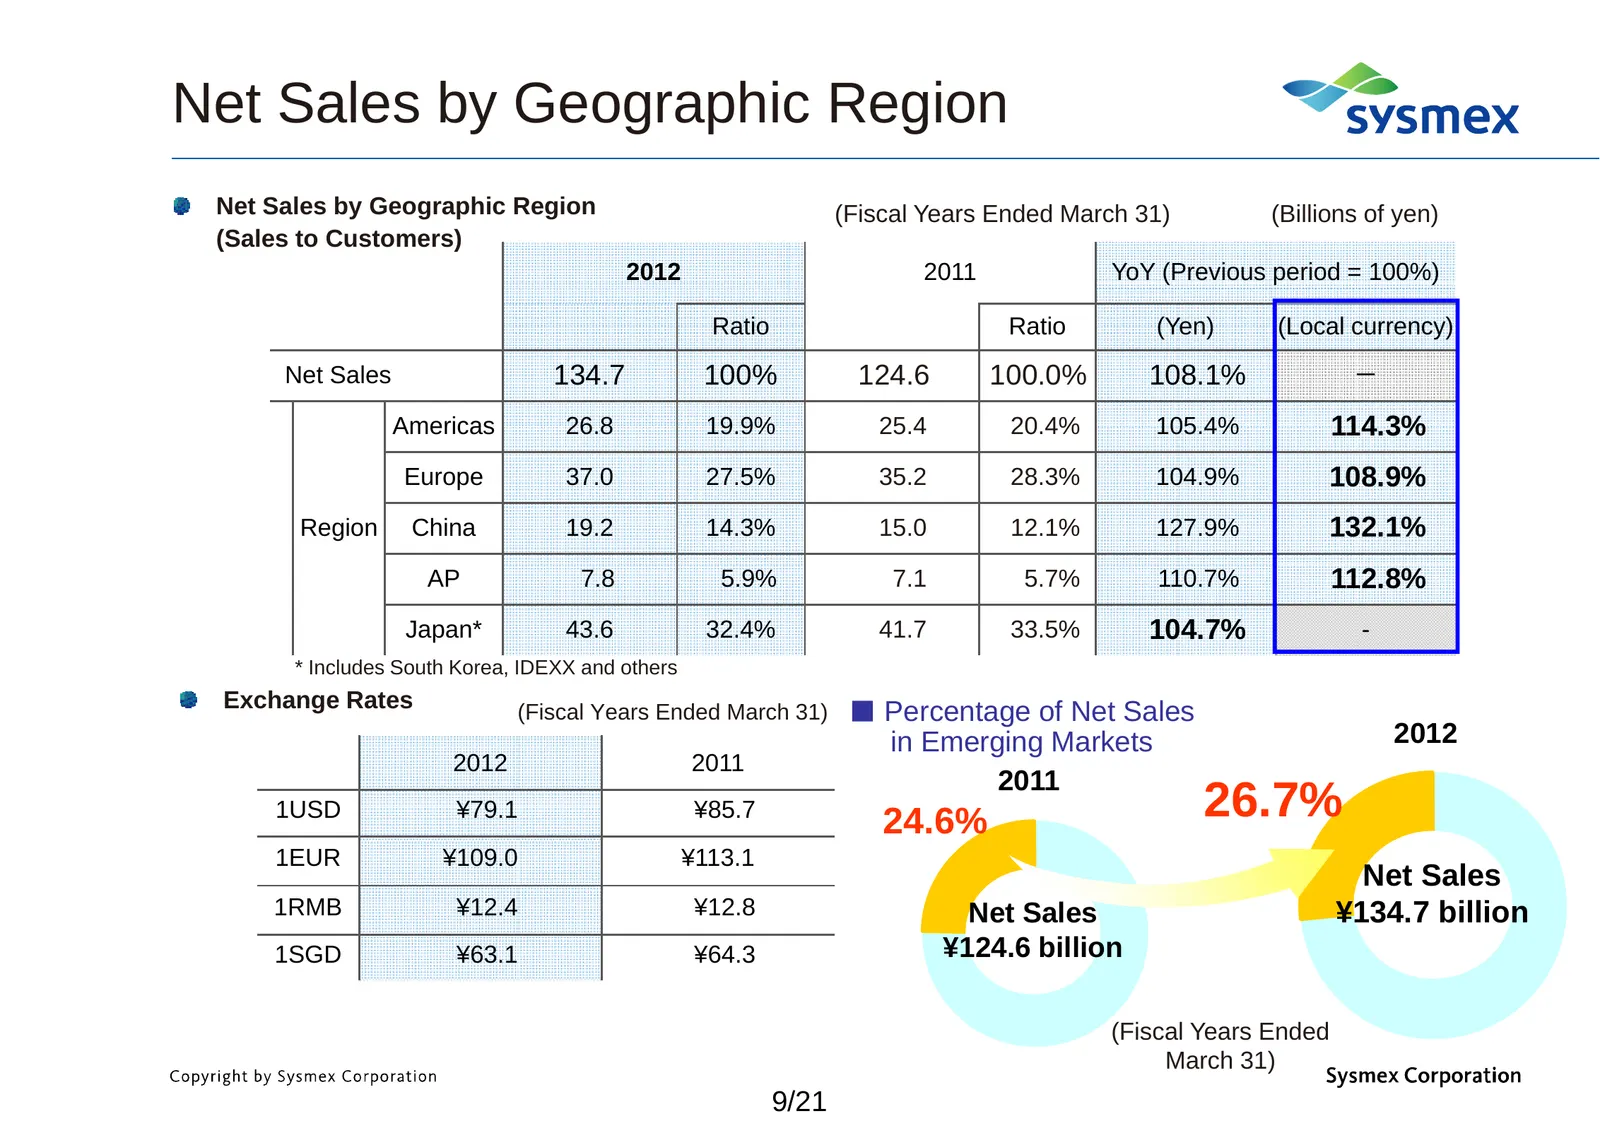
Slide 10: Net Sales by Geographic Region
Net Sales by Geographic Region Net Sales by Geographic Region (Fiscal Years Ended March 31) (Billions of yen) (Sales to Customers) 2012 2011 YoY (Previous period = 100%) Ratio Ratio (Yen) (Local currency) Net Sales 134.7 100% 124.6 100.0% 108.1% - Americas 26 8 26.8 19 9% 19.9% 25 4 25.4 20 4% 20.4%
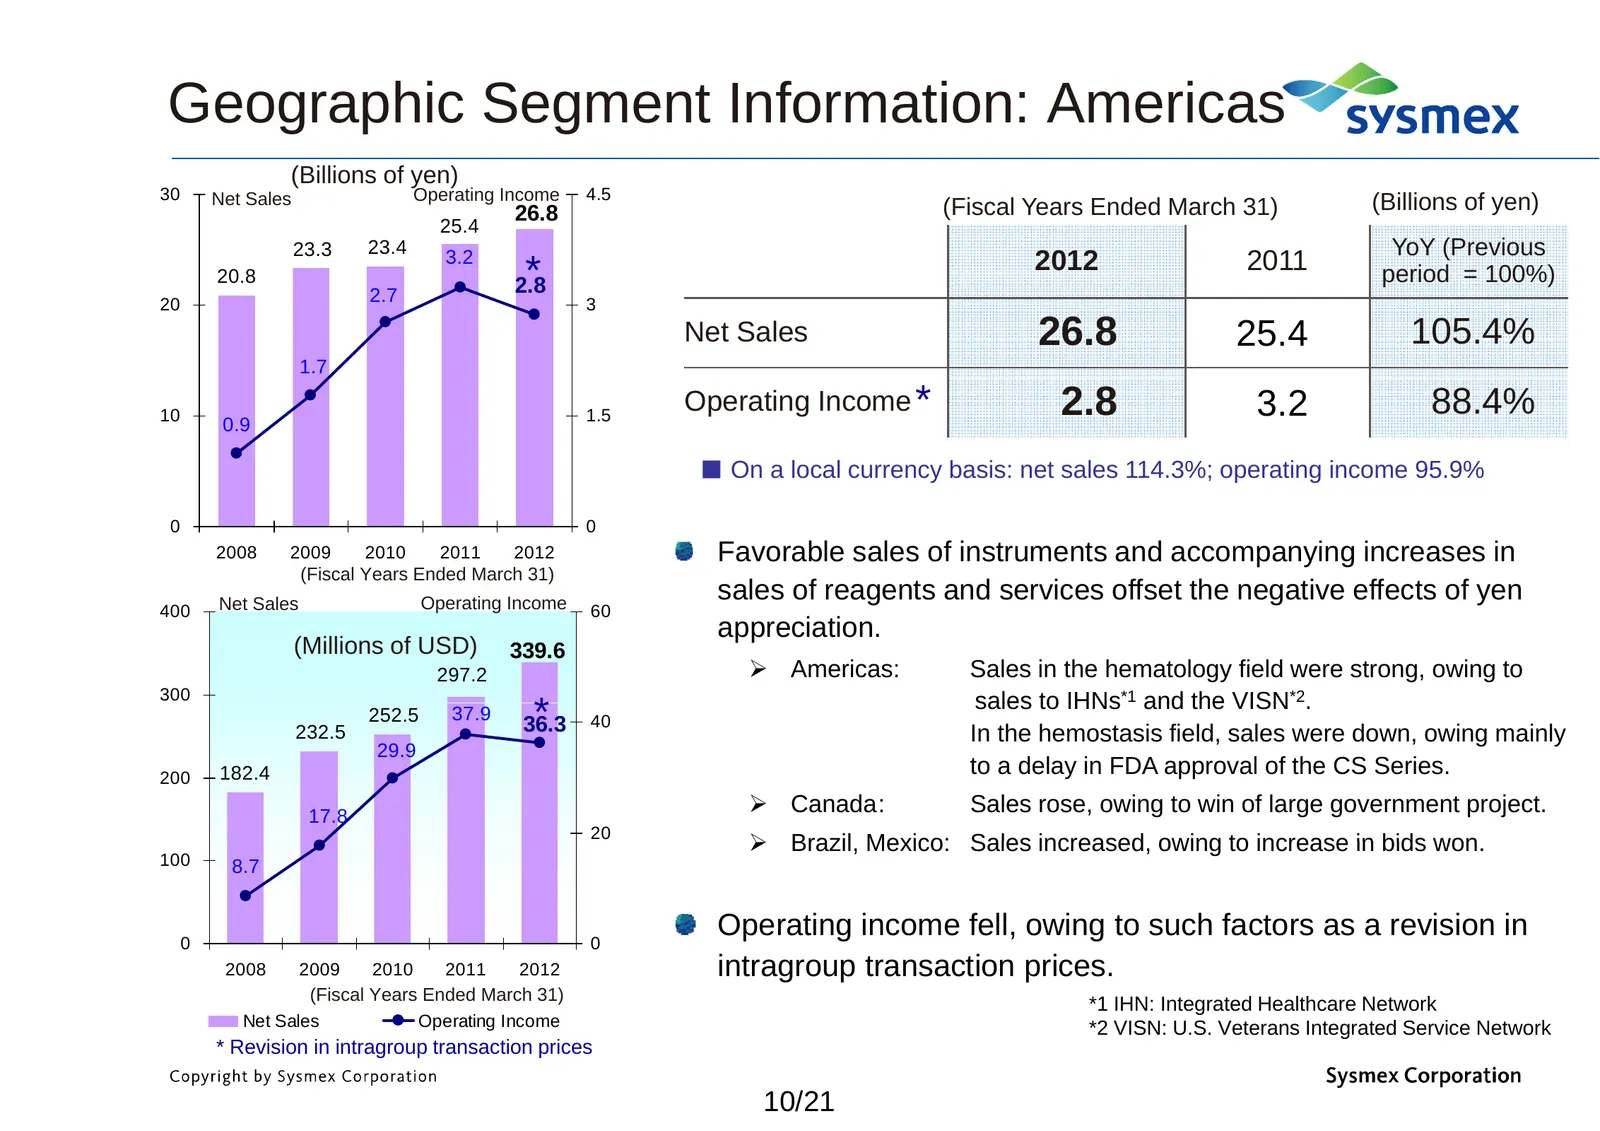
Slide 11: Geographic Segment Information: Americas
Geographic Segment Information: Americas (Billions of yen) 30 Net Sales Operating Income 4.5 26.8 (Fiscal Years Ended March 31) (Billions of yen) 25.4 23.3 23.4 YoY (Previous 20.8 3.2 * 2012 2011 period = 100%) 27 2.7 28 2.8 20 3 Net Sales 26.8 25.4 105.4% 1.7 10 1.5 Operating Income * 2.8 3.2 88.4%
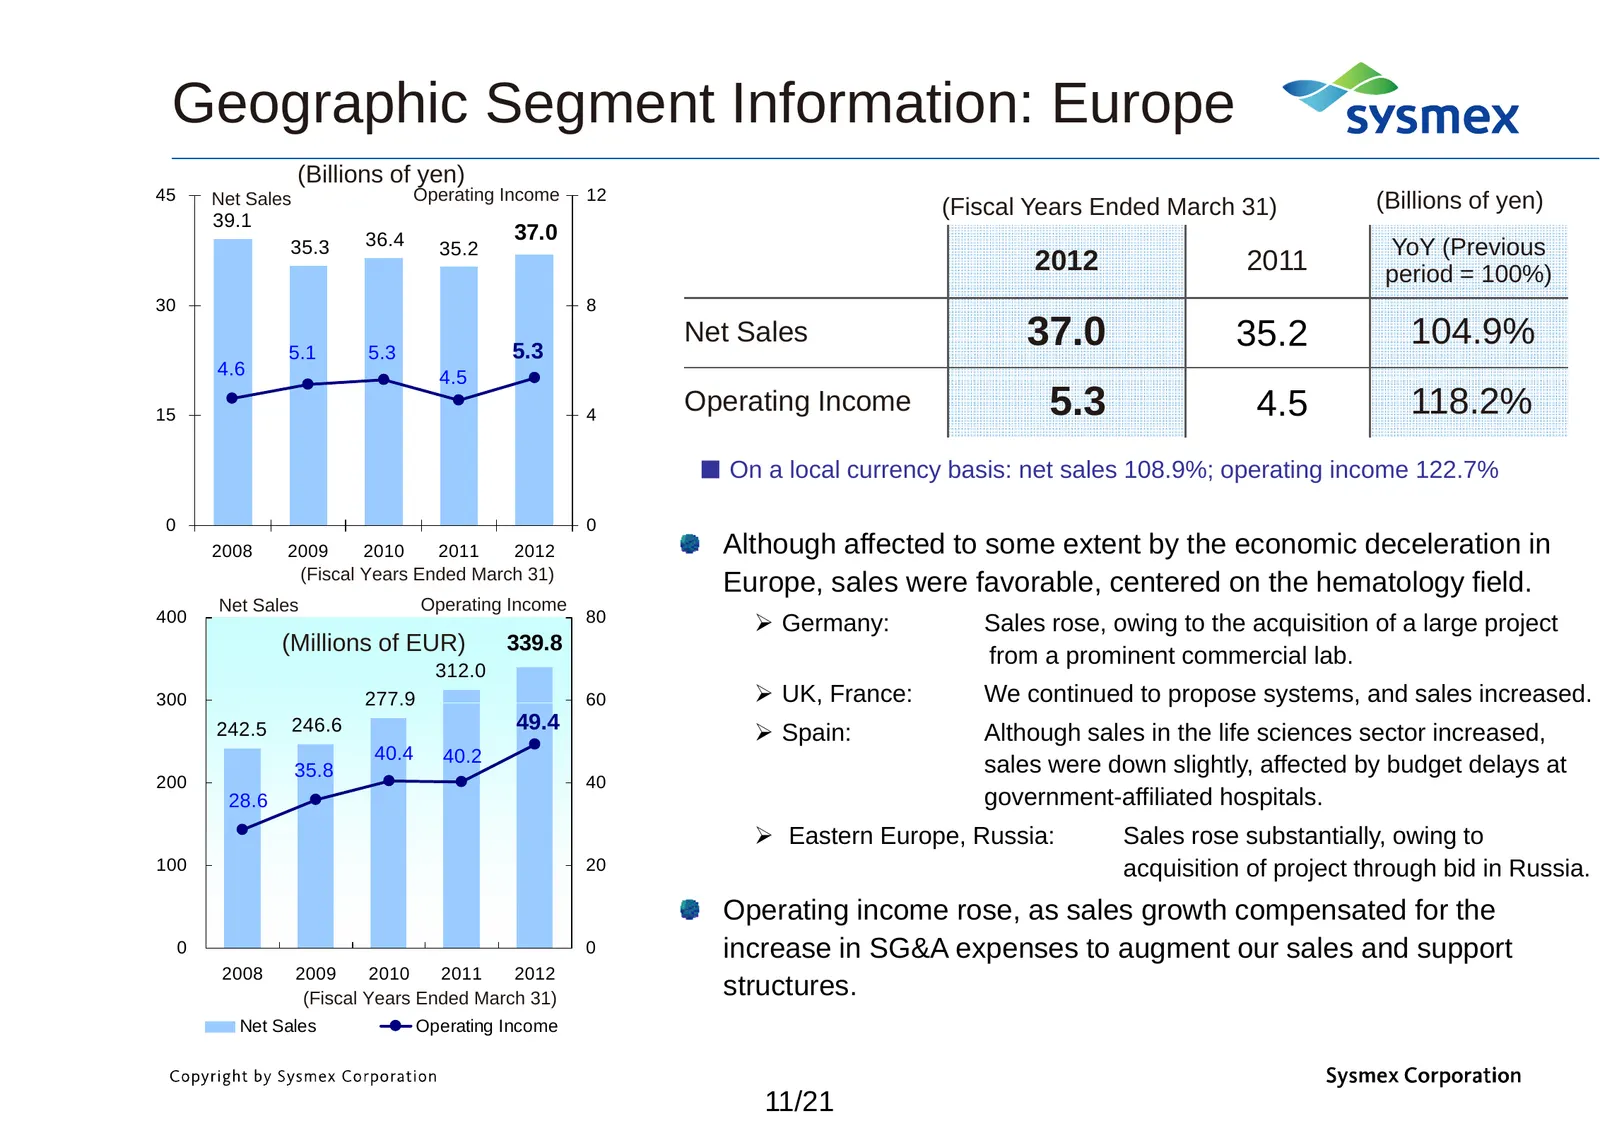
Slide 12: Geographic Segment Information: Europe
Geographic Segment Information: Europe (Billions of yen) 45 Net Sales Operating Income 12 (Billions of yen) (Fiscal Years Ended March 31) 39.1 36.4 37.0 35.3 35.2 YoY (Previous 2012 2011 period = 100%) 30 8 5.1 5.3 5.3 Net Sales 37.0 35.2 104.9% 4.6 4.5 15 4 Operating Income 5.3 4.5 118.2% ■ On a lo
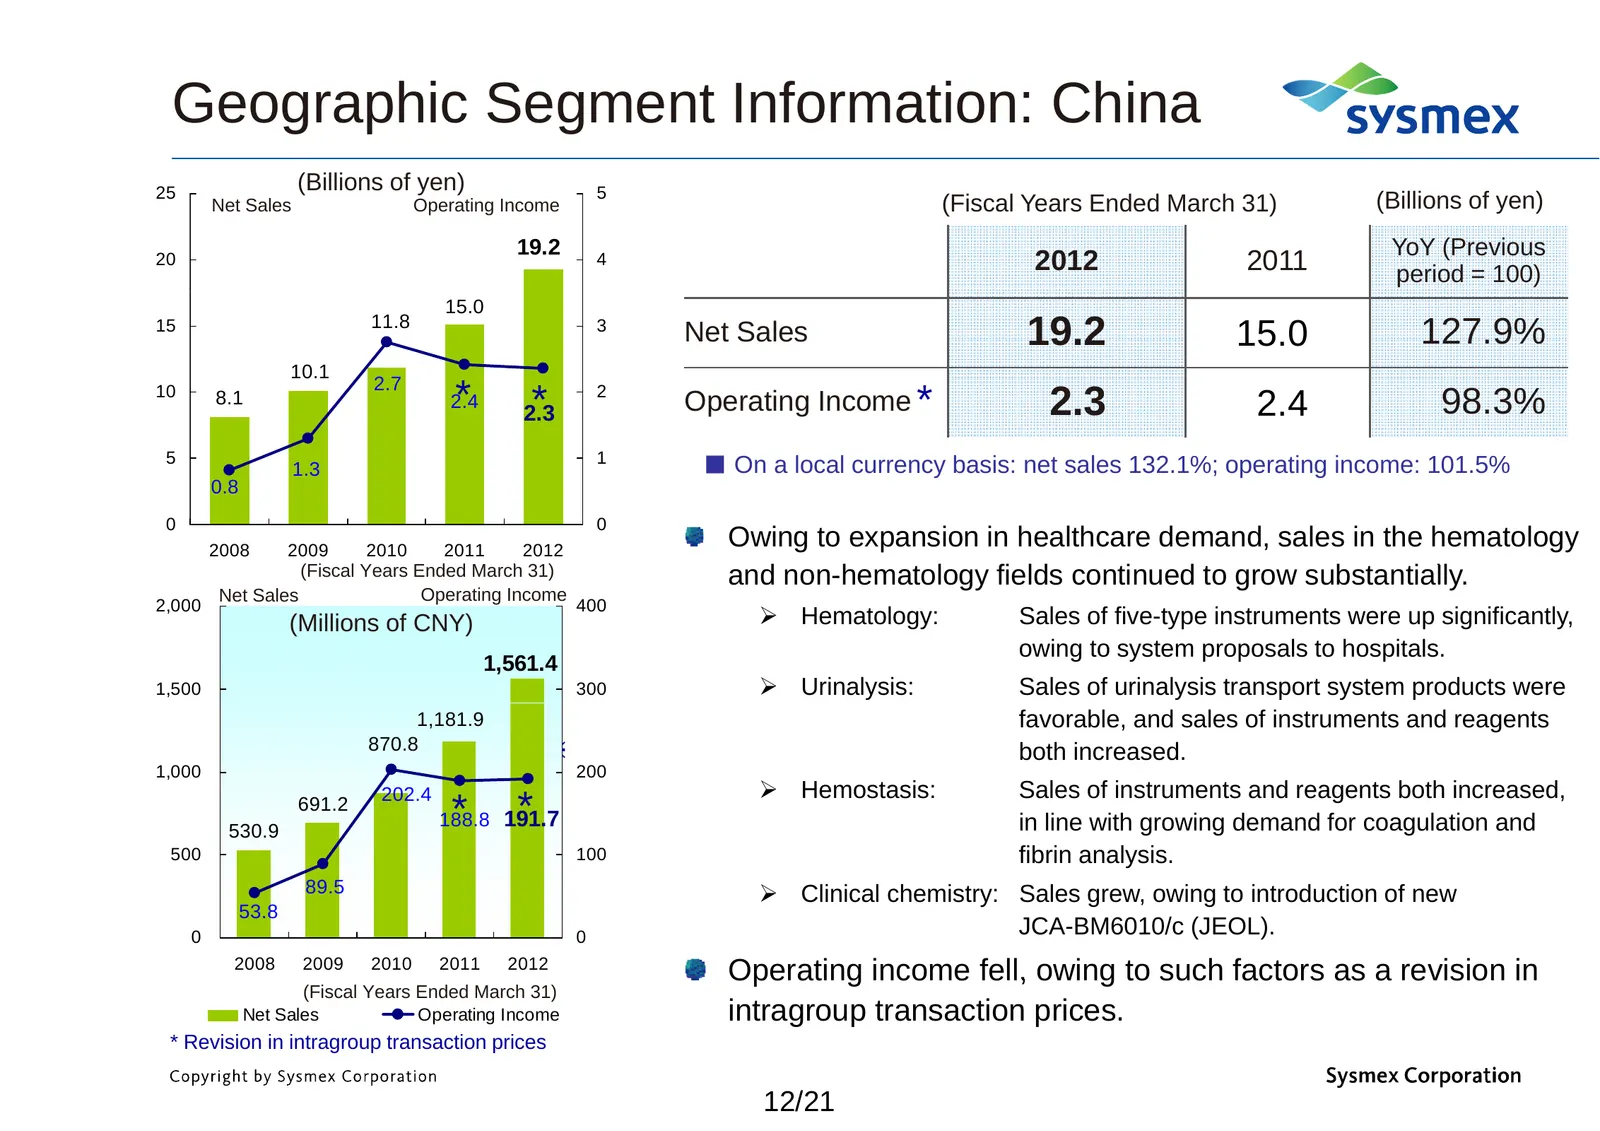
Slide 13: Geographic Segment Information: China
Geographic Segment Information: China 25 (Billions of yen) 5 Net Sales Operating Income (Fiscal Years Ended March 31) (Billions of yen) 19.2 YoY (Previous 20 4 2012 2011 period = 100) 15.0 11.8 15 3 Net Sales 19.2 15.0 127.9% 10.1 2.7 10 8.1 * 2.4 * 2.3 2 Operating Income * 2.3 2.4 98.3% 5 1 1.3 ■ O
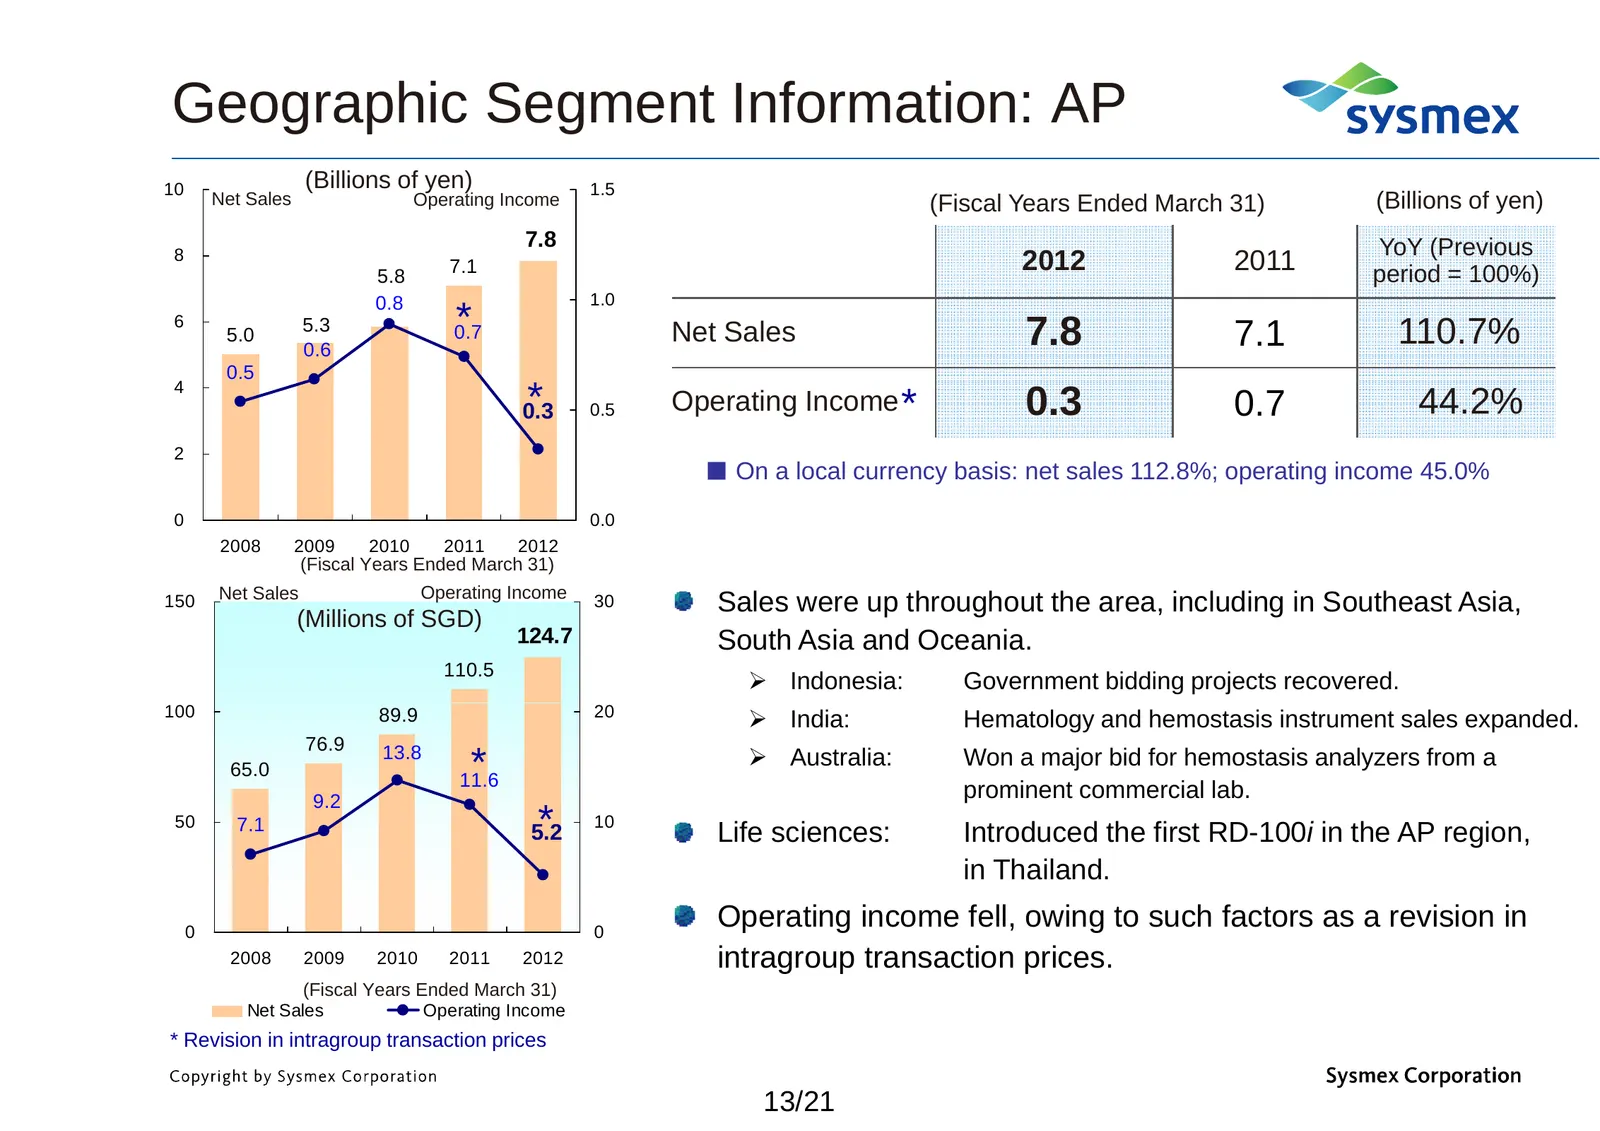
Slide 14: Geographic Segment Information: AP
Geographic Segment Information: AP 10 (Billions of yen) 1.5 Net Sales Operating Income (Fiscal Years Ended March 31) (Billions of yen) 7.8 YoY (Previous 8 2012 2011 5.8 7.1 period = 100%) 0.8 1.0 6 5.0 5.3 * 0.7 Net Sales 7.8 7.1 110.7% 0.6 0.5 4 * 0.3 0.5 Operating Income * 0.3 0.7 44.2% 2 ■ On a l
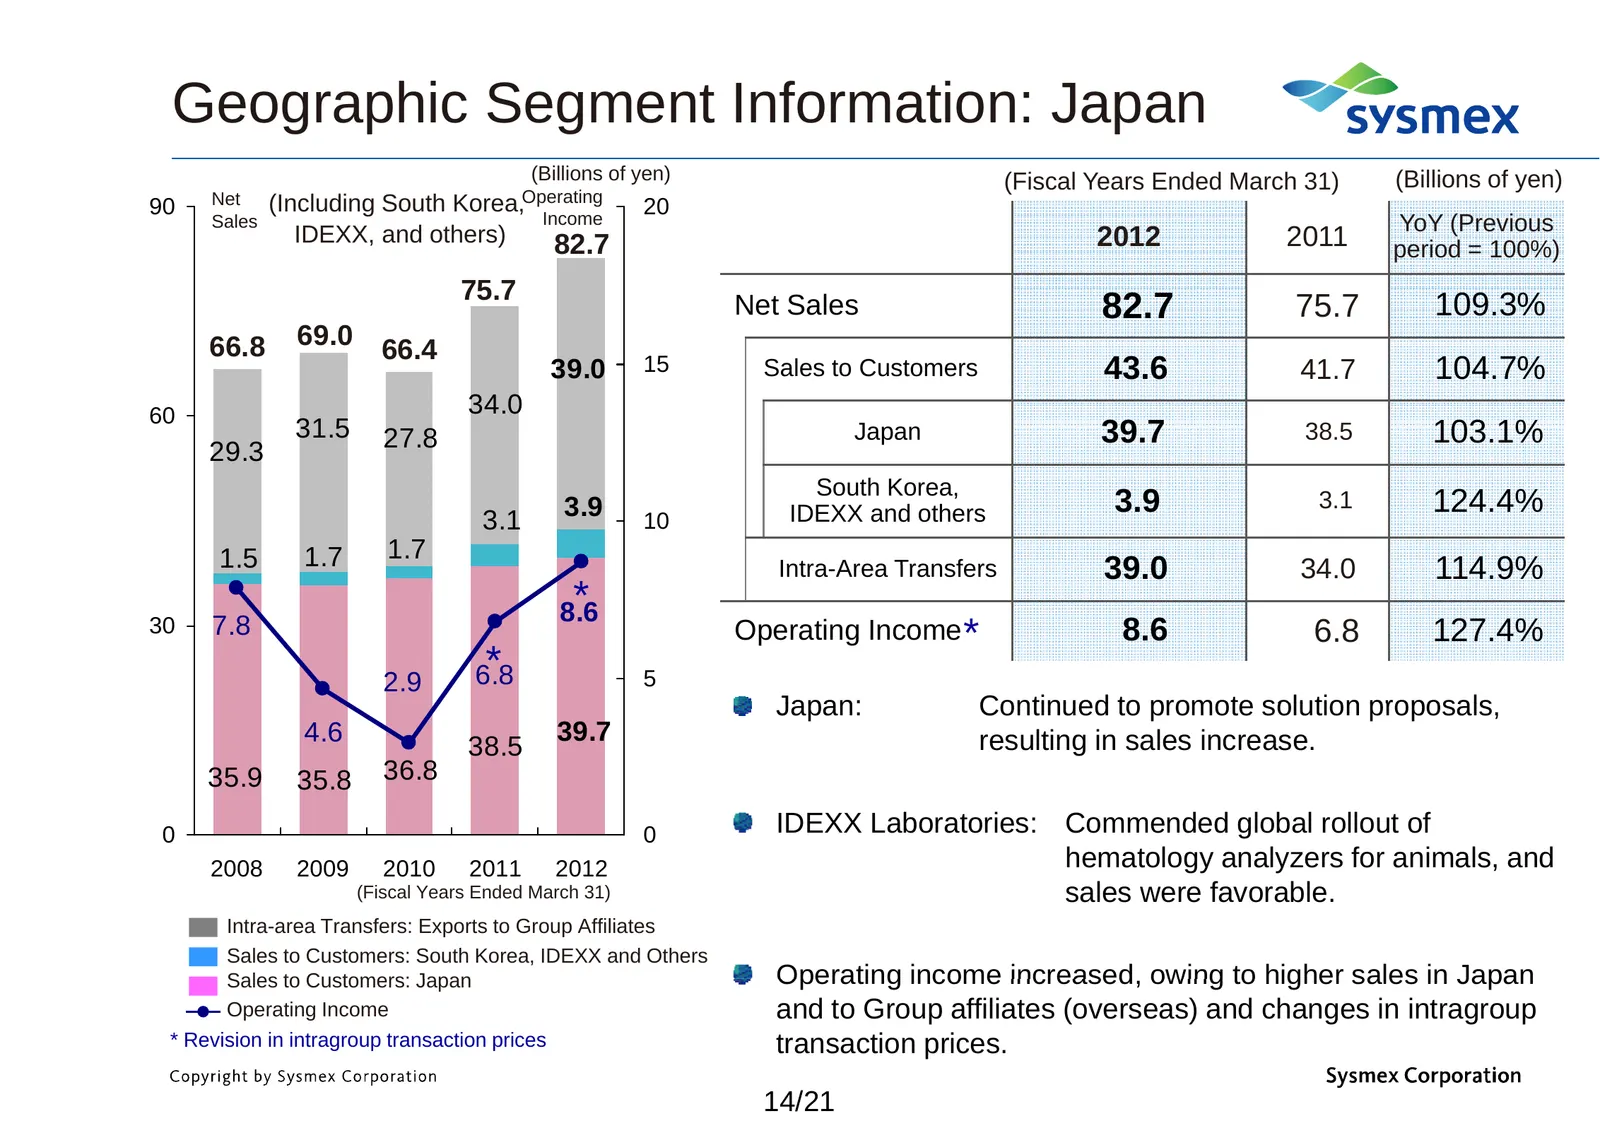
Slide 15: Geographic Segment Information: Japan
Geographic Segment Information: Japan (Billions of yen) (Fiscal Years Ended March 31) (Billions of yen) 90 Net (Including South Korea,Operating 20 Sales Income YoY (Previous IDEXX, and others) 82.7 2012 2011 period = 100%) 75 7 75.7 Net Sales 82.7 75.7 109.3% 66.8 69.0 66.4 39.0 15 Sales to Customer
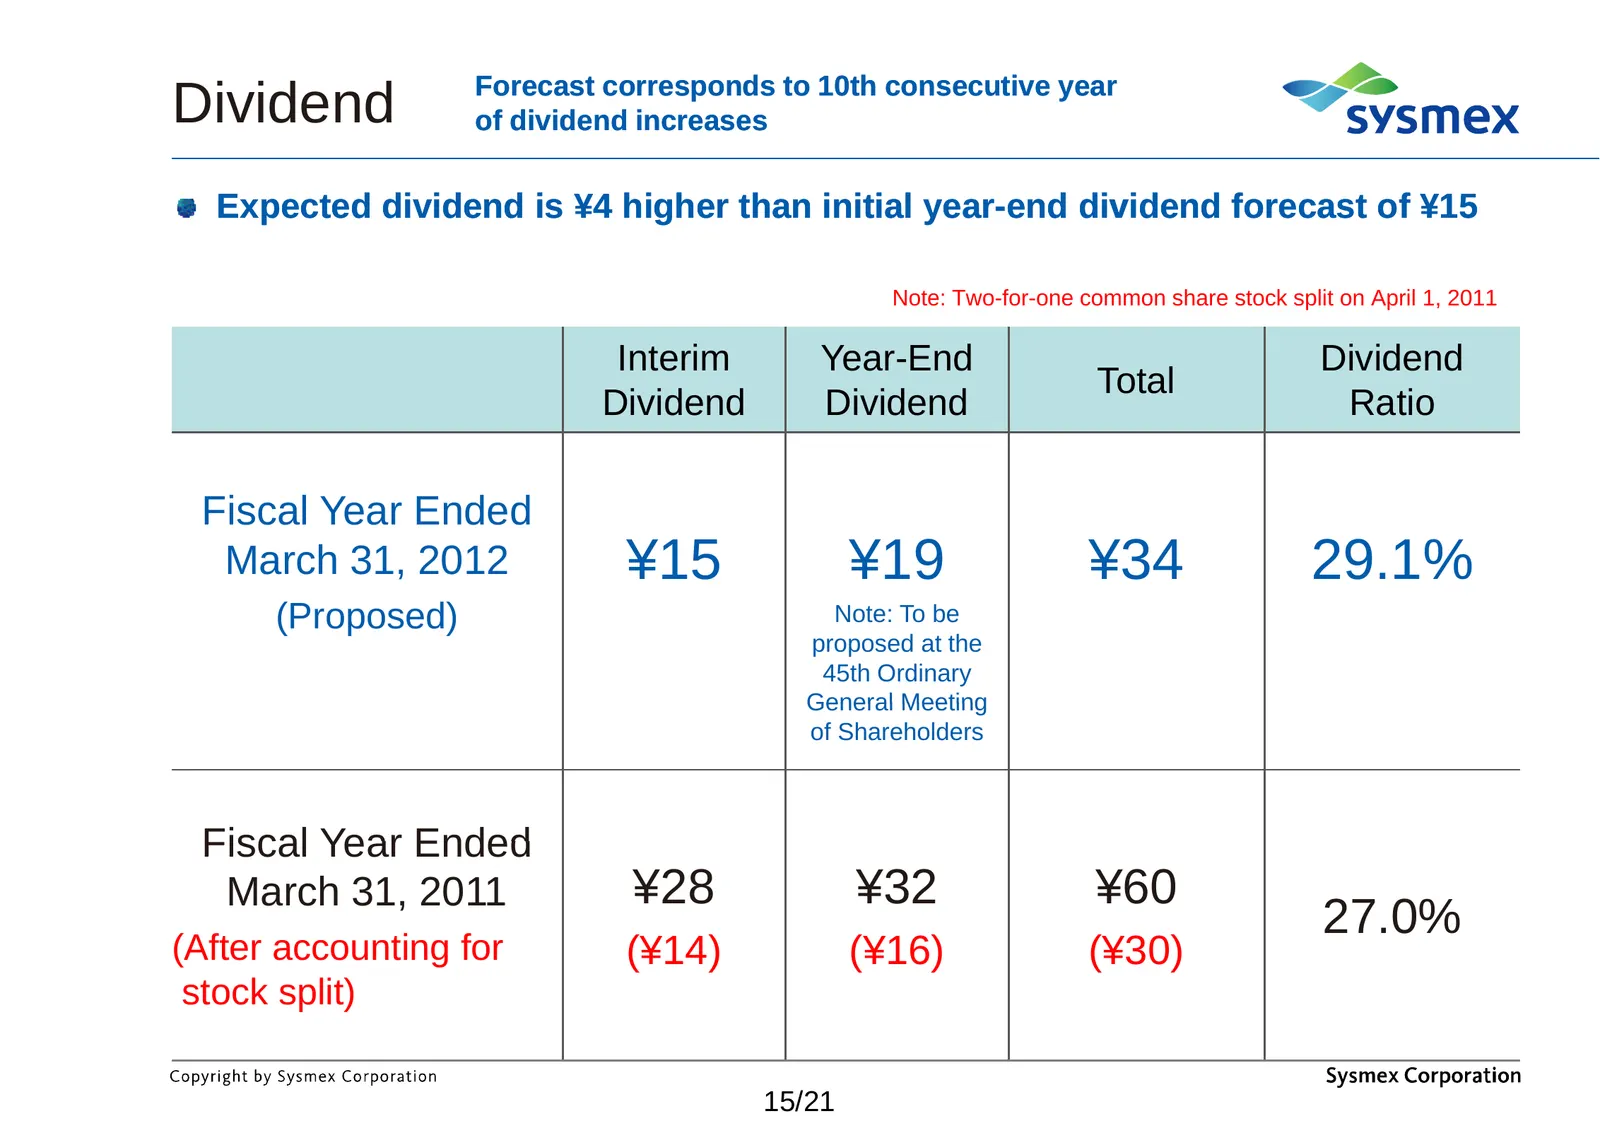
Slide 16: Dividend
Forecast corresponds to 10th consecutive year Dividend of dividend increases Expected dividend is ¥4 higher than initial year year--end dividend forecast of ¥15 Note: Two-for-one common share stock split on April 1, 2011 Interim Year-End Dividend Total Dividend Dividend Ratio Fiscal Year Ended March
Slide 17: Consolidated Earnings Forecast for the Fiscal Year Ending March 31, 2013
Chapter 2 Consolidated Earnings Forecast for the Fiscal Year Ending March 31, 2013
Slide 18: External Environment
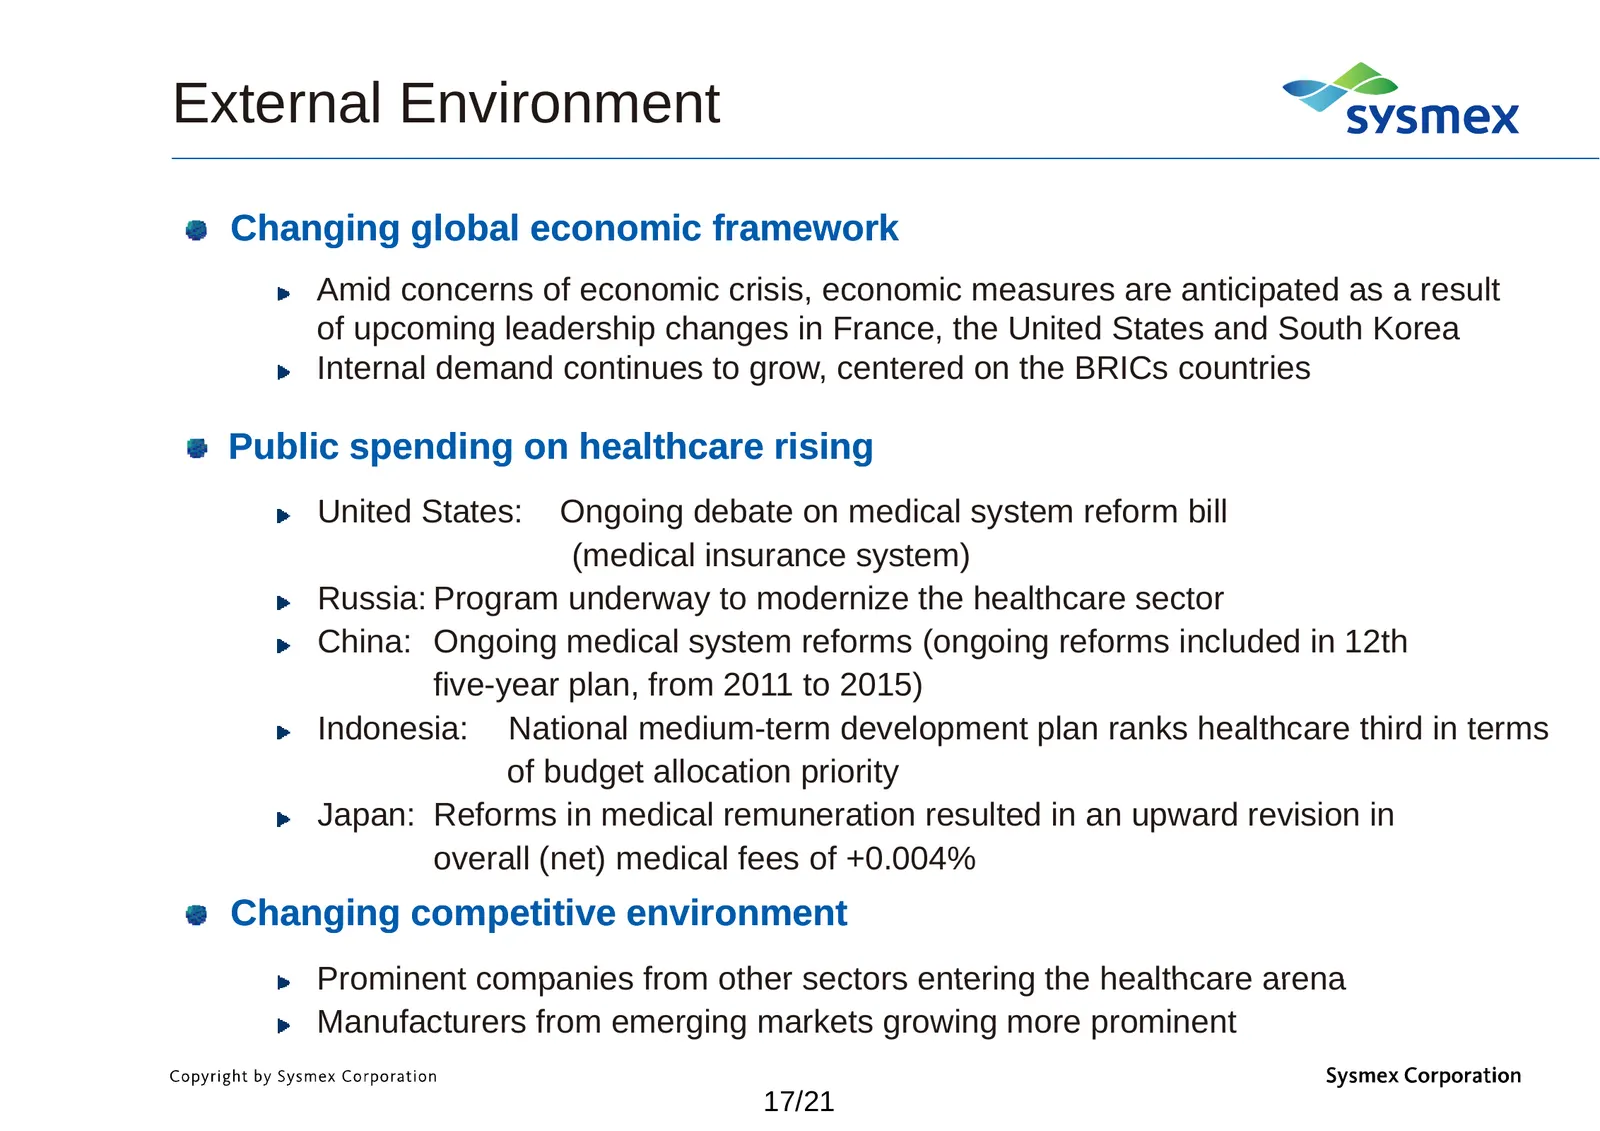
External Environment Changing global economic framework Amid concerns of economic crisis crisis, economic measures are anticipated as a result of upcoming leadership changes in France, the United States and South Korea Internal demand continues to grow, centered on the BRICs countries Public spendin
Slide 19: Strengthening Non-Hematology
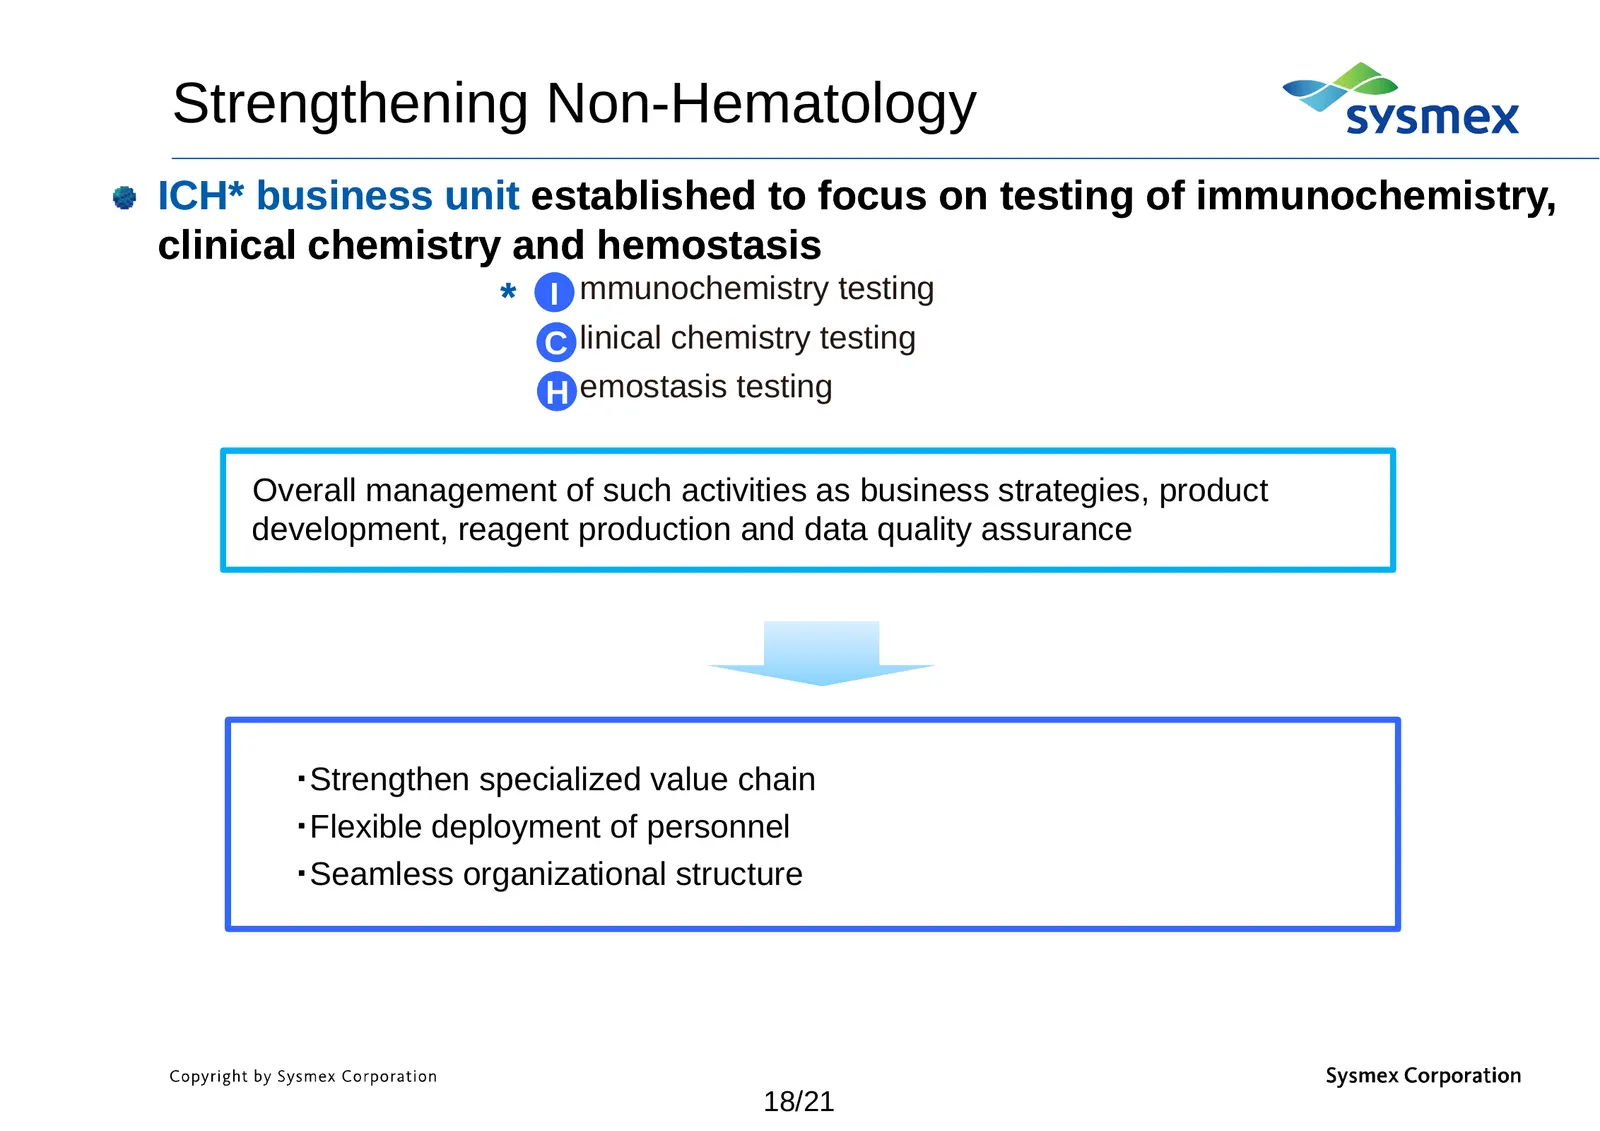
Strengthening Non-Hematology ICH* business unit established to focus on testing of immunochemistry, clinical chemistry and hemostasis * I mmunochemistry testing C linical chemistry testing H emostasis testing Overall management of such activities as business strategies, product development, reagent
Slide 20: Consolidated Earnings Forecast
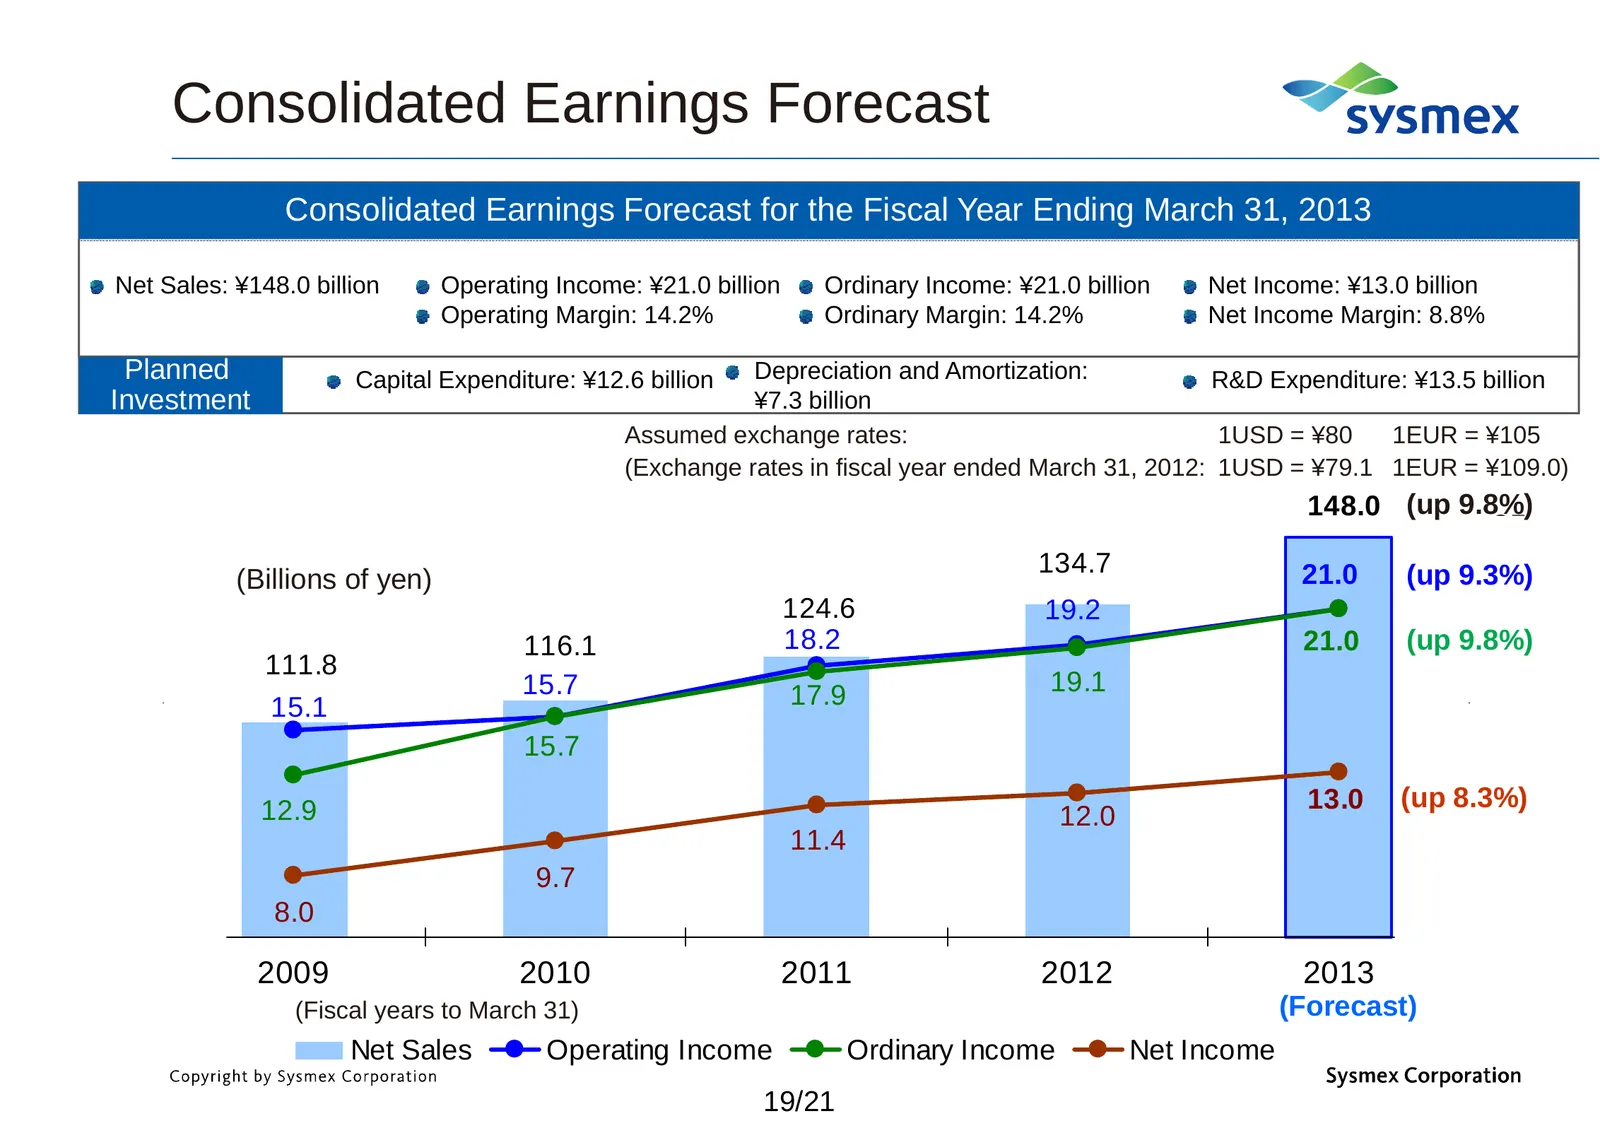
Consolidated Earnings Forecast Consolidated Earnings Forecast for the Fiscal Year Ending March 31, 2013 Net Sales: ¥148.0 ¥148 0 billion Operating Income: ¥21.0 ¥21 0 billion Ordinary Income: ¥21.0 ¥21 0 billion Net Income: ¥13.0 ¥13 0 billion Operating Margin: 14.2% Ordinary Margin: 14.2% Net Incom
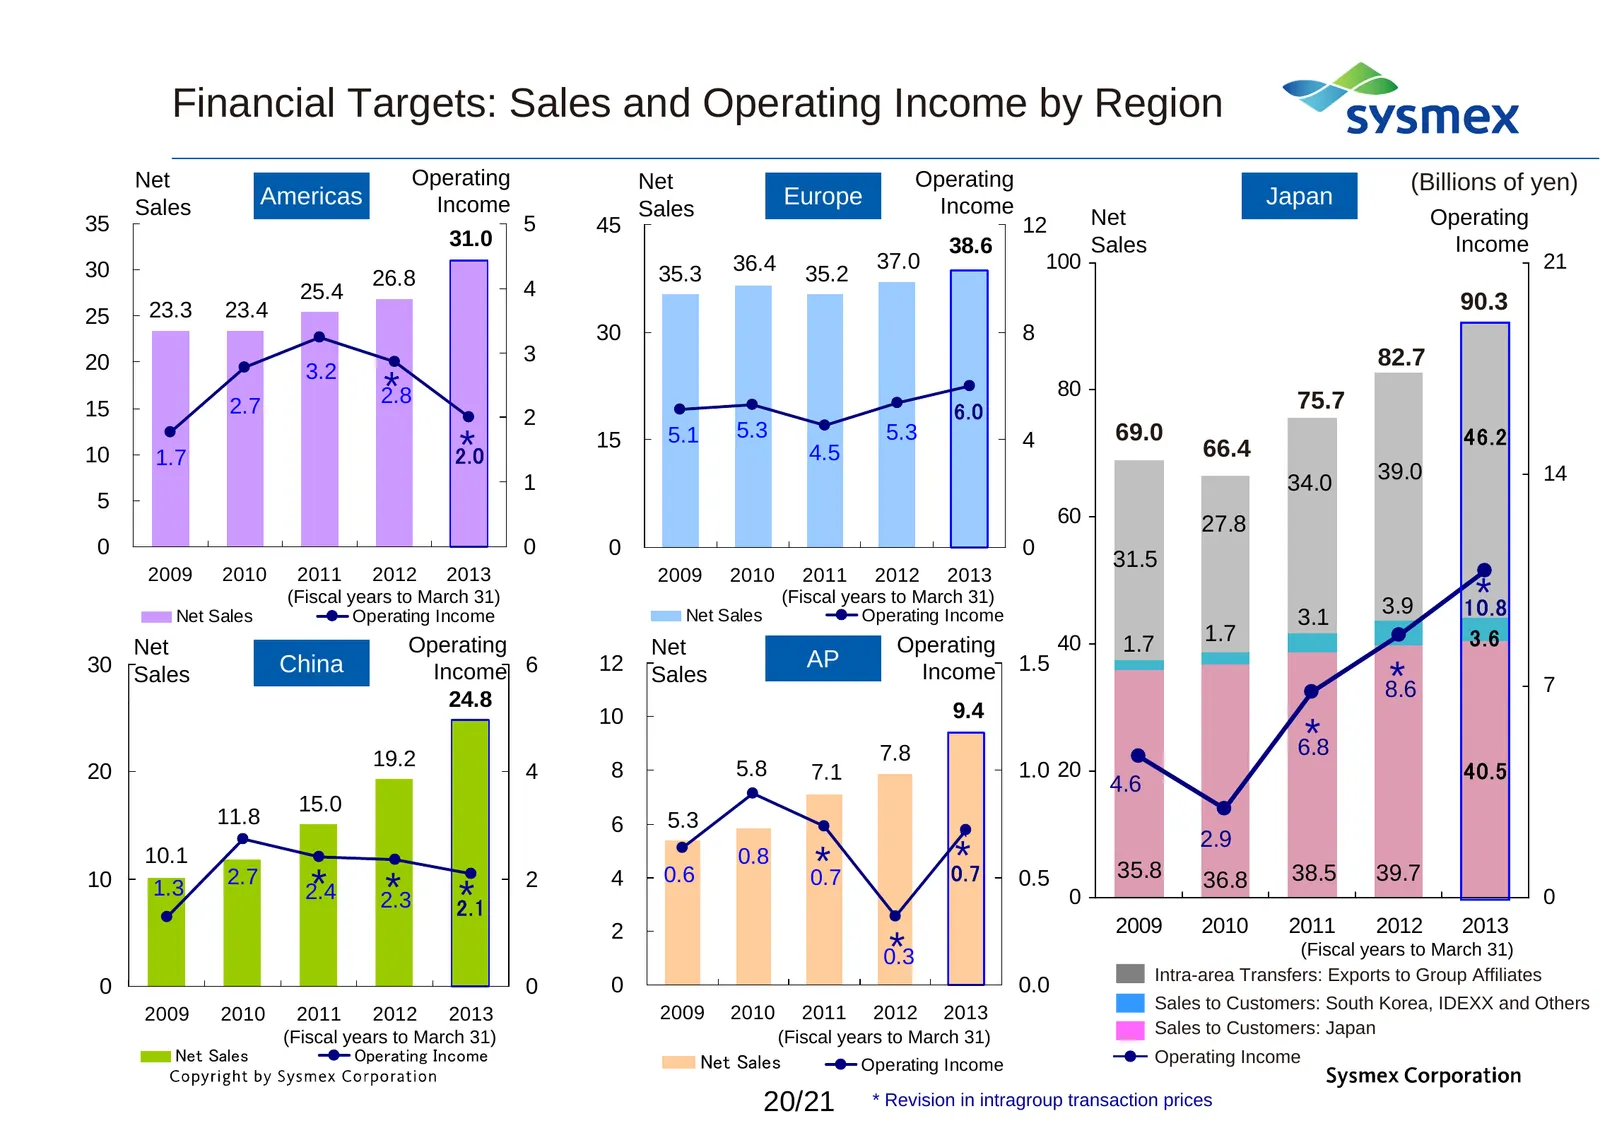
Slide 21: Financial Targets: Sales and Operating Income by Region
Financial Targets: Sales and Operating Income by Region Net Operating Net Operating (Billions of yen) Sales Americas Income Sales Europe Income Japan 35 5 45 12 Net Operating 31.0 38.6 Sales Income 30 36.4 37.0 100 21 26.8 35.3 35.2 25 4 25.4 4 23.3 23.4 90.3 25 30 8 20 3 82.7 3.2 15 2.7 * 2.8 6.0 8
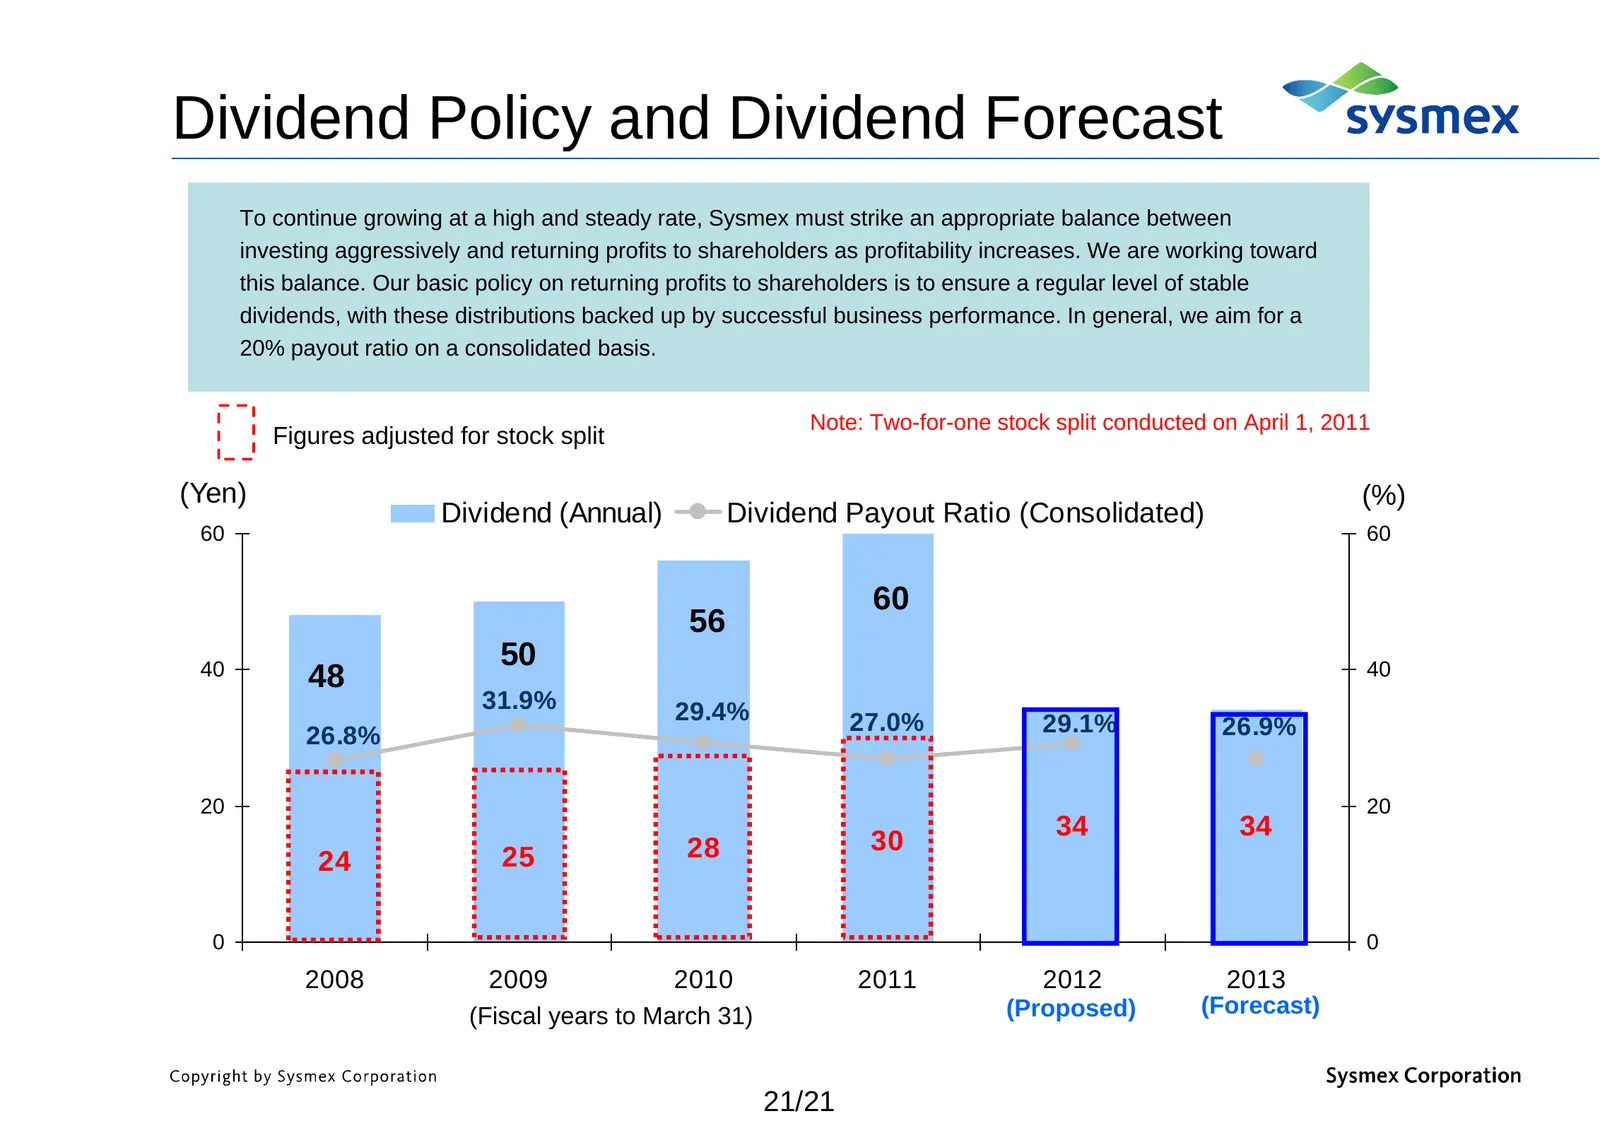
Slide 22: Dividend Policy and Dividend Forecast
Dividend Policyy and Dividend Forecast To continue growing at a high and steady rate, Sysmex must strike an appropriate balance between investing aggressively and returning profits to shareholders as profitability increases. We are working toward this balance. Our basic policy on returning profits t
Slide 23: Sysmex Corporation Contact
Chapter 3 Sysmex Corporation Contact: IR & Corporate Communication Dept. Phone: +81-78-265-0500 Email: info@sysmex info@sysmex.co.jp co jp
Source: Internet Archive copy of sysmex.co.jp
More decks from Sysmex Corporation
 Investor Presentation (November 2026)43 slides · Nov 10, 2026
 Q1 FY2027 Earnings Presentation33 slides · Aug 7, 2026
 Investor Presentation (2025)43 slides · 2025
 FY2012 Earnings Presentation23 slides · May 10, 2012
 9M FY2012 Earnings Presentation12 slides · Feb 3, 2012
 Q3 FY2012.3 Earnings Presentation12 slides · Feb 3, 2012