Malvern Bancorp — Shareholder Meeting (February 2014)
23 slides from Malvern Bancorp's shareholder meeting presentation, Feb 5, 2014

Slide 1: Annual Meeting
Annual Meeting February 6, 2014
Slide 2: Forward-Looking Statements
Forward-Looking Statements Certain comments inthis presentation contain certain forward looking statements (as defined in the Securities Exchange Act of 1934 and the regulations hereuncler). Forward looking statements are not historical facts but instead represent only the beliefs, expectations or o
Slide 3: Company Overview
Slide 4: Overview of Malvern Bancorp, Inc.
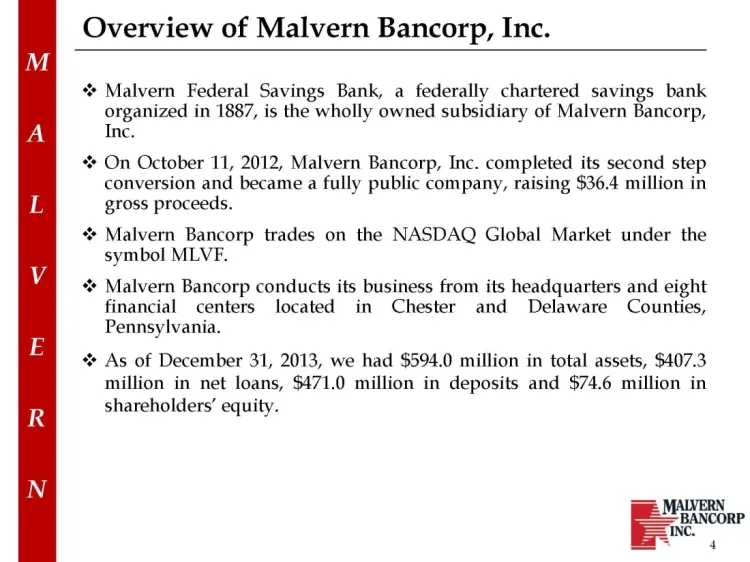
Overview of Malvern Bancorp, Inc. * Malvern Federal Savings Bank, a federally chartered savings bank organized in 1887, is the wholly owned subsidiary of Malvern Bancorp, Inc. * On October 11, 2012, Malvern Bancorp, Inc. completed its second step conversion and became a fully public company, raising
Slide 5: Malvern Federal Savings Bank Branch Locations
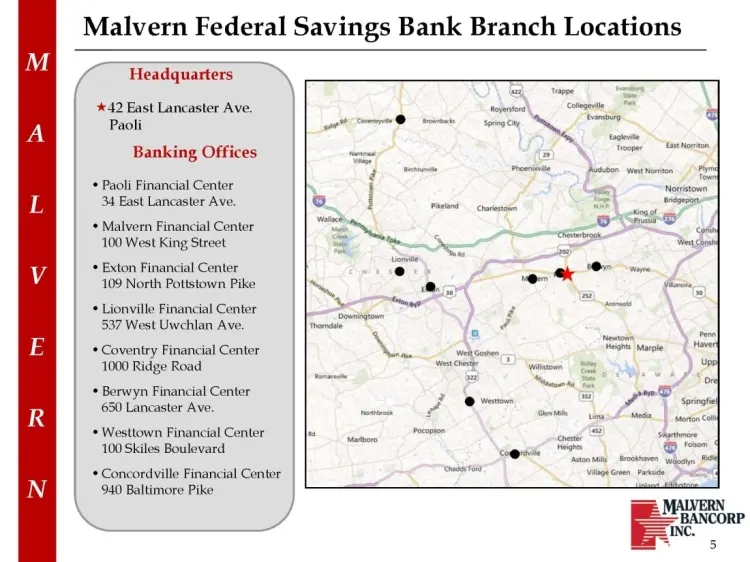
Malvern Federal Savings Bank Branch Locations / Headquarters #42 East Lancaster Ave. Paoli Banking Offices * Paoli Financial Center 34 East Lancaster Ave. ‘+ Malvern Financial Center 100 West King Street + Exton Financial Center 109 North Pottstown Pike * Lionville Financial Center 537 West Uwchlan
Slide 6: Market Share in Chester County
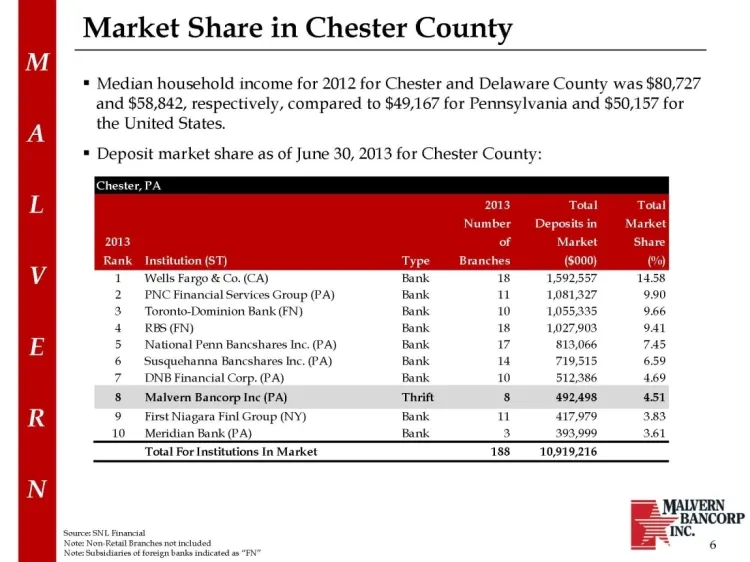
Market Share in Chester County = Median household income for 2012 for Chester and Delaware County was $80,727 and $58,842, respectively, compared to $49,167 for Pennsylvania and $50,157 for the United States. * Deposit market share as of June 30, 2013 for Chester County: 2013 Total Number Deposits i
Slide 7: Fiscal 2013 Review
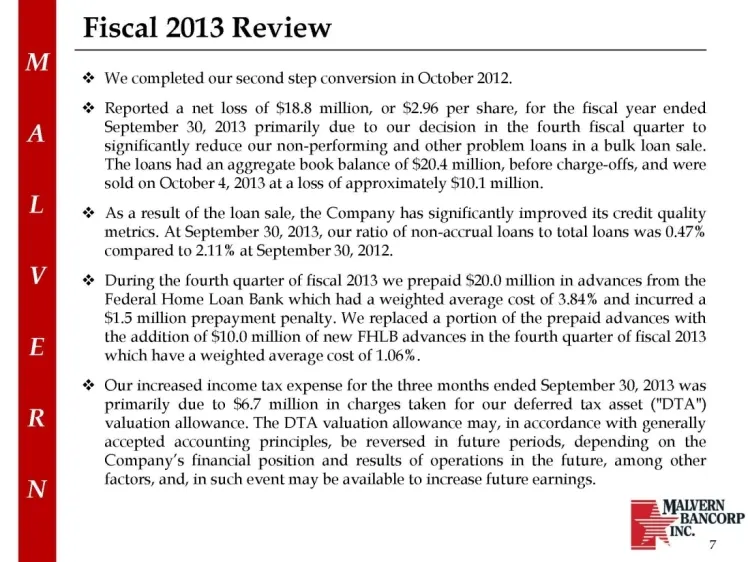
Fiscal 2013 Review + We completed our second step conversion in October 2012. Reported a net loss of $18.8 million, or $2.96 per share, for the fiscal year ended September 30, 2013 primarily due to our decision in the fourth fiscal quarter to significantly reduce our non-performing and other problem
Slide 8: Recent Developments
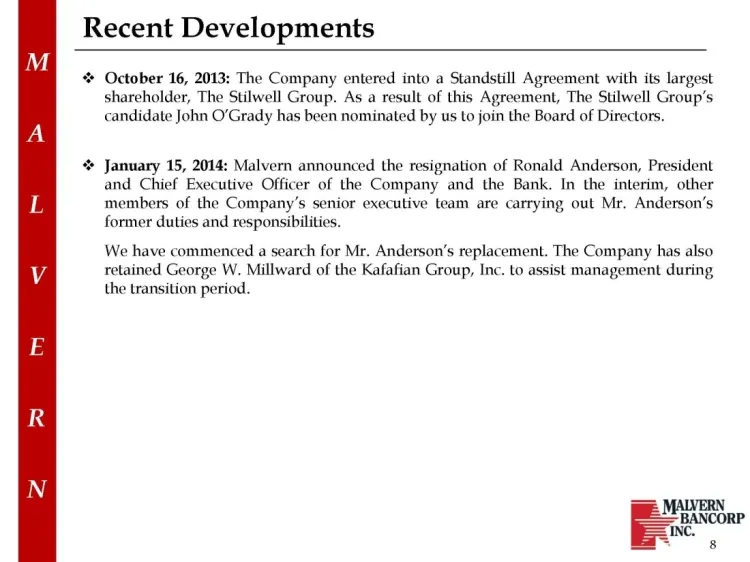
Recent Developments % October 16, 2013: The Company entered into a Standstill Agreement with its largest shareholder, The Stilwell Group. As a result of this Agreement, The Stilwell Group's candidate John O'Grady has been nominated by us to join the Board of Directors. January 15, 2014: Malvern anno
Slide 9: Fiscal 2014 Business Strategy
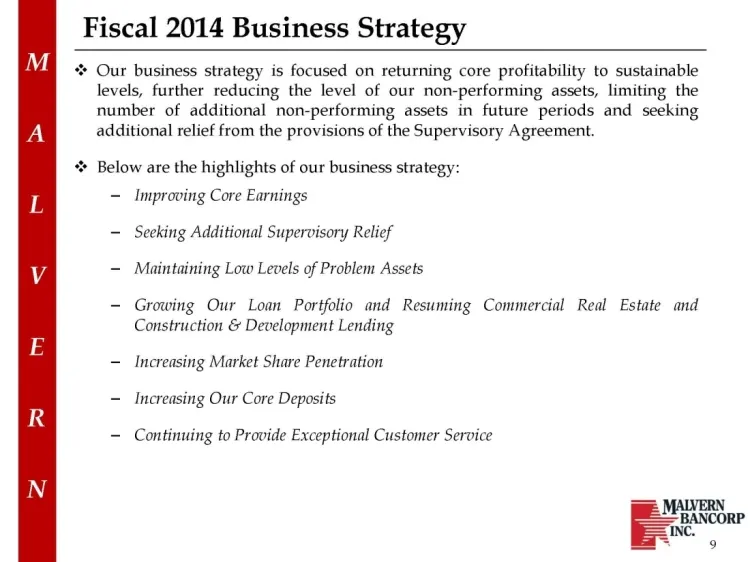
Fiscal 2014 Business Strategy “+ Our business strategy is focused on returning core profitability to sustainable levels, further reducing the level of our non-performing assets, limiting the number of additional non-performing assets in future periods and seeking additional relief from the provision
Slide 10: Financial Highlights
Slide 11: Asset Trends
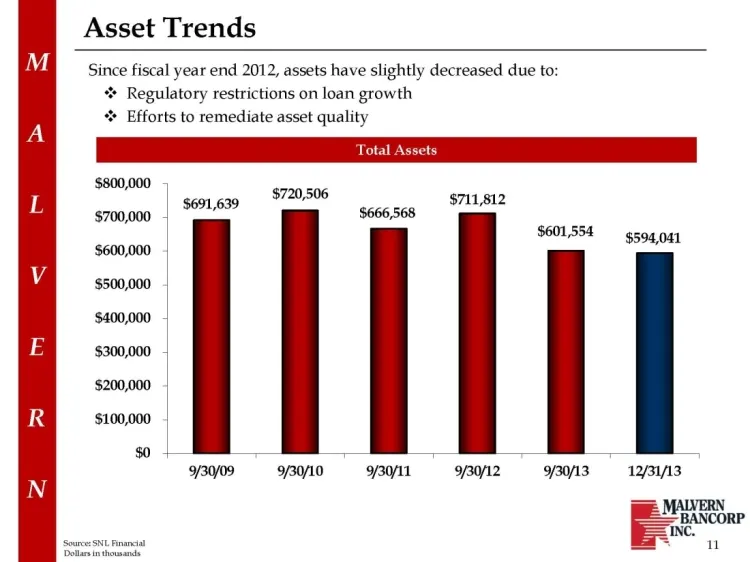
Asset Trends Since fiscal year end 2012, assets have slightly decreased due to: * Regulatory restrictions on loan growth + Efforts to remediate asset quality Total Assets $800,000 soo1,e39 $720,506 s7i1si2 $700,000 $666,568 $600,000, $601,554 $594,041 $500,000 $400,000 $300,000, $200,000 $100,000 $0
Slide 12: Loan Portfolio Composition
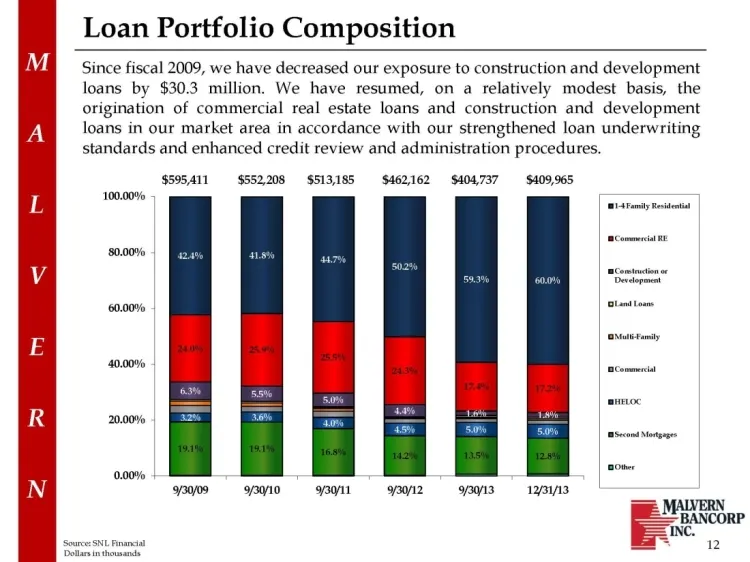
Loan Portfolio Composition Since fiscal 2009, we have decreased our exposure to construction and development loans by $30.3 million. We have resumed, on a relatively modest basis, the origination of commercial real estate loans and construction and development Fy loans in our market area in accordan
Slide 13: Credit Quality Trends
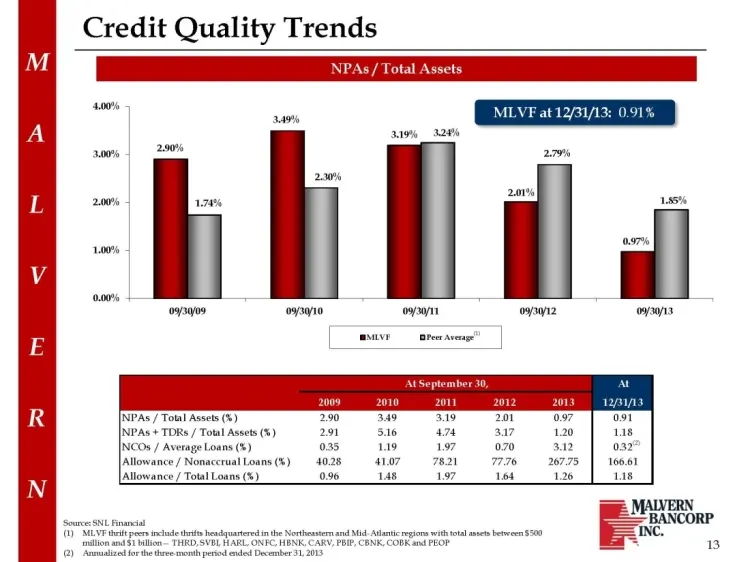
Credit Quality Trends NPAs/ Total Assets 00% 34% 319% 328% oor | 290% 279% 2.0% 201% 2.00% 178% 16 ash 1.00% 0.0%, ooo oyayio yg oan oy AtSeptember 3, At 2009 2011 pis INPAs / Total Assets (%) 290 Bad 319 INPAs + TDRs / Total Assets (%) 291 516 a7 INCOs / Average Loans (%) 035 119 197 [Allowance / N
Slide 14: Non-Performing Assets Breakdown
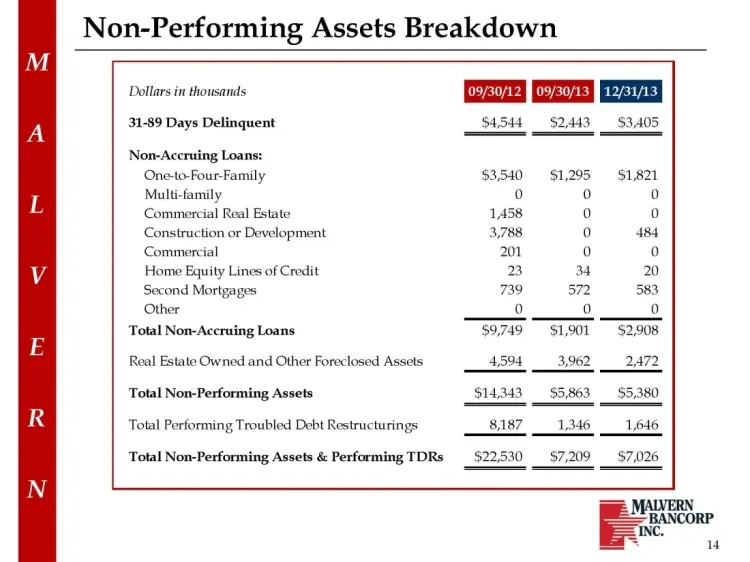
Non-Performing Assets Breakdown Datars owas On On ea 31-89 Days Delinquent $4,544 $2,443 $3,405 Non-Aceruing Loans: One-to-Four-Family $3,540 $1,295 $1821 Multi-family 0 0 o ‘Commercial Real Estate 1458 0 0 Construction or Development 3,788 0 484 Commercial 201 0 0 Home Equity Lines of Credit 23 or
Slide 15: Deposit Composition
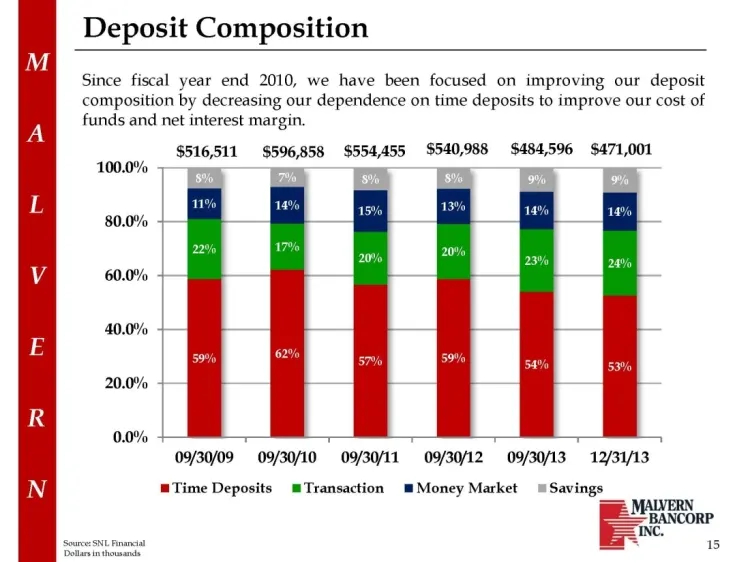
Deposit Composition Since fiscal year end 2010, we have been focused on improving our deposit composition by decreasing our dependence on time deposits to improve our cost of funds and net interest margin. $516,511 $596,858 $554,455 $540,988 $484,596 $471,001 100.0% 80.0% + 60.0% + 40.0% + 20.0% 0.0
Slide 16: Net Interest Margin
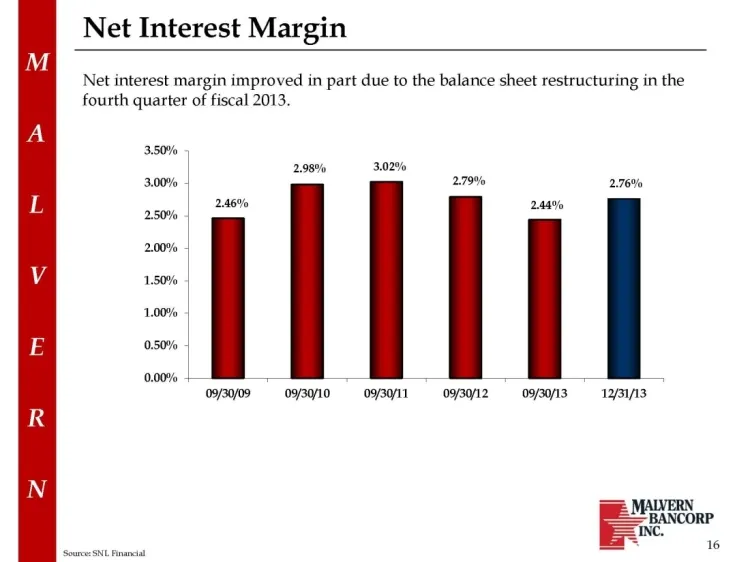
Net Interest Margin Net interest margin improved in part due to the balance sheet restructuring in the fourth quarter of fiscal 2013. 3.50% 2.98% 3.02% 2.79% 3.00% 2.76% 2.46% 244% 2.50% 2.00% 1.50% 1.00% 0.50% 0.00% - - 093709 O10. OBIT ONBOIZ = ONBOIS-«IPBI/AS
Slide 17: Net Income
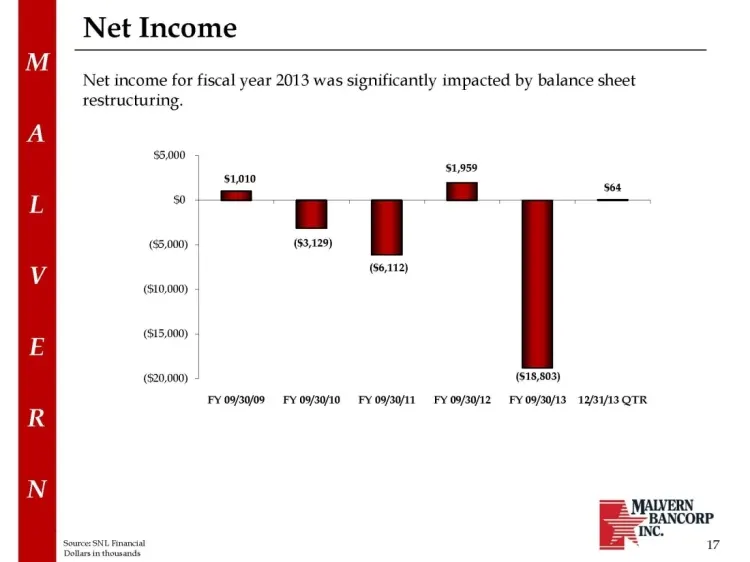
Net Income Net income for fiscal year 2013 was significantly impacted by balance sheet restructuring. $5,000 ($20,000) (518,803) FY 09/30/09 FY 09/30/10 FY.OY30/11 FYO9/30/12. FY09/30/13- 12/31/13 QTR Pa alana Sd
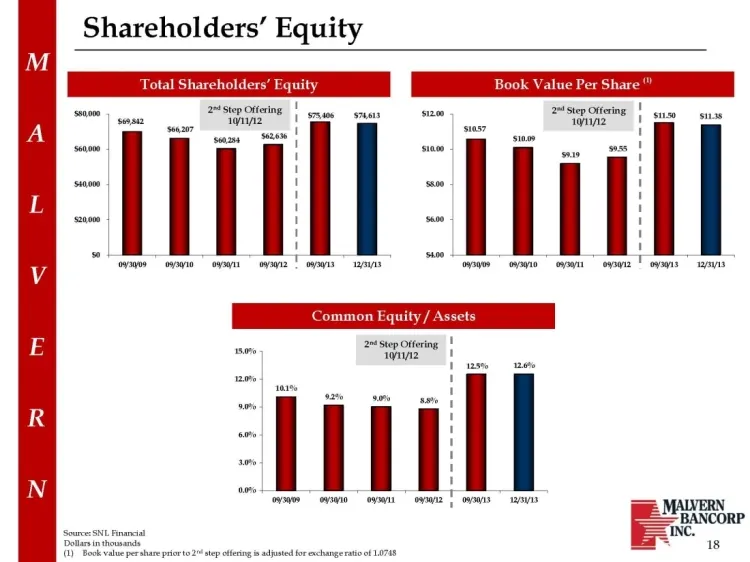
Slide 18: Shareholders' Equity and Book Value Per Share
Shareholders’ Equity 1 Shareholders’ Equity ook Value Per Share 26! Step Offering anna sano E- ‘BANCORP SourcesSNIL Final SINC. Dotan iin a ag (0). Book valu per share prior 102% sep offering sad jsted for exchange tio of L748
Slide 19: Market Statistics
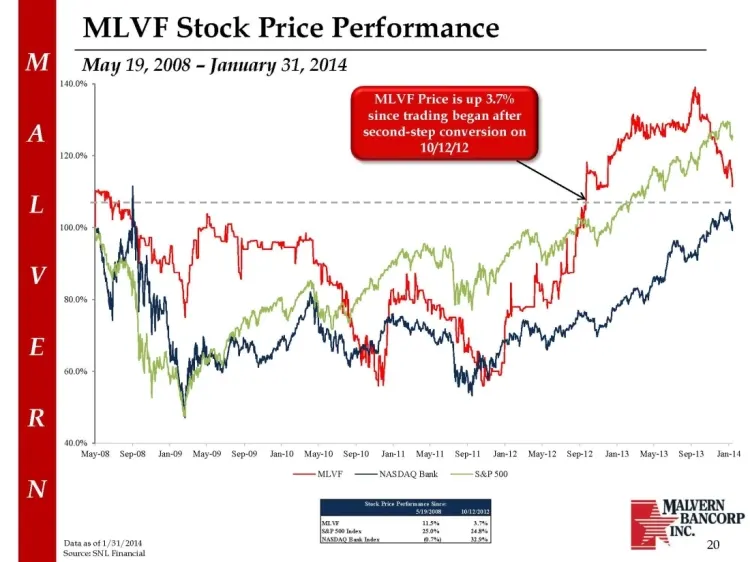
Slide 20: MLVF Stock Price Performance
MLVF Stock Price Performance May 19, 2008 ~ January 31, 2014 00% second-step 200% 00% om May 08 SepO8 Jan09 May-09 SepO9 Jan1O May-1OSep10 Jani Map-It Sept Jarl? May-I2Sep12 Jav3 May-8 Sqp3 Jari —MLvE —Naspag ek —sers0o MTANGORP INC. 8
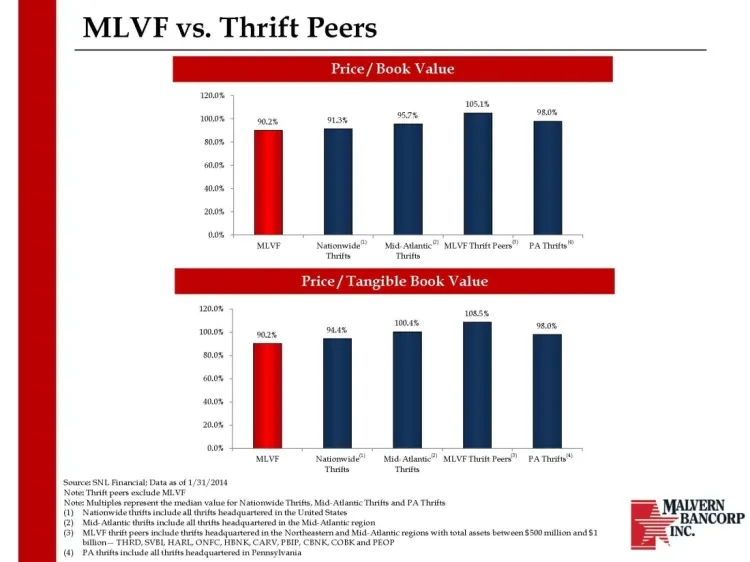
Slide 21: MLVF vs. Thrift Peers
MLVF vs. Thrift Peers Price / Book Value
Slide 22: Fiscal 2014 Outlook
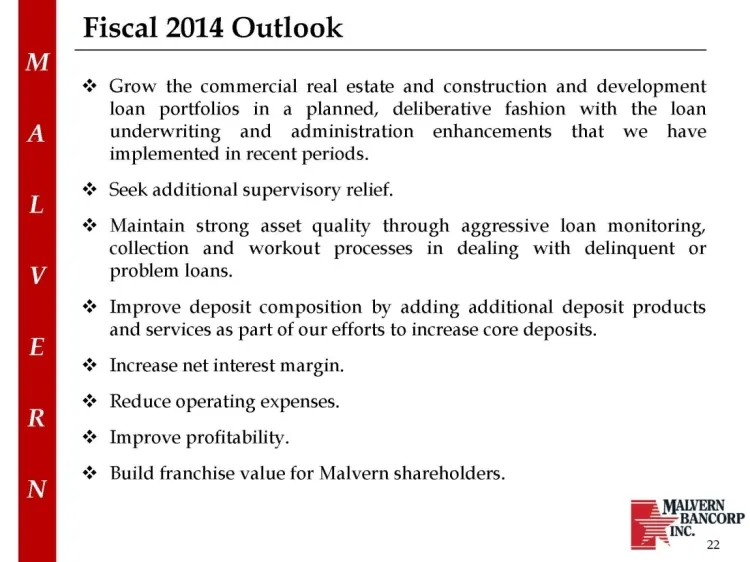
Fiscal 2014 Outlook Grow the commercial real estate and construction and development loan portfolios in a planned, deliberative fashion with the loan underwriting and administration enhancements that we have implemented in recent periods. Seek additional supervisory relief. Maintain strong asset qua
Slide 23: Questions?
Source: SEC EDGAR · 8-K filed Feb 5, 2014