Malvern Bancorp — Shareholder Meeting (February 2013)
23 slides from Malvern Bancorp's shareholder meeting presentation, Feb 6, 2013

Slide 1: Annual Meeting February 7, 2013
M A L V E R N Annual Meeting February 7, 2013
Slide 2: Forward-Looking Statements
M A L V E R N Forward-Looking Statements Certain comments in this presentation contain certain forward looking statements (as defined in the Securities Exchange Act of 1934 and the regulations hereunder). Forward looking statements are not historical facts but instead represent only the beliefs, exp
Slide 3: Company Overview
M A L V E R N Company Overview
Slide 4: Overview of Malvern Bancorp, Inc.
M A L V E R N Overview of Malvern Bancorp, Inc. Malvern Federal Savings Bank, a federally chartered savings bank organized in 1887, is the wholly owned subsidiary of Malvern Bancorp, Inc. On October 11, 2012, Malvern Bancorp, Inc. completed its second step conversion and became a fully public compan
Slide 5: Malvern Federal Savings Bank Branch Locations
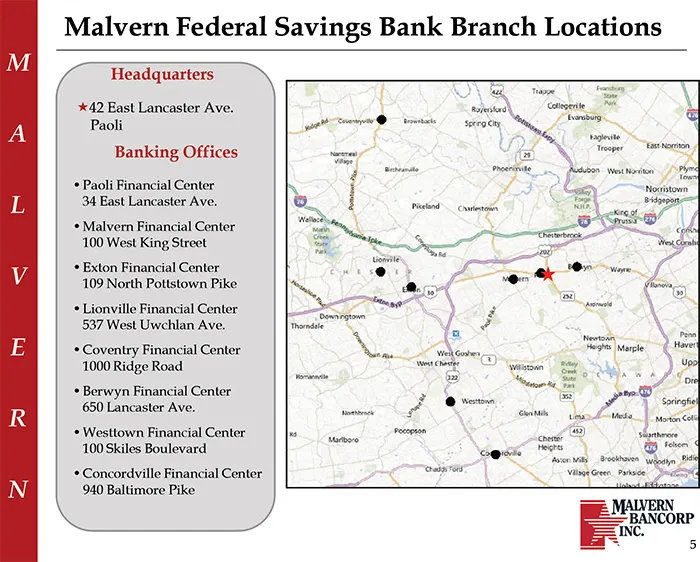
M A L V E R N Malvern Federal Savings Bank Branch Locations Headquarters 42 East Lancaster Ave. Paoli Banking Offices • Paoli Financial Center 34 East Lancaster Ave. • Malvern Financial Center 100 West King Street • Exton Financial Center 109 North Pottstown Pike • Lionville Financial Center 537 Wes
Slide 6: Market Share in Chester County
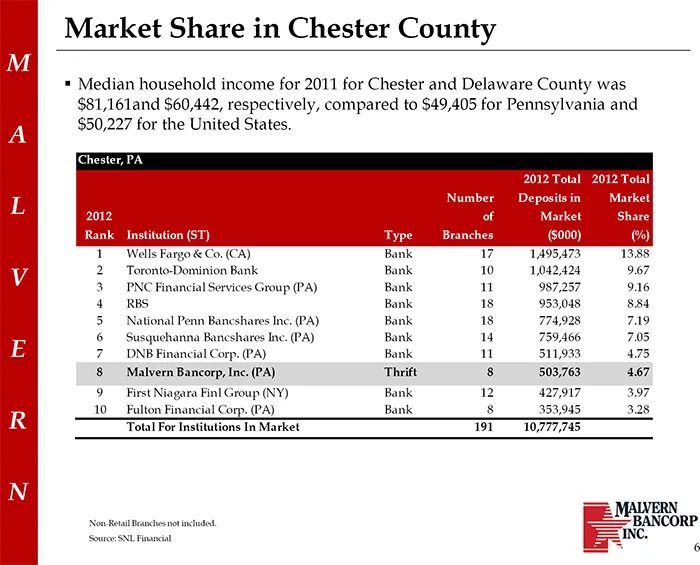
M A L V E R N Market Share in Chester County Median household income for 2011 for Chester and Delaware County was $81,161and $60,442, respectively, compared to $49,405 for Pennsylvania and $50,227 for the United States. Chester, PA 2012 Total 2012 Total Number Deposits in Market 2012 of Market Share
Slide 7: Fiscal 2012 Review
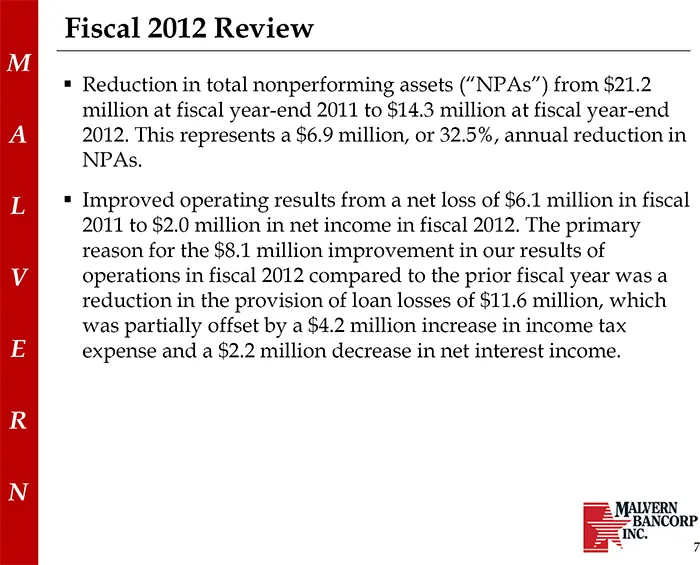
M A L V E R N Fiscal 2012 Review Reduction in total nonperforming assets (“NPAs”) from $21.2 million at fiscal year-end 2011 to $14.3 million at fiscal year-end 2012. This represents a $6.9 million, or 32.5%, annual reduction in NPAs. Improved operating results from a net loss of $6.1 million in fis
Slide 8: Fiscal 2013 Business Strategy
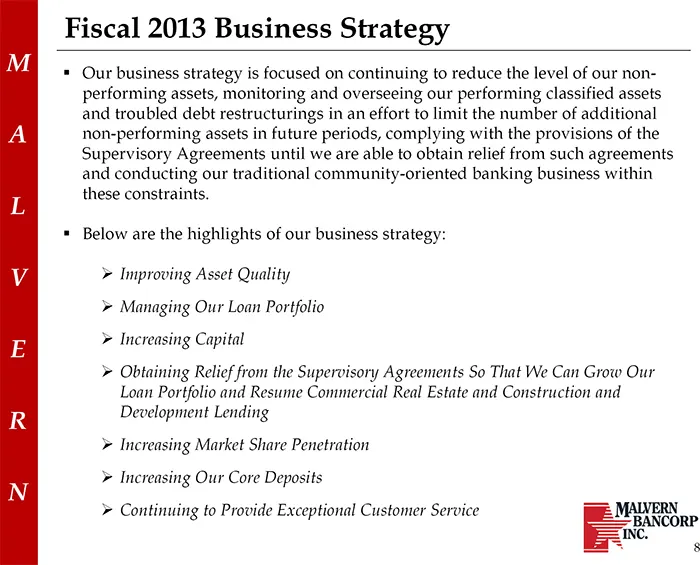
M A L V E R N Fiscal 2013 Business Strategy Our business strategy is focused on continuing to reduce the level of our non-performing assets, monitoring and overseeing our performing classified assets and troubled debt restructurings in an effort to limit the number of additional non-performing asset
Slide 9: Financial Highlights
M A L V E R N Financial Highlights
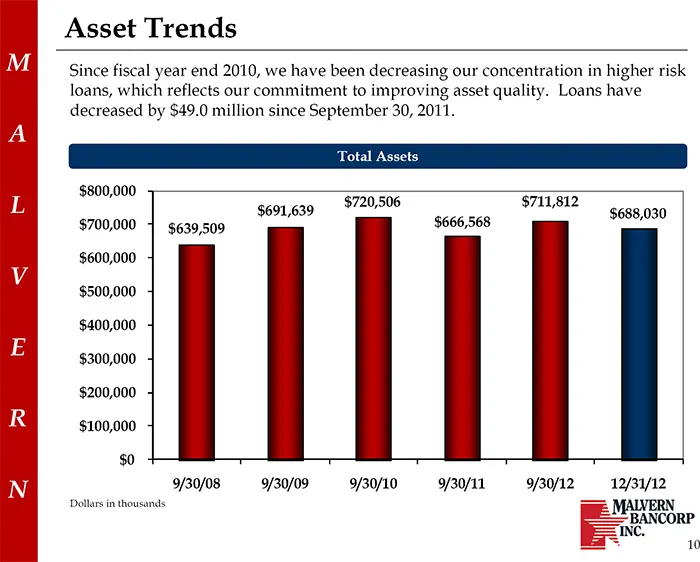
Slide 10: Asset Trends
M A L V E R N Asset Trends Since fiscal year end 2010, we have been decreasing our concentration in higher risk loans, which reflects our commitment to improving asset quality. Loans have decreased by $49.0 million since September 30, 2011. Total Assets $800,000 $720,506 $711,812 $691,639 $688,030 $
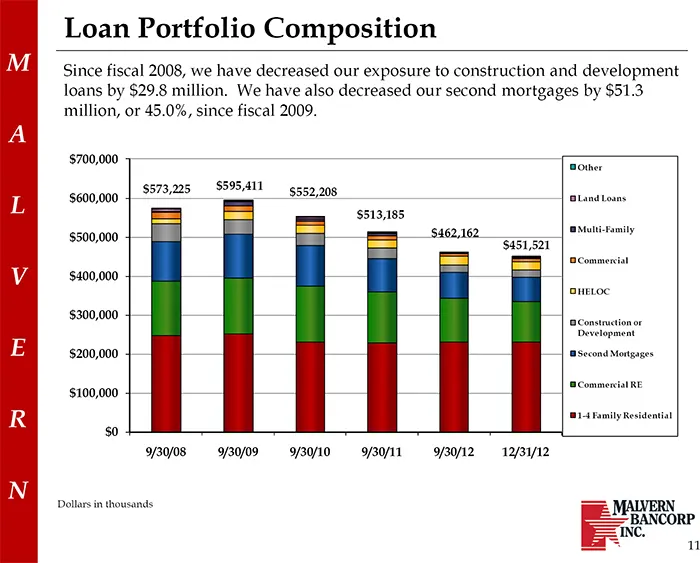
Slide 11: Loan Portfolio Composition
M A L V E R N Loan Portfolio Composition Since fiscal 2008, we have decreased our exposure to construction and development loans by $29.8 million. We have also decreased our second mortgages by $51.3 million, or 45.0%, since fiscal 2009. $700,000 Other $573,225 $595,411 $552,208 $600,000 Land Loans
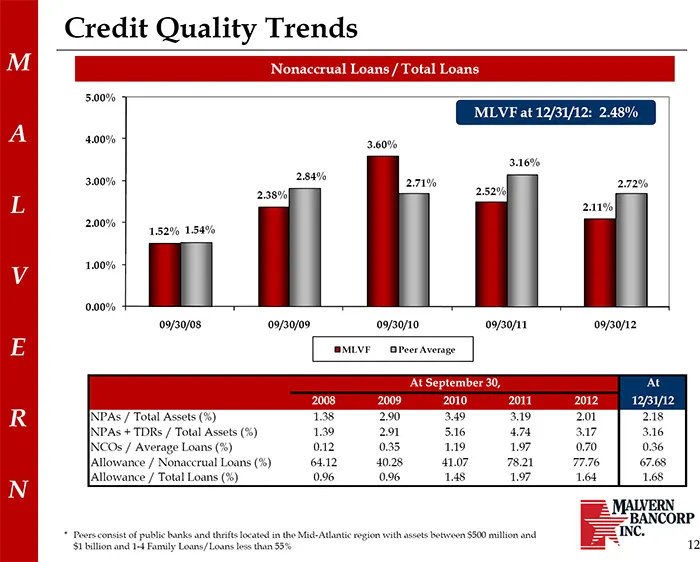
Slide 12: Credit Quality Trends
M A L V E R N Credit Quality Trends Nonaccrual Loans / Total Loans 5.00% MLVF at 12/31/12: 2.48% 4.00% 3.60% 3.16% 2.84% 3.00% 2.71% 2.72% 2.38% 2.52% 2.11% 2.00% 1.52% 1.54% 1.00% 0.00% 09/30/08 09/30/09 09/30/10 09/30/11 09/30/12 MLVF Peer Average At September 30, At 2008 2009 2010 2011 2012 12/31
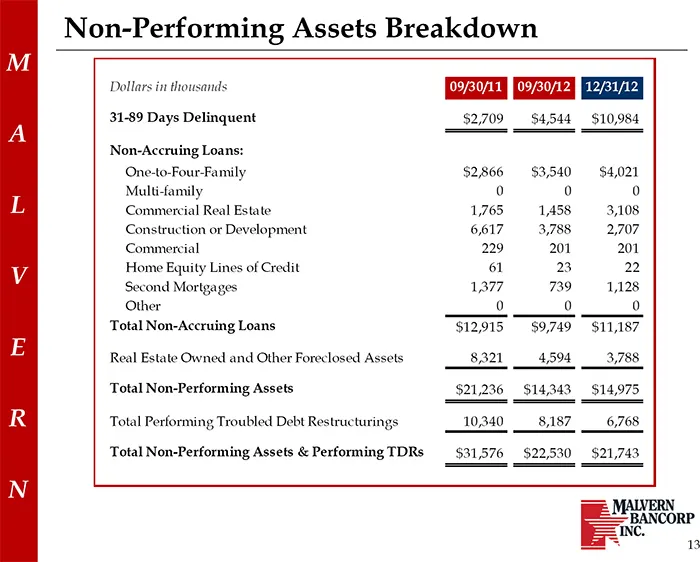
Slide 13: Non-Performing Assets Breakdown
M A L V E R N Non-Performing Assets Breakdown Dollars in thousands 09/30/11 09/30/12 12/31/12 31-89 Days Delinquent $2,709 $4,544 $10,984 Non-Accruing Loans: One-to-Four-Family $2,866 $3,540 $4,021 Multi-family 0 0 0 Commercial Real Estate 1,765 1,458 3,108 Construction or Development 6,617 3,788 2,
Slide 14: Deposit Composition
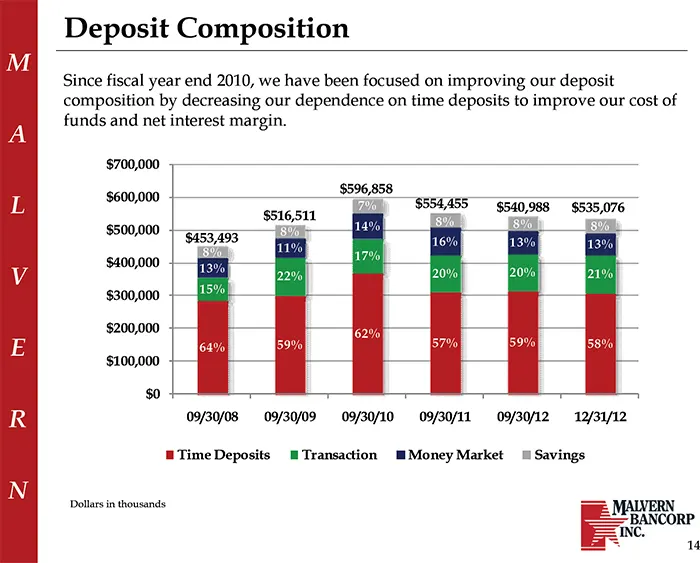
M A L V E R N Deposit Composition Since fiscal year end 2010, we have been focused on improving our deposit composition by decreasing our dependence on time deposits to improve our cost of funds and net interest margin. $700,000 $596,858 $600,000 7% $554,455 $540,988 $535,076 $516,511 14% 8% 8% 8% $
Slide 15: Liabilities
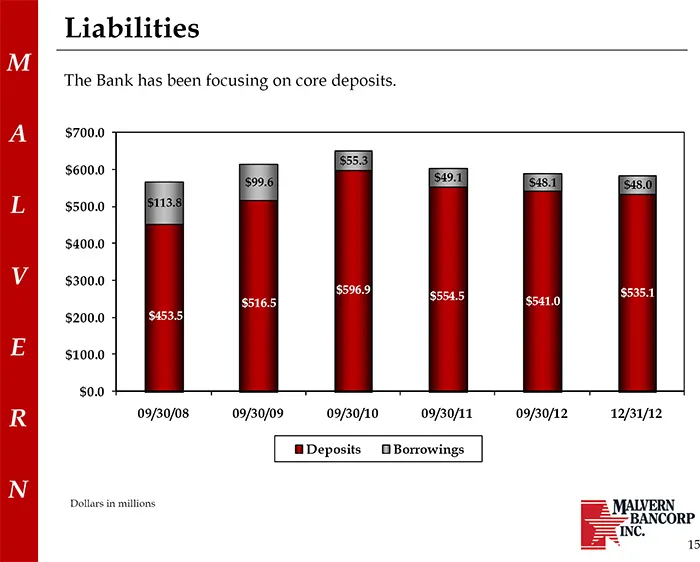
M A L V E R N Liabilities The Bank has been focusing on core deposits. $700.0 $55.3 $600.0 $49.1 $99.6 $48.1 $48.0 $500.0 $113.8 $400.0 $300.0 $596.9 $535.1 $554.5 $516.5 $541.0 $200.0 $453.5 $100.0 $0.0 09/30/08 09/30/09 09/30/10 09/30/11 09/30/12 12/31/12 Deposits Borrowings Dollars in millions 15
Slide 16: Net Interest Margin
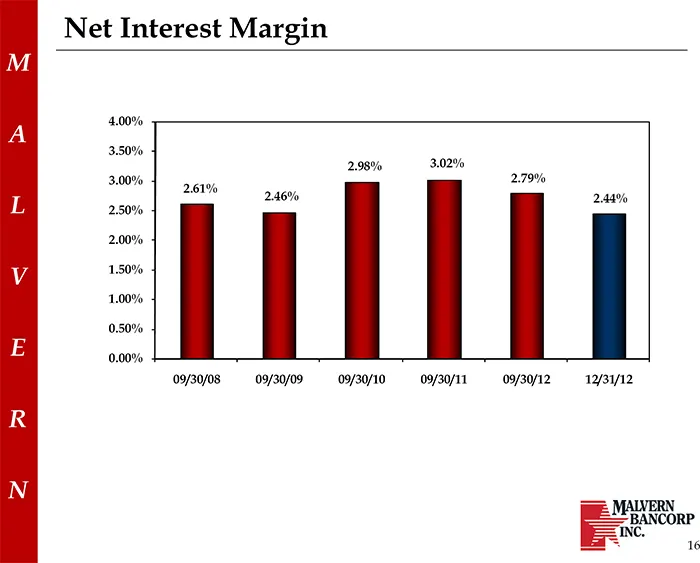
M A L V E R N Net Interest Margin 4.00% 3.50% 2.98% 3.02% 3.00% 2.79% 2.61% 2.46% 2.44% 2.50% 2.00% 1.50% 1.00% 0.50% 0.00% 09/30/08 09/30/09 09/30/10 09/30/11 09/30/12 12/31/12 16
Slide 17: Net Income
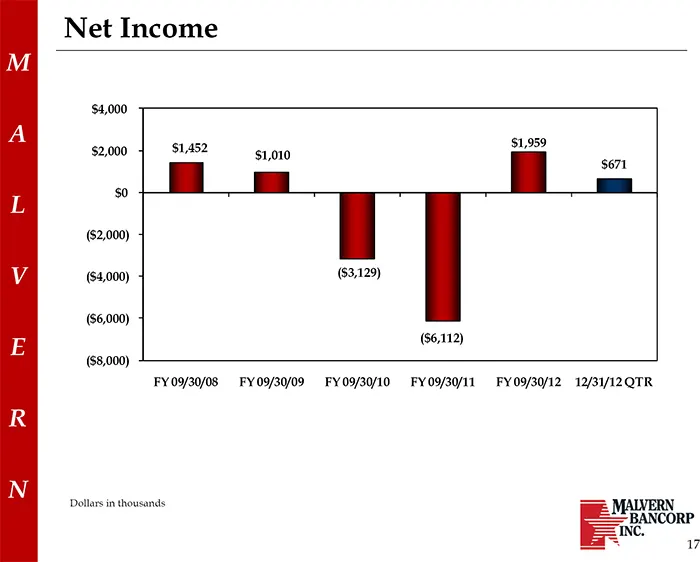
M A L V E R N Net Income $4,000 $1,959 $2,000 $1,452 $1,010 $671 $0 ($2,000) ($4,000) ($3,129) ($6,000) ($6,112) ($8,000) FY 09/30/08 FY 09/30/09 FY 09/30/10 FY 09/30/11 FY 09/30/12 12/31/12 QTR Dollars in thousands 17
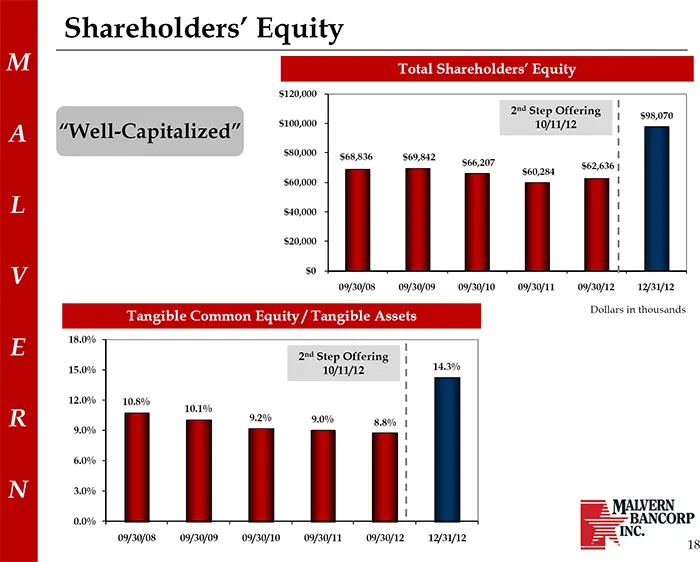
Slide 18: Shareholders' Equity
M A L V E R N Shareholders’ Equity Total Shareholders’ Equity $120,000 2 nd Step Offering $98,070 “Well-Capitalized” $100,000 10/11/12 $80,000 $68,836 $69,842 $66,207 $62,636 $60,284 $60,000 $40,000 $20,000 $0 09/30/08 09/30/09 09/30/10 09/30/11 09/30/12 12/31/12 Dollars in thousands Tangible Common
Slide 19: Market Statistics
M A L V E R N Market Statistics
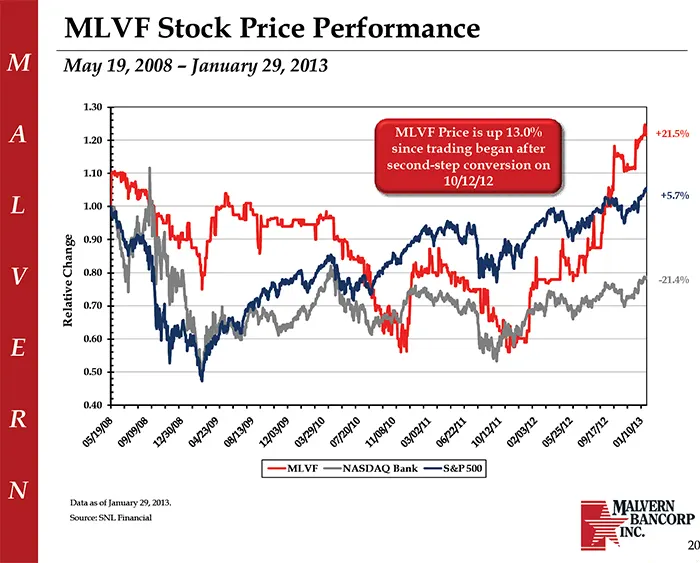
Slide 20: MLVF Stock Price Performance
M A L V E R N MLVF Stock Price Performance May 19, 2008 – January 29, 2013 1.30 MLVF Price is up 13.0% +21.5% 1.20 since trading began after second-step conversion on 1.10 10/12/12 +5.7% 1.00 0.90 Change 0.80 -21.4% Relative 0.70 0.60 0.50 0.40 MLVF NASDAQ Bank S&P 500 Data as of January 29, 2013. S
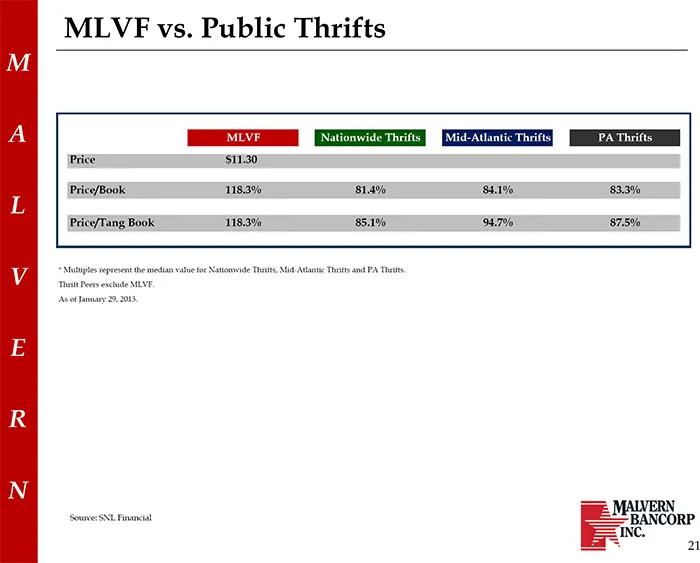
Slide 21: MLVF vs. Public Thrifts
M A L V E R N MLVF vs. Public Thrifts MLVF Nationwide Thrifts Mid-Atlantic Thrifts PA Thrifts Price $11.30 Price/Book 118.3% 81.4% 84.1% 83.3% Price/Tang Book 118.3% 85.1% 94.7% 87.5% * Multiples represent the median value for Nationwide Thrifts, Mid-Atlantic Thrifts and PA Thrifts. Thrift Peers exc
Slide 22: Fiscal 2013 Outlook
M A L V E R N Fiscal 2013 Outlook Continue to improve asset quality through aggressive loan monitoring, collection and workout processes in dealing with delinquent or problem loans Reduce operating expenses Improve deposit composition by adding additional deposit products and services as part of our
Slide 23: Questions?
M A L V E R N Questions?
Source: SEC EDGAR · 8-K filed Feb 6, 2013