Malvern Bancorp — IPO Roadshow (October 2018)
25 slides from Malvern Bancorp's IPO roadshow presentation, Oct 1, 2018

Slide 1: Disclosure and Forward Looking Statements
40 54 88 204 153 0 82 109 176 152 154 172 220 89 36 180 179 146 $25 Million Common Stock Offering October 2018 Disclaimer 2 DISCLOSURE AND FORWARD LOOKING STATEMENTS This presentation is solely for informational purposes and has been prepared to assist interested parties in making their own evaluati
Slide 2: Terms of the Proposed Offering
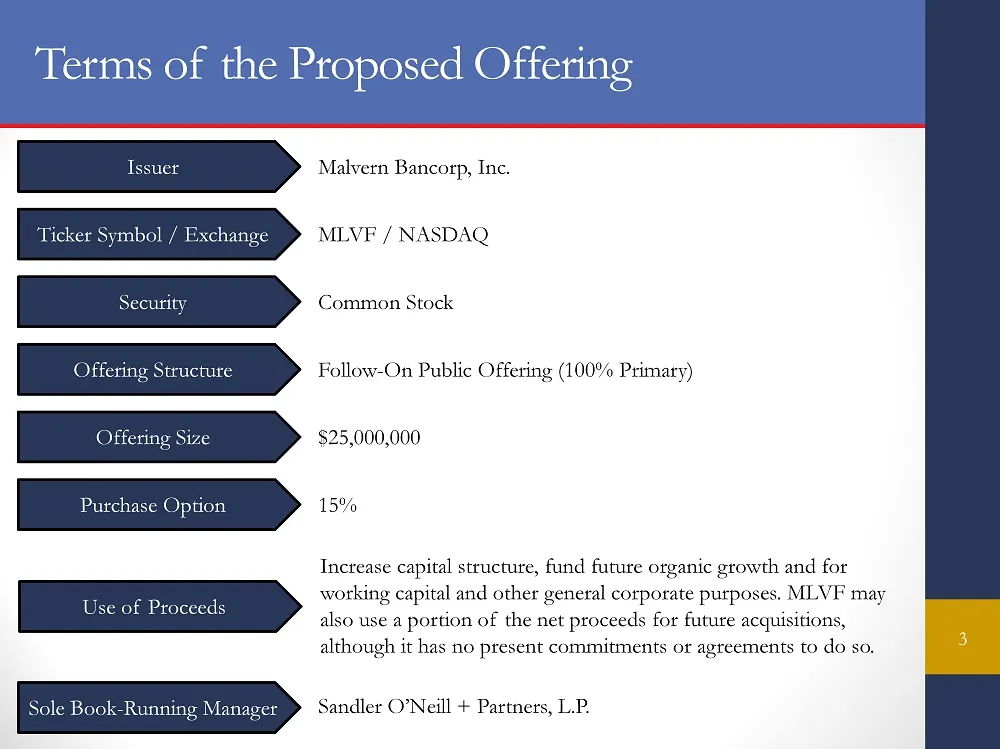
40 54 88 204 153 0 82 109 176 152 154 172 220 89 36 180 179 146 Terms of the Proposed Offering 3 Issuer Malvern Bancorp, Inc. Ticker Symbol / Exchange MLVF / NASDAQ Security Common Stock Offering Structure Follow - On Public Offering (100% Primary) Offering Size $25,000,000 Purchase Option 15% Use o
Slide 3: Investment Highlights
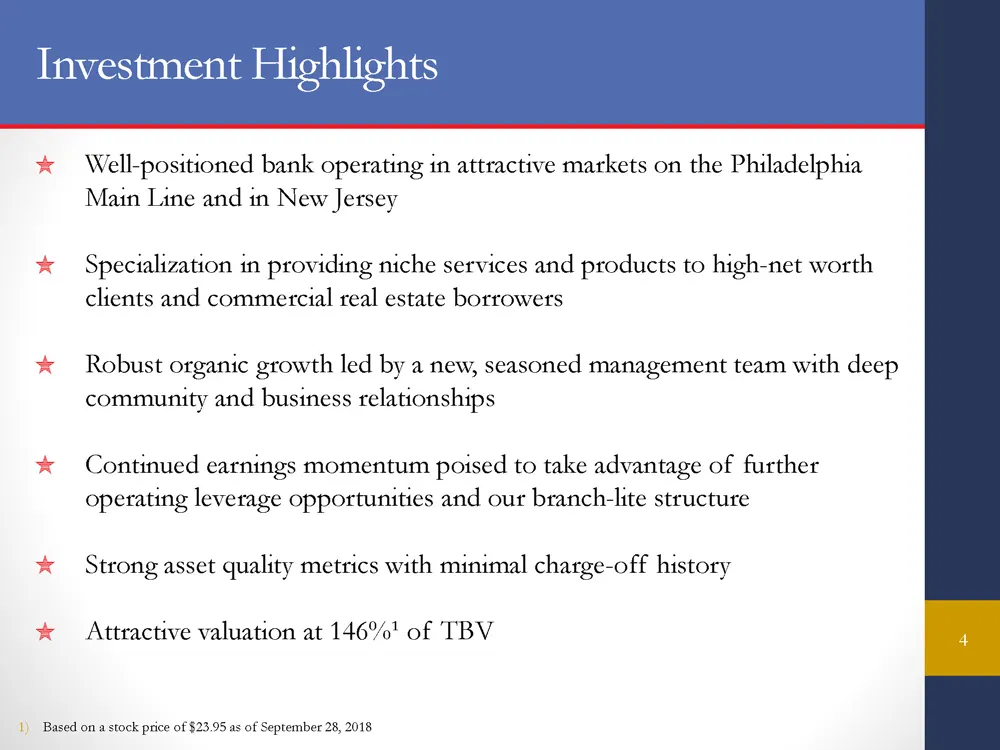
40 54 88 204 153 0 82 109 176 152 154 172 220 89 36 180 179 146 Investment Highlights Well - positioned bank operating in attractive markets on the Philadelphia Main Line and in New Jersey Specialization in providing niche services and products to high - net worth clients and commercial real estate
Slide 4: Company Snapshot
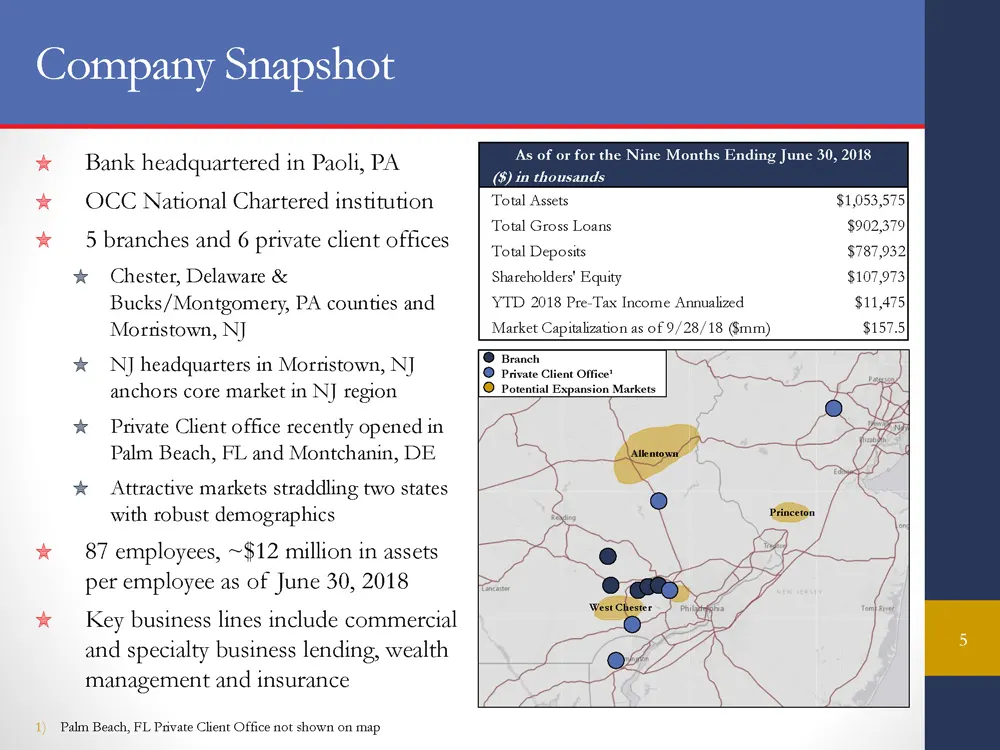
40 54 88 204 153 0 82 109 176 152 154 172 220 89 36 180 179 146 Company Snapshot Bank headquartered in Paoli, PA OCC National Chartered institution 5 branches and 6 private client offices Chester , Delaware & Bucks/Montgomery, PA counties and Morristown, NJ NJ headquarters in Morristown, NJ anchors
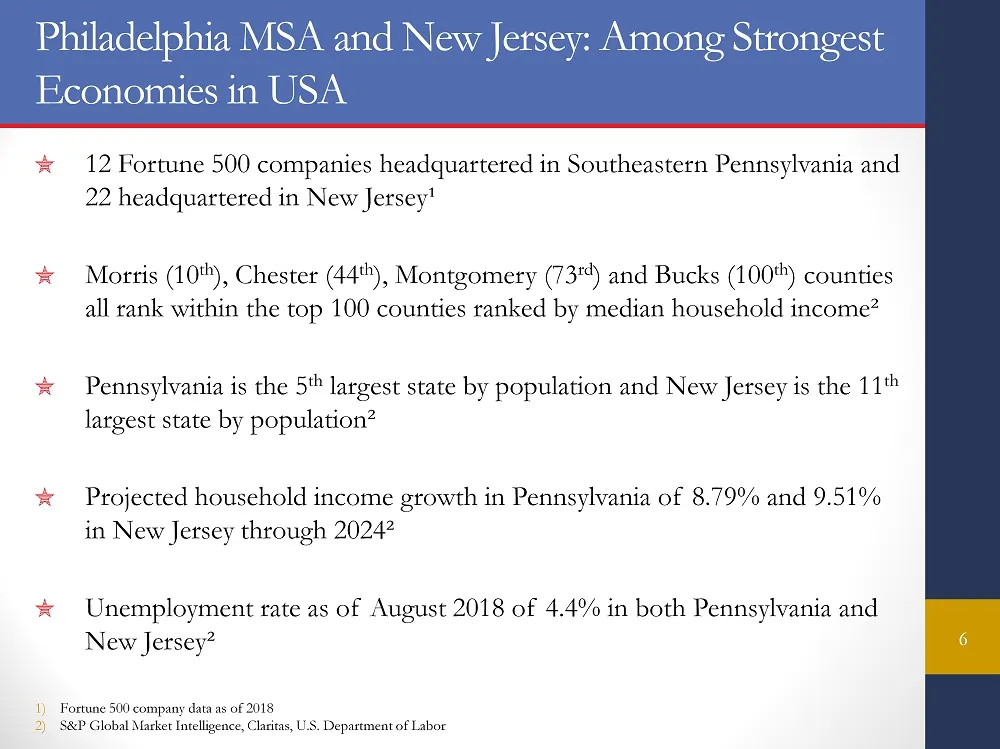
Slide 5: Philadelphia MSA and New Jersey: Among Strongest Economies in USA
40 54 88 204 153 0 82 109 176 152 154 172 220 89 36 180 179 146 Philadelphia MSA and New Jersey: Among Strongest Economies in USA 12 Fortune 500 companies headquartered in Southeastern Pennsylvania and 22 headquartered in New Jersey¹ Morris (10 th ), Chester ( 44 th ), Montgomery (73 rd ) and Bucks
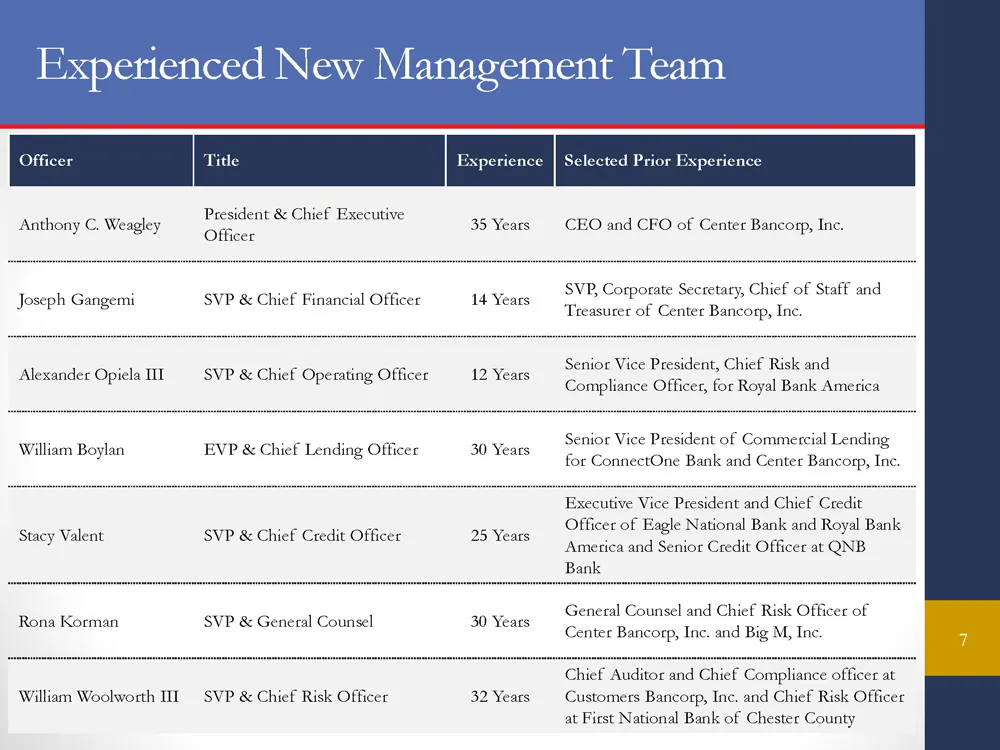
Slide 6: Experienced New Management Team
40 54 88 204 153 0 82 109 176 152 154 172 220 89 36 180 179 146 Experienced New Management Team 7 Officer Title Experience Selected Prior Experience Anthony C. Weagley President & Chief Executive Officer 35 Years CEO and CFO of Center Bancorp, Inc. Joseph Gangemi SVP & Chief Financial Officer 14 Yea
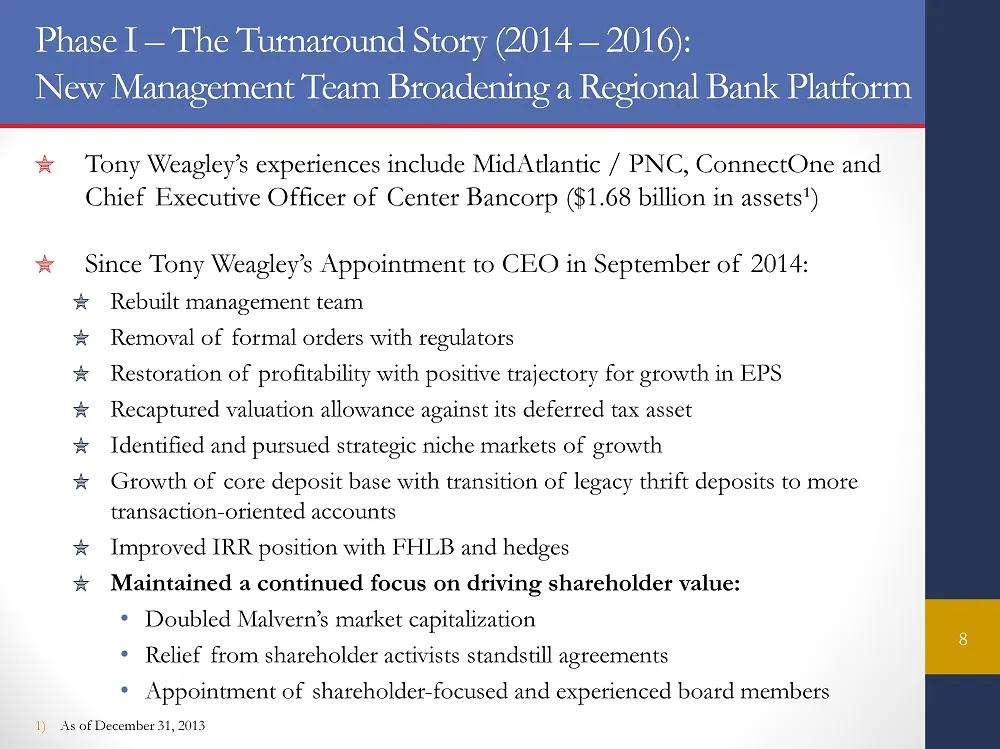
Slide 7: Phase I – The Turnaround Story (2014 – 2016)
40 54 88 204 153 0 82 109 176 152 154 172 220 89 36 180 179 146 Phase I – The Turnaround Story (2014 – 2016): New Management Team Broadening a Regional Bank Platform Tony Weagley’s experiences include MidAtlantic / PNC, ConnectOne and Chief Executive Officer of Center Bancorp ($ 1.68 billion in asse
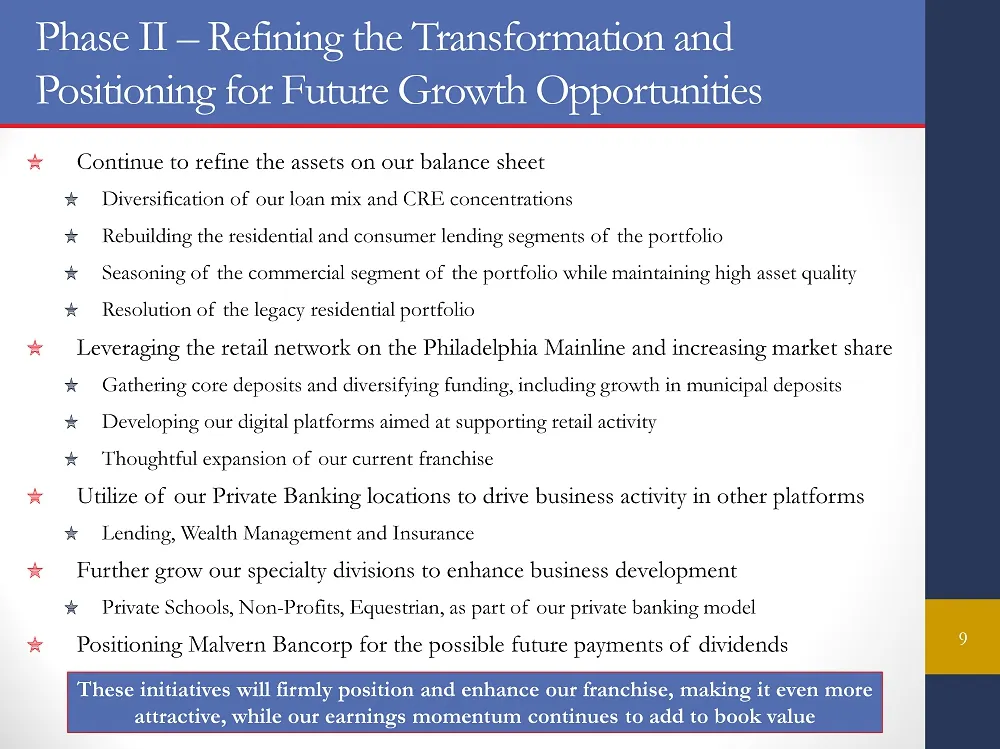
Slide 8: Phase II – Refining the Transformation and Positioning for Future Growth
40 54 88 204 153 0 82 109 176 152 154 172 220 89 36 180 179 146 Phase II – Refining the Transformation and Positioning for Future Growth Opportunities Continue to refine the assets on our balance sheet Diversification of our loan mix and CRE concentrations Rebuilding the residential and consumer len
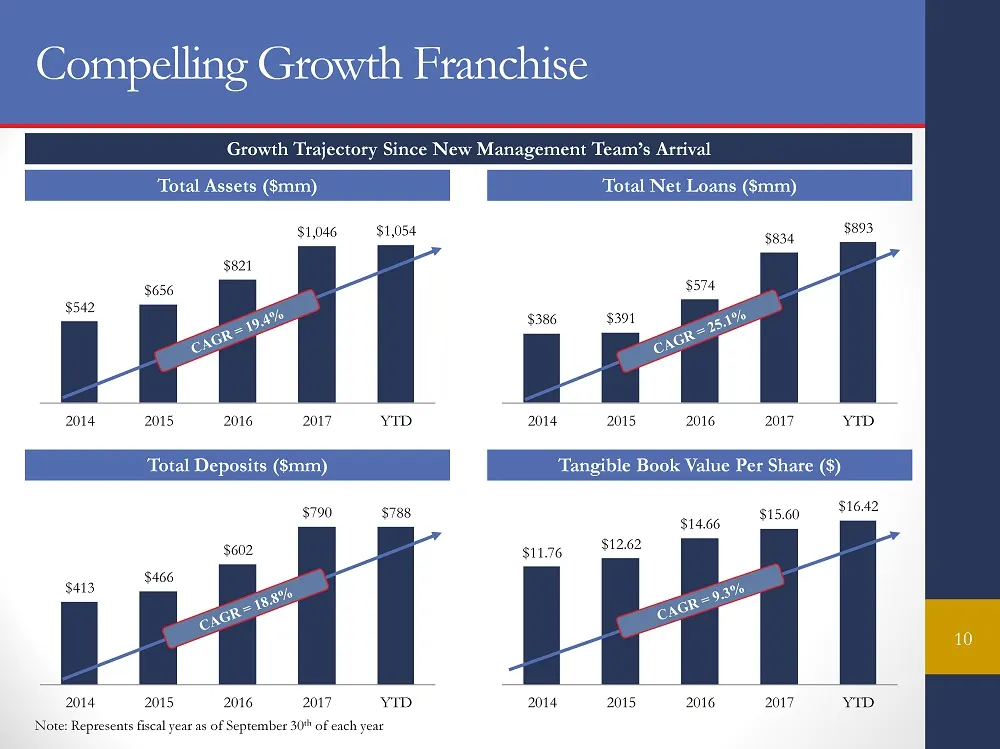
Slide 9: Compelling Growth Franchise
40 54 88 204 153 0 82 109 176 152 154 172 220 89 36 180 179 146 $11.76 $12.62 $14.66 $15.60 $16.42 2014 2015 2016 2017 YTD $413 $466 $602 $790 $788 2014 2015 2016 2017 YTD $386 $391 $574 $834 $893 2014 2015 2016 2017 YTD $542 $656 $821 $1,046 $1,054 2014 2015 2016 2017 YTD Compelling Growth Franchis
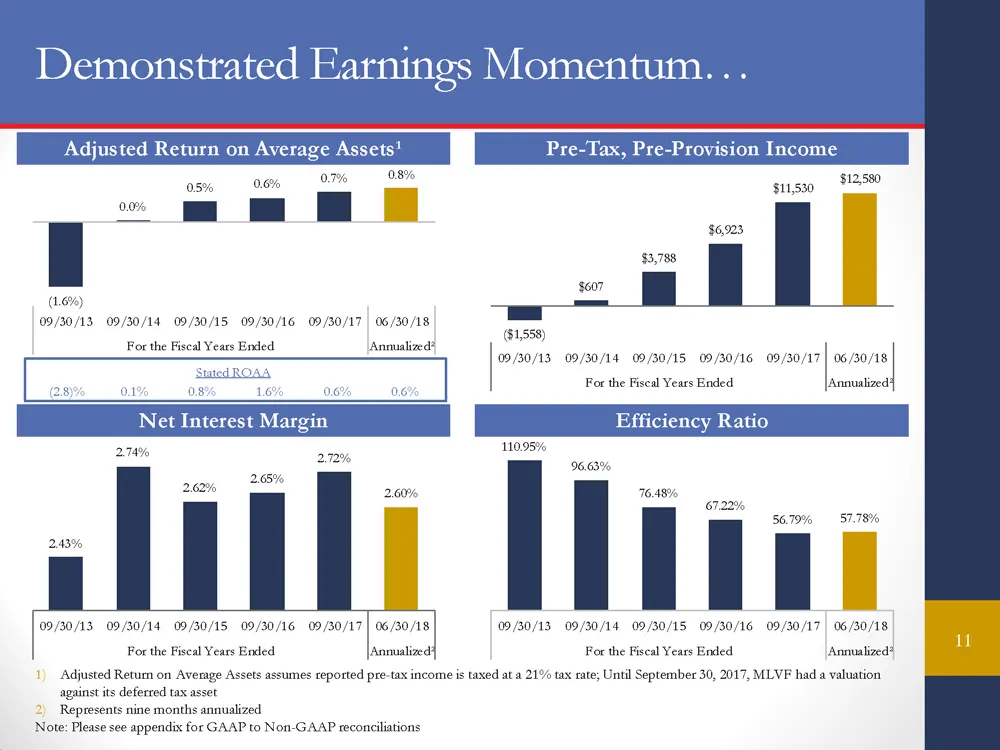
Slide 10: Demonstrated Earnings Momentum
40 54 88 204 153 0 82 109 176 152 154 172 220 89 36 180 179 146 (1.6%) 0.0% 0.5% 0.6% 0.7% 0.8% 09/30/13 09/30/14 09/30/15 09/30/16 09/30/17 06/30/18 For the Fiscal Years Ended Annualized² Demonstrated Earnings Momentum… 11 1) Adjusted Return on Average Assets assumes reported pre - tax income is ta
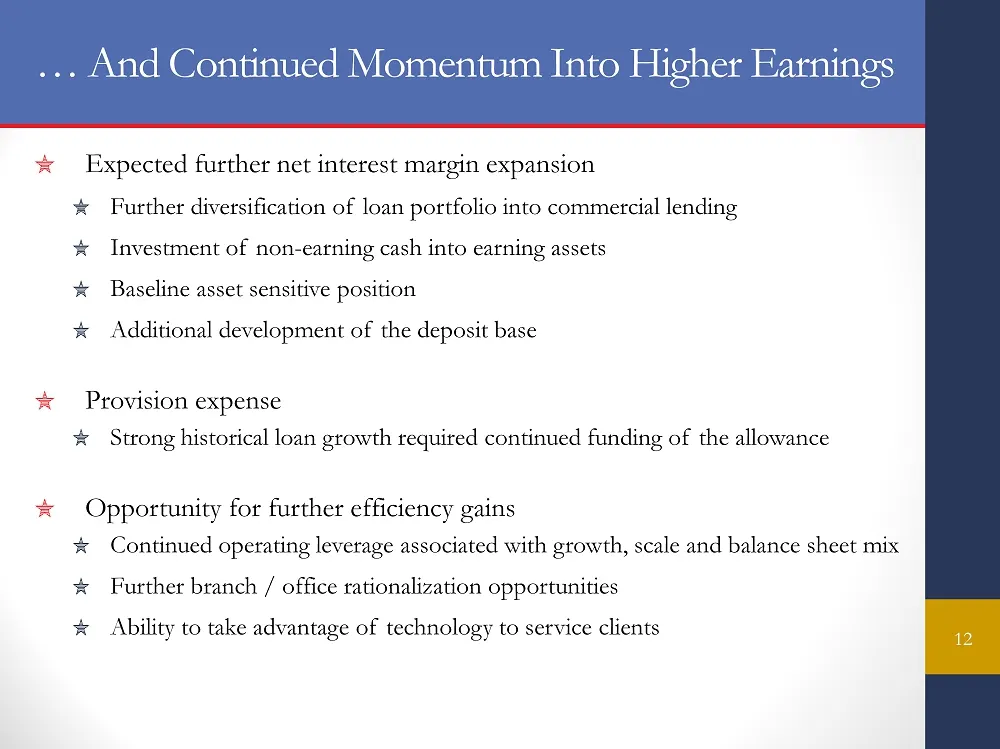
Slide 11: … And Continued Momentum Into Higher Earnings
40 54 88 204 153 0 82 109 176 152 154 172 220 89 36 180 179 146 … And Continued Momentum Into Higher Earnings Expected further net interest margin expansion Further diversification of loan portfolio into commercial lending Investment of non - earning cash into earning assets Baseline asset sensitive
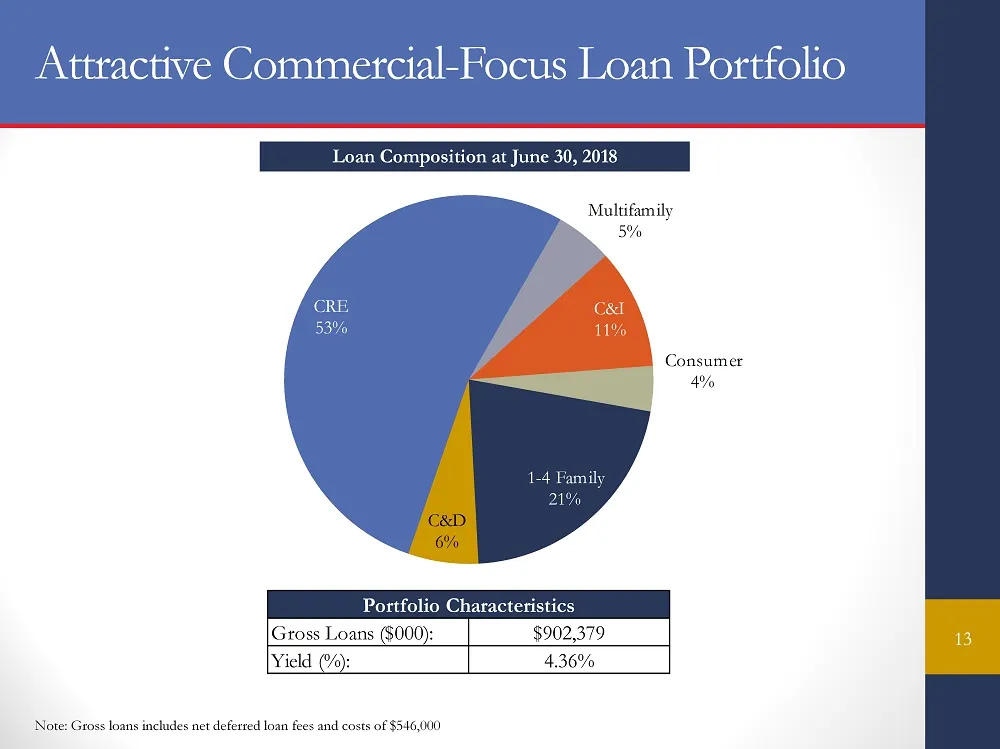
Slide 12: Attractive Commercial-Focus Loan Portfolio
40 54 88 204 153 0 82 109 176 152 154 172 220 89 36 180 179 146 Attractive Commercial - Focus Loan Portfolio 13 Note: Gross loans includes net deferred loan fees and costs of $546,000 Loan Composition at June 30, 2018 1 - 4 Family 21% C&D 6% CRE 53% Multifamily 5% C&I 11% Consumer 4% Portfolio Chara
Slide 13: Commercial Real Estate Portfolio
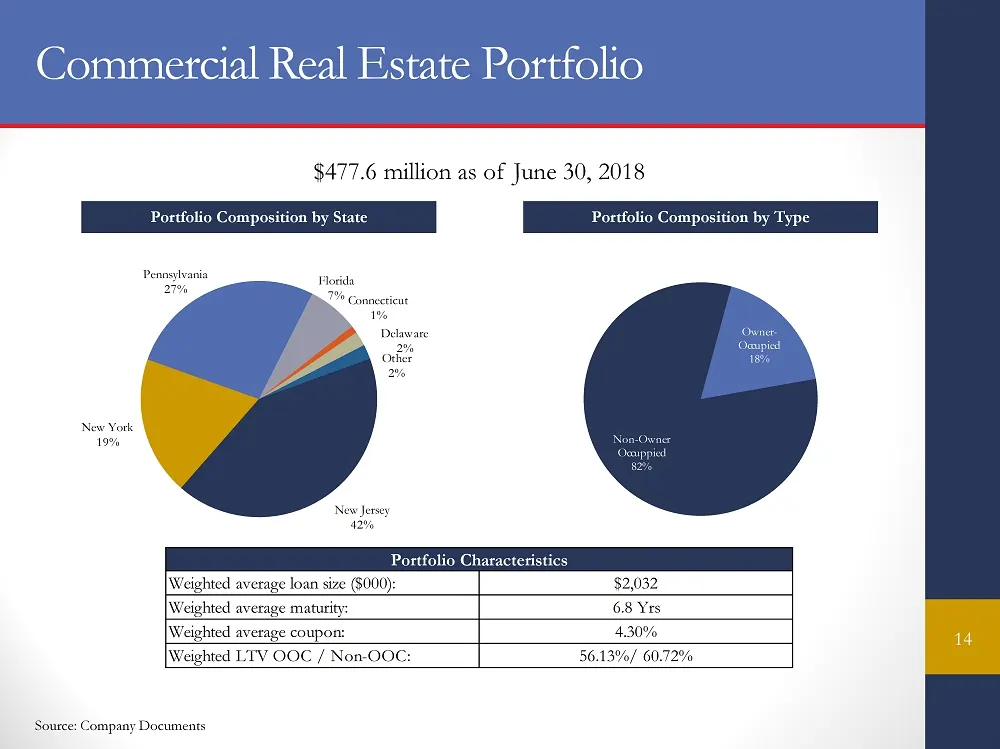
40 54 88 204 153 0 82 109 176 152 154 172 220 89 36 180 179 146 New Jersey 42% New York 19% Pennsylvania 27% Florida 7% Connecticut 1% Delaware 2% Other 2% Commercial Real Estate Portfolio 14 Source: Company Documents Portfolio Composition by Type Portfolio Composition by State $ 477.6 million as of
Slide 14: Historically Strong Credit Metrics
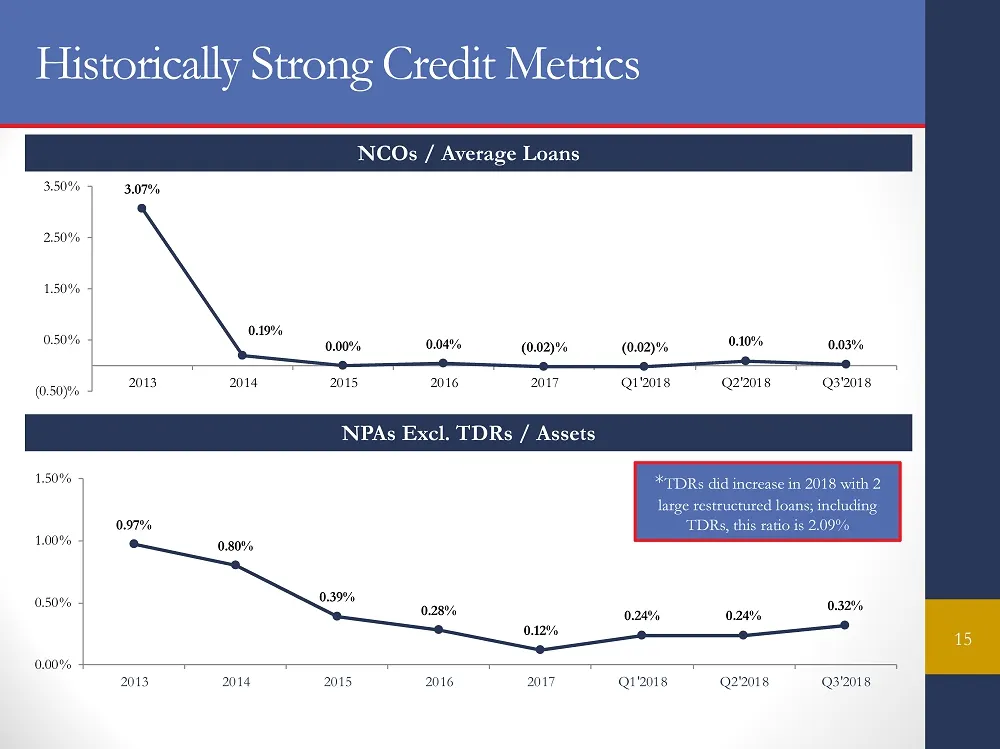
40 54 88 204 153 0 82 109 176 152 154 172 220 89 36 180 179 146 0.97% 0.80% 0.39% 0.28% 0.12% 0.24% 0.24% 0.32% 0.00% 0.50% 1.00% 1.50% 2013 2014 2015 2016 2017 Q1'2018 Q2'2018 Q3'2018 Historically Strong Credit Metrics 15 NCOs / Average Loans * TDRs did increase in 2018 with 2 large restructured lo
Slide 15: Continued Transformation of the Deposit Base
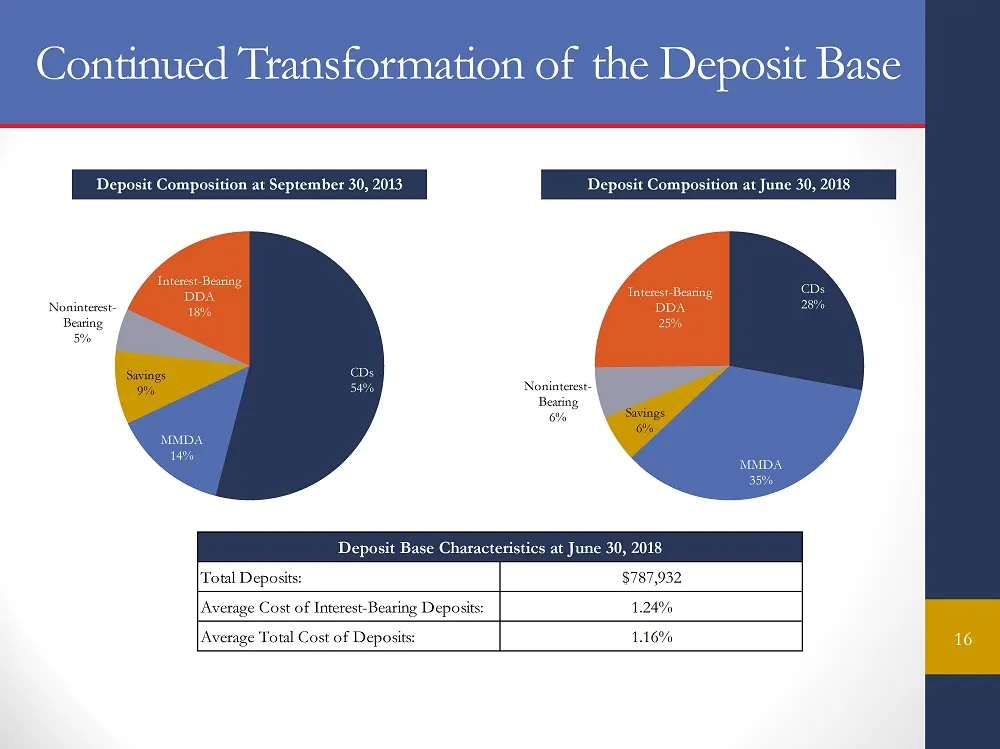
40 54 88 204 153 0 82 109 176 152 154 172 220 89 36 180 179 146 CDs 28% MMDA 35% Savings 6% Noninterest - Bearing 6% Interest - Bearing DDA 25% CDs 54% MMDA 14% Savings 9% Noninterest - Bearing 5% Interest - Bearing DDA 18% Continued Transformation of the Deposit Base 16 Deposit Composition at Septe
Slide 16: Pro Forma Capitalization
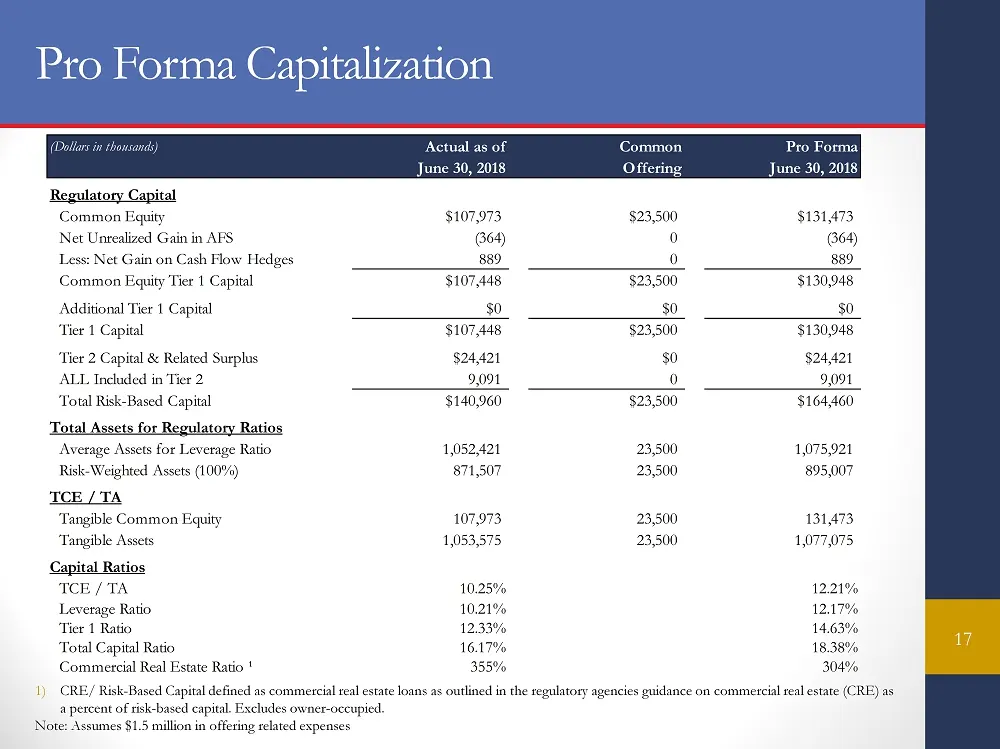
40 54 88 204 153 0 82 109 176 152 154 172 220 89 36 180 179 146 Pro Forma Capitalization 17 (Dollars in thousands) Actual as of Common Pro Forma June 30, 2018 Offering June 30, 2018 Regulatory Capital Common Equity $107,973 $23,500 $131,473 Net Unrealized Gain in AFS (364) 0 (364) Less: Net Gain on
Slide 17: Recapping Future Growth Opportunities
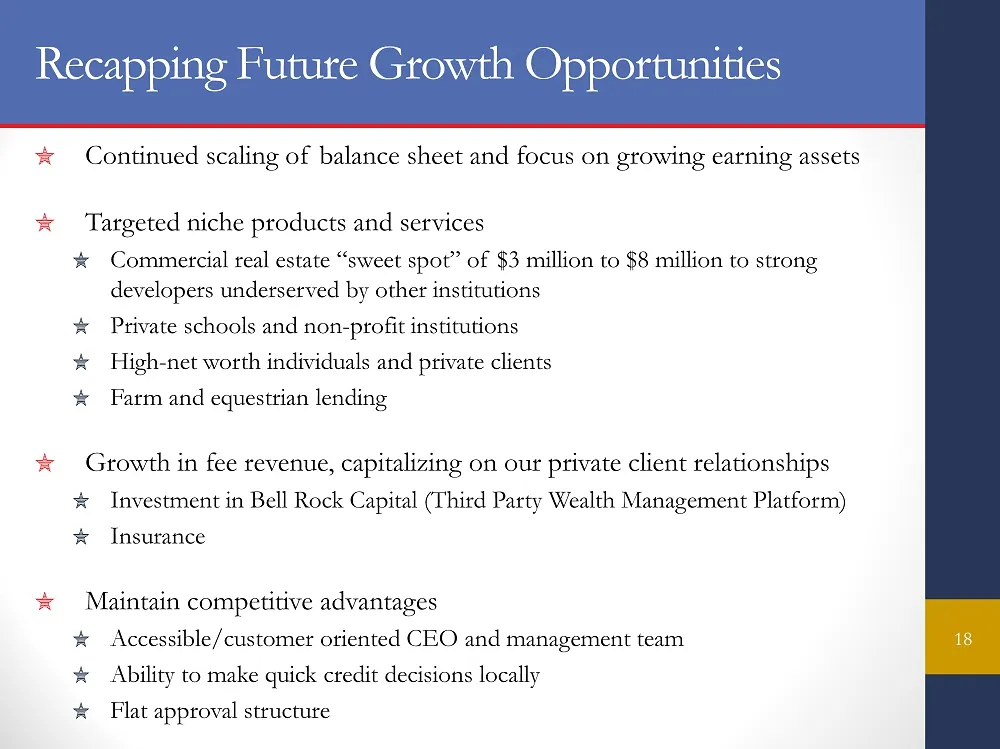
40 54 88 204 153 0 82 109 176 152 154 172 220 89 36 180 179 146 Recapping Future Growth Opportunities Continued scaling of balance sheet and focus on growing earning assets Targeted niche products and services Commercial real estate “sweet spot” of $3 million to $8 million to strong developers under
Slide 18: Recapping Investment Highlights
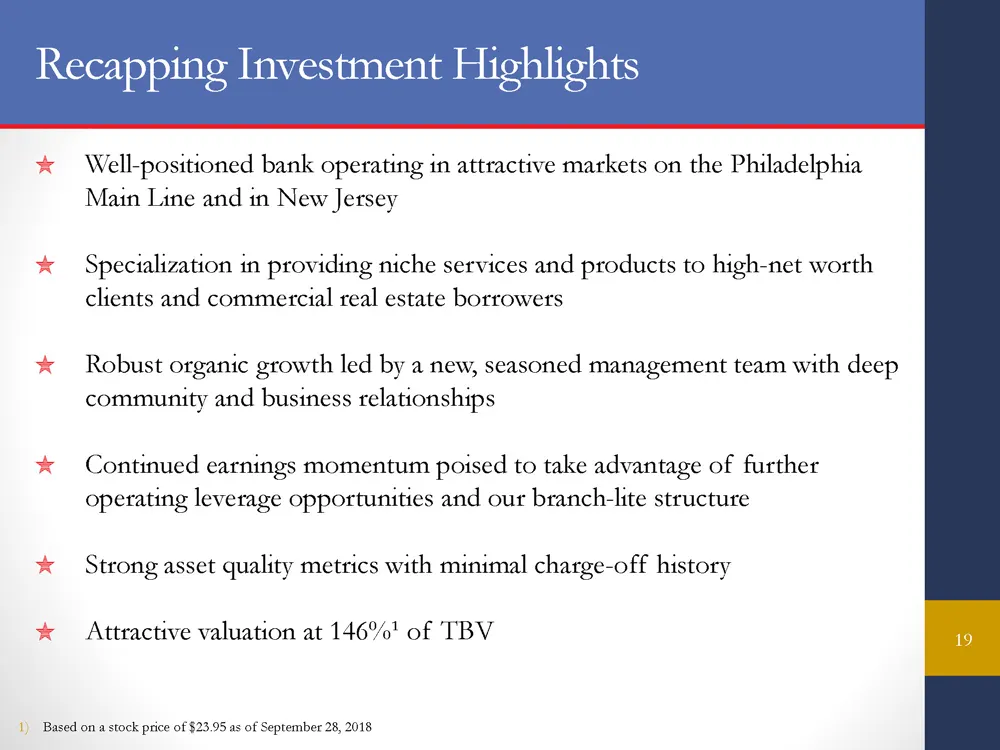
40 54 88 204 153 0 82 109 176 152 154 172 220 89 36 180 179 146 Recapping Investment Highlights Well - positioned bank operating in attractive markets on the Philadelphia Main Line and in New Jersey Specialization in providing niche services and products to high - net worth clients and commercial re
Slide 19: Contact Information
40 54 88 204 153 0 82 109 176 152 154 172 220 89 36 180 179 146 Contact Information 20 Contacts Corporate Headquarters 42 E. Lancaster Avenue Paoli, PA 19301 Tony Weagley President & CEO Joe Gangemi SVP & CFO Office: (610) 695 - 3648 Email: tweagley@mymalvernbank.com Office: (610) 695 - 3676 Email:

Slide 20: Appendix
40 54 88 204 153 0 82 109 176 152 154 172 220 89 36 180 179 146 APPENDIX
Slide 21: Interest Rate Sensitivity
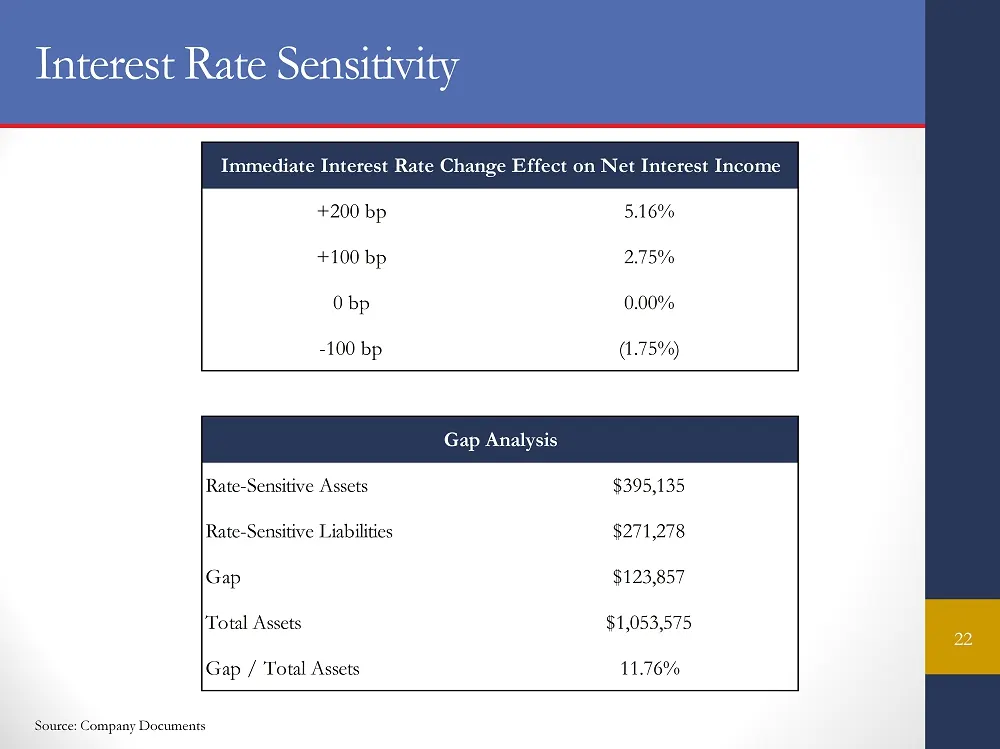
40 54 88 204 153 0 82 109 176 152 154 172 220 89 36 180 179 146 Interest Rate Sensitivity 22 Source: Company Documents Immediate Interest Rate Change Effect on Net Interest Income +200 bp 5.16% +100 bp 2.75% 0 bp 0.00% -100 bp (1.75%) Gap Analysis Rate-Sensitive Assets $395,135 Rate-Sensitive Liabil
Slide 22: Historical Financial Statements
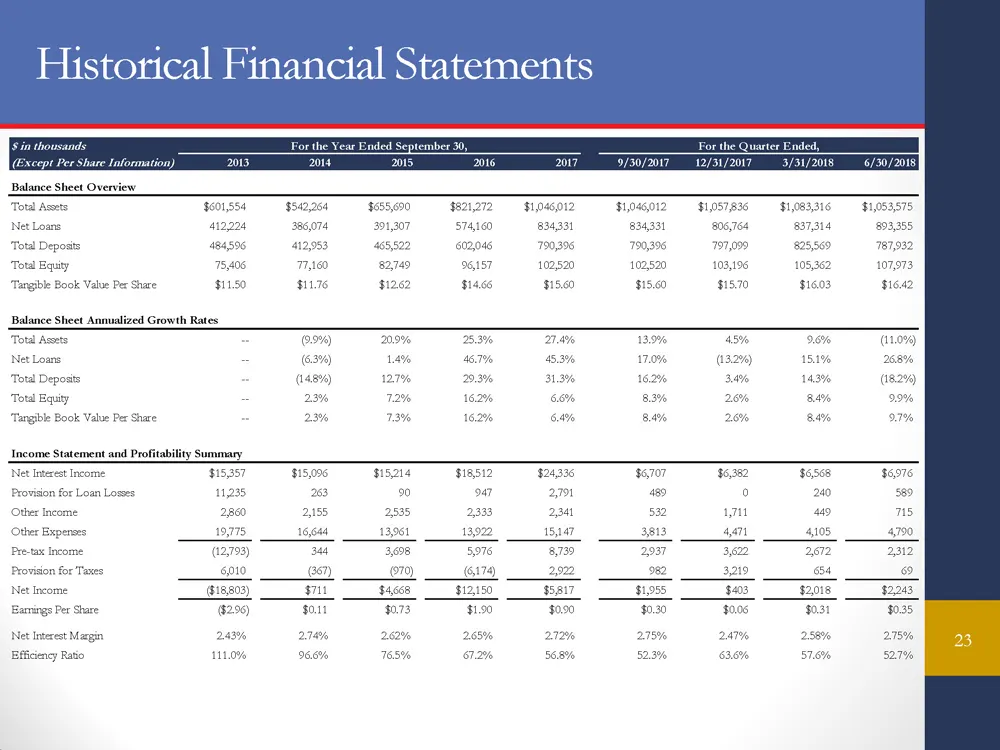
40 54 88 204 153 0 82 109 176 152 154 172 220 89 36 180 179 146 Historical Financial Statements 23 $ in thousands For the Year Ended September 30, For the Quarter Ended, (Except Per Share Information) 2013 2014 2015 2016 2017 9/30/2017 12/31/2017 3/31/2018 6/30/2018 Balance Sheet Overview Total Asse
Slide 23: GAAP to Non-GAAP Reconciliation
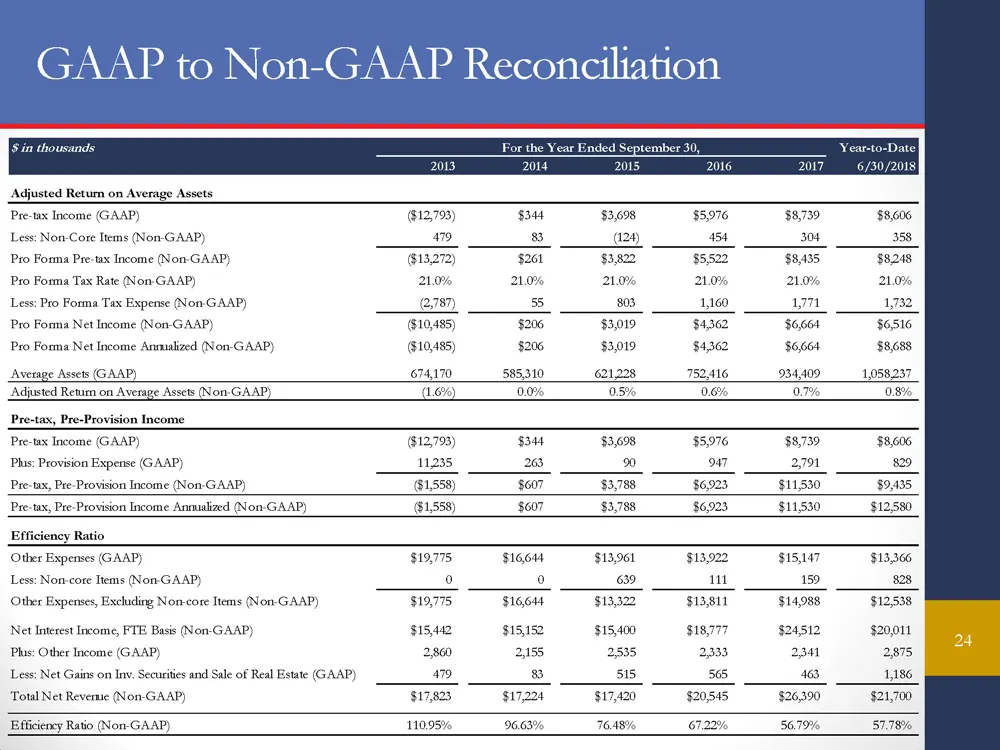
40 54 88 204 153 0 82 109 176 152 154 172 220 89 36 180 179 146 GAAP to Non - GAAP Reconciliation 24 $ in thousands For the Year Ended September 30, Year-to-Date 2013 2014 2015 2016 2017 6/30/2018 Adjusted Return on Average Assets Pre-tax Income (GAAP) ($12,793) $344 $3,698 $5,976 $8,739 $8,606 Less
Slide 24: GAAP to Non-GAAP Reconciliation
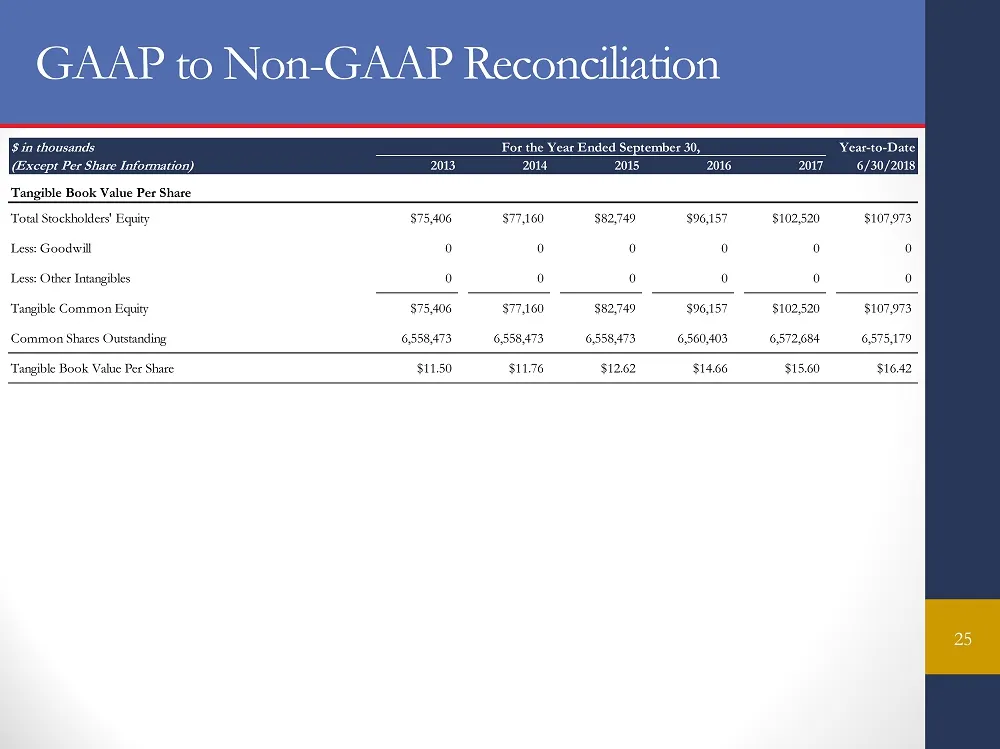
40 54 88 204 153 0 82 109 176 152 154 172 220 89 36 180 179 146 GAAP to Non - GAAP Reconciliation 25 $ in thousands For the Year Ended September 30, Year-to-Date (Except Per Share Information) 2013 2014 2015 2016 2017 6/30/2018 Tangible Book Value Per Share Total Stockholders' Equity $75,406 $77,160
Slide 25: GAAP to Non-GAAP Reconciliation
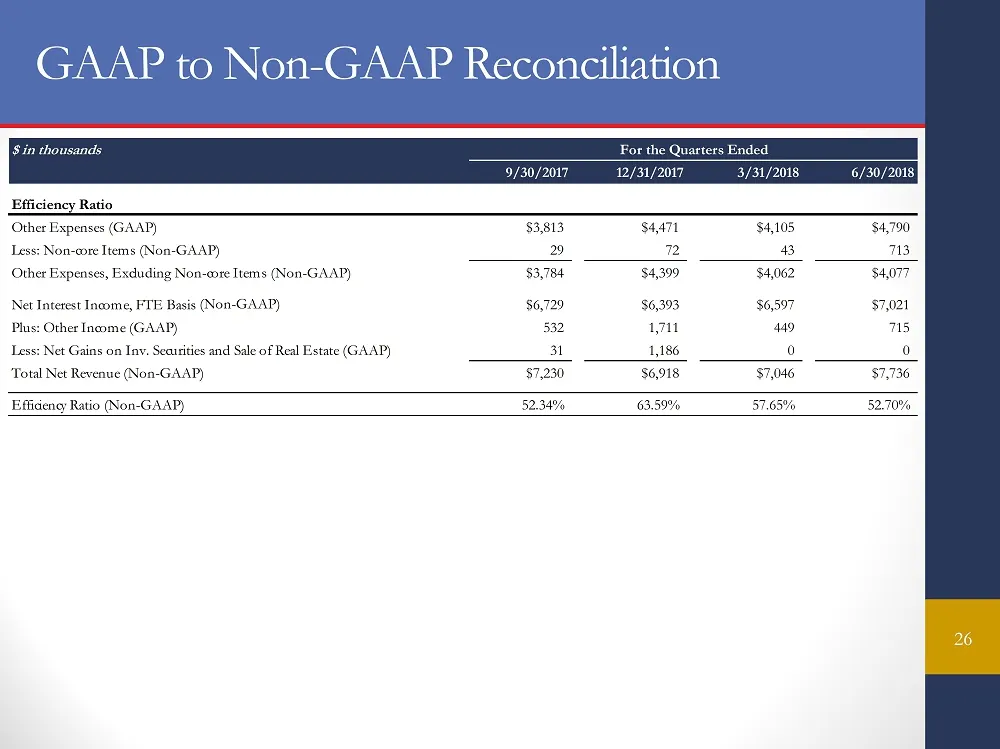
40 54 88 204 153 0 82 109 176 152 154 172 220 89 36 180 179 146 $ in thousands For the Quarters Ended 9/30/2017 12/31/2017 3/31/2018 6/30/2018 Efficiency Ratio Other Expenses (GAAP) $3,813 $4,471 $4,105 $4,790 Less: Non-core Items (Non-GAAP) 29 72 43 713 Other Expenses, Excluding Non-core Items (Non
Source: SEC EDGAR · FWP filed Oct 1, 2018