Hamborner REIT AG · XETR:HABA
Hamborner REIT — Investor Presentation (February 2012)
27 slides from Hamborner REIT's investor presentation, February 2012
Slide 1: Company Presentation
Company Presentation Preliminary figures business year 2011, February 2012
Slide 2: Historical development of the company
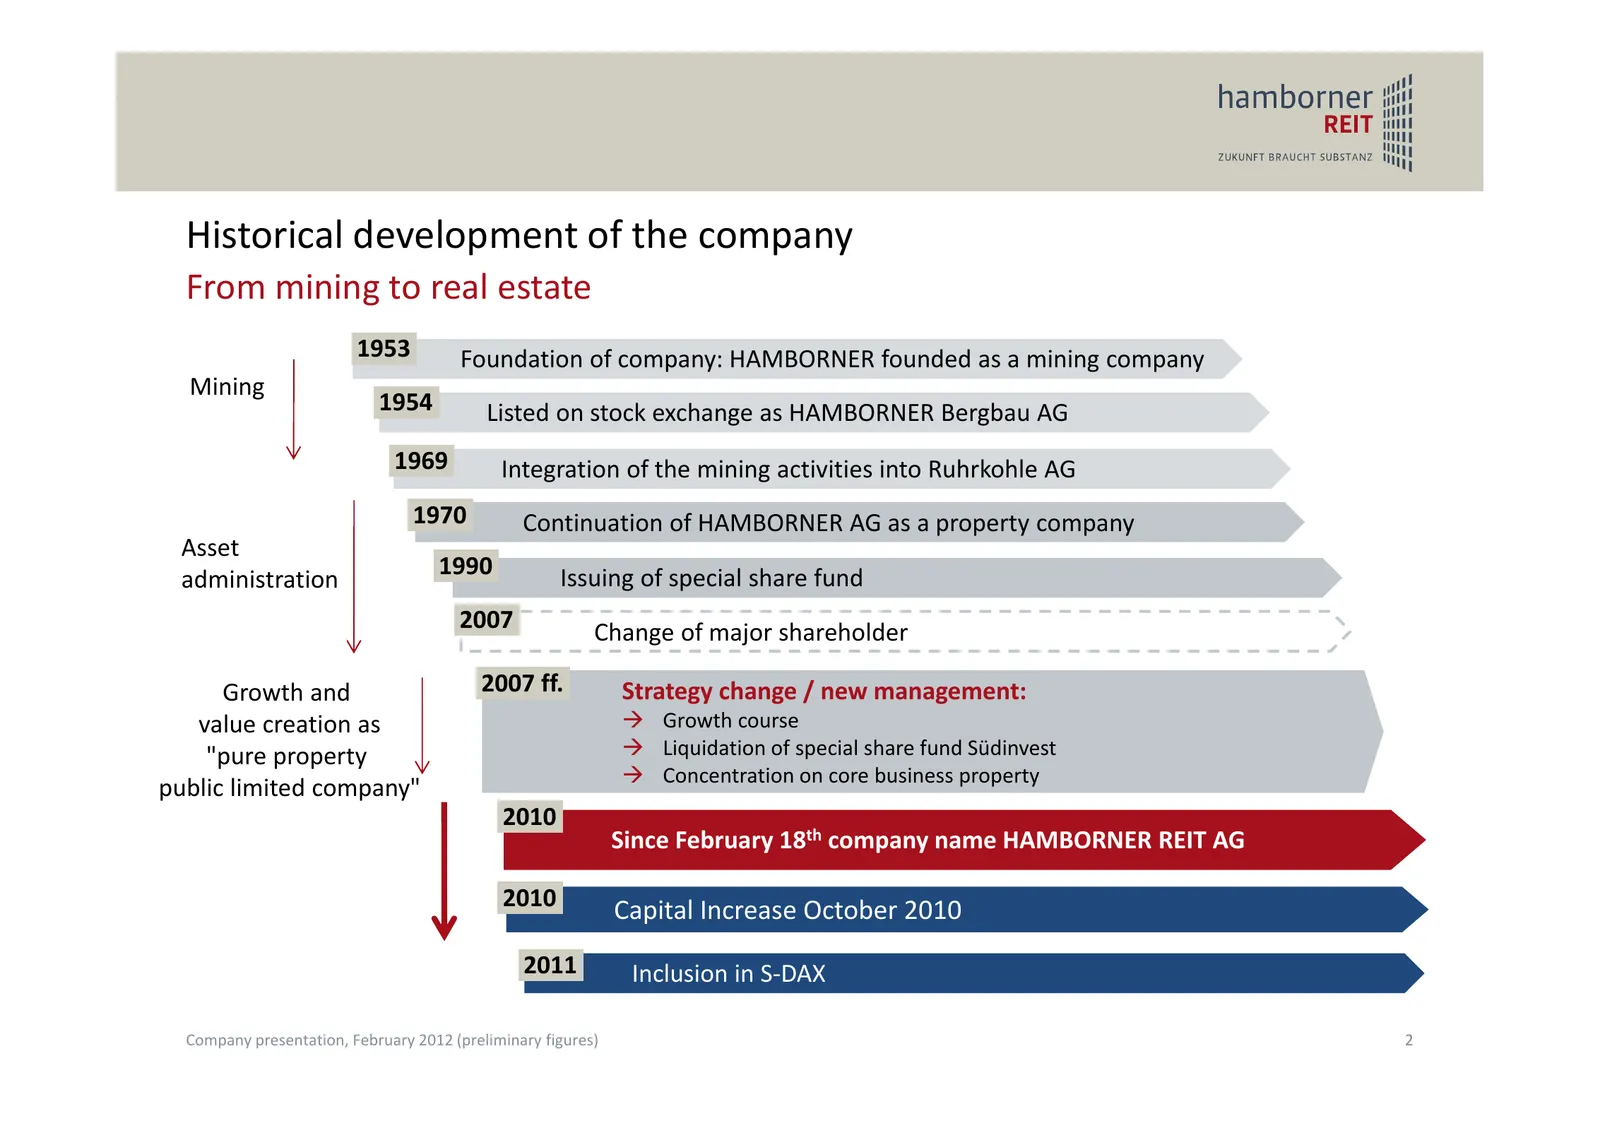
Historical development of the company From mining to real estate 1953 Foundation of company: HAMBORNER founded as a mining company Mining 1954 Listed on stock exchange as HAMBORNER Bergbau AG 1969 Integration of the mining activities into Ruhrkohle AG 1970 Continuation of HAMBORNER AG as a property
Slide 3: Shareholder structure
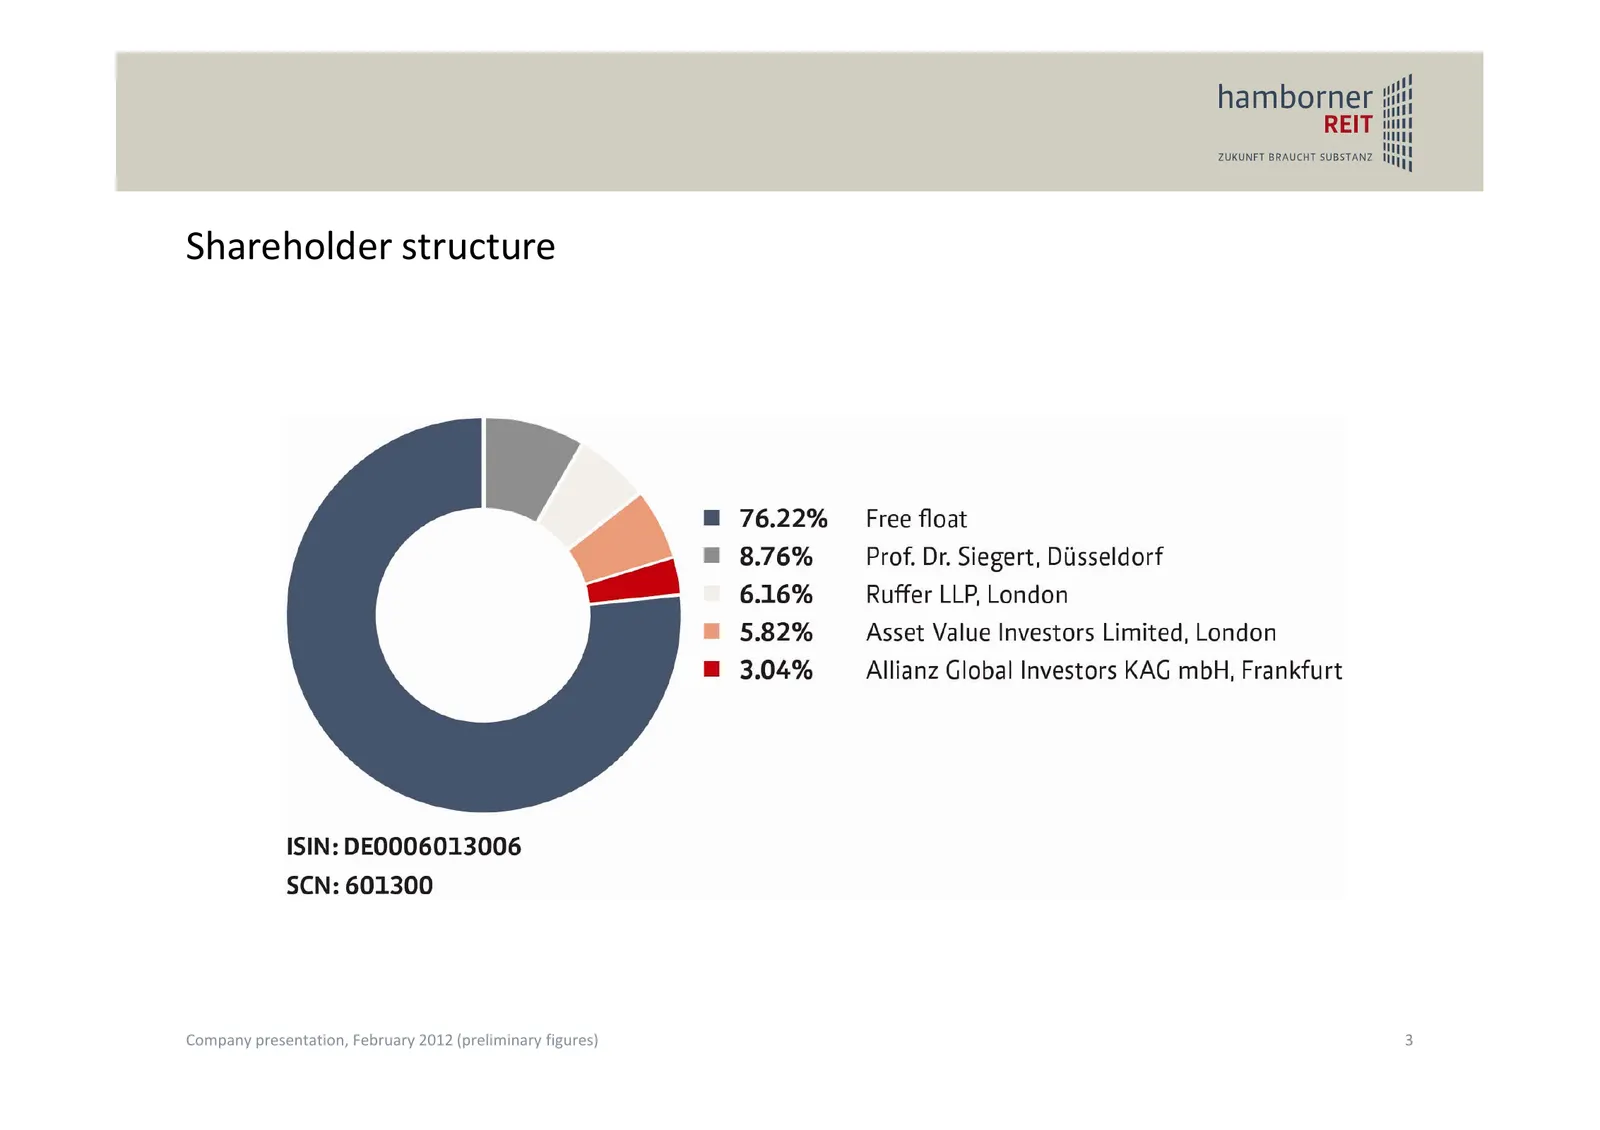
Shareholder structure Company presentation, February 2012 (preliminary figures) 3
Slide 4: Corporate structure
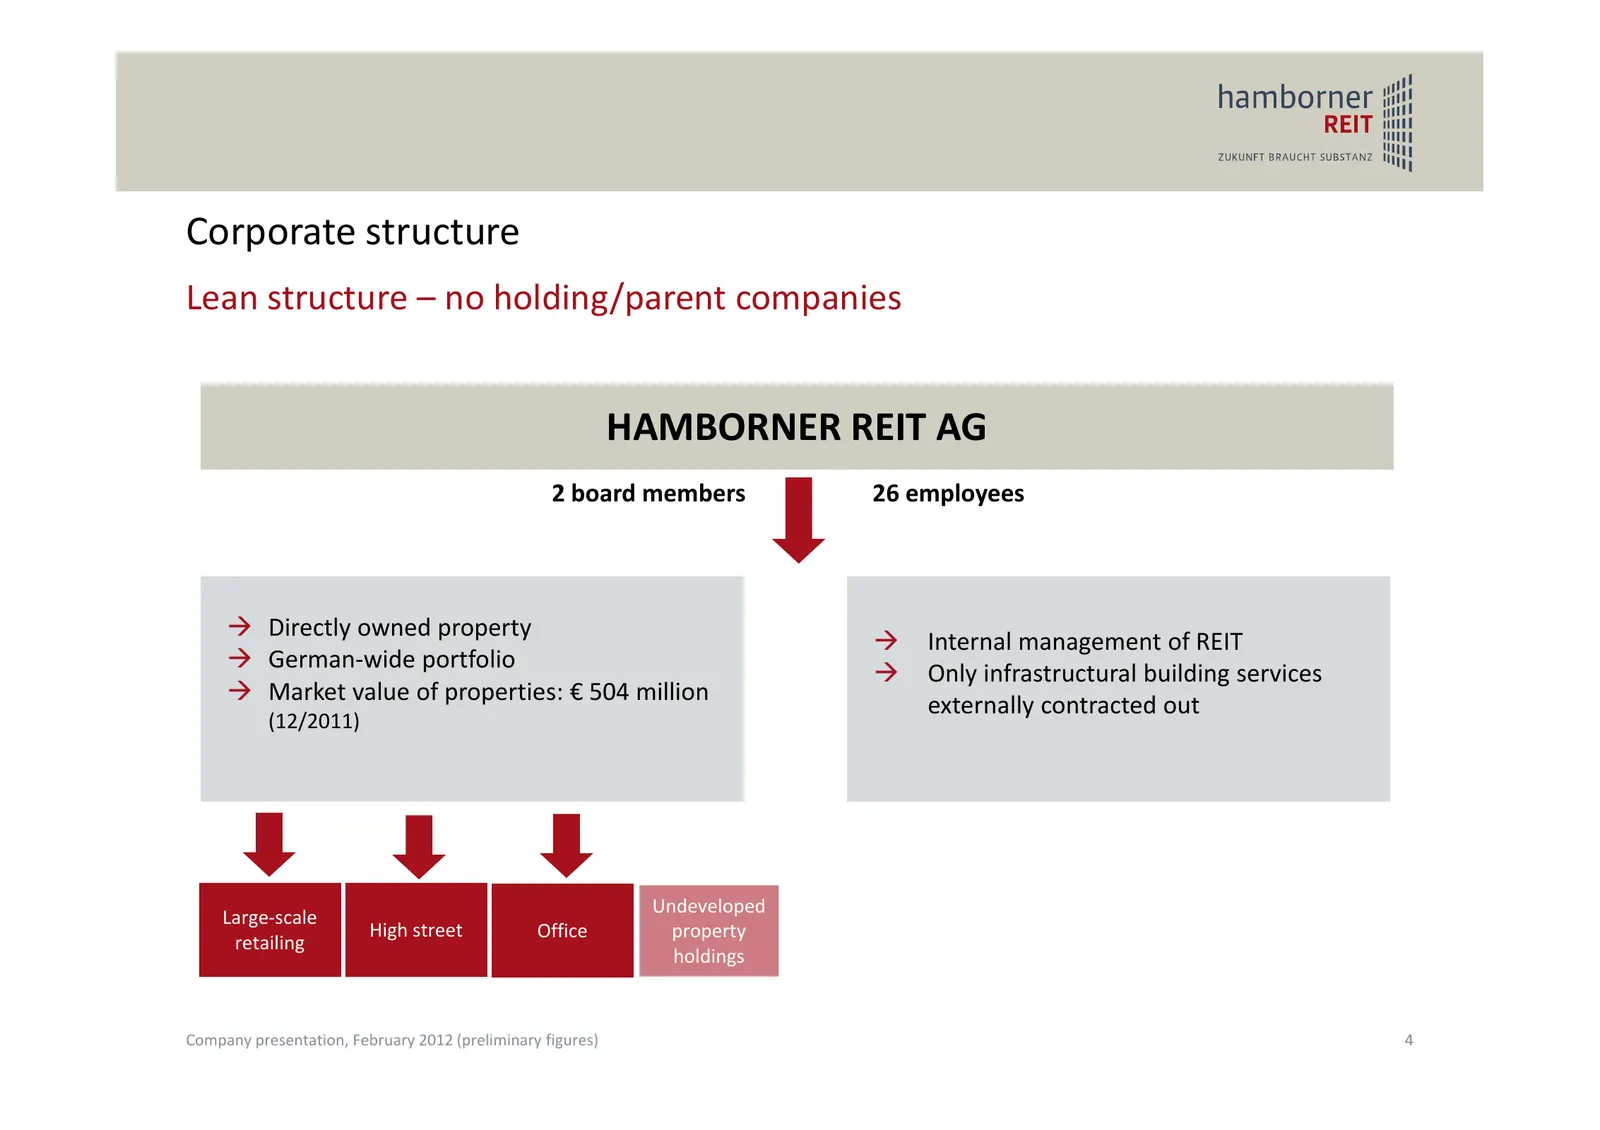
Corporate structure Lean structure – no holding/parent companies HAMBORNER REIT AG 2 board members 26 employees Æ Directly owned property Æ Internal management of REIT Æ German‐wide portfolio Æ Only infrastructural building services Æ Market value of properties: € 504 million externally contracted o
Slide 5: Strategy
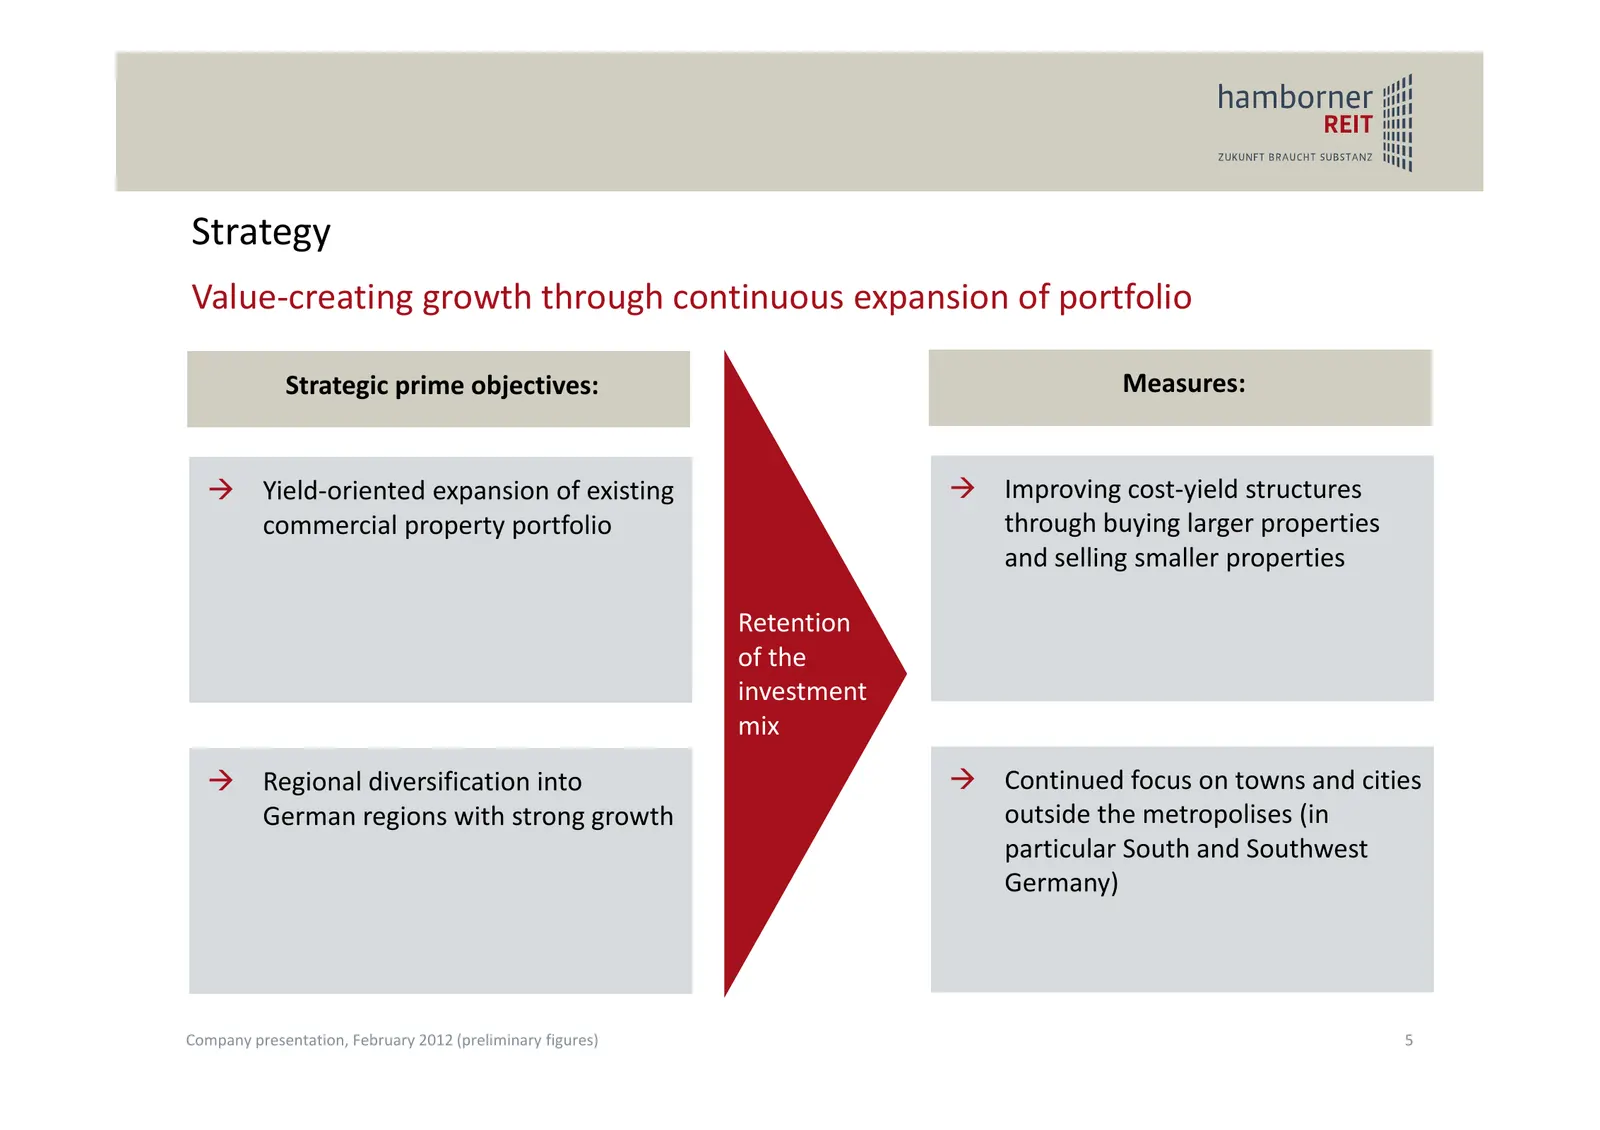
Strategy Value‐creating growth through continuous expansion of portfolio Strategic prime objectives: Measures: Æ Yield‐oriented expansion of existing Æ Improving cost‐yield structures commercial property portfolio through buying larger properties and selling smaller properties Retention of the inves
Slide 6: Current property portfolio (31.12.2011)
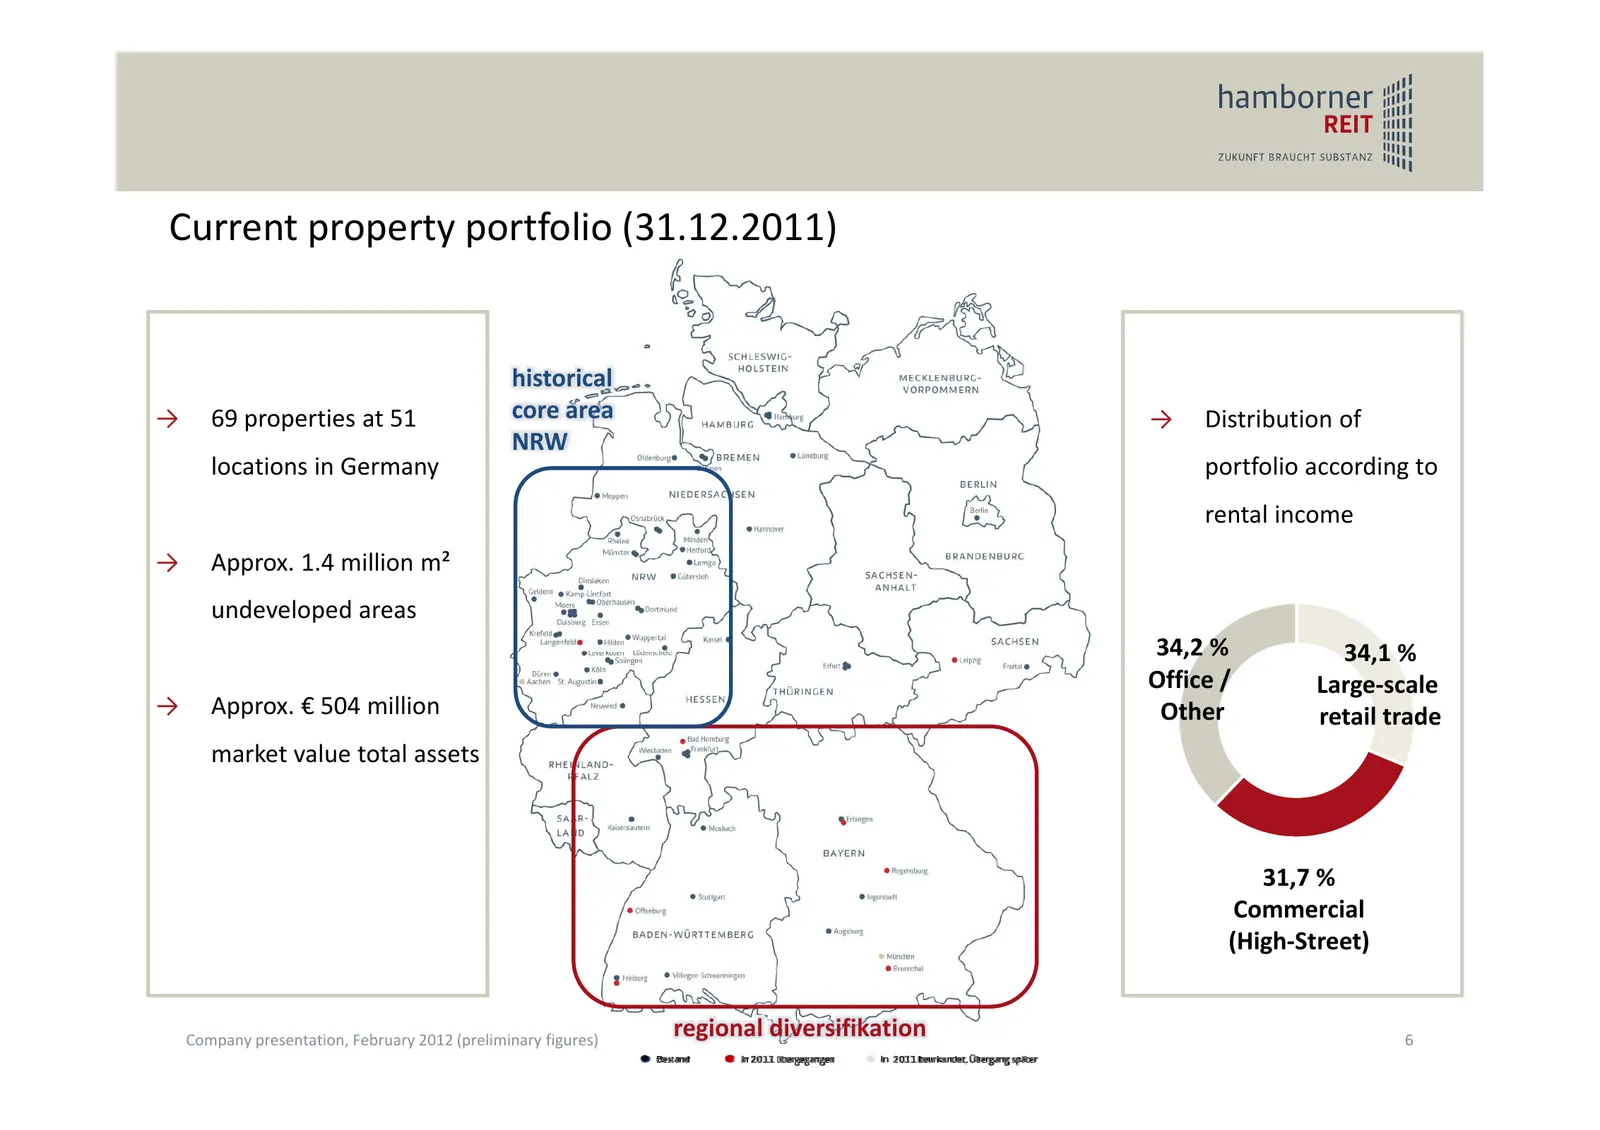
Current property portfolio (31.12.2011) historical → 69 properties at 51 core area → Distribution of NRW locations in Germany portfolio according to rental income → Approx. 1.4 million m² undeveloped areas 34,2 % 34,1 % Office / Large‐scale → Approx. € 504 million Other retail trade market value tot
Slide 7: Development of HAMBORNERs portfolio value
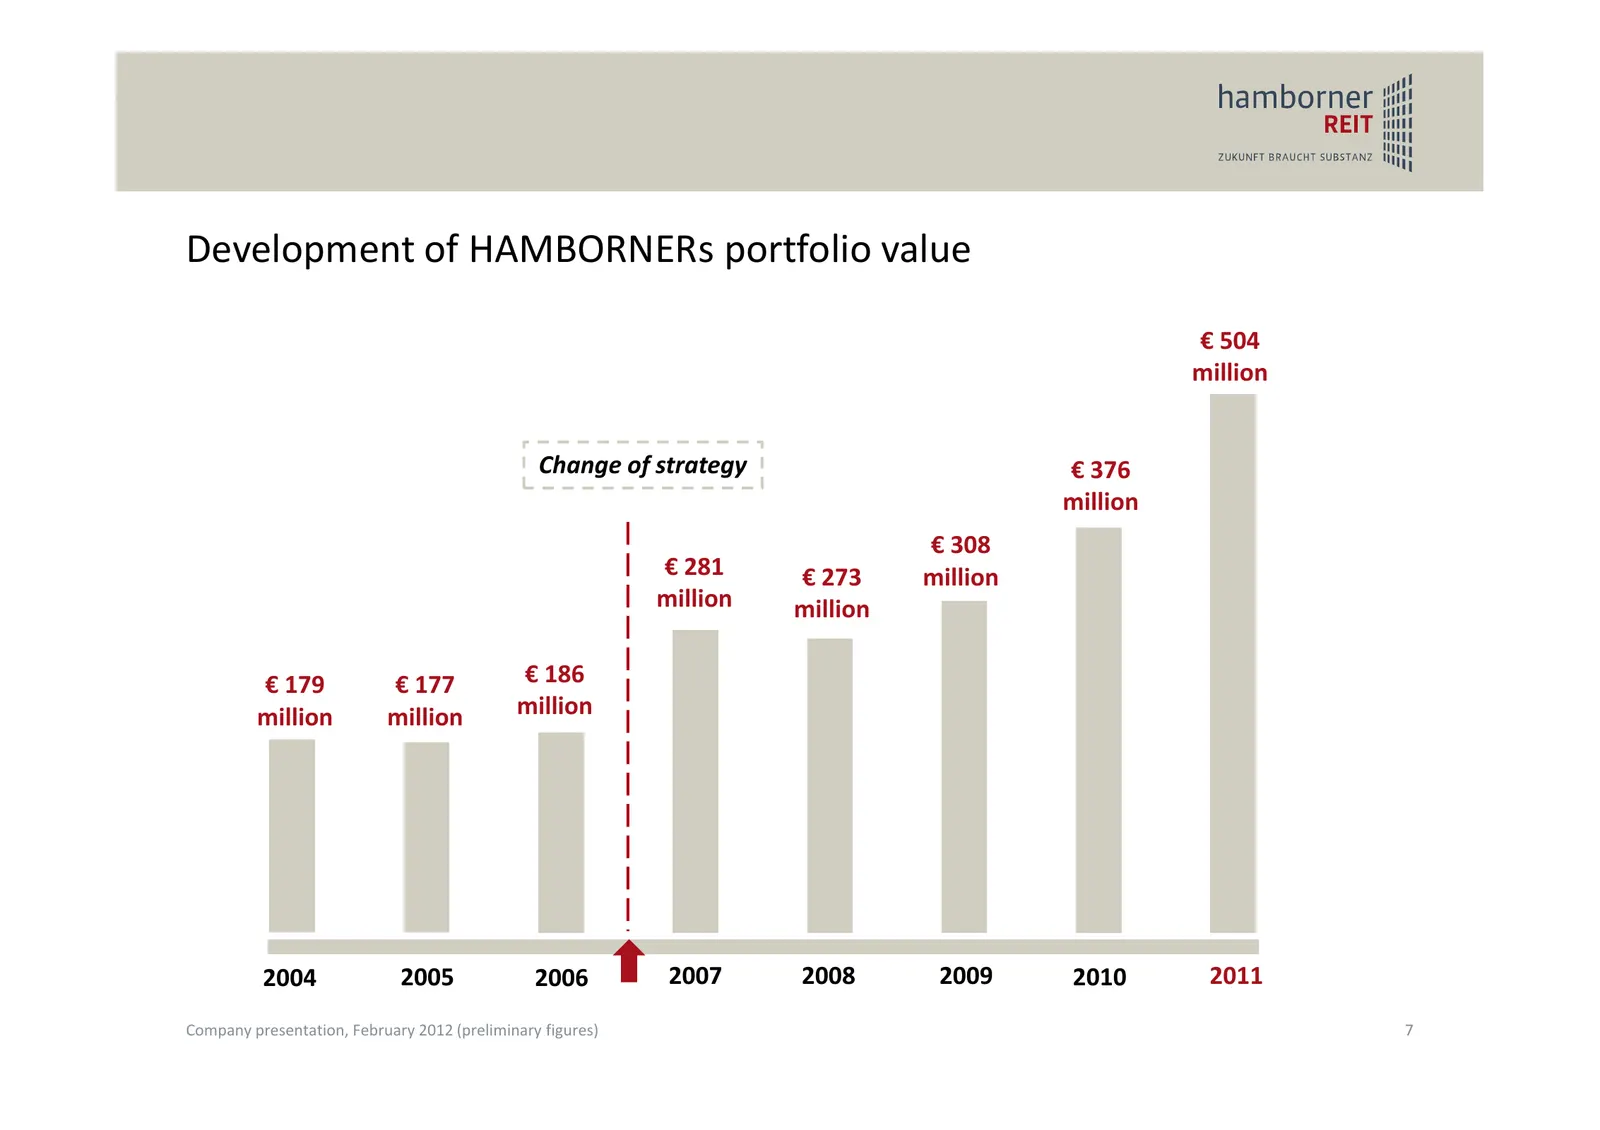
Development of HAMBORNERs portfolio value € 504 million Change of strategy € 376 million € 308 € 281 € 273 million million million € 179 € 177 € 186 million million million 2004 2005 2006 2007 2008 2009 2010 2011 Company presentation, February 2012 (preliminary figures) 7
Slide 8: Latest Investments
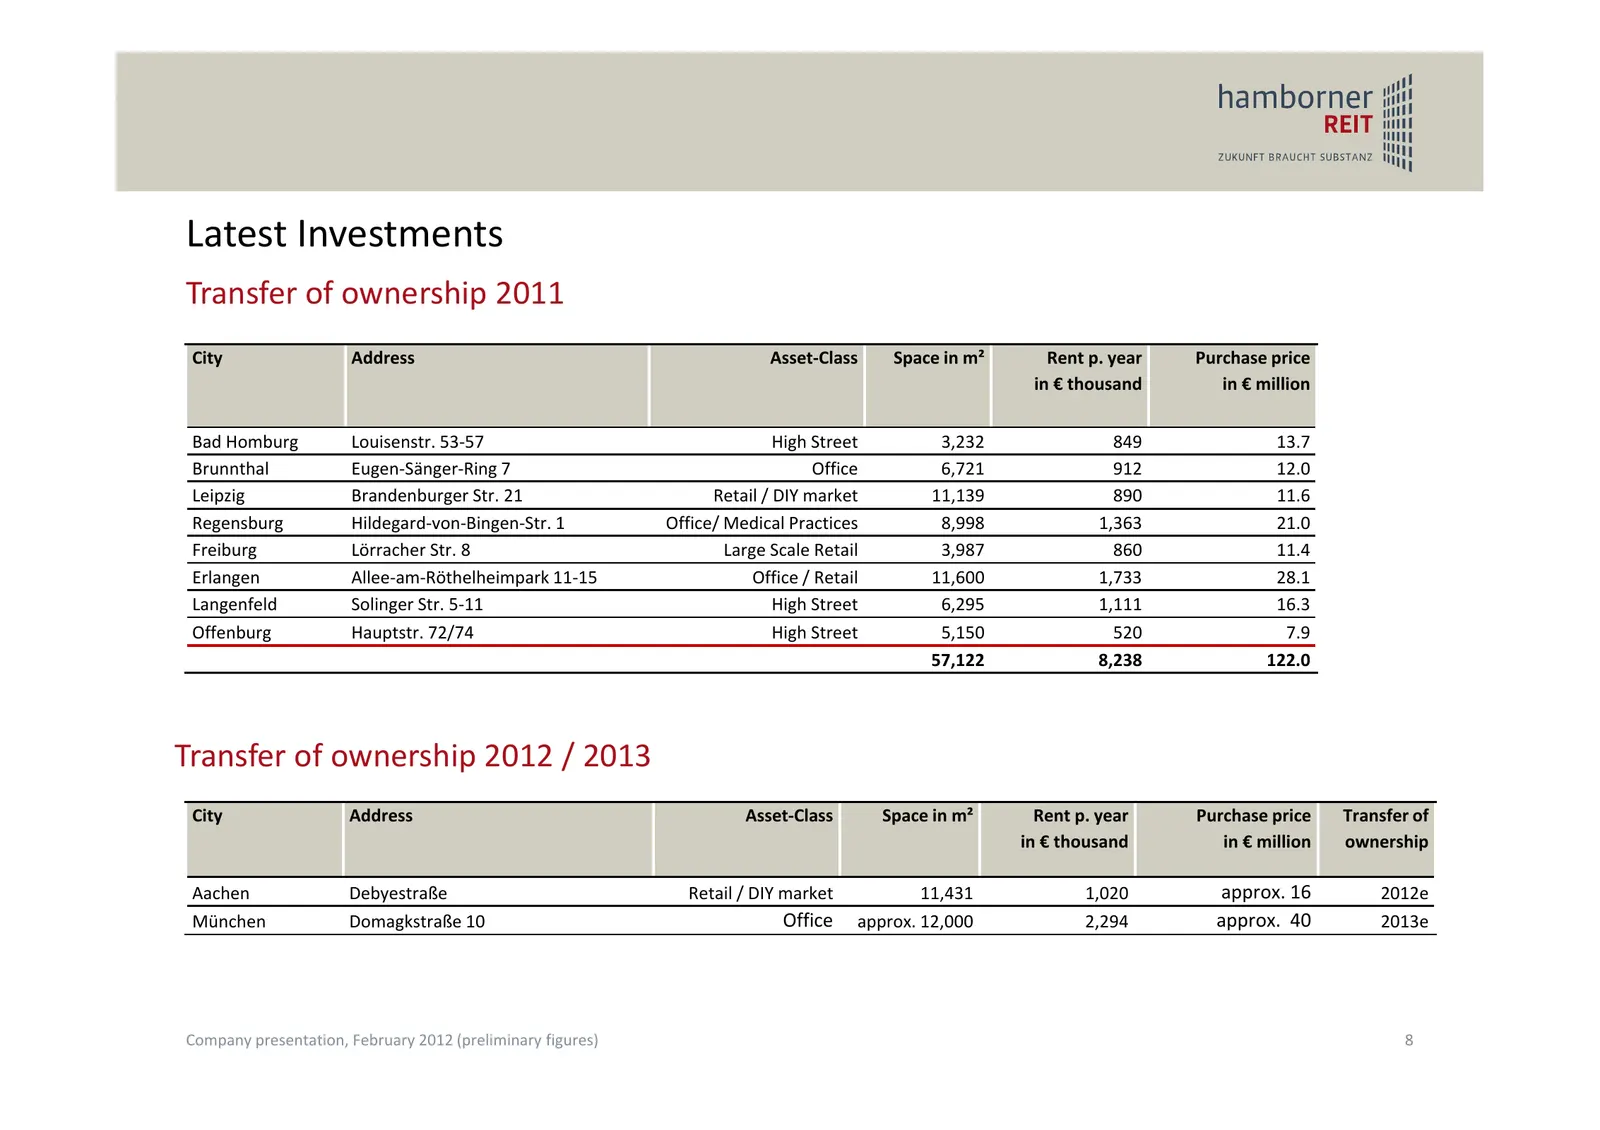
Latest Investments Transfer of ownership 2011 City Address Asset‐Class Space in m² Rent p. year Purchase price in € thousand in € million Bad Homburg Louisenstr. 53‐57 High Street 3,232 849 13.7 Brunnthal Eugen‐Sänger‐Ring 7 Office 6,721 912 12.0 Leipzig Brandenburger Str. 21 Retail / DIY market 11,
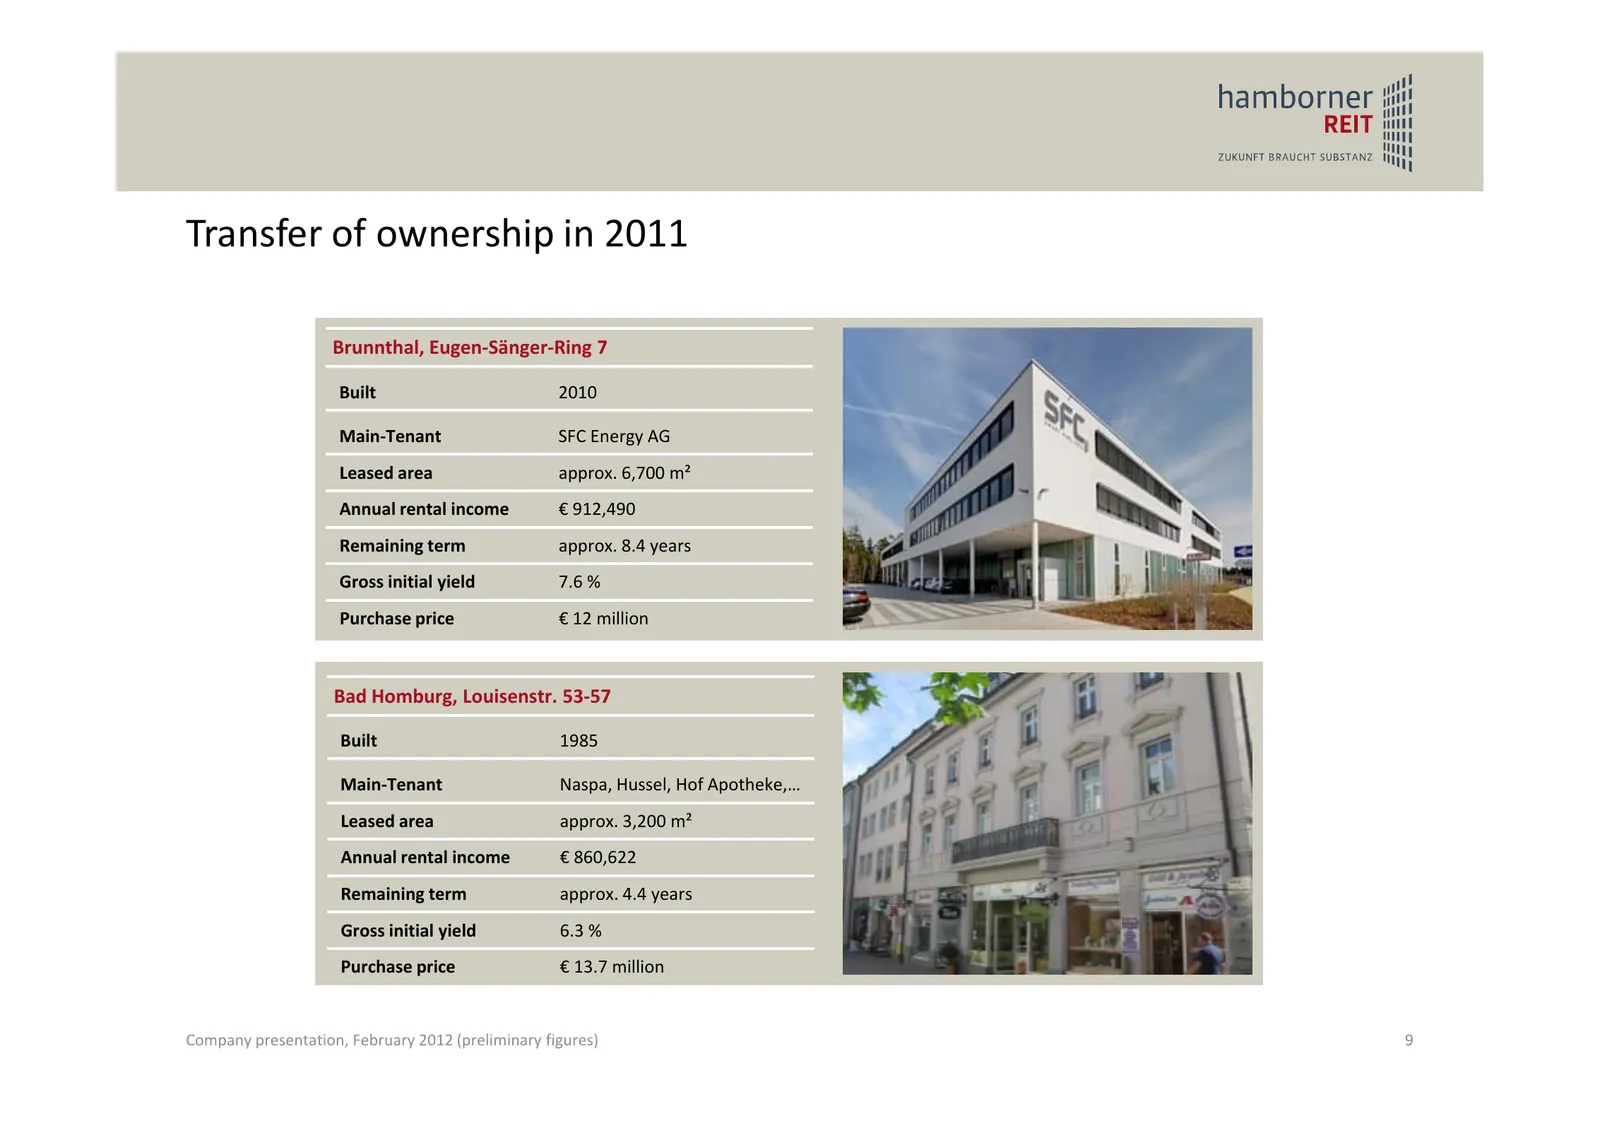
Slide 9: Transfer of ownership in 2011
Transfer of ownership in 2011 Brunnthal, Eugen‐Sänger‐Ring 7 Built 2010 Main‐Tenant SFC Energy AG Leased area approx. 6,700 m² Annual rental income € 912,490 Remaining term approx. 8.4 years Gross initial yield 7.6 % Purchase price € 12 million Bad Homburg, Louisenstr. 53‐57 Built 1985 Main‐Tenant N
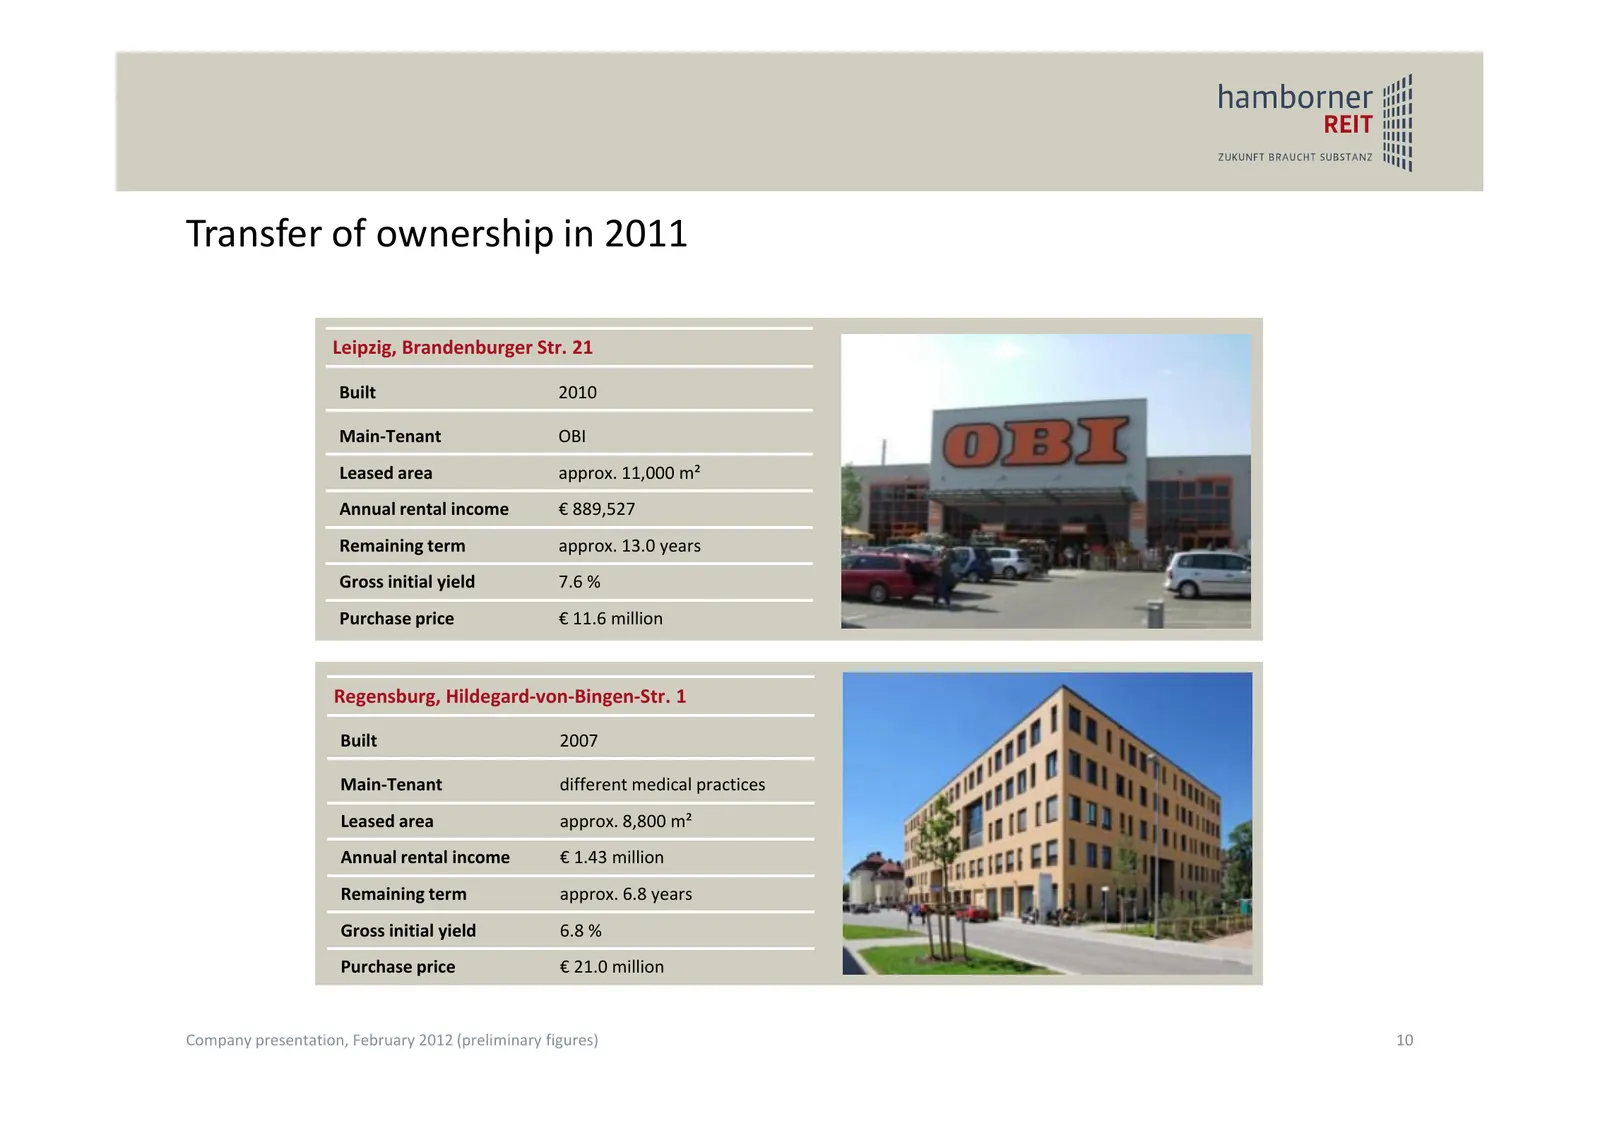
Slide 10: Transfer of ownership in 2011
Transfer of ownership in 2011 Leipzig, Brandenburger Str. 21 Built 2010 Main‐Tenant OBI Leased area approx. 11,000 m² Annual rental income € 889,527 Remaining term approx. 13.0 years Gross initial yield 7.6 % Purchase price € 11.6 million Regensburg, Hildegard‐von‐Bingen‐Str. 1 Built 2007 Main‐Tenan
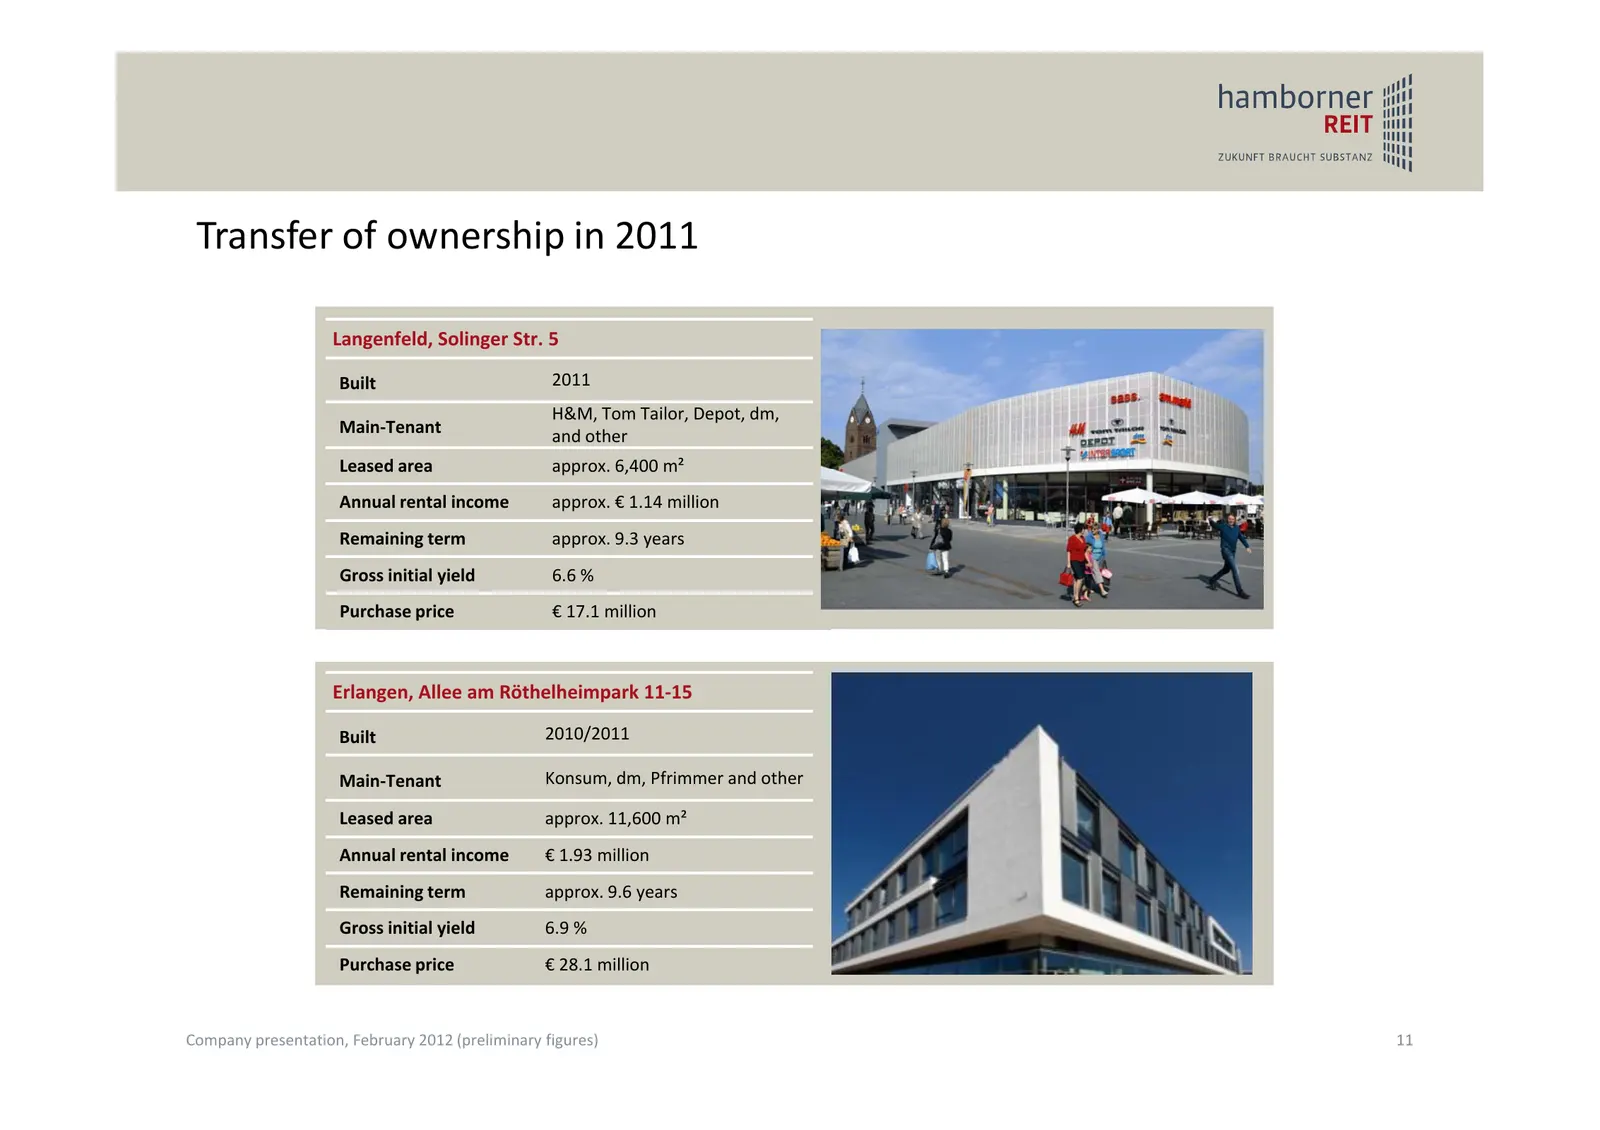
Slide 11: Transfer of ownership in 2011
Transfer of ownership in 2011 Langenfeld, Solinger Str. 5 Built 2011 H&M, Tom Tailor, Depot, dm, Main‐Tenant and other Leased area approx. 6,400 m² Annual rental income approx. € 1.14 million Remaining term approx. 9.3 years Gross initial yield 6.6 % Purchase price € 17.1 million Erlangen, Allee am
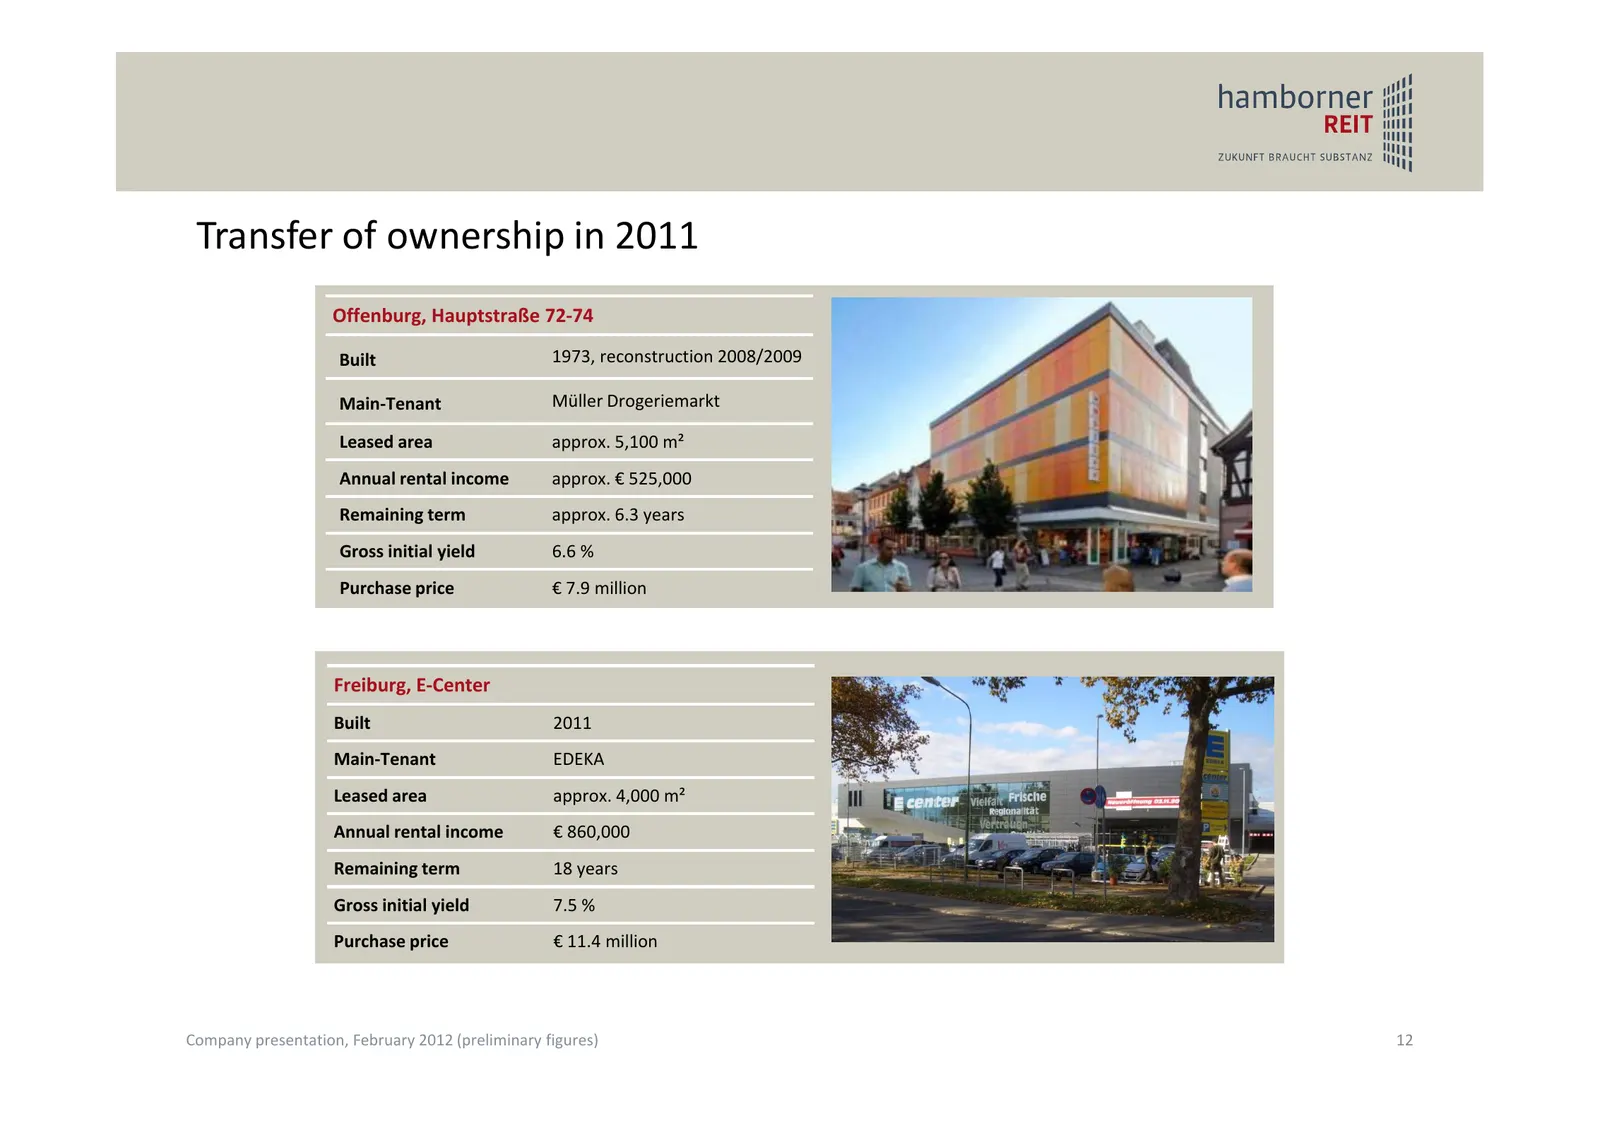
Slide 12: Transfer of ownership in 2011
Transfer of ownership in 2011 Offenburg, Hauptstraße 72‐74 Built 1973, reconstruction 2008/2009 Main‐Tenant Müller Drogeriemarkt Leased area approx. 5,100 m² Annual rental income approx. € 525,000 Remaining term approx. 6.3 years Gross initial yield 6.6 % Purchase price € 7.9 million Freiburg, E‐Cen
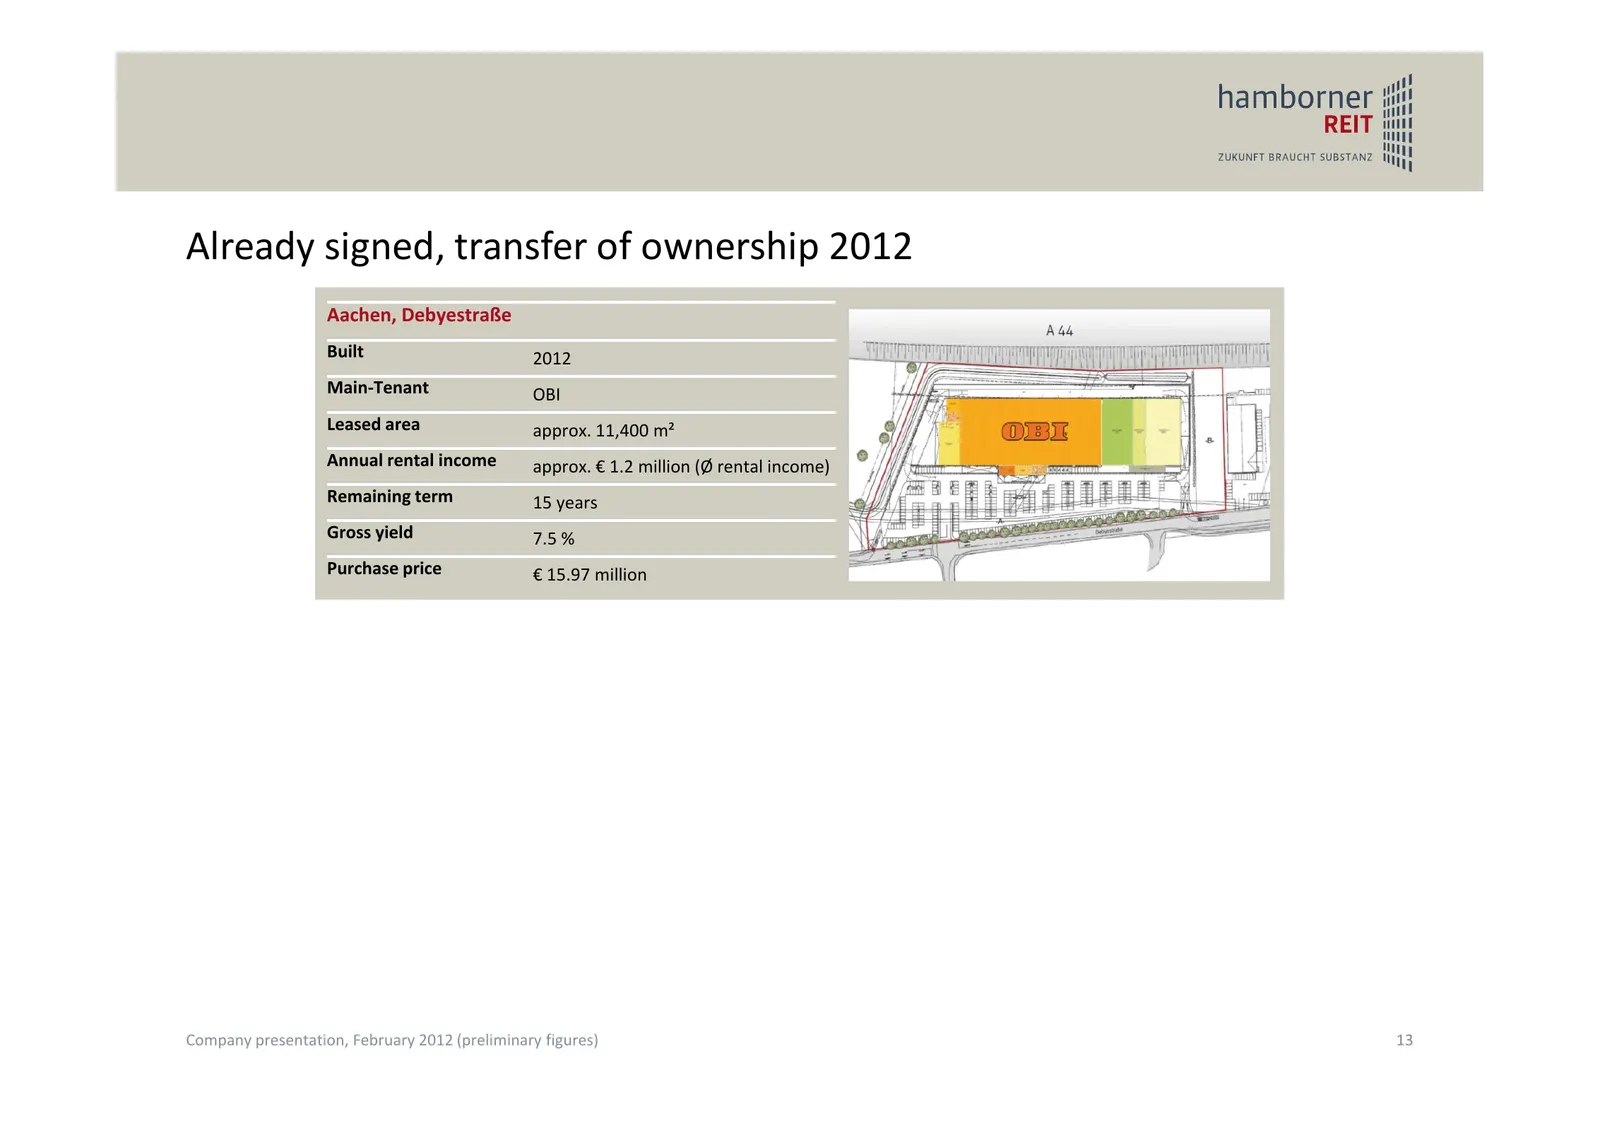
Slide 13: Already signed, transfer of ownership 2012
Already signed, transfer of ownership 2012 Aachen, Debyestraße Built 2012 Main‐Tenant OBI Leased area approx. 11,400 m² Annual rental income approx. € 1.2 million (Ø rental income) Remaining term 15 years Gross yield 7.5 % Purchase price € 15.97 million Company presentation, February 2012 (prelimina
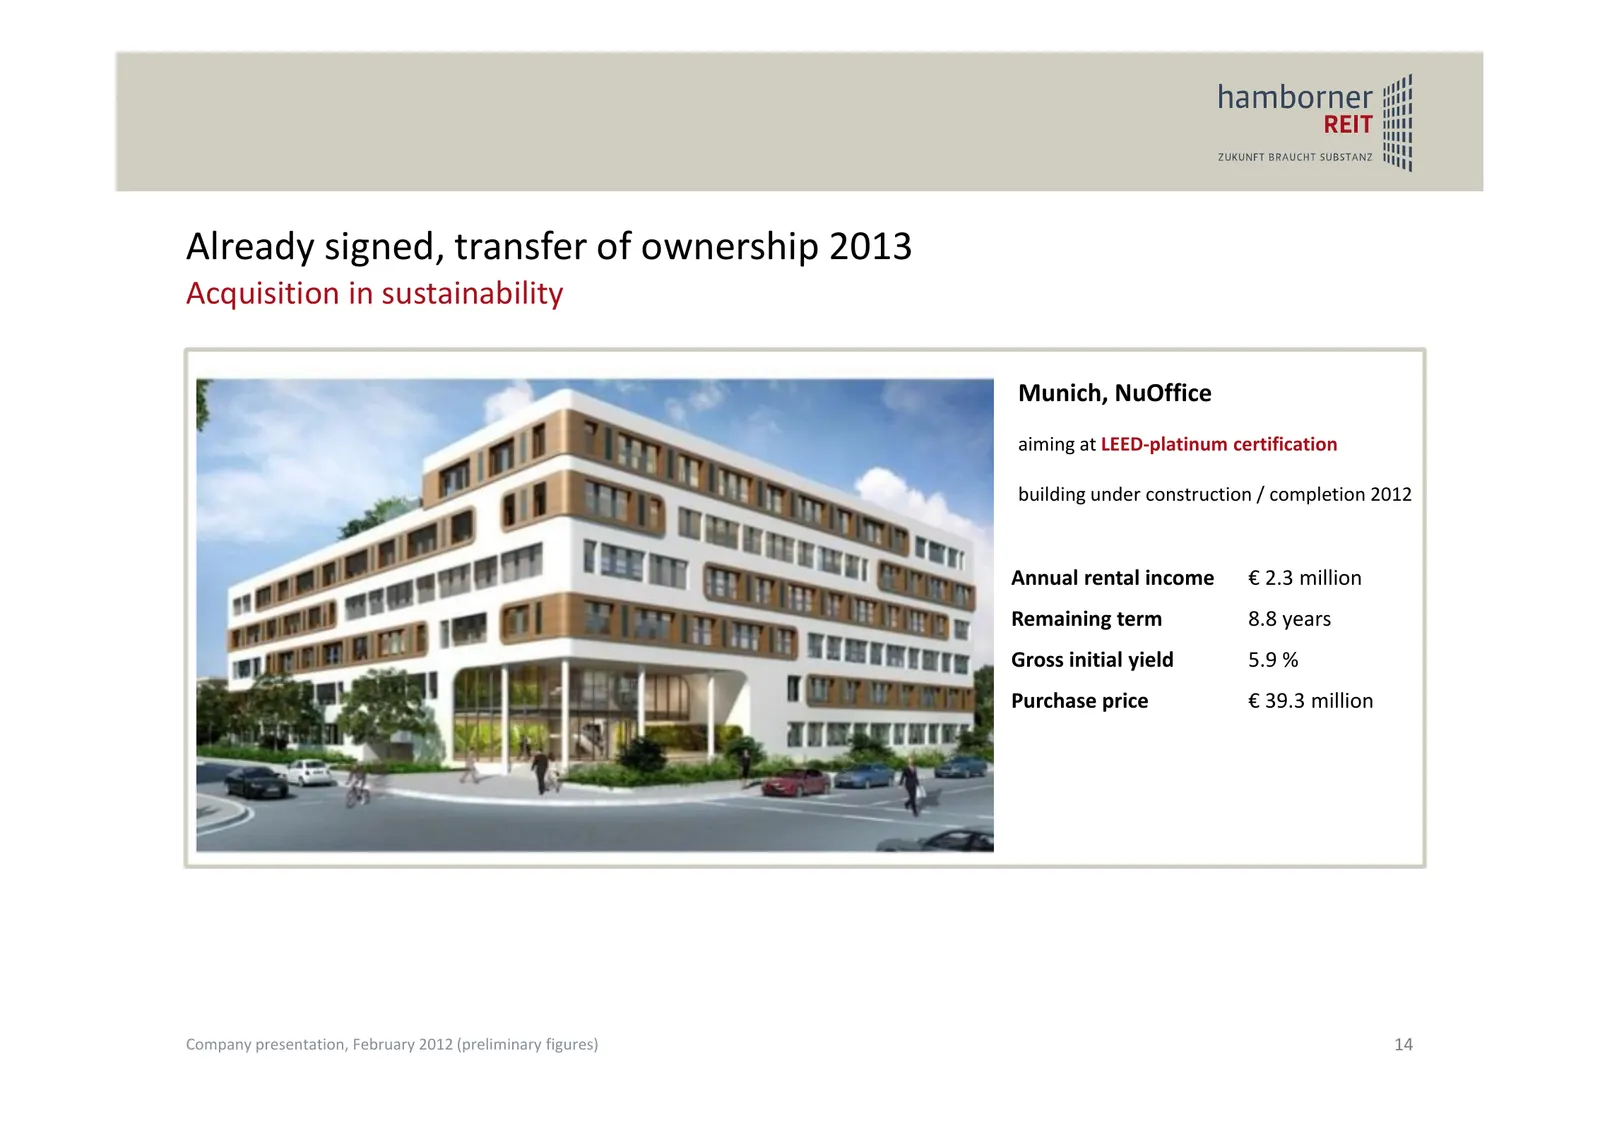
Slide 14: Already signed, transfer of ownership 2013
Already signed, transfer of ownership 2013 Acquisition in sustainability Munich, NuOffice aiming at LEED‐platinum certification building under construction / completion 2012 Annual rental income € 2.3 million Remaining term 8.8 years Gross initial yield 5.9 % Purchase price € 39.3 million Company pr
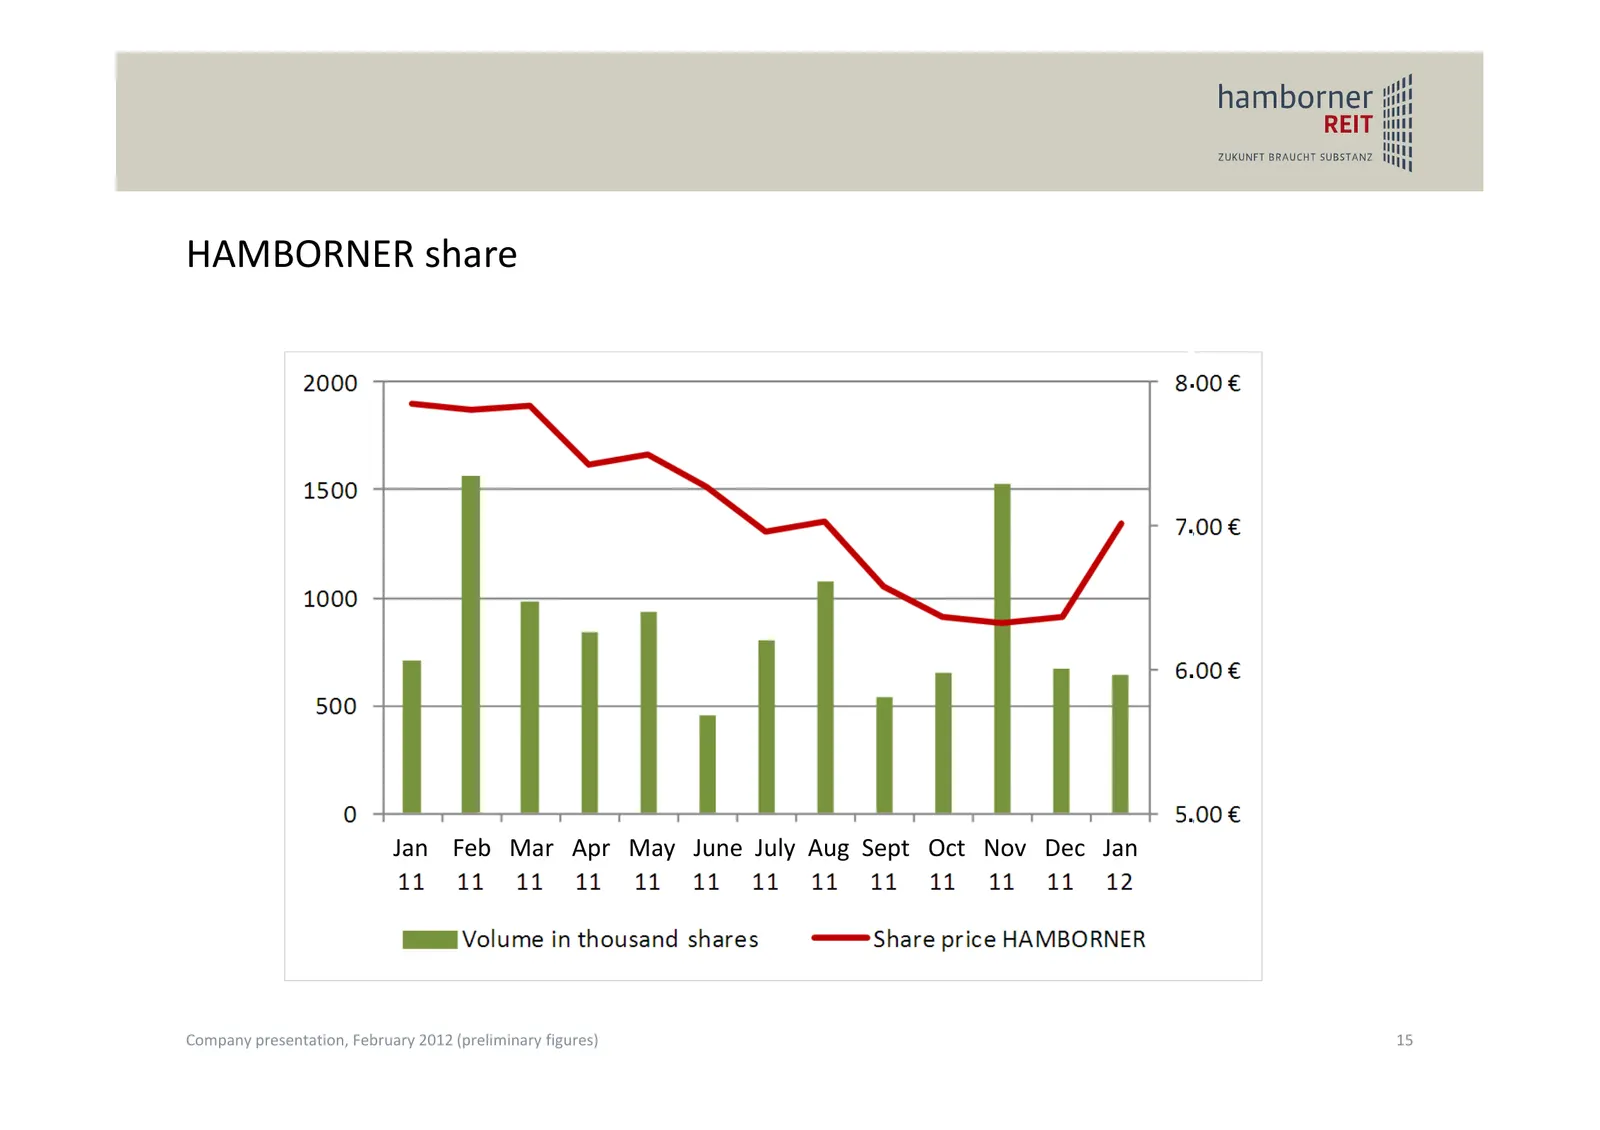
Slide 15: HAMBORNER share
HAMBORNER share . . . . Jan Feb Mar Apr May June July Aug Sept Oct Nov Dec Jan Company presentation, February 2012 (preliminary figures) 15
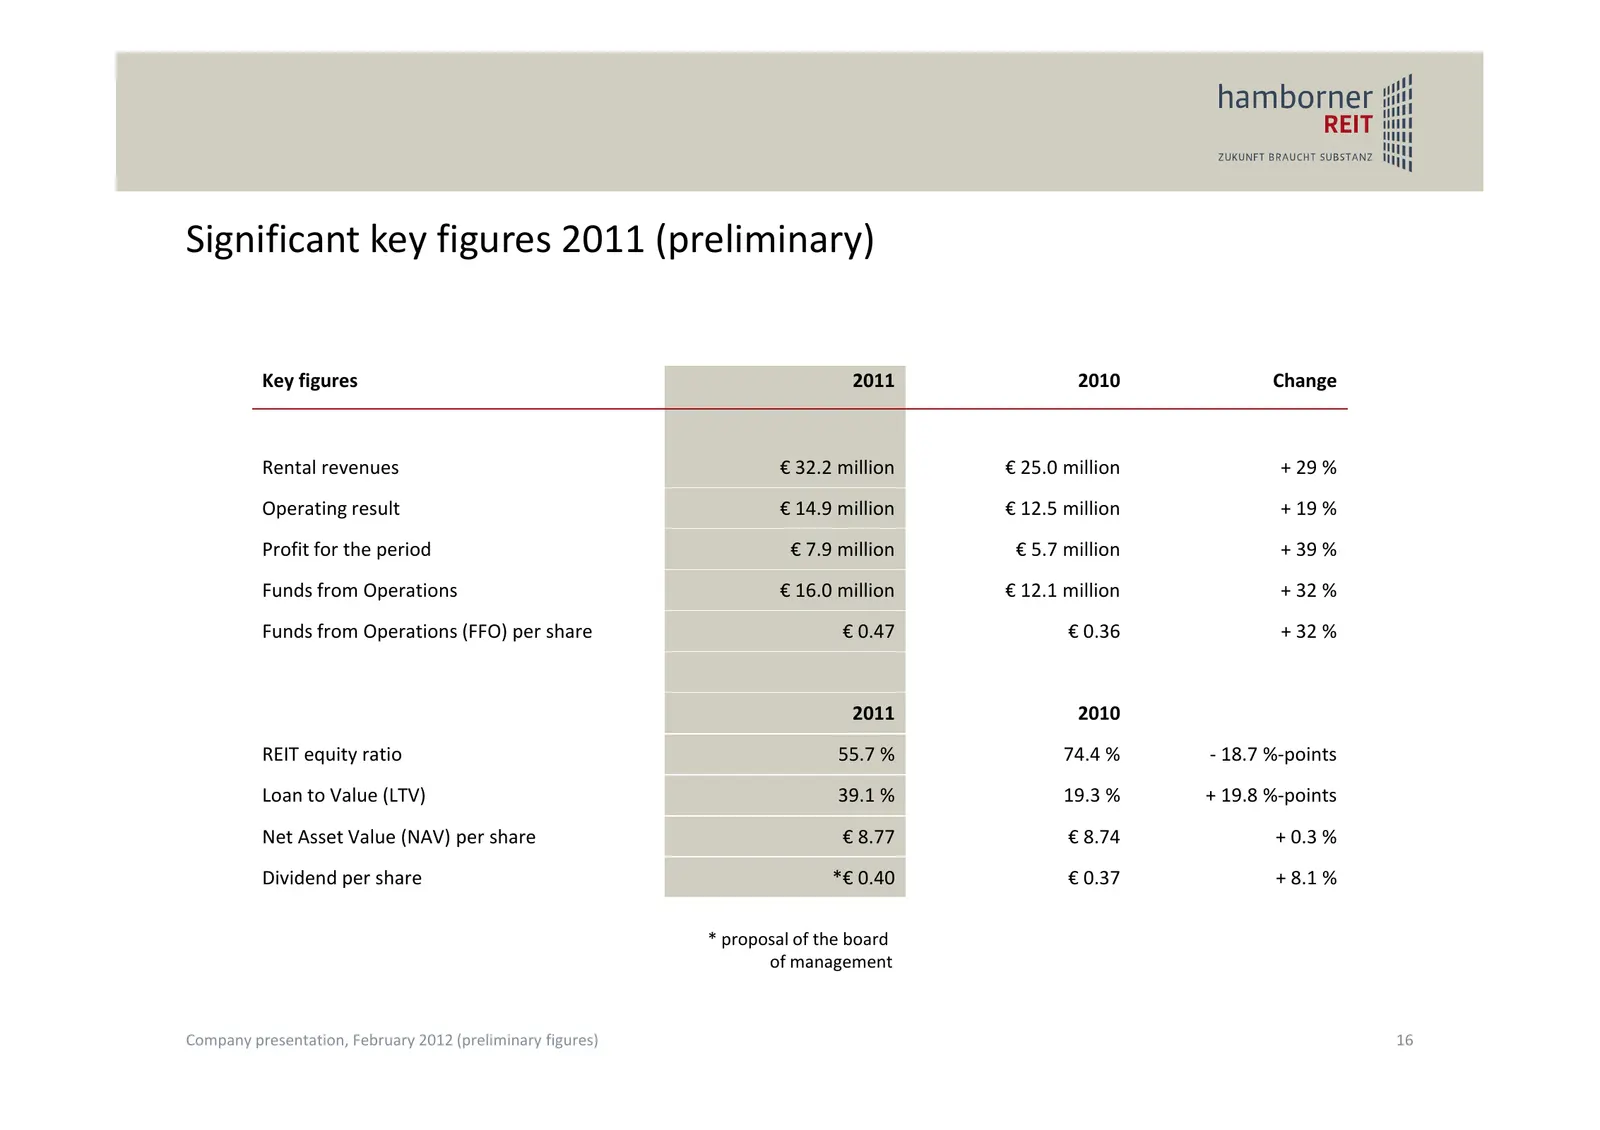
Slide 16: Significant key figures 2011 (preliminary)
Significant key figures 2011 (preliminary) Key figures 2011 2010 Change Rental revenues € 32.2 million € 25.0 million + 29 % Operating result € 14.9 million € 12.5 million + 19 % Profit for the period € 7.9 million € 5.7 million + 39 % Funds from Operations € 16.0 million € 12.1 million + 32 % Funds
Slide 17: Business year 2011 very successful
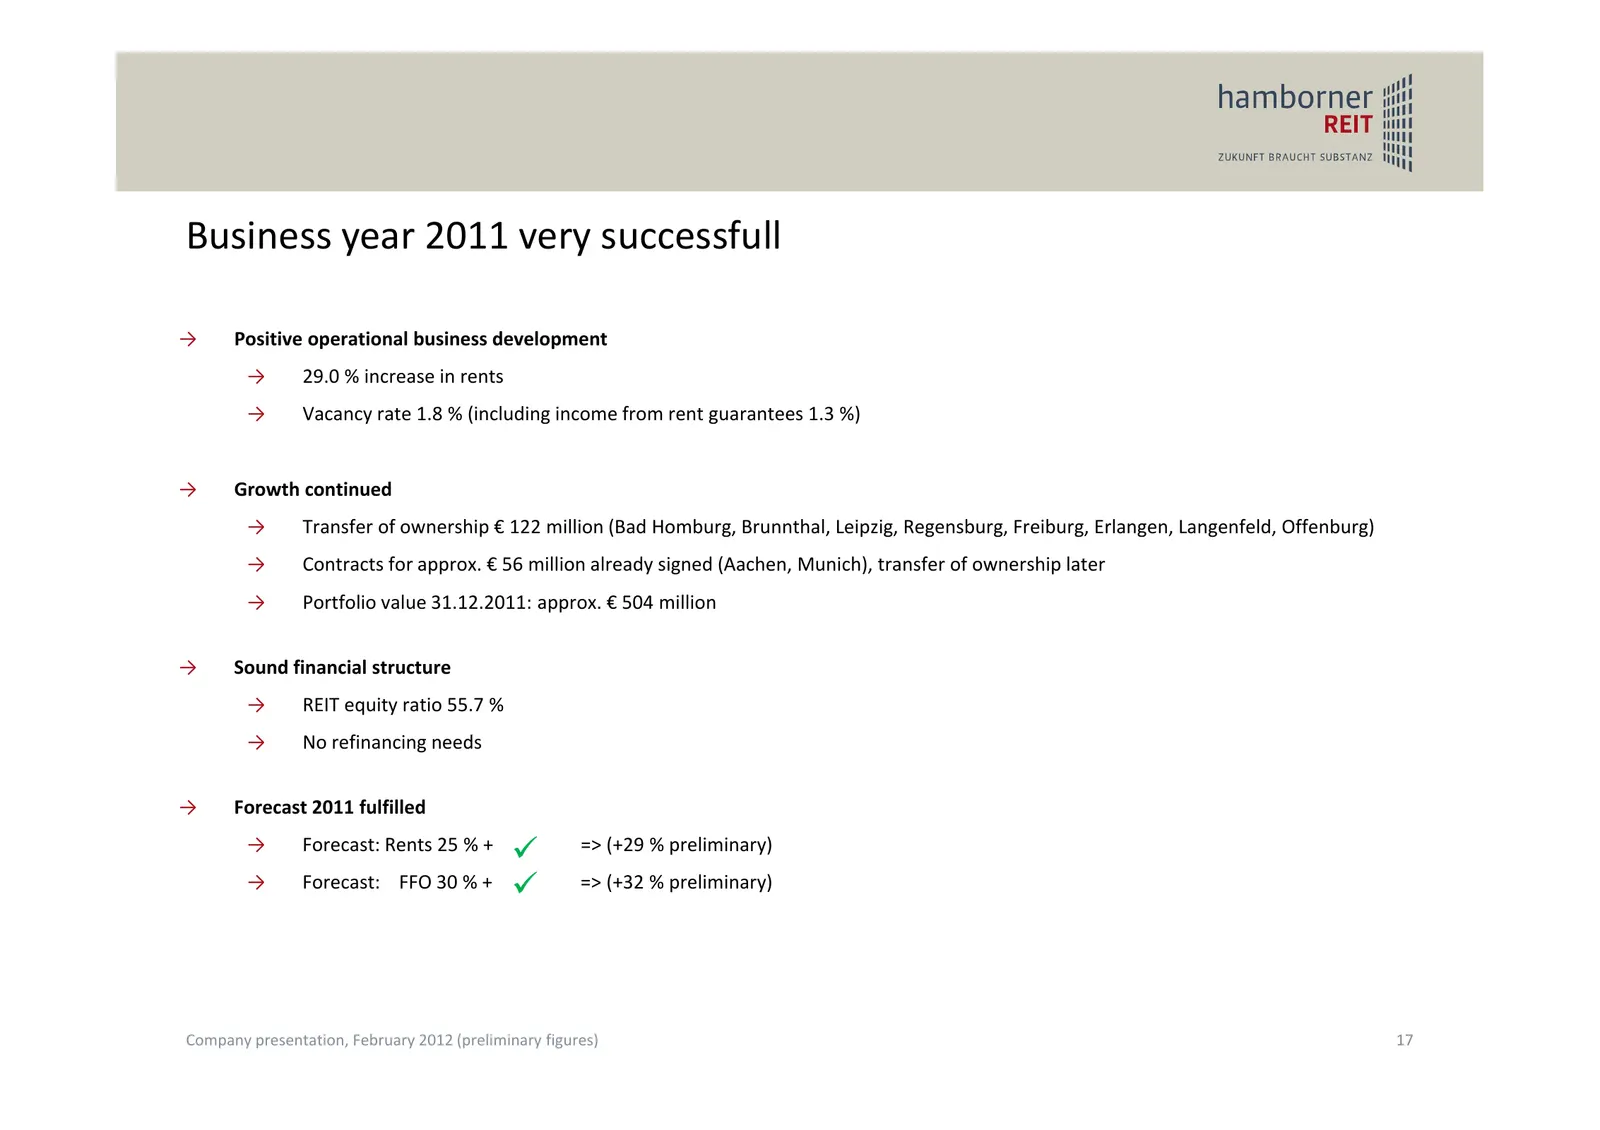
Business year 2011 very successfull → Positive operational business development → 29.0 % increase in rents → Vacancy rate 1.8 % (including income from rent guarantees 1.3 %) → Growth continued → Transfer of ownership € 122 million (Bad Homburg, Brunnthal, Leipzig, Regensburg, Freiburg, Erlangen, Lan
Slide 18: Management revenues
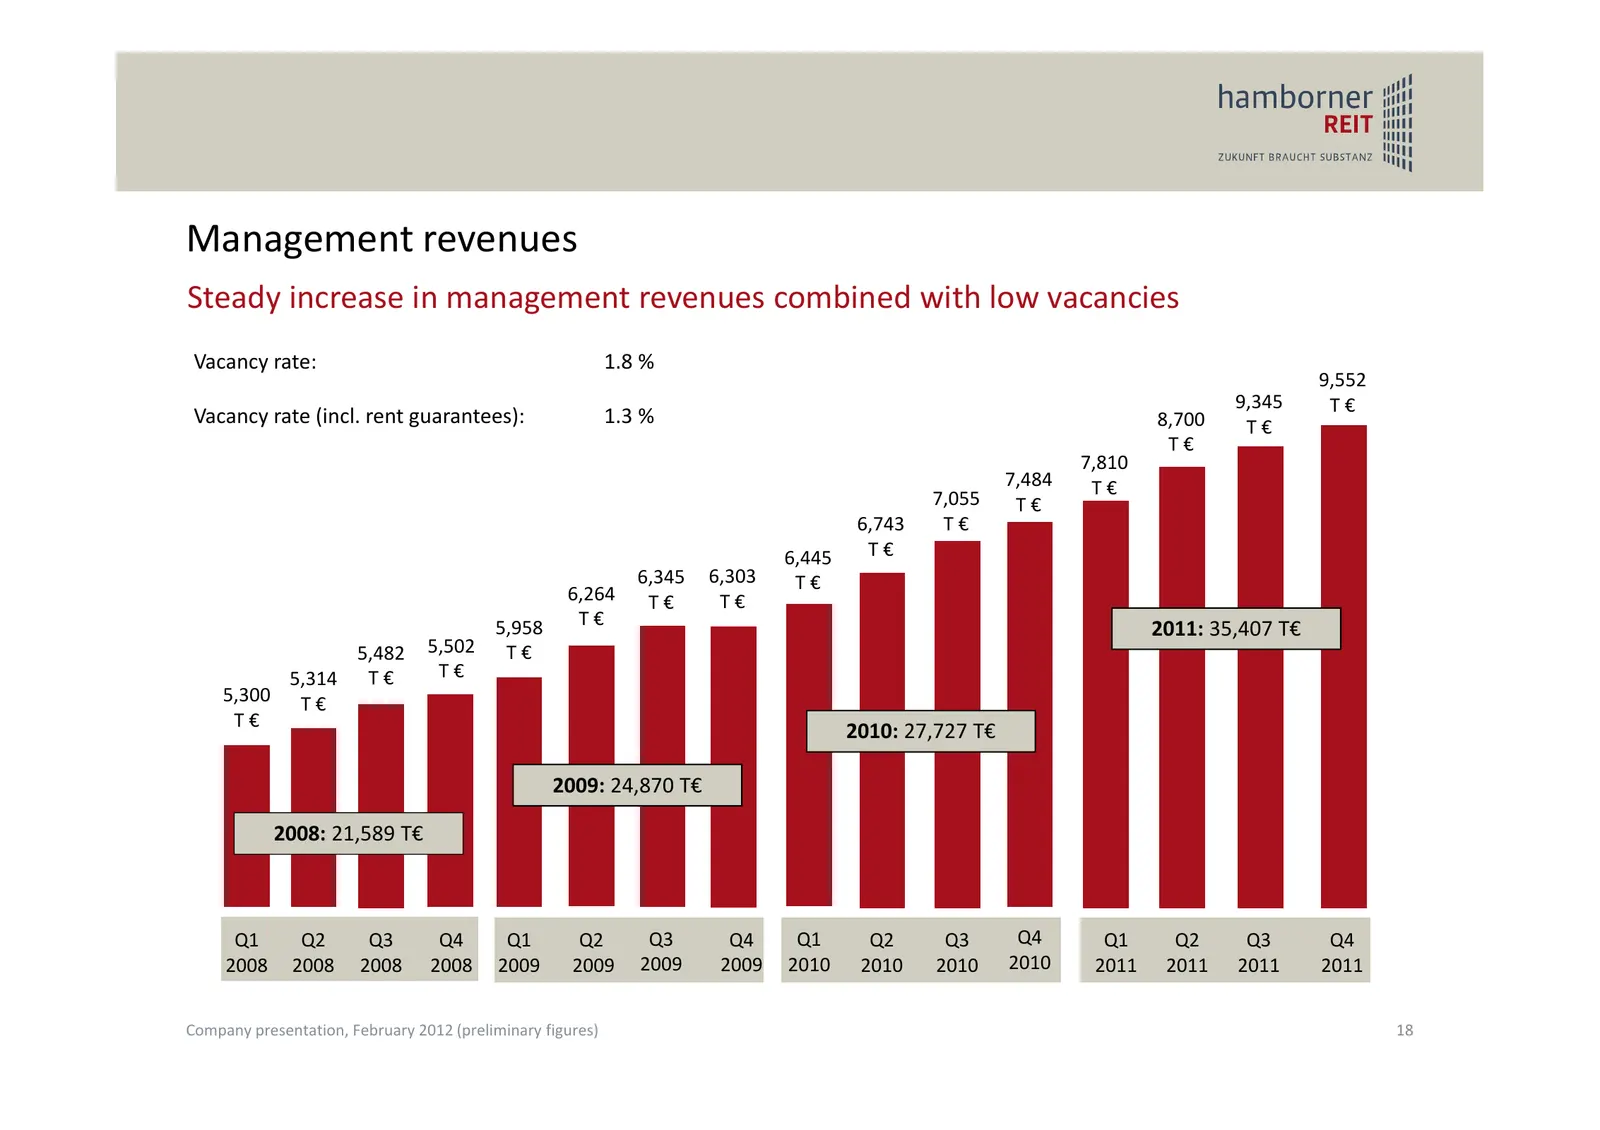
Management revenues Steady increase in management revenues combined with low vacancies Vacancy rate: 1.8 % 9,552 9,345 T€ Vacancy rate (incl. rent guarantees): 1.3 % 8,700 T€ T€ 7,810 7,484 T€ 7,055 T€ 6,743 T€ 6,445 T€ 6,345 6,303 T€ 6,264 T€ T€ 5,958 T€ 2011: 35,407 T€ 5,482 5,502 T€ 5,314 T € T€
Slide 19: Rental agreements
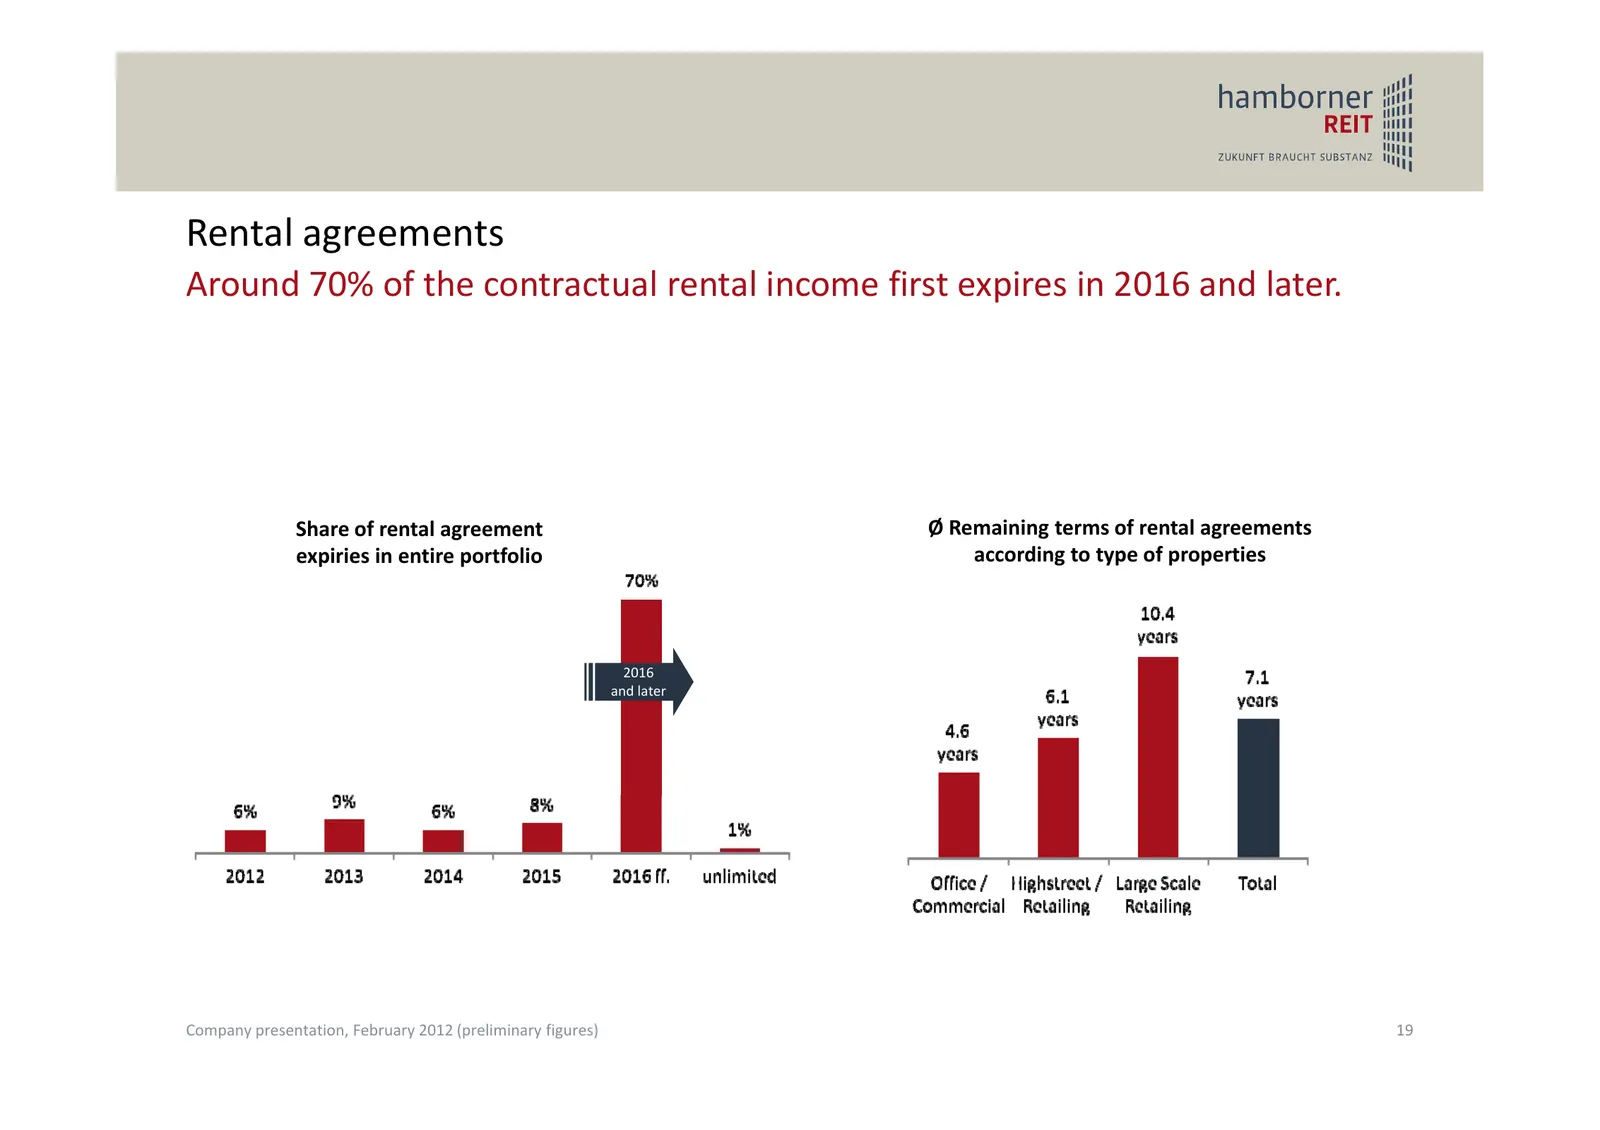
Rental agreements Around 70% of the contractual rental income first expires in 2016 and later. Share of rental agreement Ø Remaining terms of rental agreements expiries in entire portfolio according to type of properties 2016 and later Company presentation, February 2012 (preliminary figures) 19
Slide 20: TOP 10 Tenants
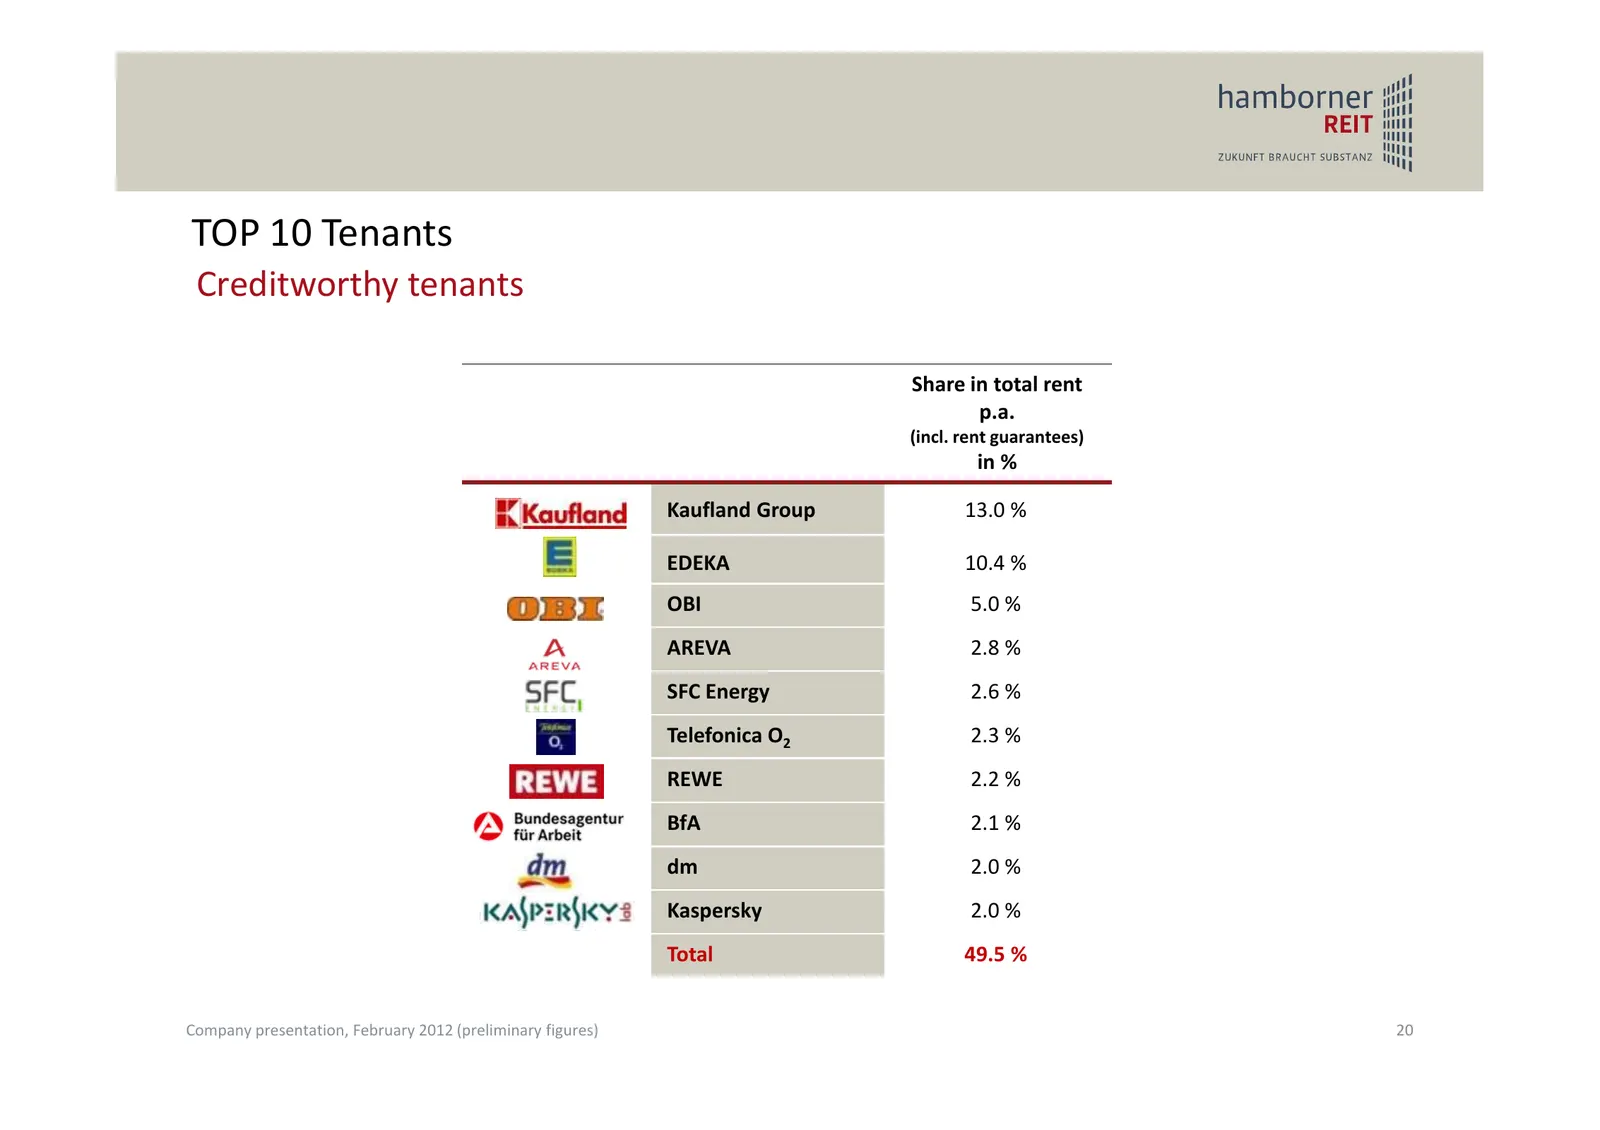
TOP 10 Tenants Creditworthy tenants Share in total rent p.a. (incl. rent guarantees) in % Kaufland Group 13.0 % EDEKA 10.4 % OBI 5.0 % AREVA 2.8 % SFC Energy 2.6 % Telefonica O2 2.3 % REWE 2.2 % BfA 2.1 % dm 2.0 % Kaspersky 2.0 % Total 49.5 % Company presentation, February 2012 (preliminary figures)
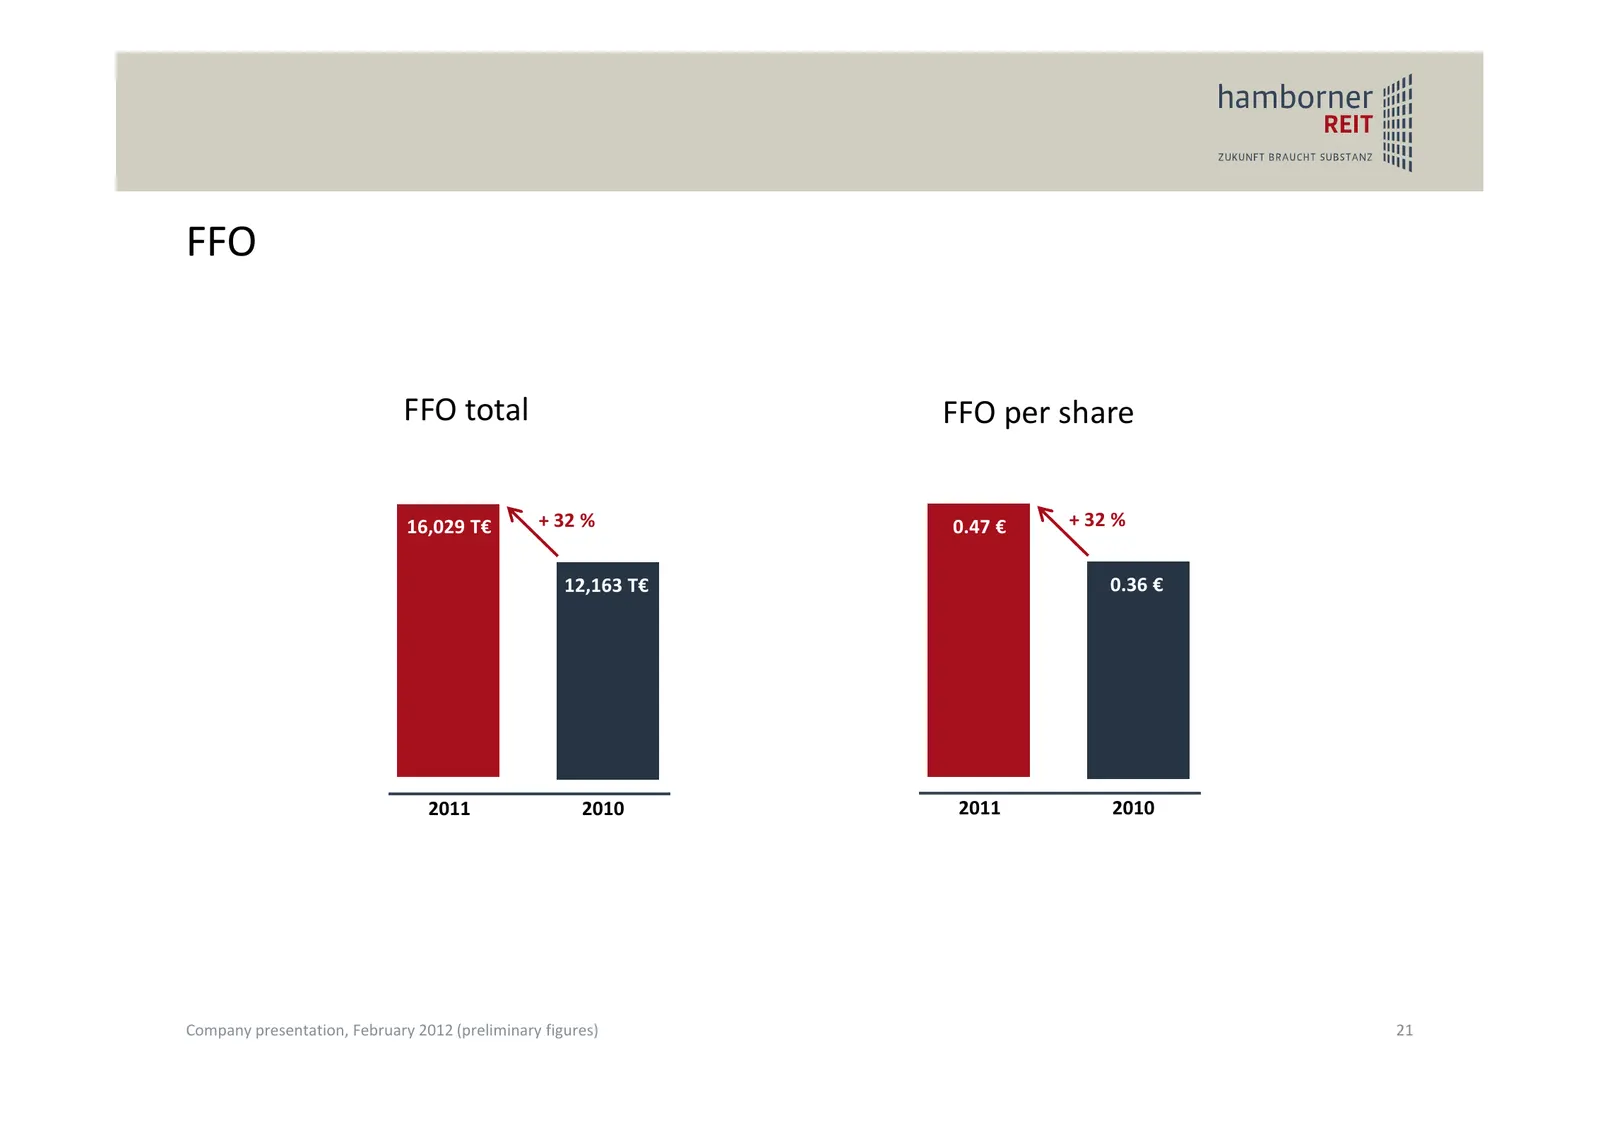
Slide 21: FFO
FFO FFO total FFO per share 16,029 T€ + 32 % 0.47 € + 32 % 12,163 T€ 0.36 € 2011 2010 2011 2010 Company presentation, February 2012 (preliminary figures) 21
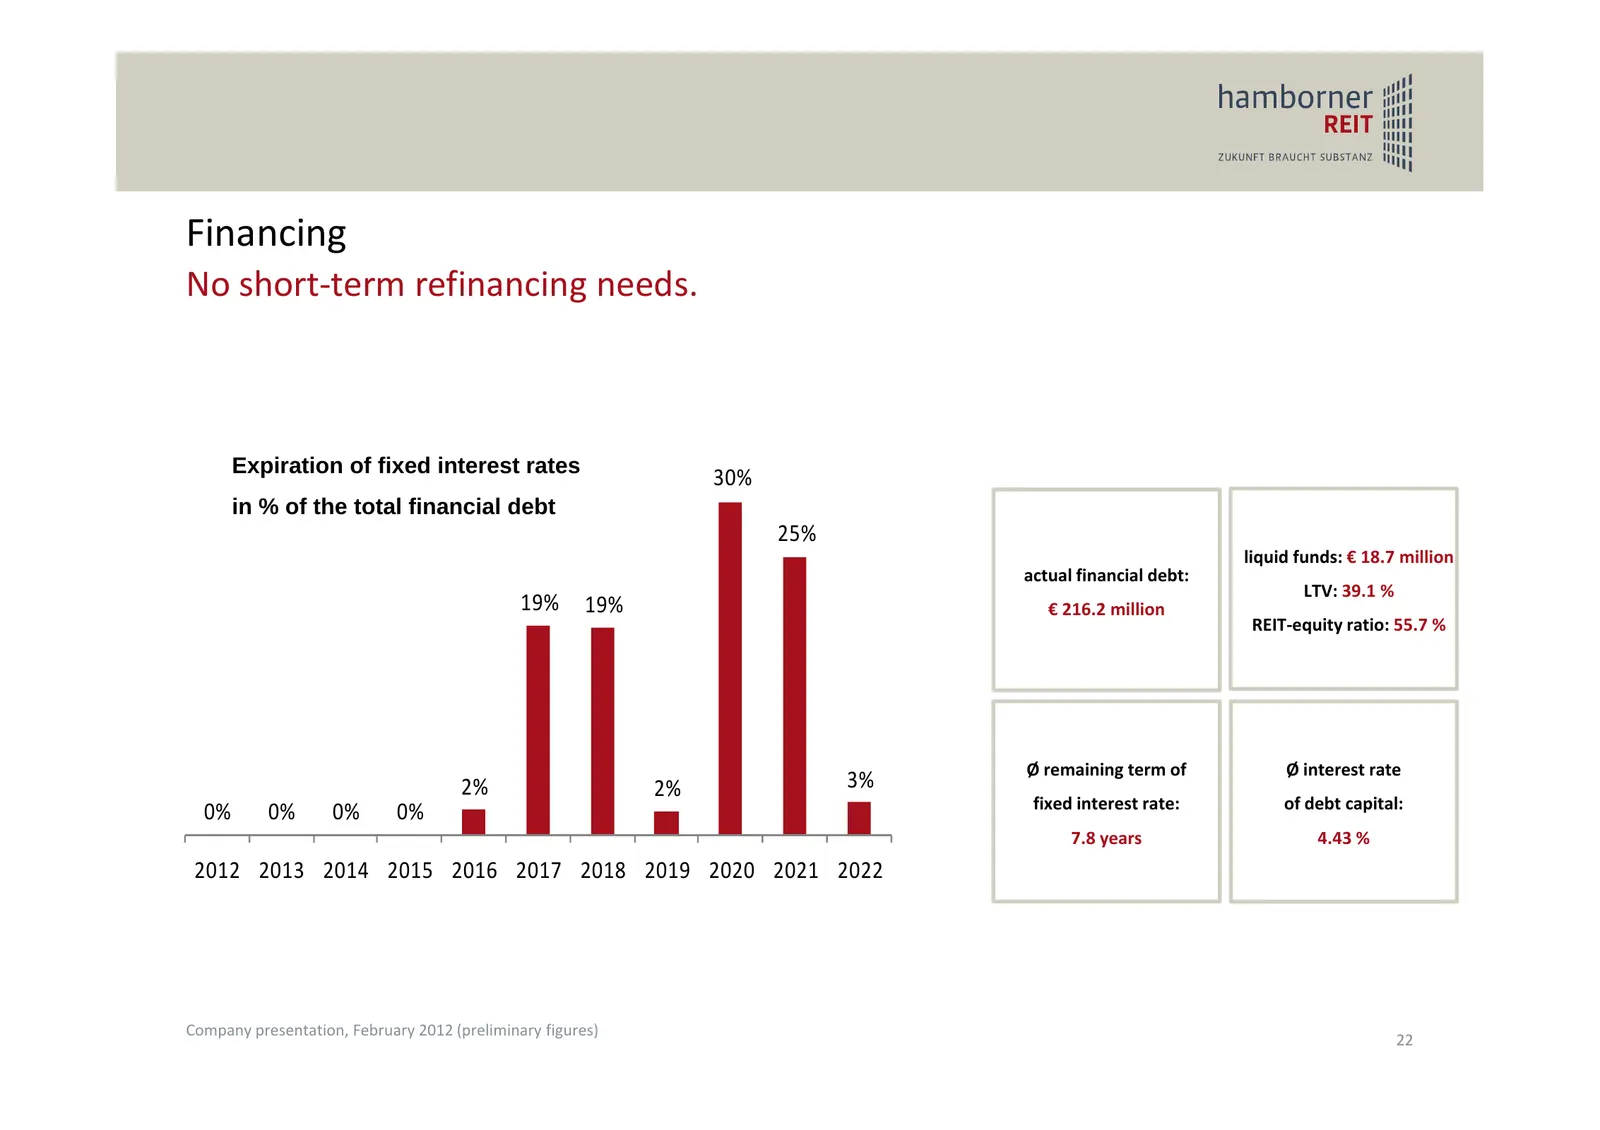
Slide 22: Financing
Financing No short‐term refinancing needs. Expiration of fixed interest rates 30% in % of the total financial debt 25% liquid funds: € 18.7 million actual financial debt: LTV: 39.1 % 19% 19% € 216.2 million REIT‐equity ratio: 55.7 % Ø remaining term of Ø interest rate 2% 2% 3% fixed interest rate: o
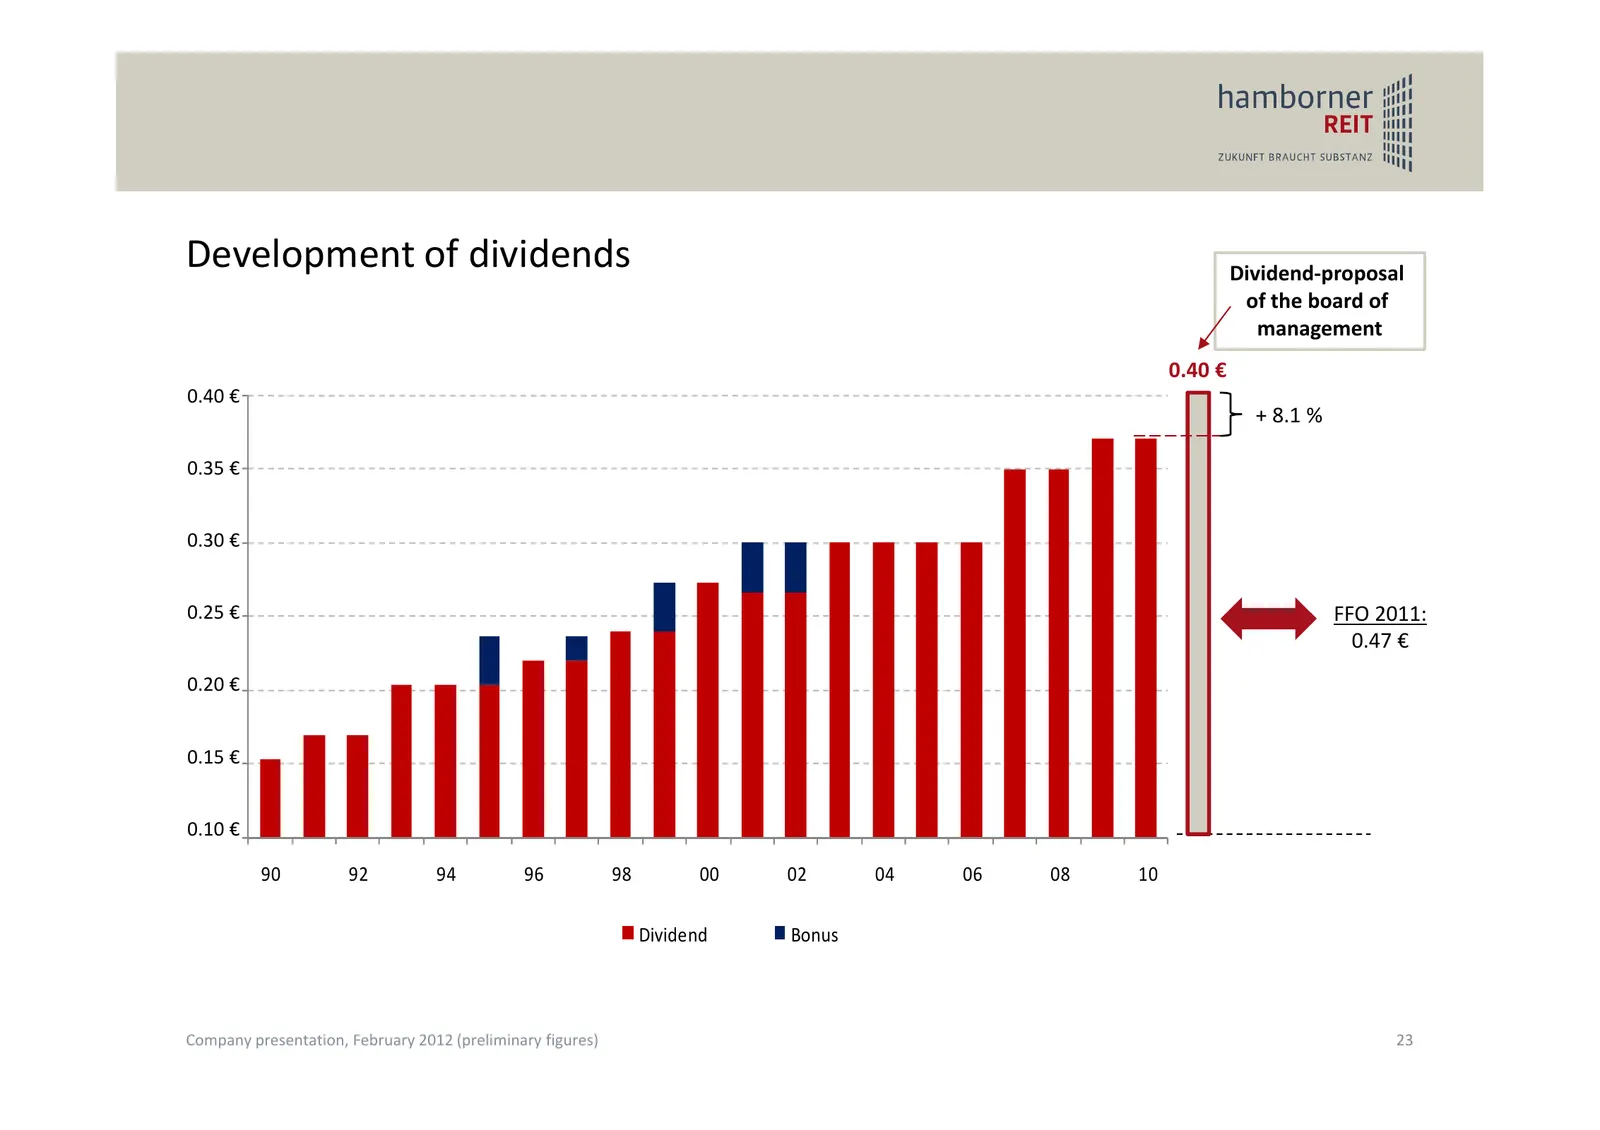
Slide 23: Development of dividends
Development of dividends Dividend‐proposal of the board of management 0.40 € 0,40 0.40€€ + 8.1 % 0.35€€ 0,35 0.30€€ 0,30 0.25€€ 0,25 FFO 2011: 0.47 € 0.20€€ 0,20 0.15€€ 0,15 0.10 € 0,10 € 90 92 94 96 98 00 02 04 06 08 10 Dividend Bonus Company presentation, February 2012 (preliminary figures) 23
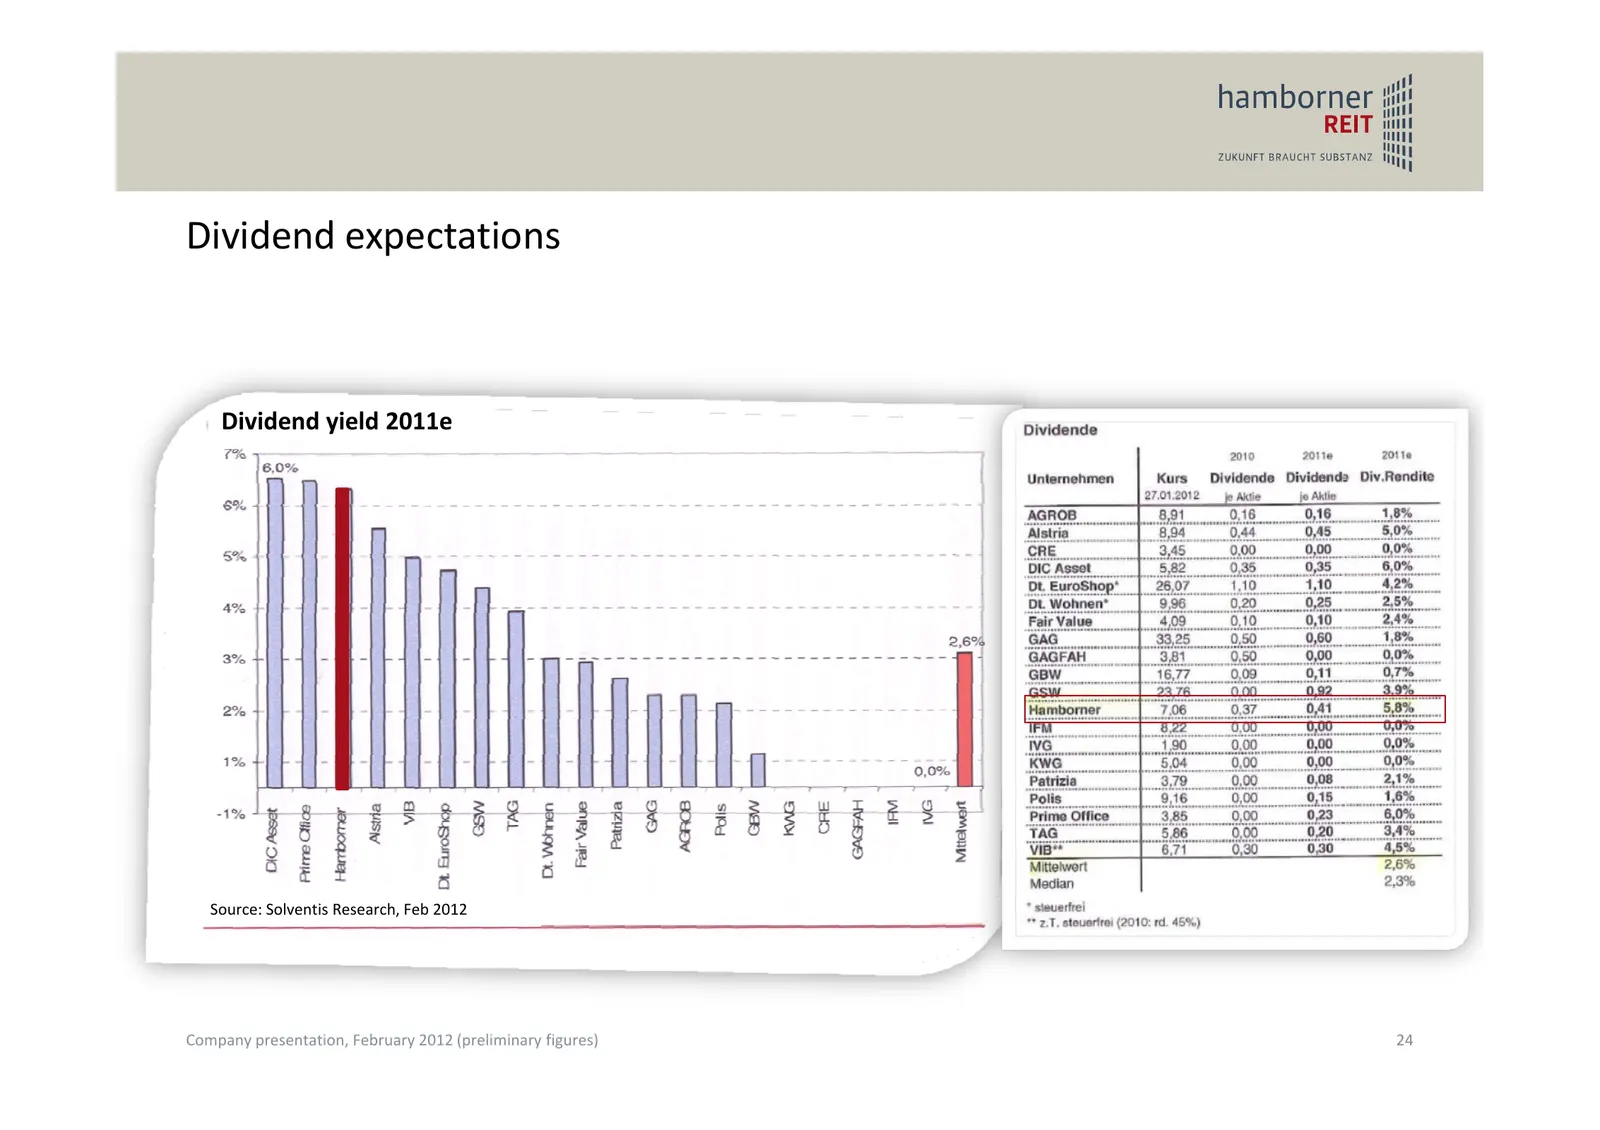
Slide 24: Dividend expectations
Dividend expectations Dividend yield 2011e Source: Solventis Research, Feb 2012 Company presentation, February 2012 (preliminary figures) 24
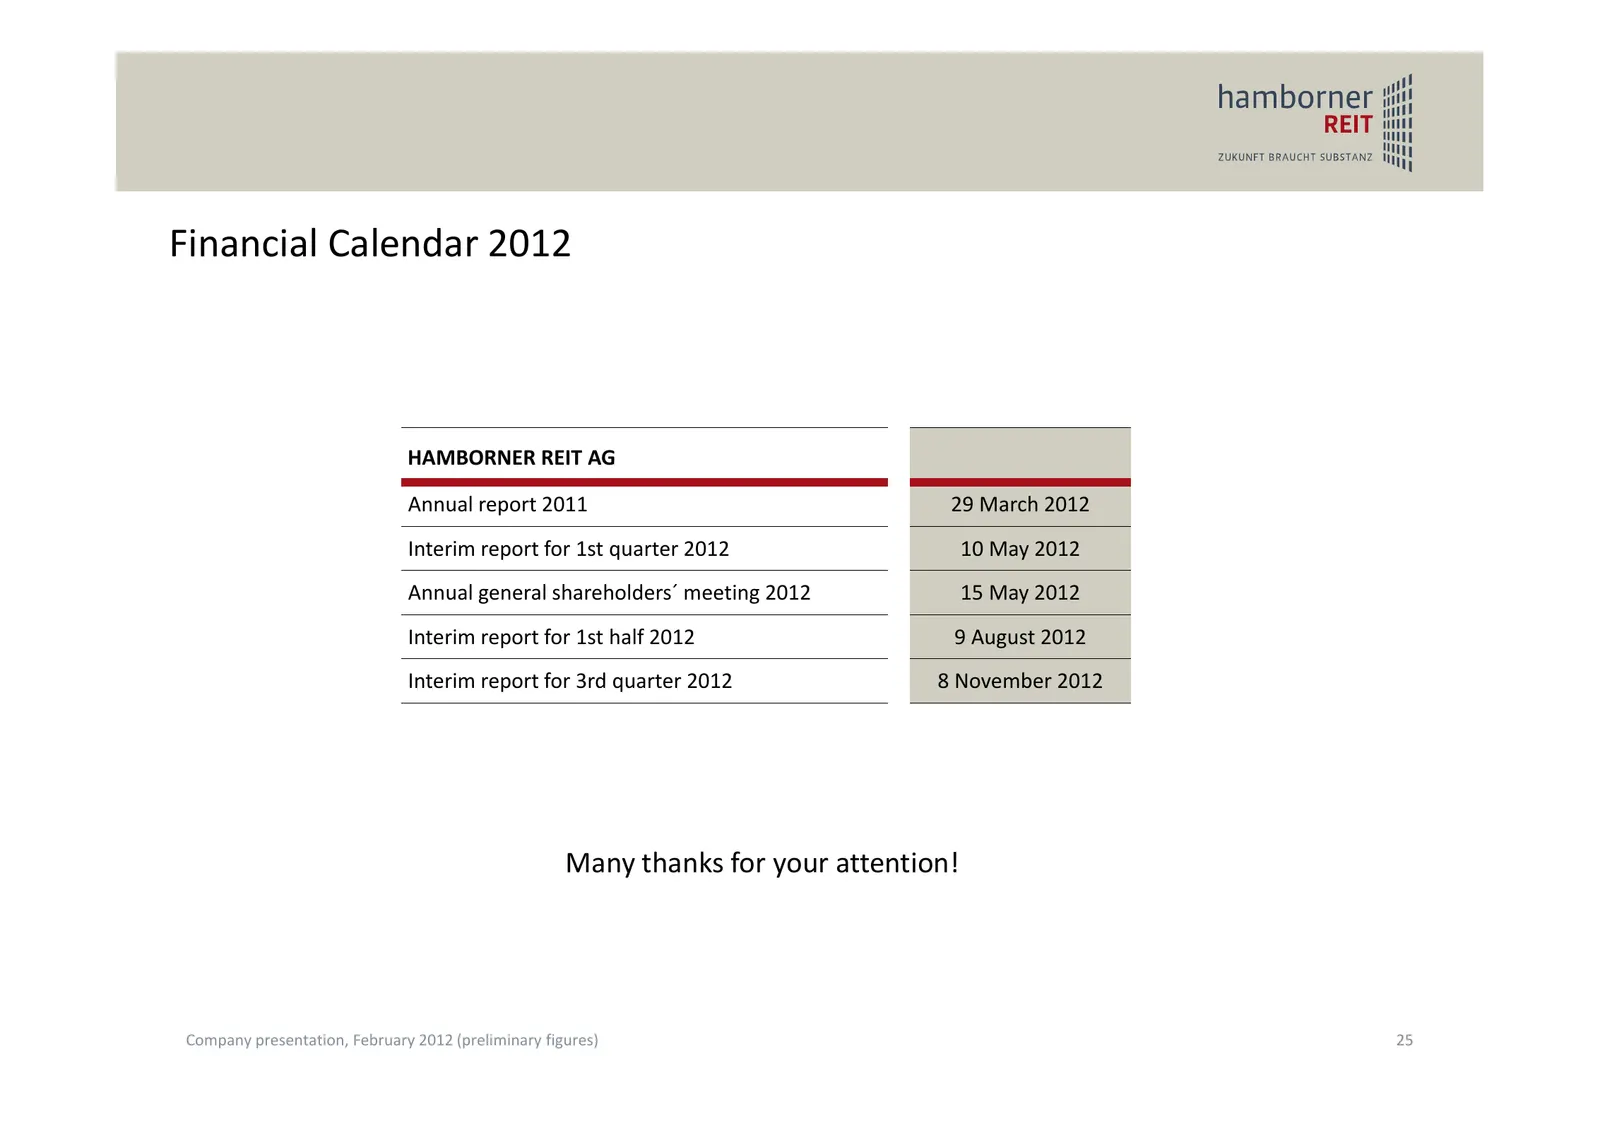
Slide 25: Financial Calendar 2012
Financial Calendar 2012 HAMBORNER REIT AG Annual report 2011 29 March 2012 Interim report for 1st quarter 2012 10 May 2012 Annual general shareholders´ meeting 2012 15 May 2012 Interim report for 1st half 2012 9 August 2012 Interim report for 3rd quarter 2012 8 November 2012 Many thanks for your att
Slide 26: Contact
Contact Dr. Rüdiger Mrotzek ‐ Vorstand T +49 (0)203 / 54405‐55 M r.mrotzek@hamborner.de Hans Richard Schmitz ‐ Vorstand T +49 (0)203 / 54405‐21 M h.schmitz@hamborner.de Sybille Albeser ‐ Investor Relations T +49 (0)203 / 54405‐32 M s.albeser@hamborner.de
Slide 27: Disclaimer
Disclaimer This presentation was exclusively prepared for the addresses specified on the title page and/or the participants at the mentioned event. The information in this presentation is based on both public information and documents as well as information which was made available to HAMBORNER REIT
Source: Internet Archive copy of hamborner.de
More decks from Hamborner REIT AG
 9M 2026 Earnings Presentation10 slides · Nov 10, 2026
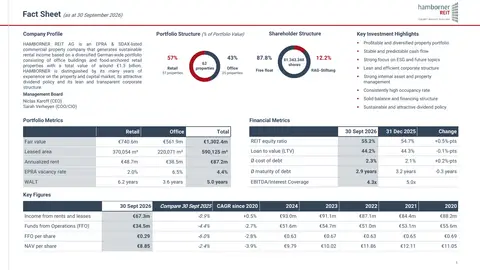 Fact Sheet (November 2026)2 slides · November 2026
 Investor Presentation (November 2026)35 slides · November 2026
 Investor Presentation (November 2026)35 slides · November 2026
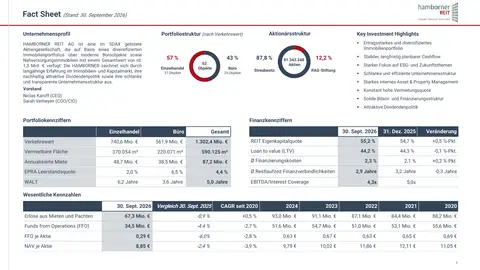 Fact Sheet (September 2026)2 slides · Sep 30, 2026
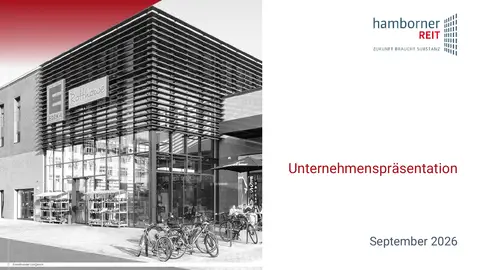 Investor Presentation (September 2026)36 slides · September 2026