Hamborner REIT AG · XETR:HABA
Hamborner REIT — Investor Presentation (November 2026)
35 slides from Hamborner REIT's investor presentation, November 2026
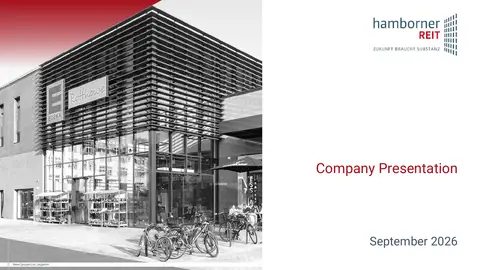
Slide 1: Company Presentation November 2026
Company Presentation November 2026 Retail property in Lengerich
Slide 2: Agenda
HAMBORNER at a glance Portfolio Overview Asset / Property Management Financials Sustainability / ESG Appendix Office property in Ratingen
Slide 3: HAMBORNER at a glance
HAMBORNER at a glance Company headquarter in Duisburg
Slide 4: HAMBORNER at a glance
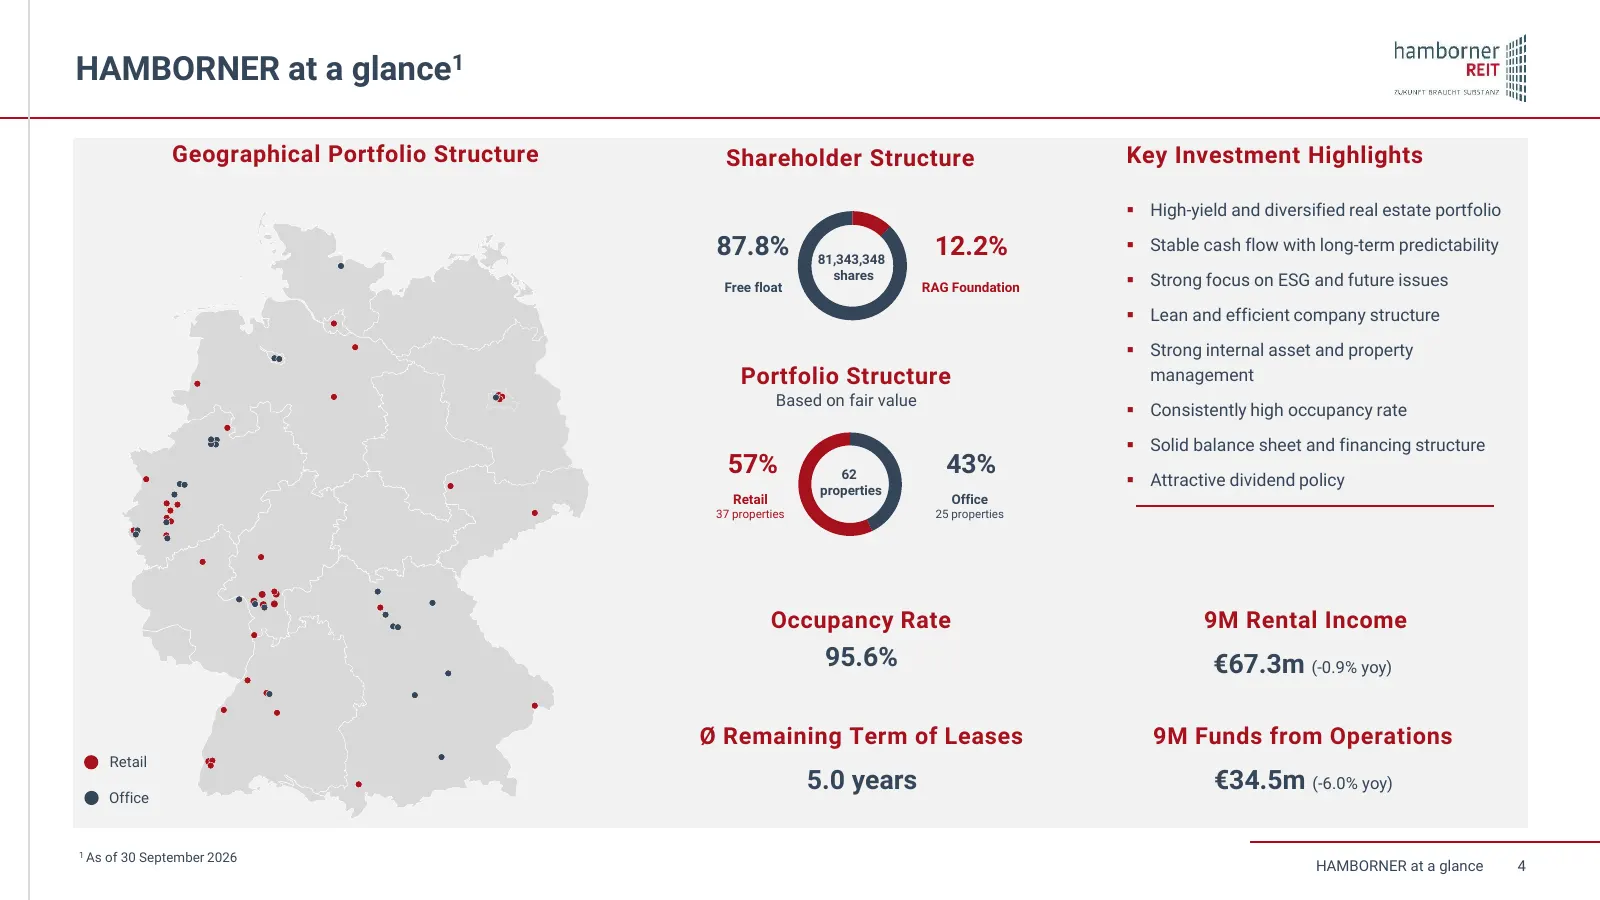
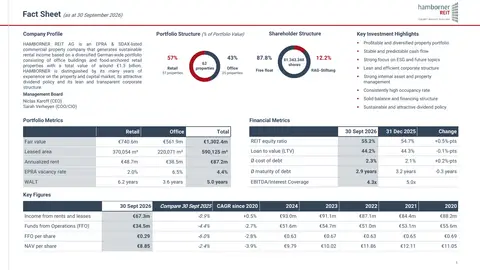
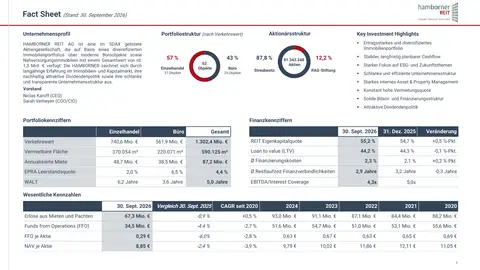
HAMBORNER at a glance1 Geographical Portfolio Structure Shareholder Structure Key Investment Highlights ▪ High-yield and diversified real estate portfolio 87.8% 81,343,348 12.2% ▪ Stable cash flow with long-term predictability shares ▪ Strong focus on ESG and future issues Free float RAG Foundation
Slide 5: Portfolio Overview
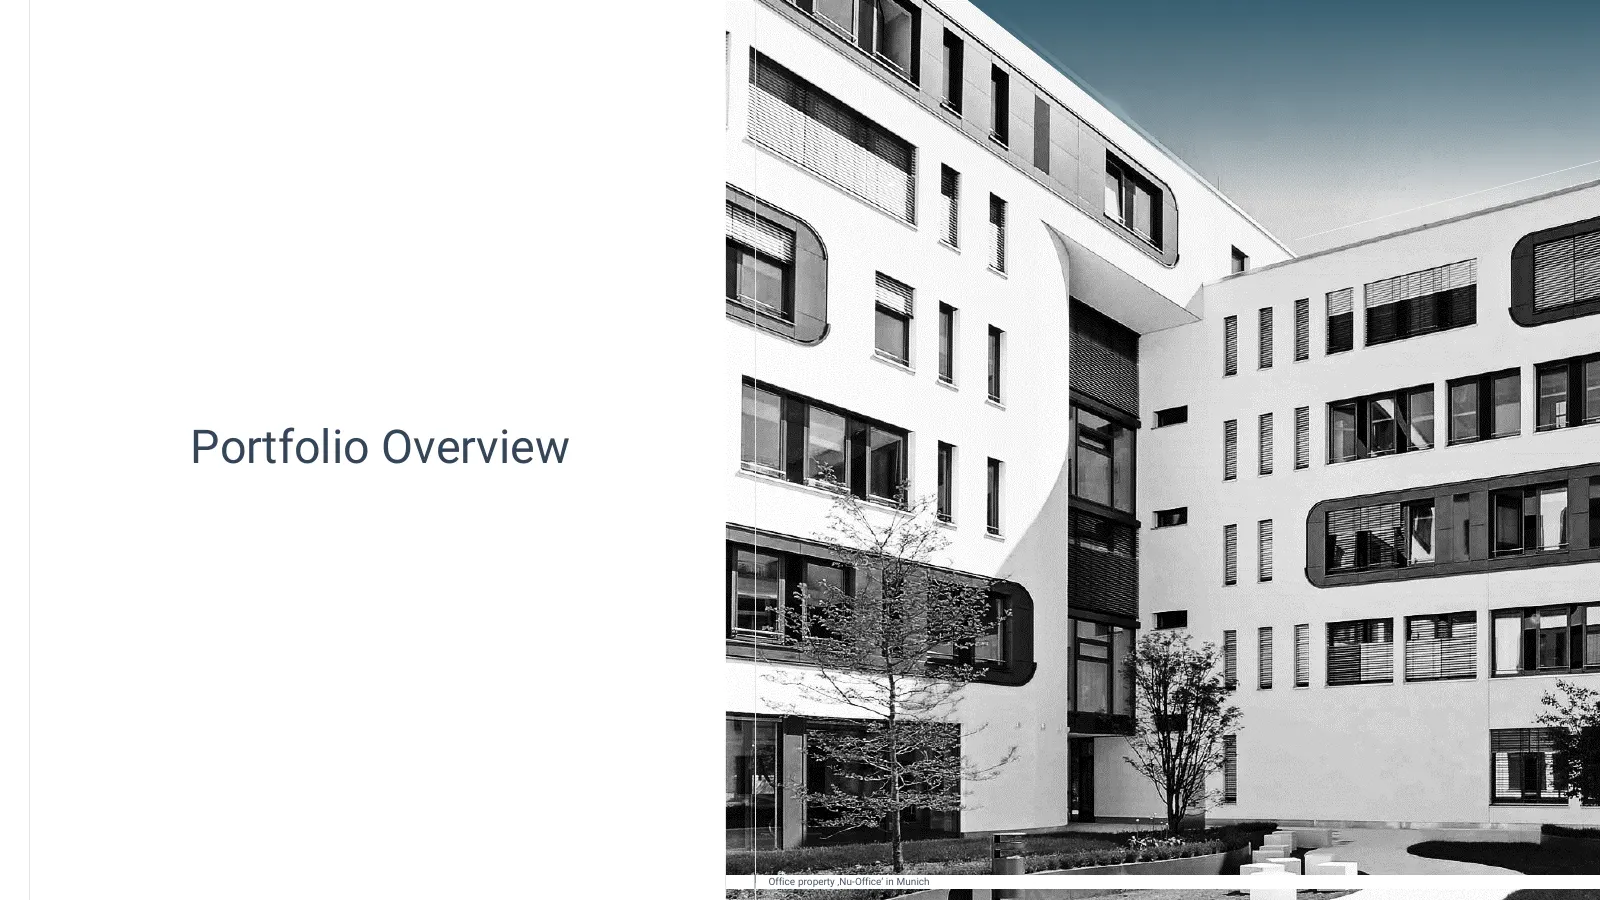
Portfolio Overview Office property ‚Nu-Office‘ in Munich
Slide 6: Portfolio development
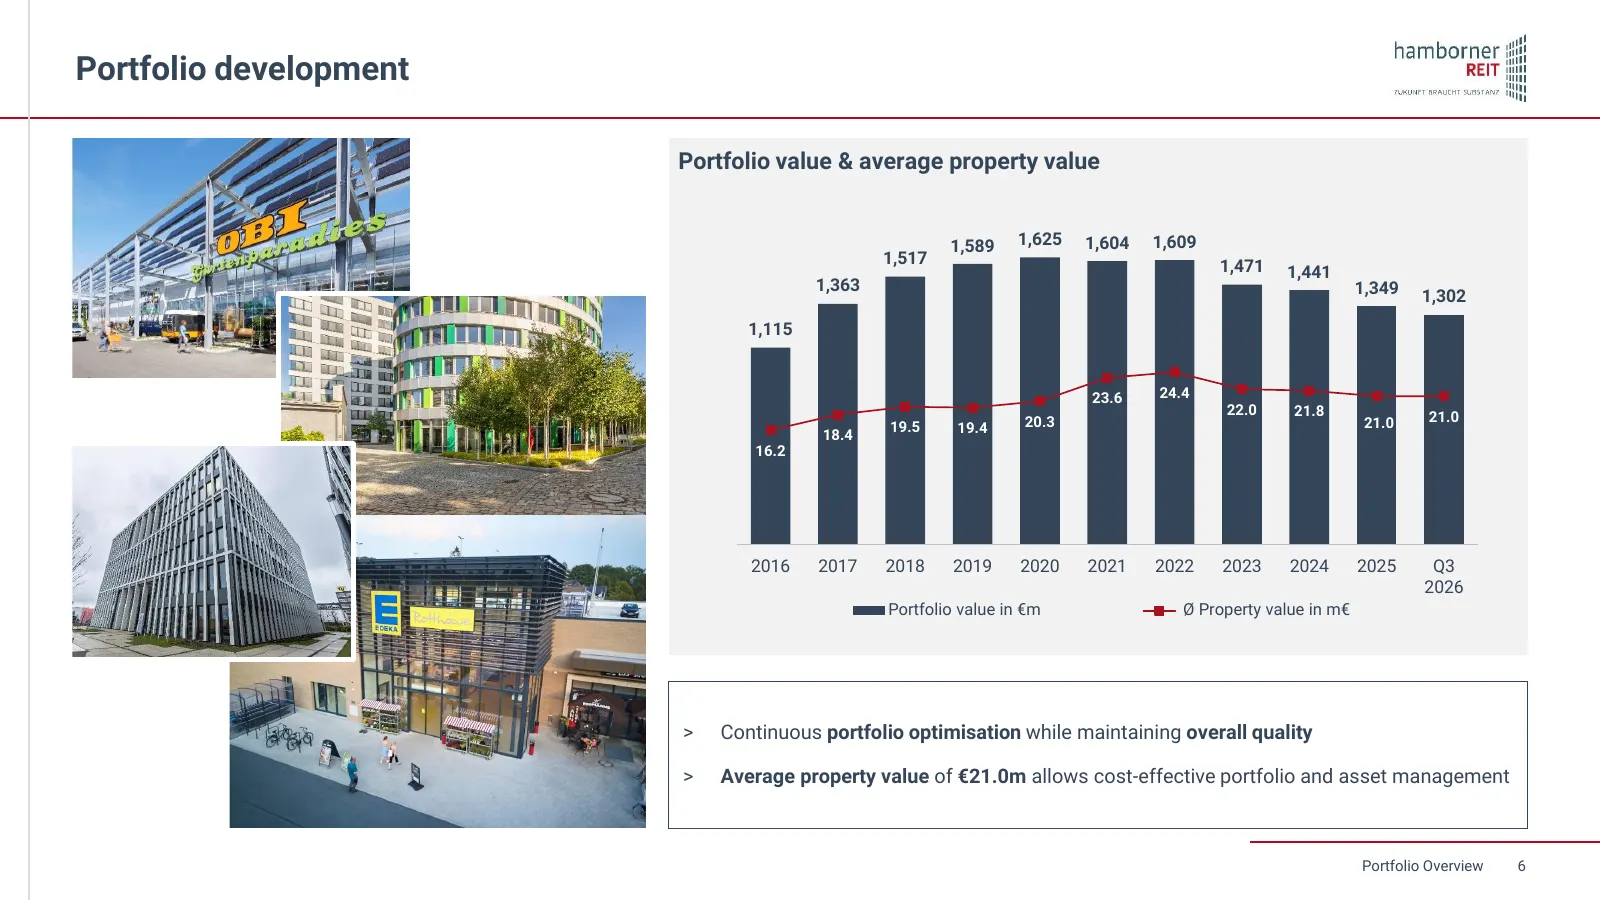
Portfolio development Portfolio value & average property value 2.000 50 1,589 1,625 1,604 1,609 1,517 1,471 40 1.500 1,441 1,363 1,349 1,302 1,115 30 1.000 23.6 24.4 22.0 21.8 20 20.3 21.0 21.0 19.5 19.4 18.4 500 16.2 10 0 0 2016 2017 2018 2019 2020 2021 2022 2023 2024 2025 Q3 2026 Portfolio value i
Slide 7: Geographical portfolio structure
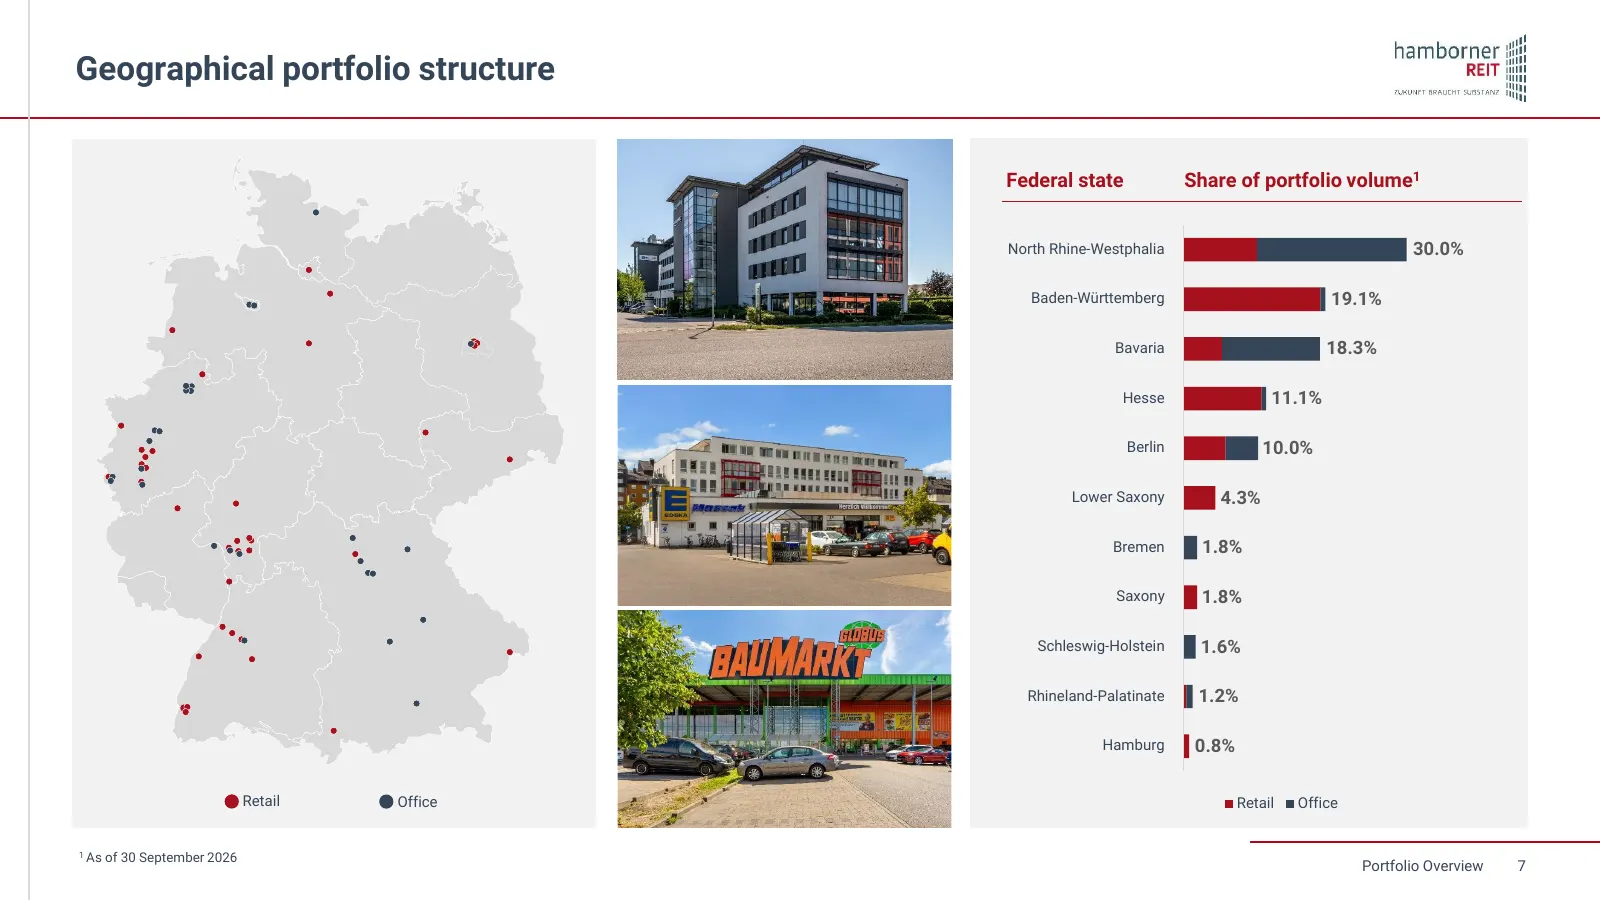
Geographical portfolio structure Federal state Share of portfolio volume1 North Rhine-Westphalia 30.0% Baden-Württemberg 19.1% Bavaria 18.3% Hesse 11.1% Berlin 10.0% Lower Saxony 4.3% Bremen 1.8% Saxony 1.8% Schleswig-Holstein 1.6% Rhineland-Palatinate 1.2% Hamburg 0.8% Retail Office Retail Office 1
Slide 8: Portfolio key metrics as of September 2026
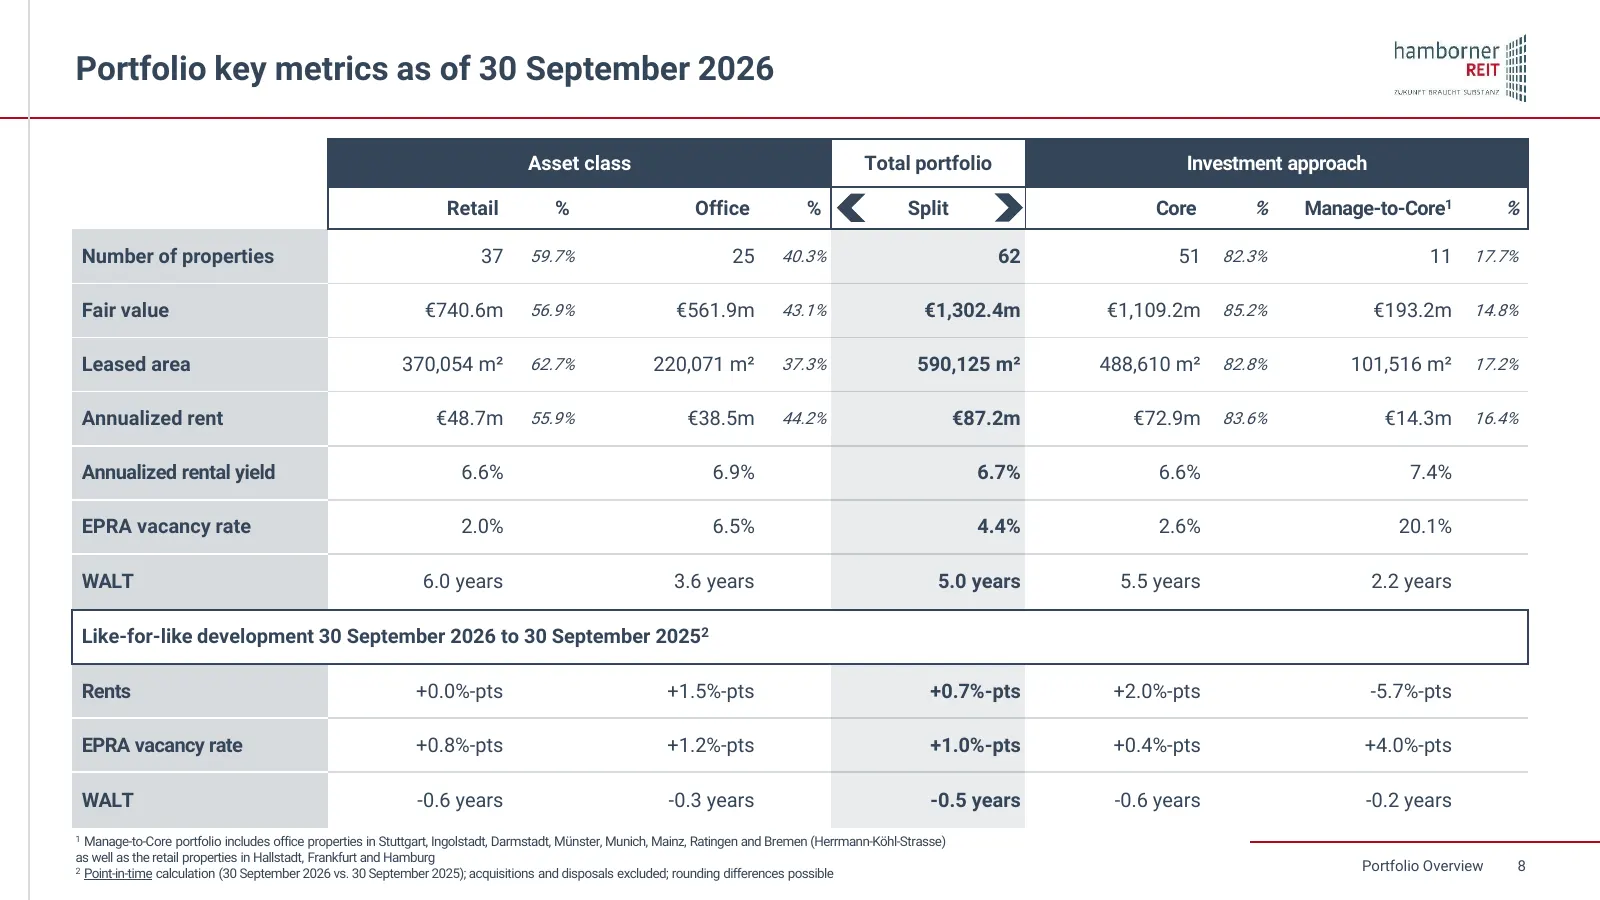
Portfolio key metrics as of 30 September 2026 Asset class Total portfolio Investment approach Retail % Office % Split Core % Manage-to-Core1 % Number of properties 37 59.7% 25 40.3% 62 51 82.3% 11 17.7% Fair value €740.6m 56.9% €561.9m 43.1% €1,302.4m €1,109.2m 85.2% €193.2m 14.8% Leased area 370,05
Slide 9: Rent development
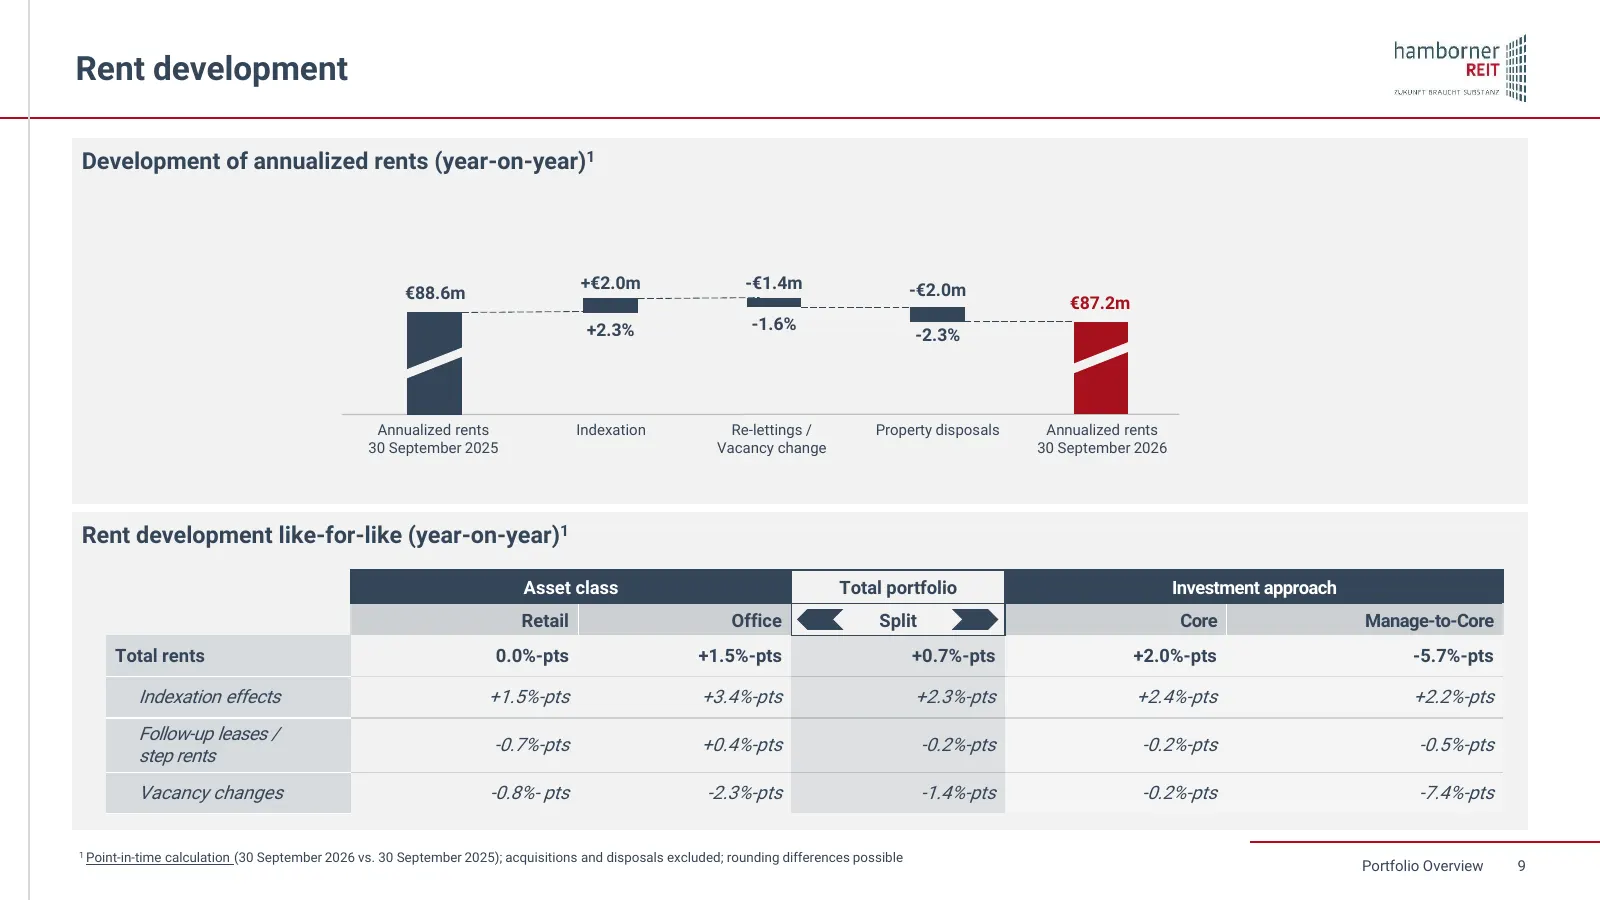
Rent development Development of annualized rents (year-on-year)1 +€2.0m -€1.4m -€2.0m €88.6m €87.2m +2.3% -1.6% -2.3% Annualized rents Indexation Re-lettings / Property disposals Annualized rents 30 September 2025 Vacancy change 30 September 2026 Rent development like-for-like (year-on-year)1 Asset
Slide 10: Strategy Update 2026
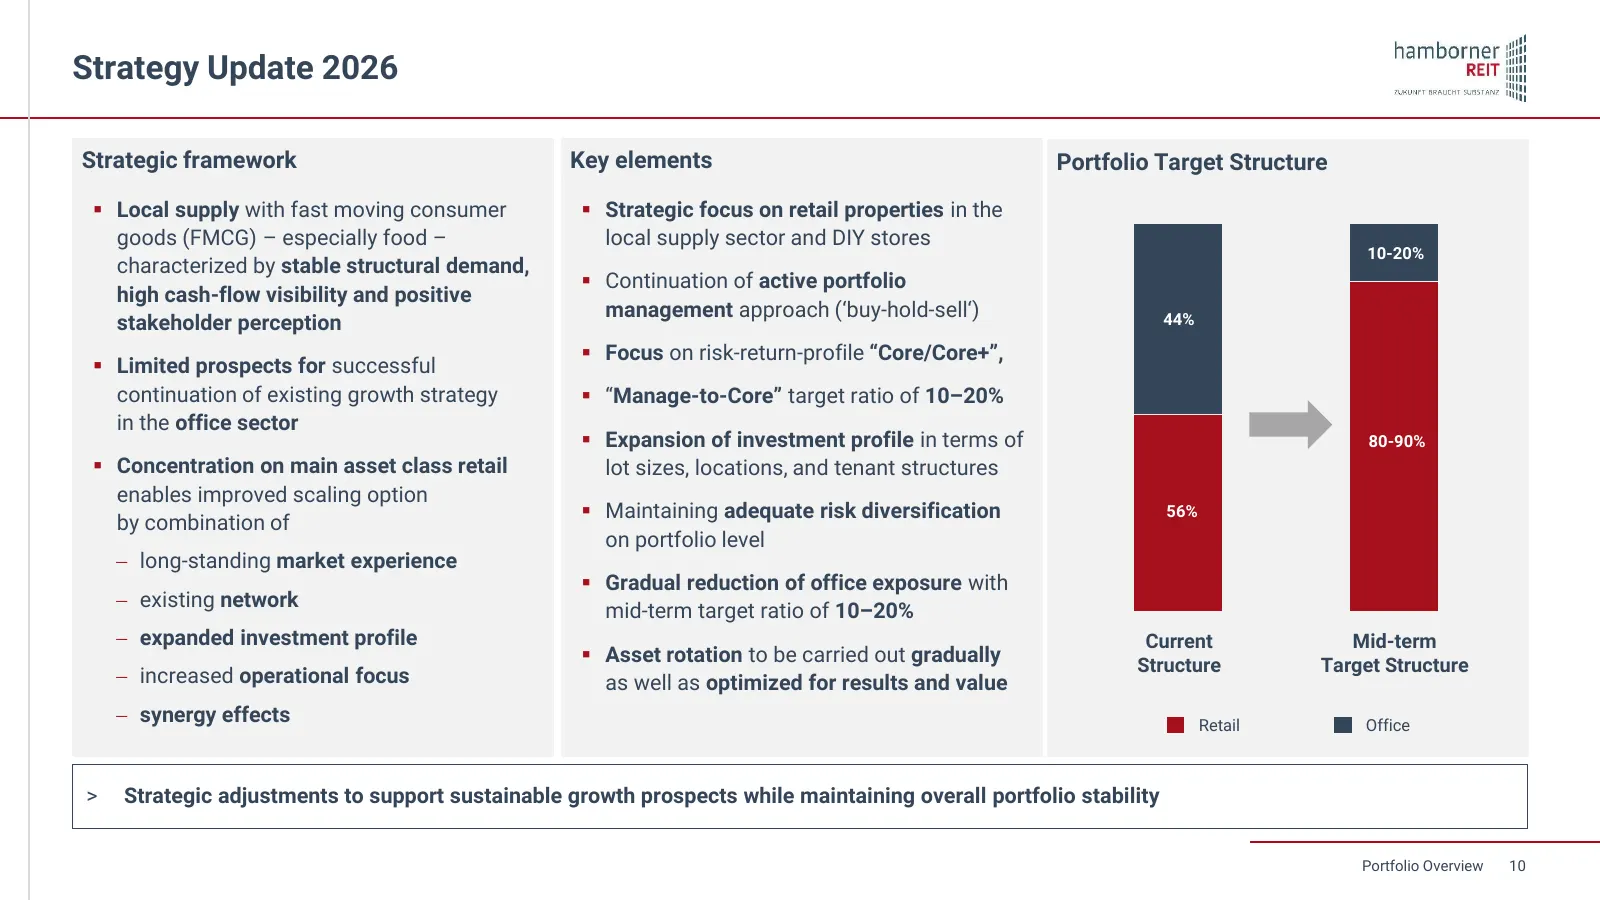
Strategy Update 2026 Strategic framework Key elements Portfolio Target Structure ▪ Local supply with fast moving consumer ▪ Strategic focus on retail properties in the goods (FMCG) – especially food – local supply sector and DIY stores 10-20% characterized by stable structural demand, ▪ Continuation
Slide 11: Strategic sales activities
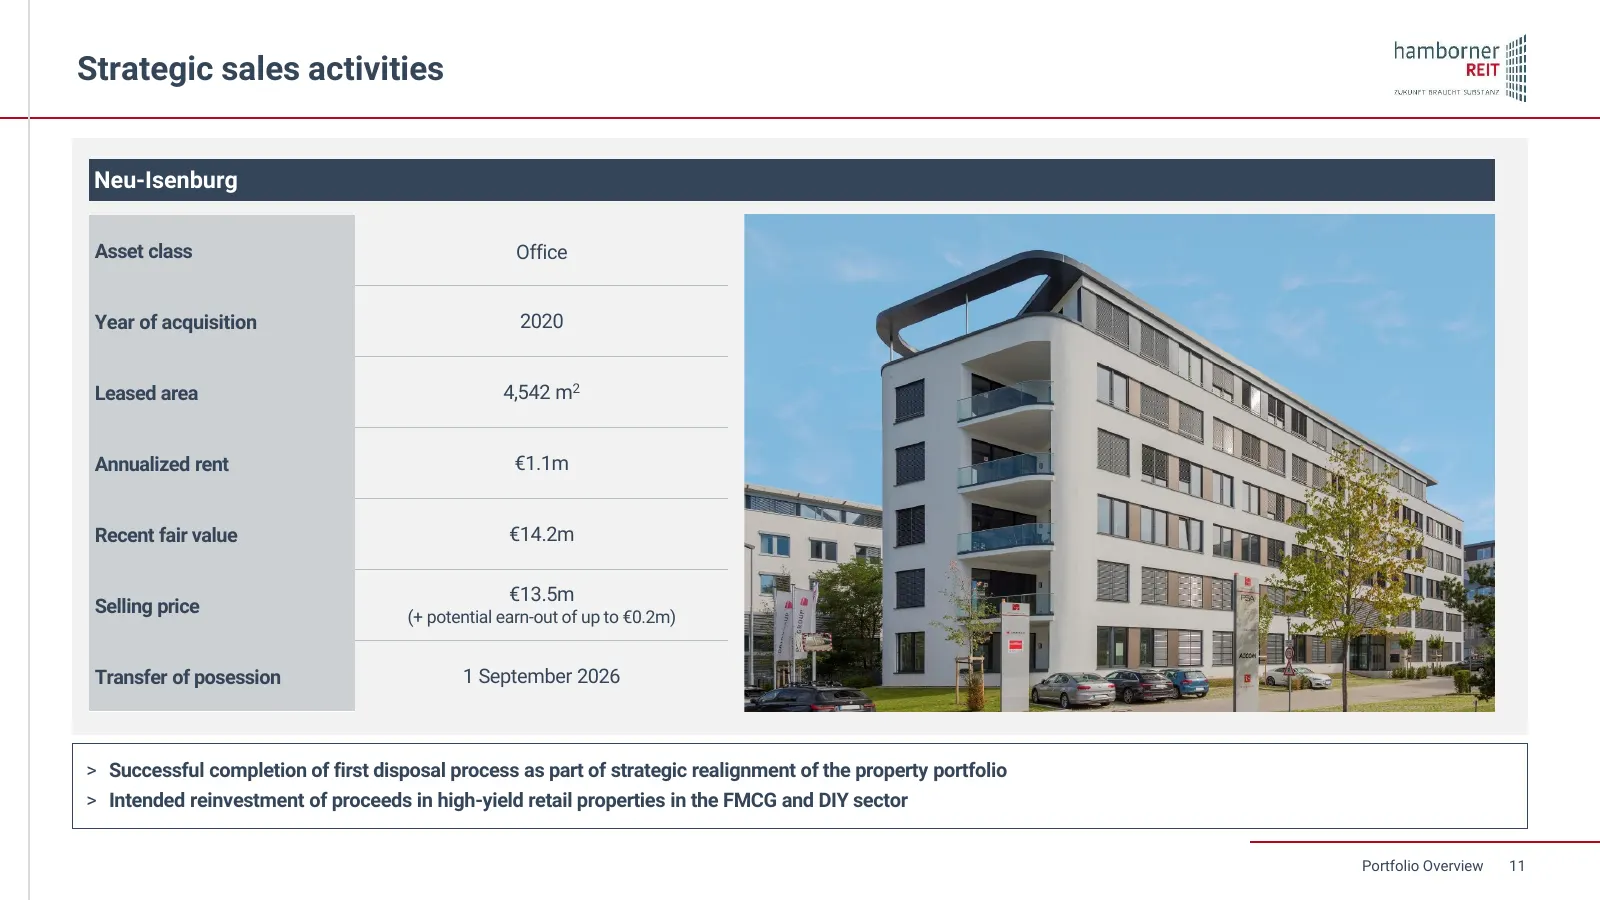
Strategic sales activities Neu-Isenburg Asset class Office Year of acquisition 2020 Leased area 4,542 m2 Annualized rent €1.1m Recent fair value €14.2m €13.5m Selling price (+ potential earn-out of up to €0.2m) Transfer of posession 1 September 2026 > Successful completion of first disposal process
Slide 12: Asset-/Property Management
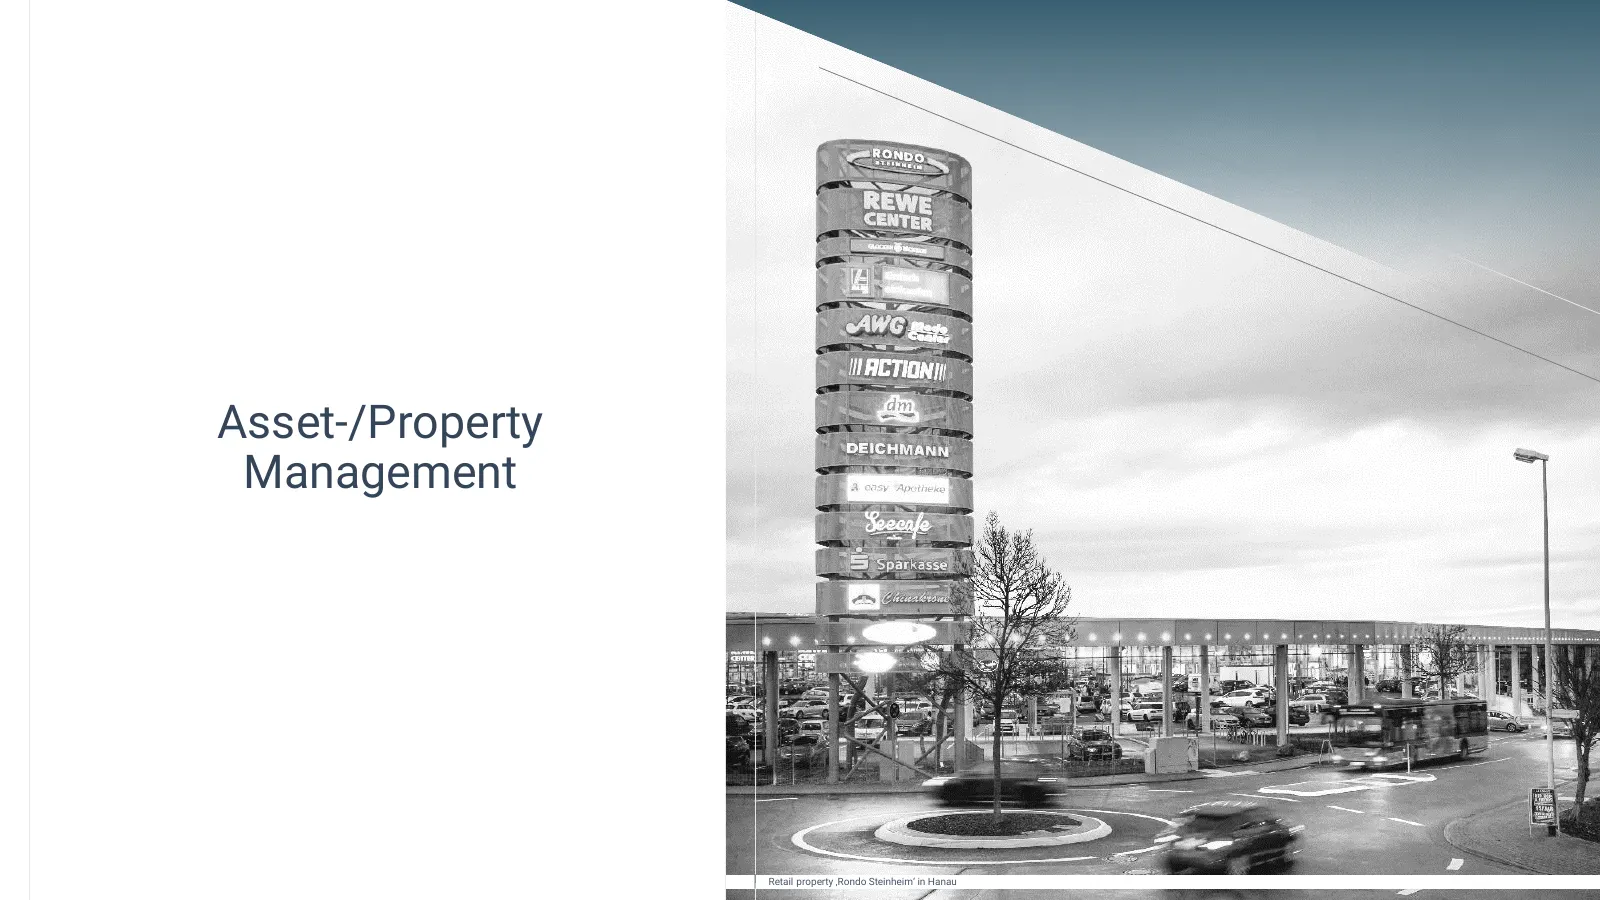
Asset-/Property Management Retail property ‚Rondo Steinheim‘ in Hanau
Slide 13: Tenant structure
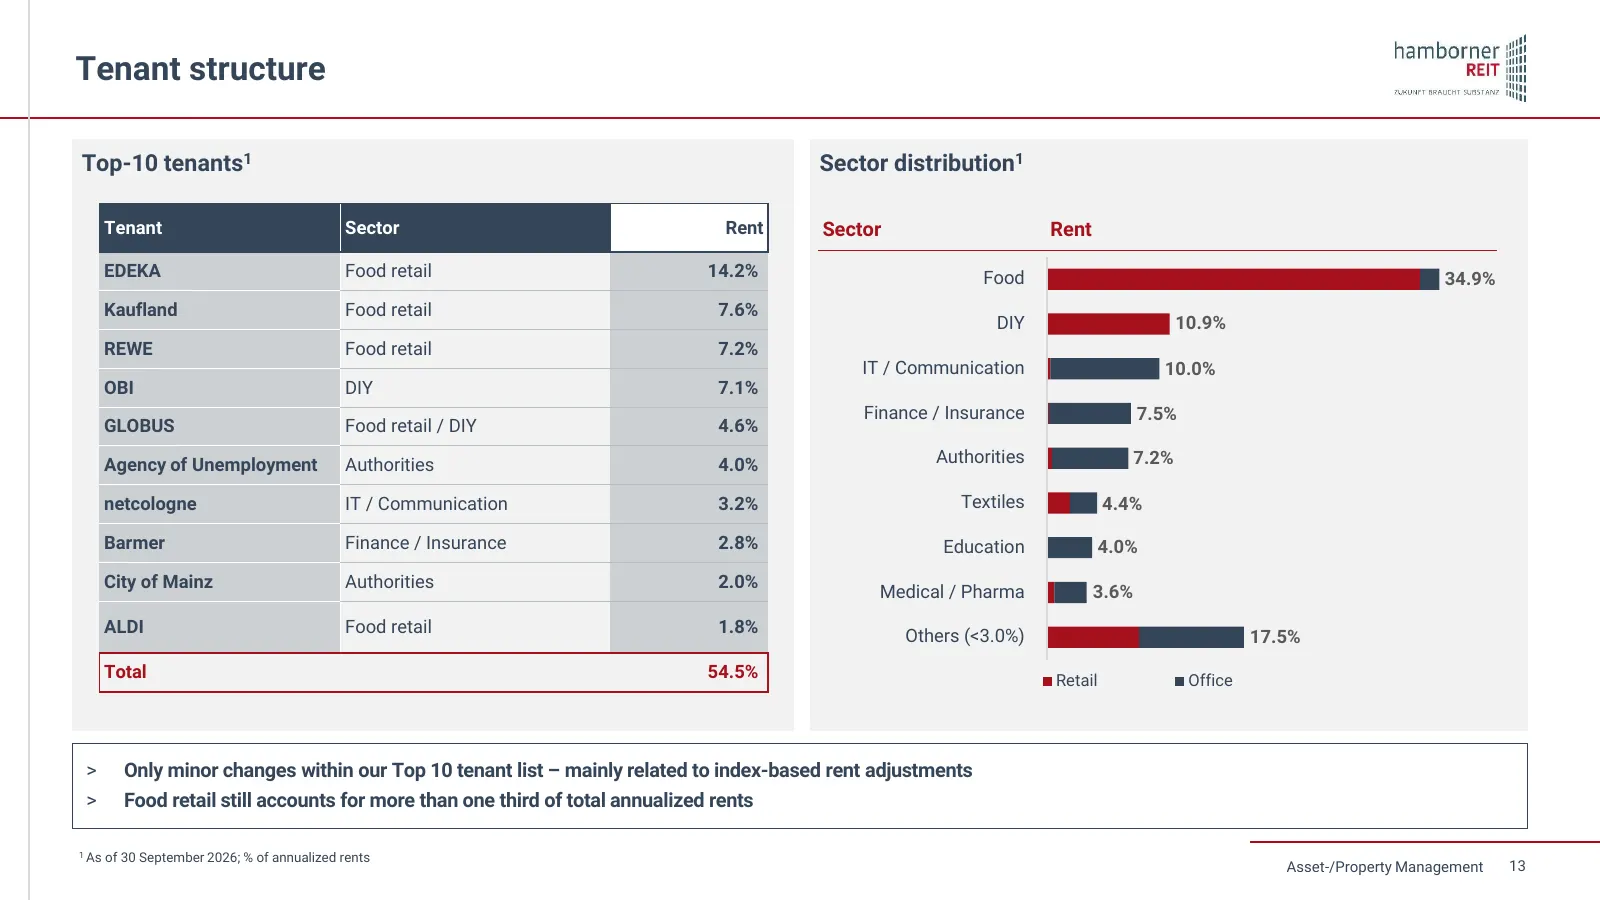
Tenant structure Top-10 tenants1 Sector distribution1 Tenant Sector Rent Sector Rent EDEKA Food retail 14.2% Food 34.9% Kaufland Food retail 7.6% DIY 10.9% REWE Food retail 7.2% IT / Communication 10.0% OBI DIY 7.1% Finance / Insurance 7.5% GLOBUS Food retail / DIY 4.6% Agency of Unemployment Author
Slide 14: Leasing situation
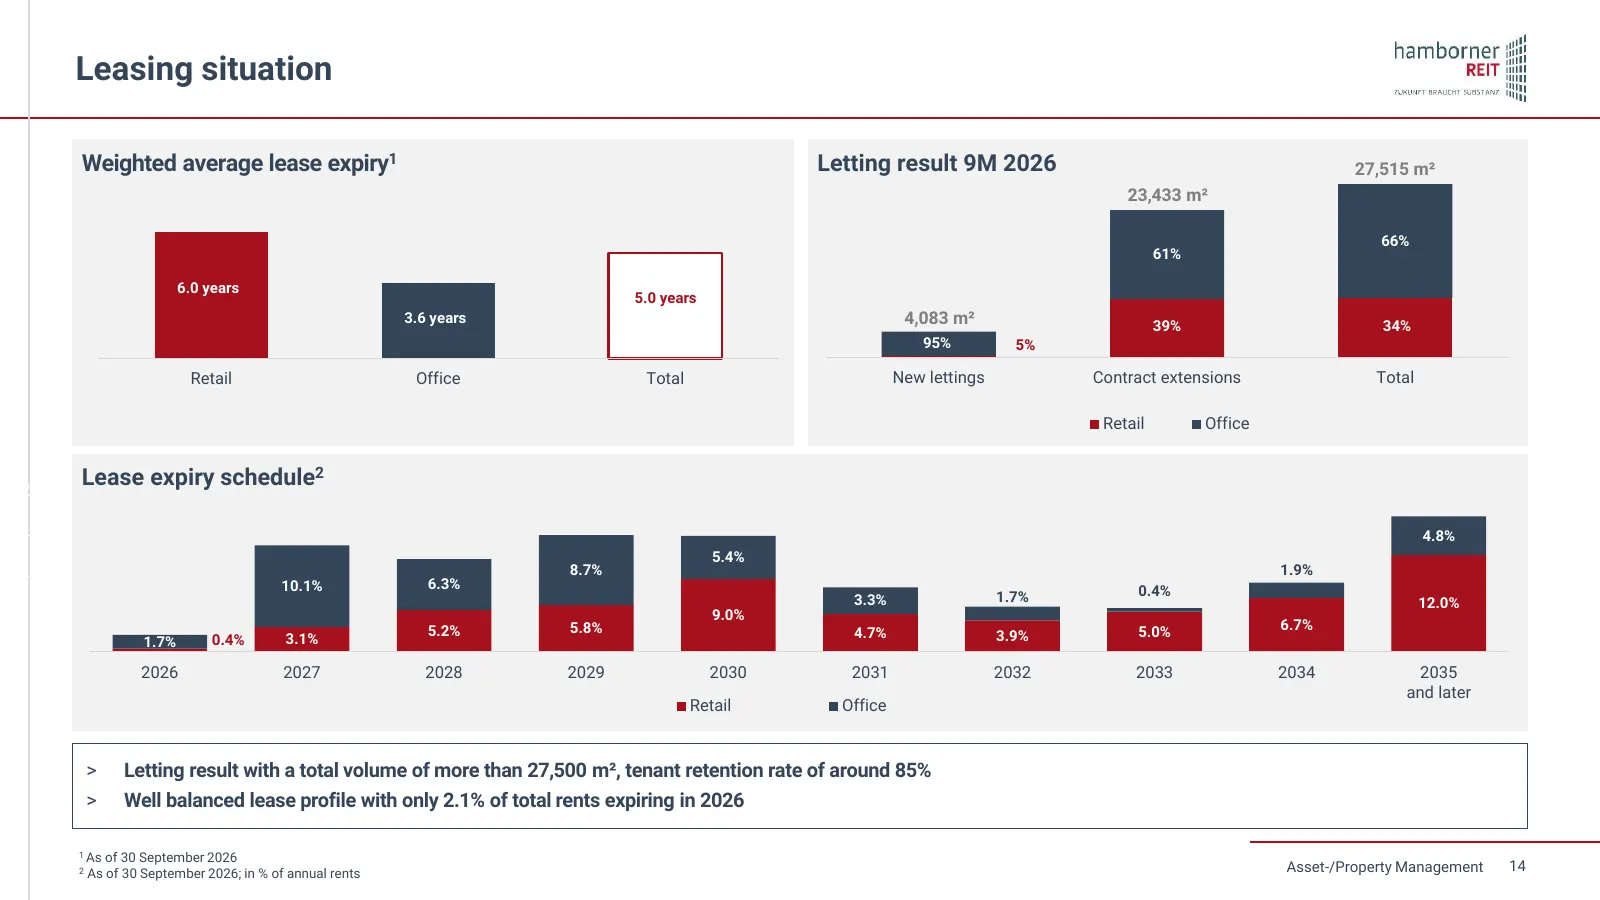
Leasing situation Weighted average lease expiry1 Letting result 9M 2026 27,515 m² 23,433 m² 66% 61% 6.0 years 5.0 years 3.6 years 4,083 m² 39% 34% 95% 5% Retail Office Total New lettings Contract extensions Total Retail Office 20,0% Lease expiry schedule2 15,0% 4.8% 5.4% 10,0% 8.7% 1.9% 10.1% 6.3% 0
Slide 15: Financials
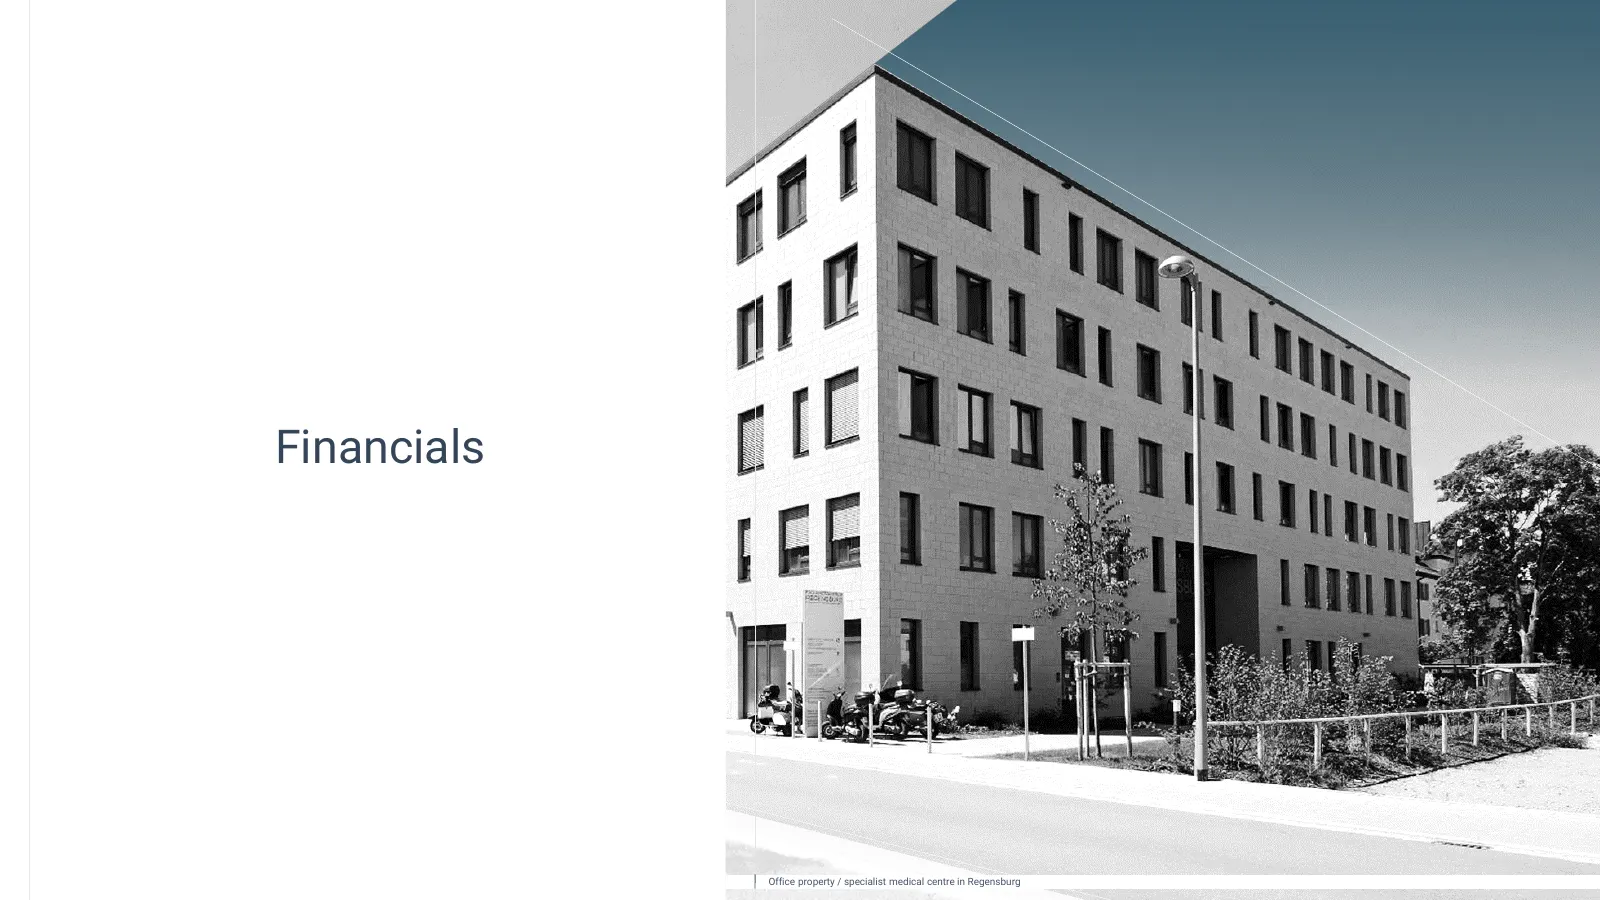
Financials Office property / specialist medical centre in Regensburg
Slide 16: Revenue and Earnings Development
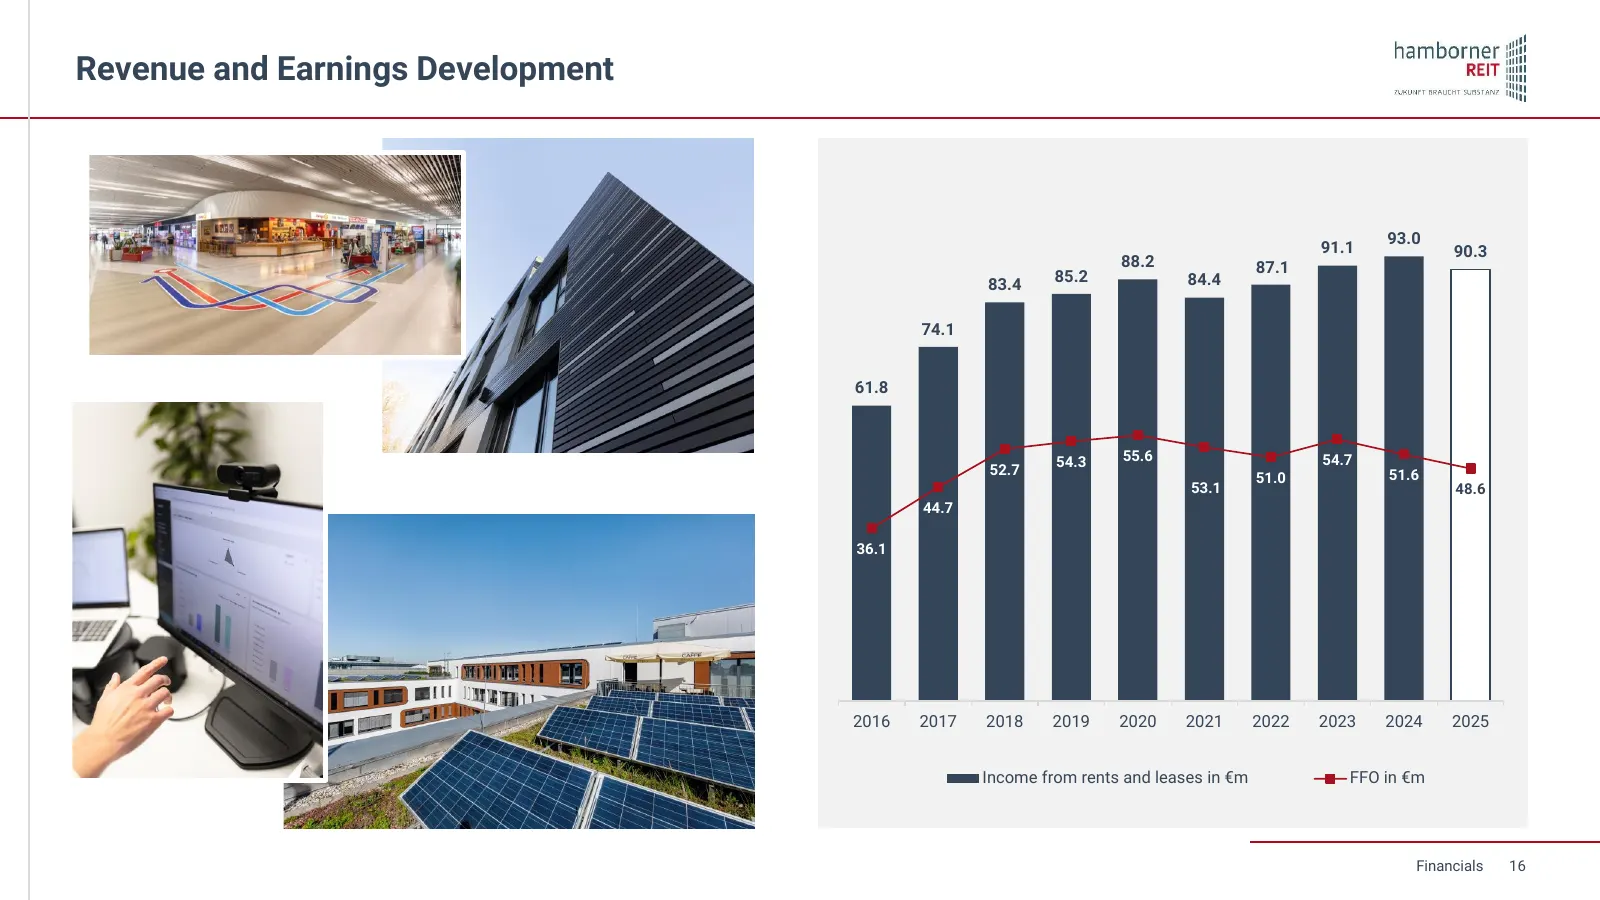
Revenue and Earnings Development 93.0 91.1 90.3 88.2 87.1 85.2 84.4 83.4 74.1 61.8 54.3 55.6 54.7 52.7 51.6 51.0 53.1 48.6 44.7 36.1 2016 2017 2018 2019 2020 2021 2022 2023 2024 2025 Income from rents and leases in €m FFO in €m Financials 16
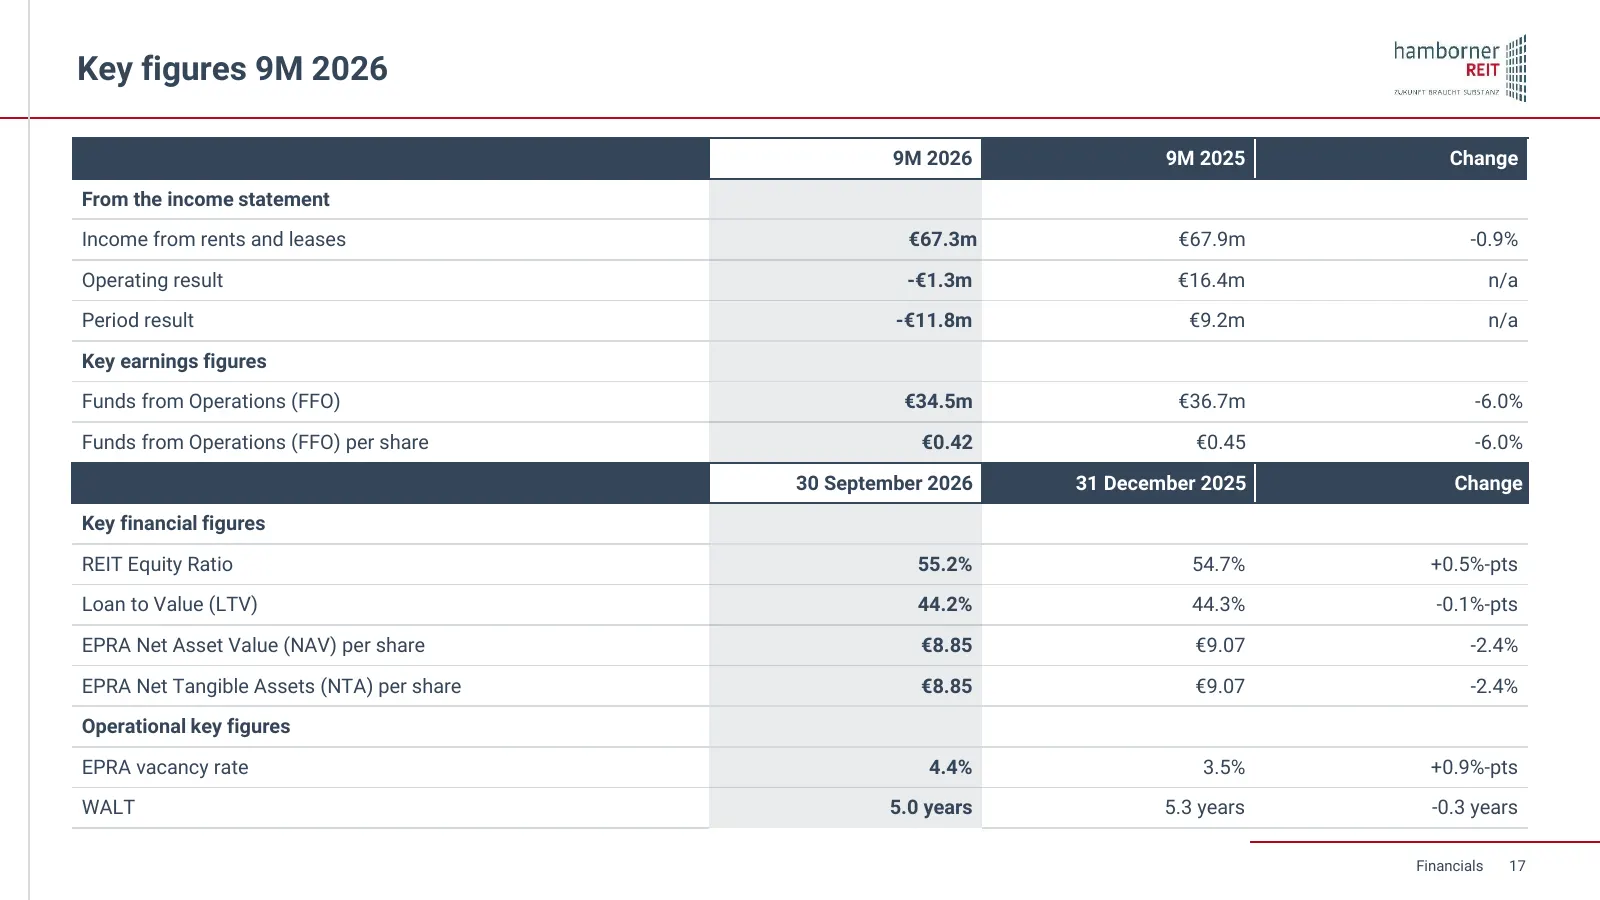
Slide 17: Key figures 9M 2026
Key figures 9M 2026 9M 2026 9M 2025 Change From the income statement Income from rents and leases €67.3m €67.9m -0.9% Operating result -€1.3m €16.4m n/a Period result -€11.8m €9.2m n/a Key earnings figures Funds from Operations (FFO) €34.5m €36.7m -6.0% Funds from Operations (FFO) per share €0.42 €0
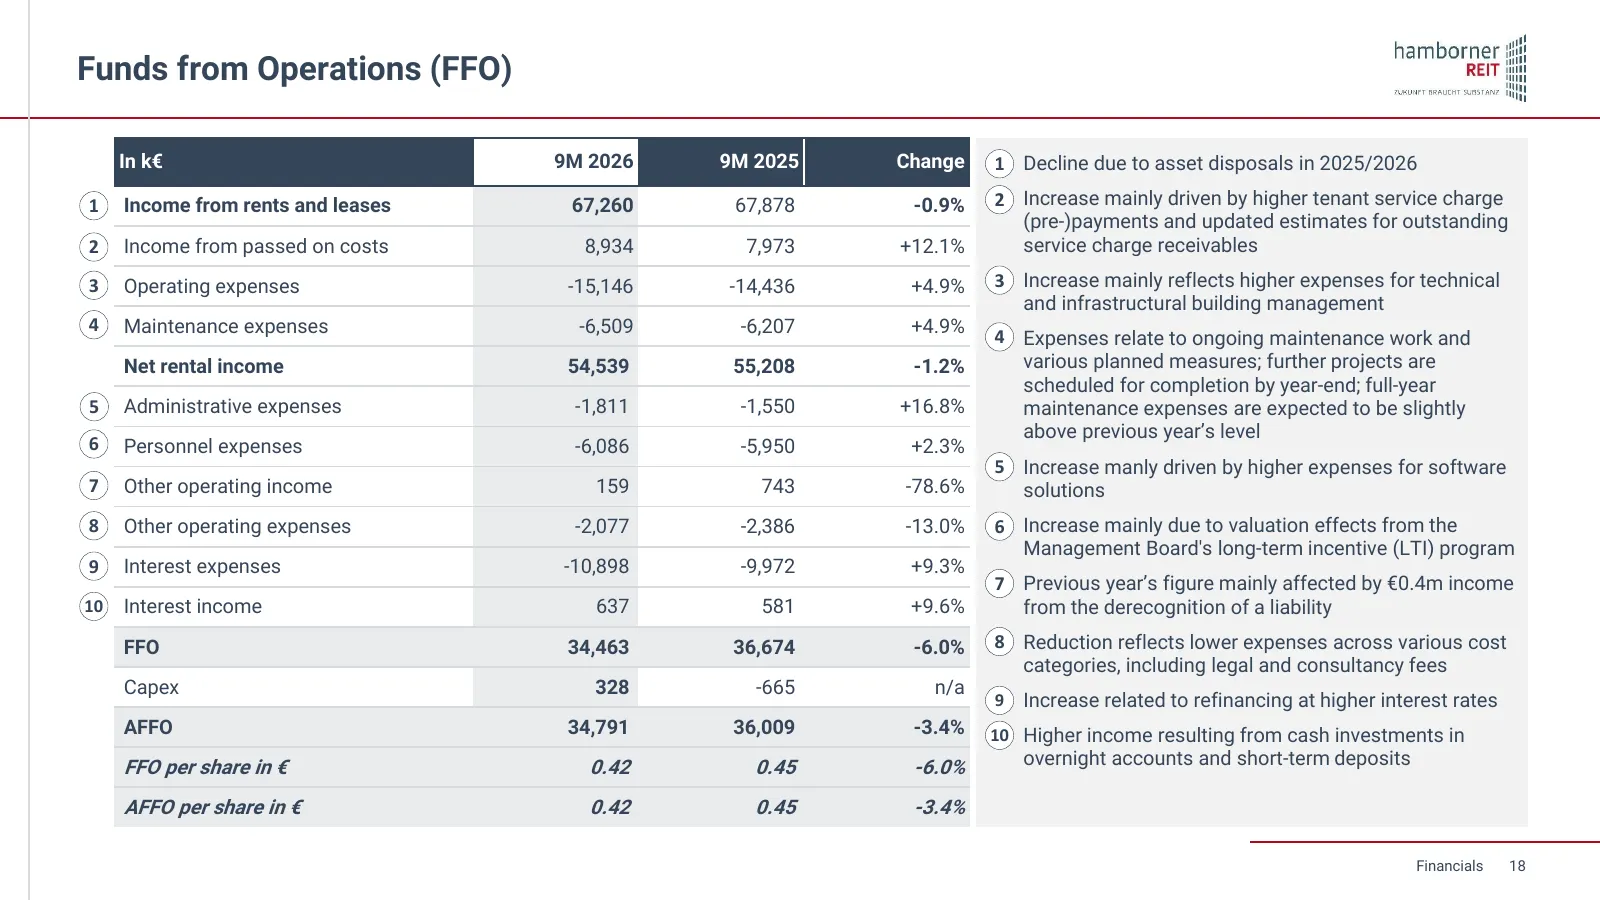
Slide 18: Funds from Operations (FFO)
Funds from Operations (FFO) In k€ 9M 2026 9M 2025 Change ▪1 Decline due to asset disposals in 2025/2026 1 Income from rents and leases 67,260 67,878 -0.9% ▪2 Increase mainly driven by higher tenant service charge (pre-)payments and updated estimates for outstanding 2 Income from passed on costs 8,93
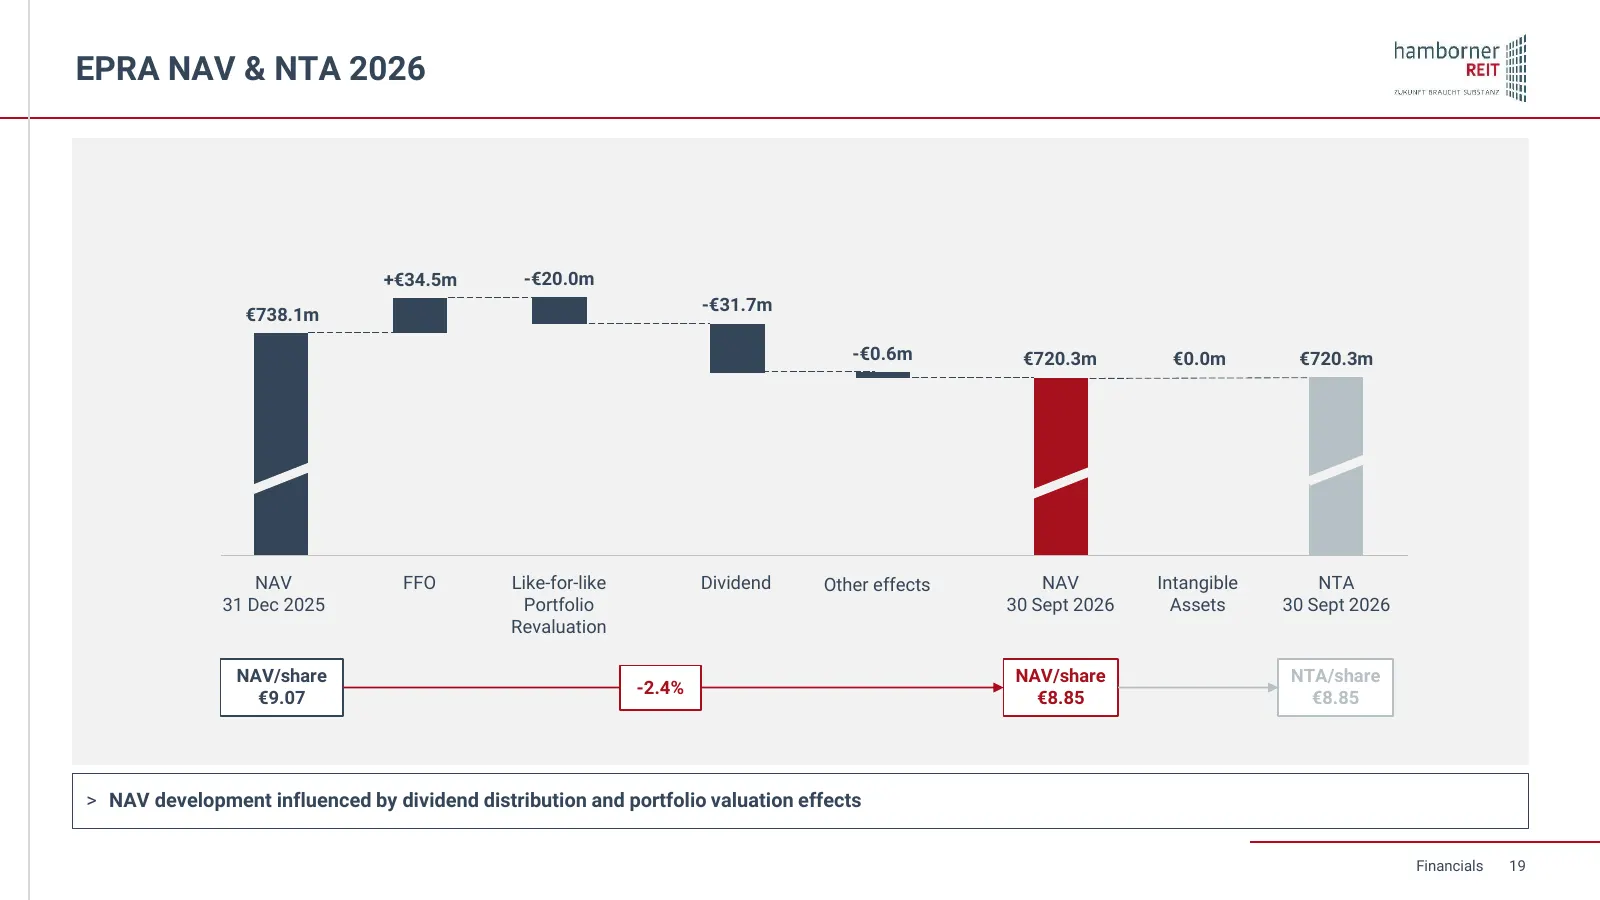
Slide 19: EPRA NAV & NTA 2026
EPRA NAV & NTA 2026 +€34.5m -€20.0m -€31.7m €738.1m -€0.6m €720.3m €0.0m €720.3m NAV FFO Like-for-like Dividend Other effects NAV Intangible NTA 31 Dec 2025 Portfolio 30 Sept 2026 Assets 30 Sept 2026 Revaluation NAV/share NAV/share NTA/share -2.4% €9.07 €8.85 €8.85 > NAV development influenced by di
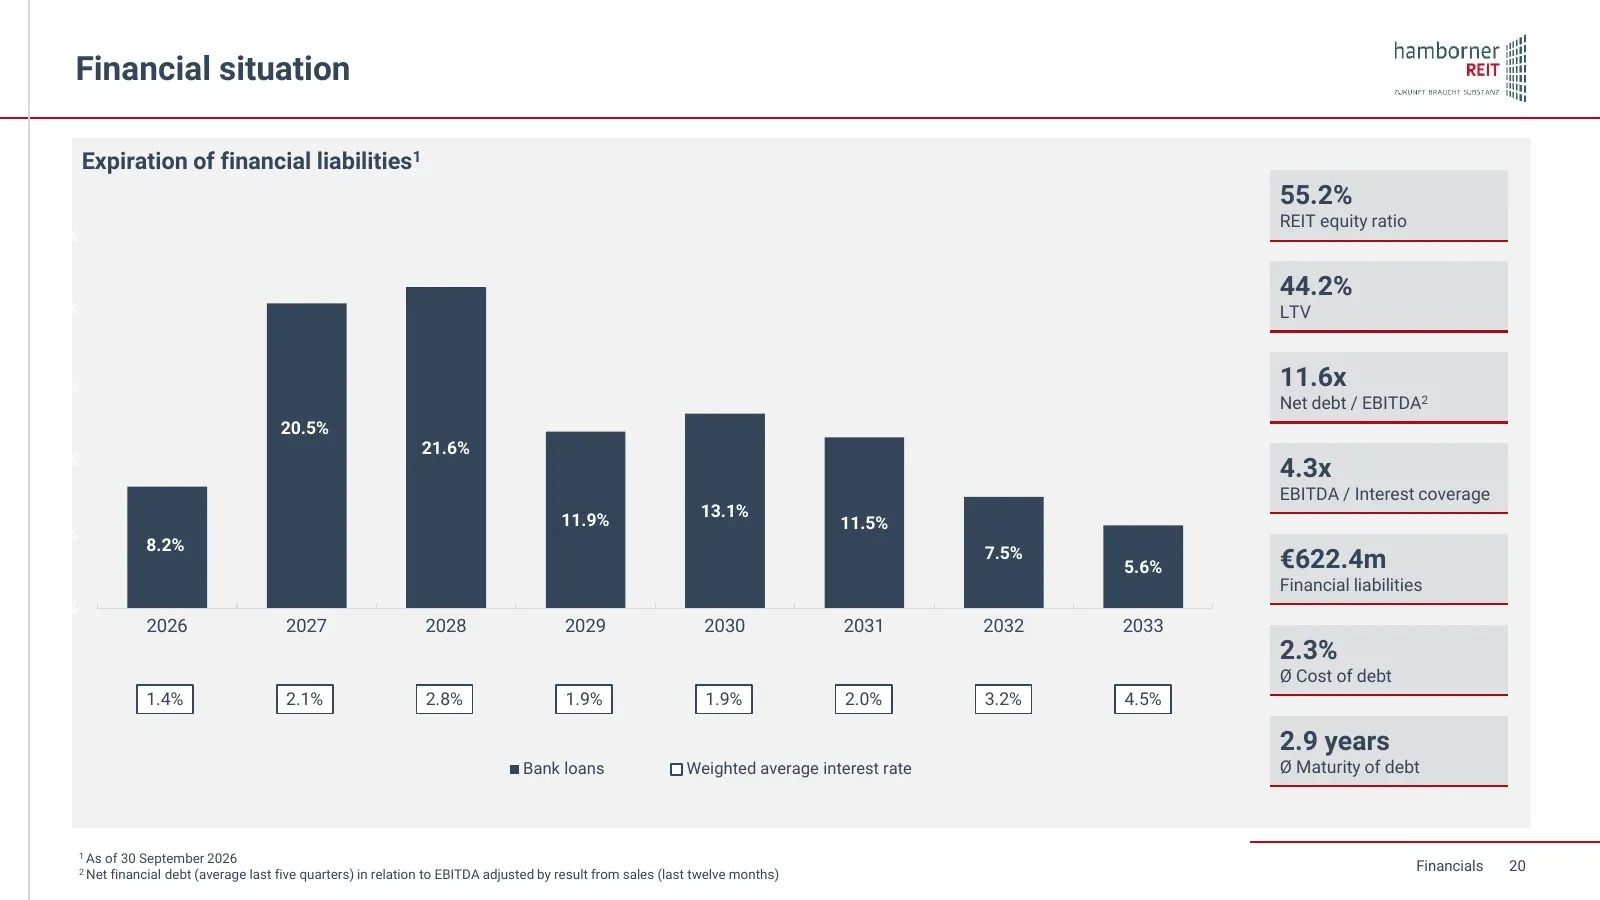
Slide 20: Financial situation
Financial situation Expiration of financial liabilities1 55.2% REIT equity ratio 25,0% 44.2% 20,0% LTV 15,0% 11.6x Net debt / EBITDA2 20.5% 21.6% 10,0% 4.3x EBITDA / Interest coverage 13.1% 11.9% 11.5% 5,0% 8.2% 7.5% 5.6% €622.4m Financial liabilities 0,0% 2026 2027 2028 2029 2030 2031 2032 2033 2.3
Slide 21: Forecast update 2026
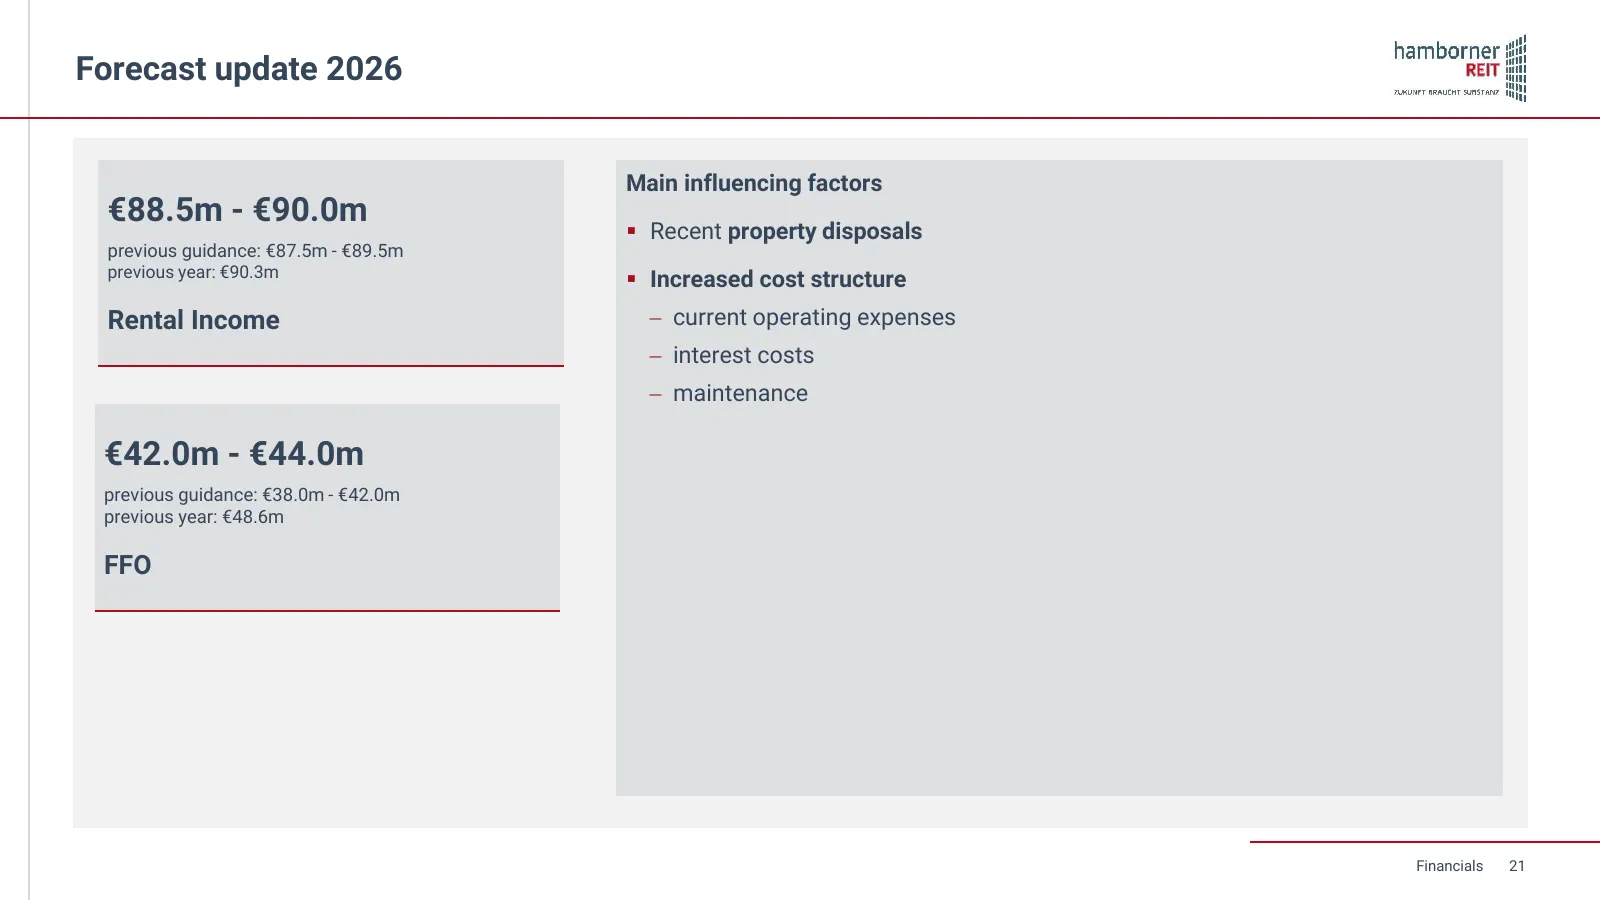
Forecast update 2026 Main influencing factors €88.5m - €90.0m ▪ Recent property disposals previous guidance: €87.5m - €89.5m previous year: €90.3m ▪ Increased cost structure Rental Income − current operating expenses − interest costs − maintenance €42.0m - €44.0m previous guidance: €38.0m - €42.0m p
Slide 22: Dividend strategy
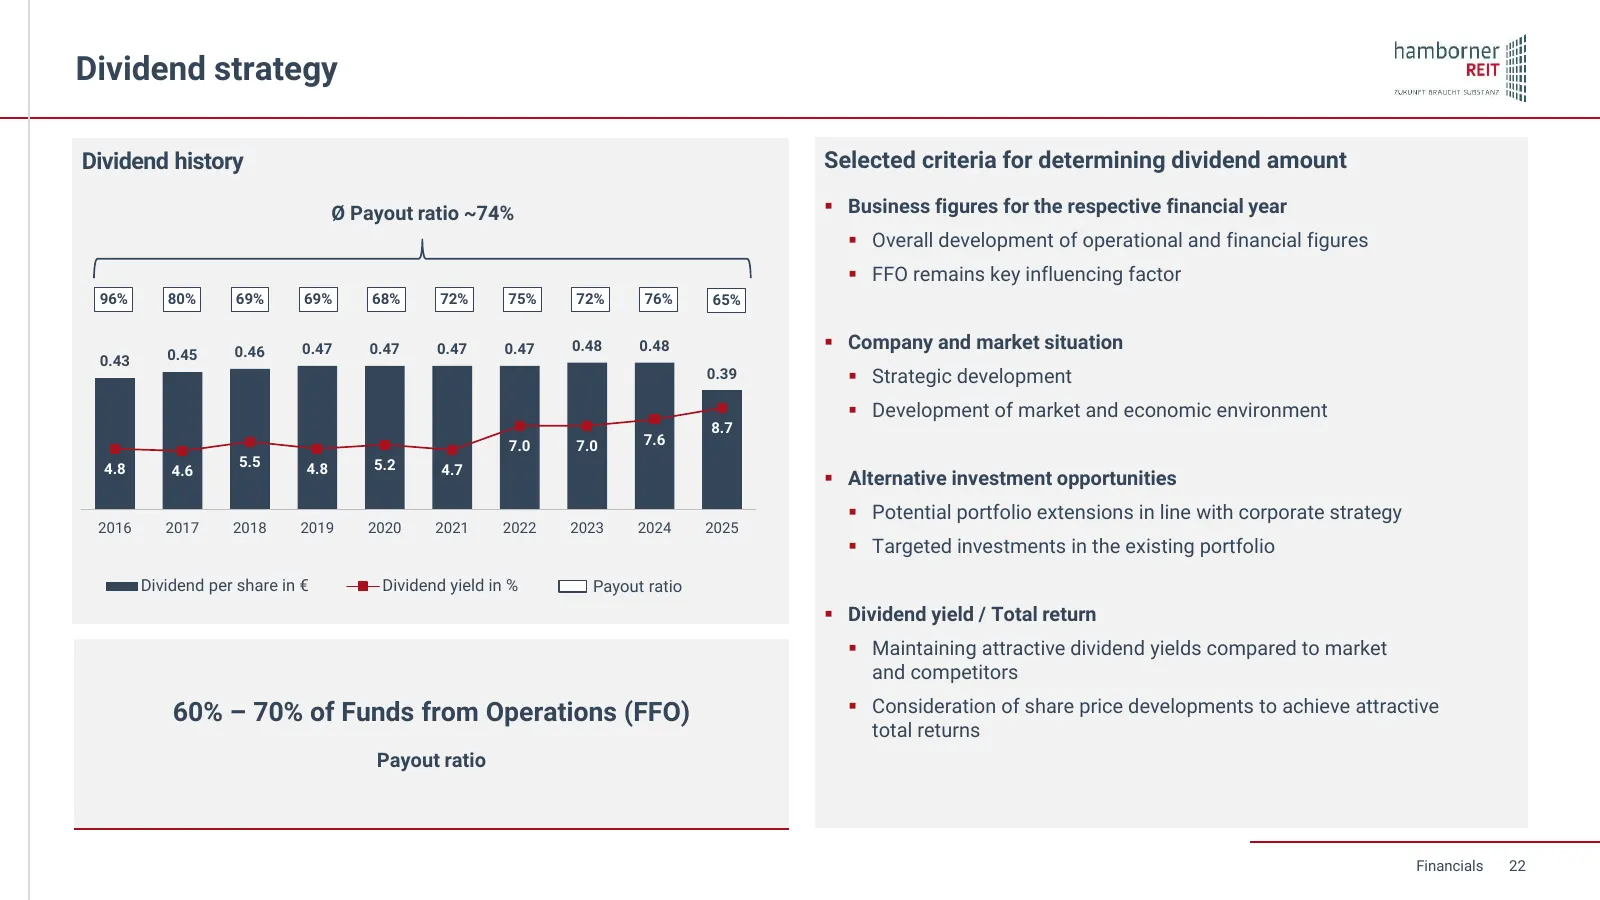
Dividend strategy Dividend history Selected criteria for determining dividend amount Ø Payout ratio ~74% ▪ Business figures for the respective financial year ▪ Overall development of operational and financial figures ▪ FFO remains key influencing factor 96% 80% 69% 69% 68% 72% 75% 72% 76% 65% 0.46 0
Slide 23: Sustainability / ESG
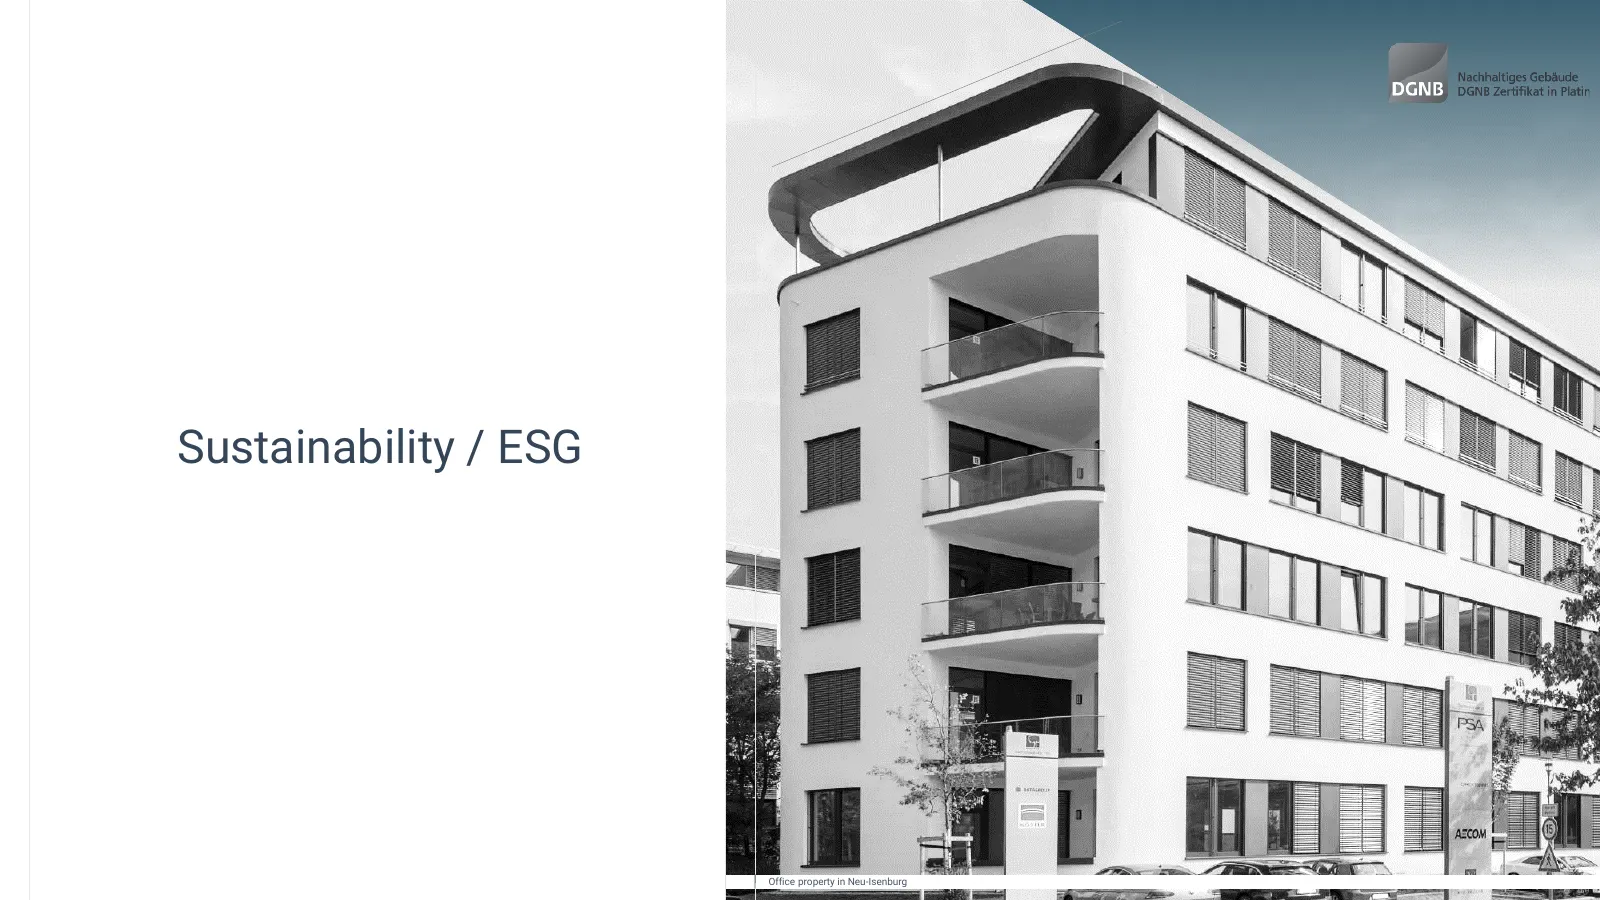
Sustainability / ESG Office property in Neu-Isenburg
Slide 24: ESG strategy
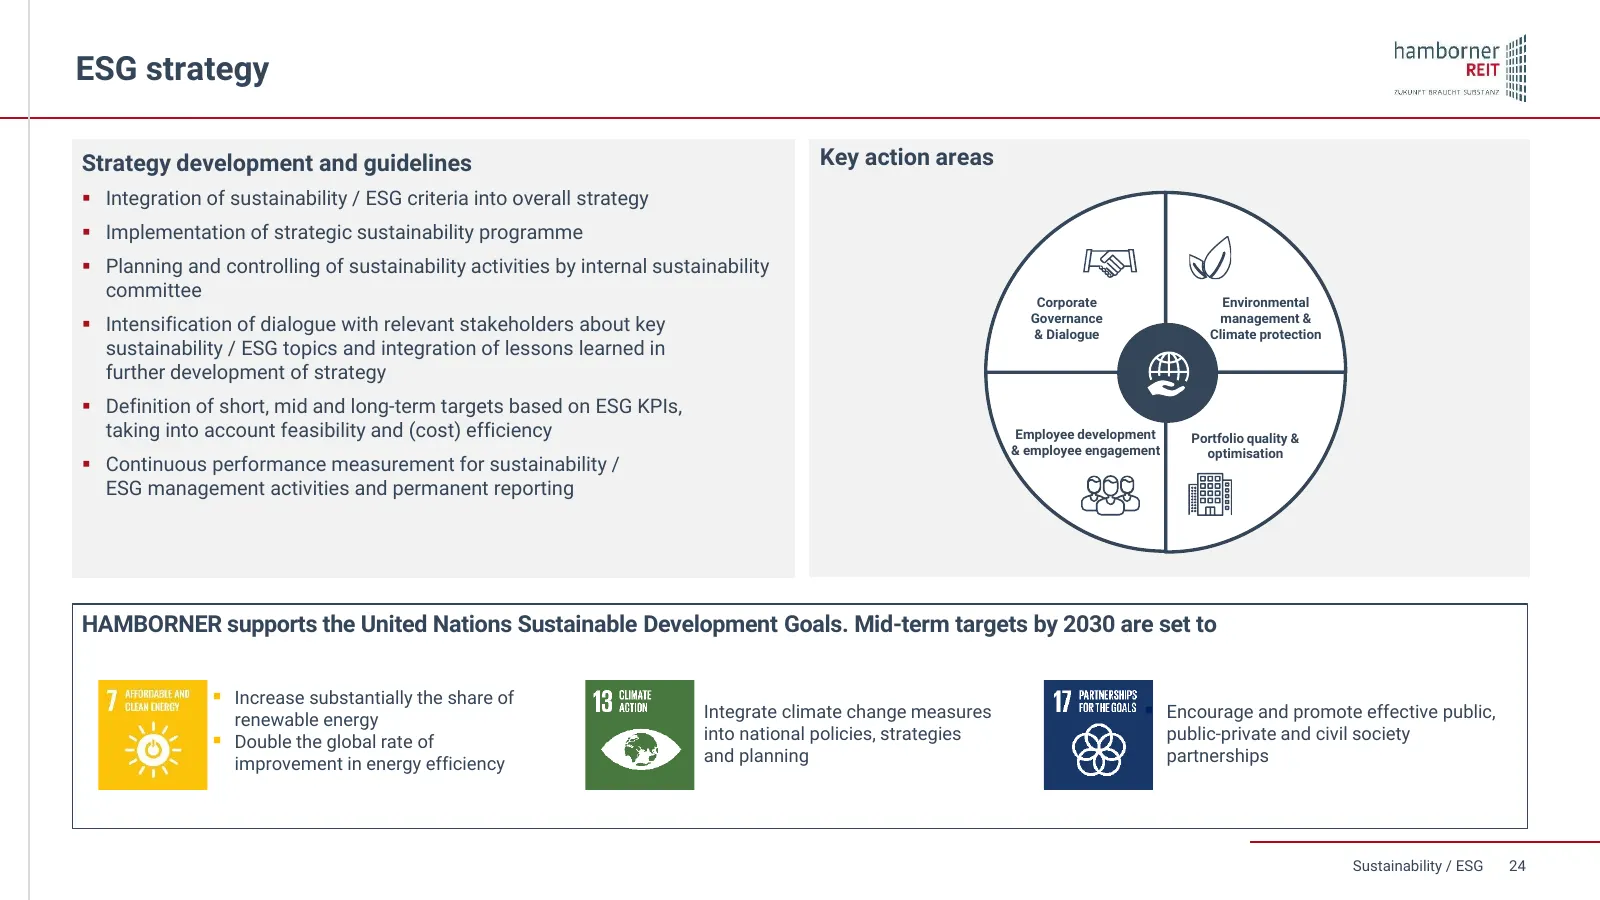
ESG strategy Strategy development and guidelines Key action areas ▪ Integration of sustainability / ESG criteria into overall strategy ▪ Implementation of strategic sustainability programme ▪ Planning and controlling of sustainability activities by internal sustainability committee Corporate Environ
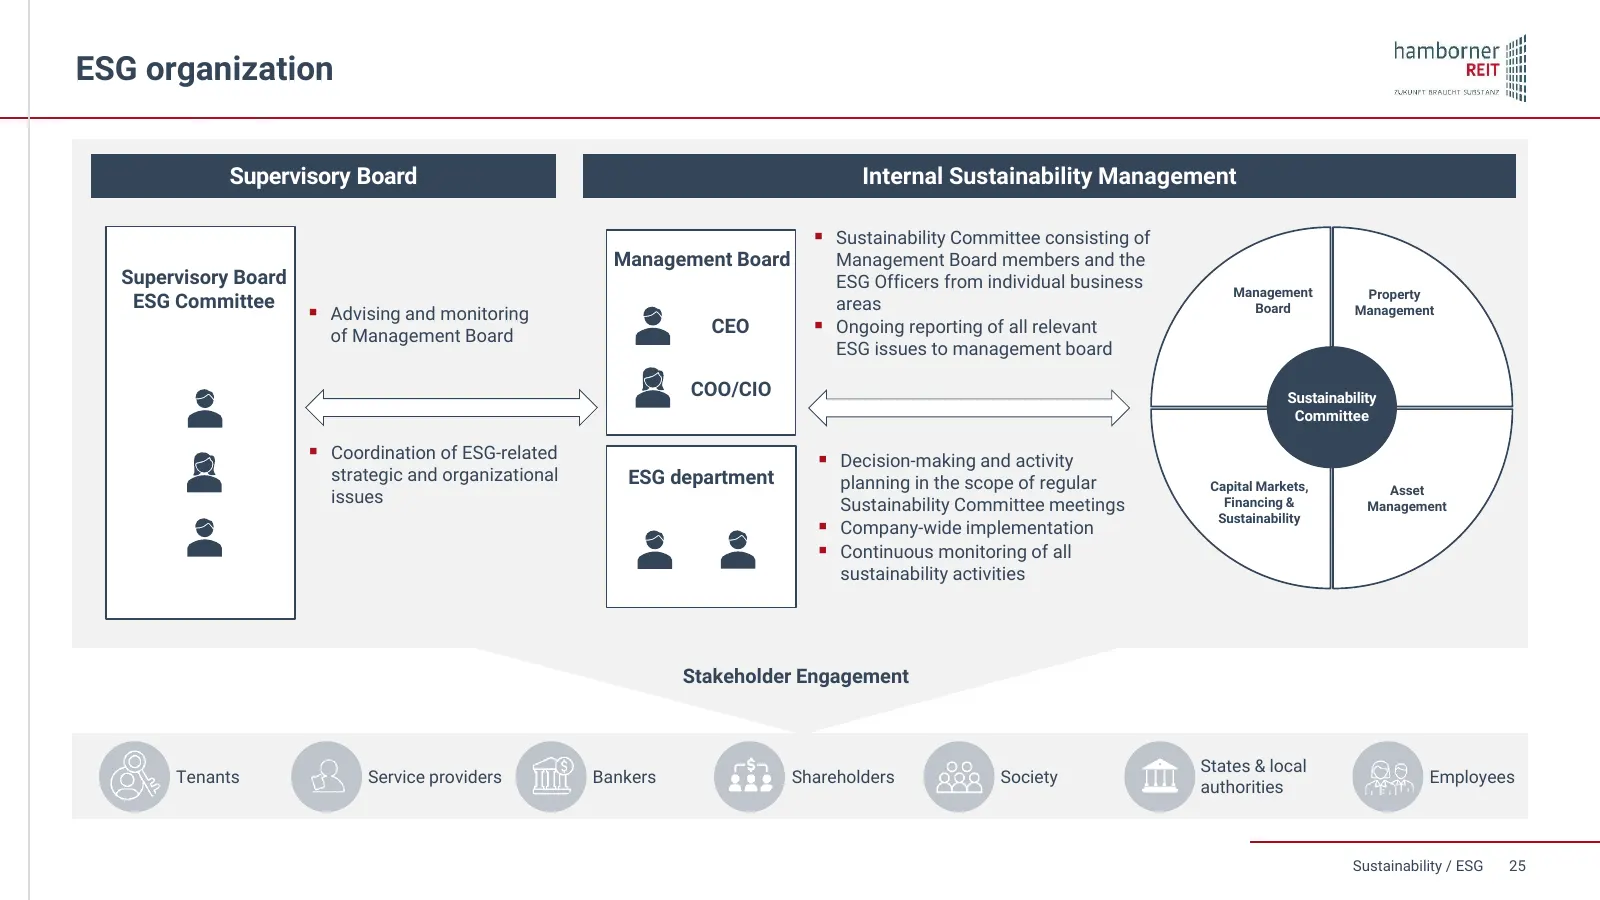
Slide 25: ESG organization
ESG organization Supervisory Board Internal Sustainability Management ▪ Sustainability Committee consisting of Management Board Management Board members and the Supervisory Board ESG Officers from individual business Management Property ESG Committee areas ▪ Advising and monitoring Board Management
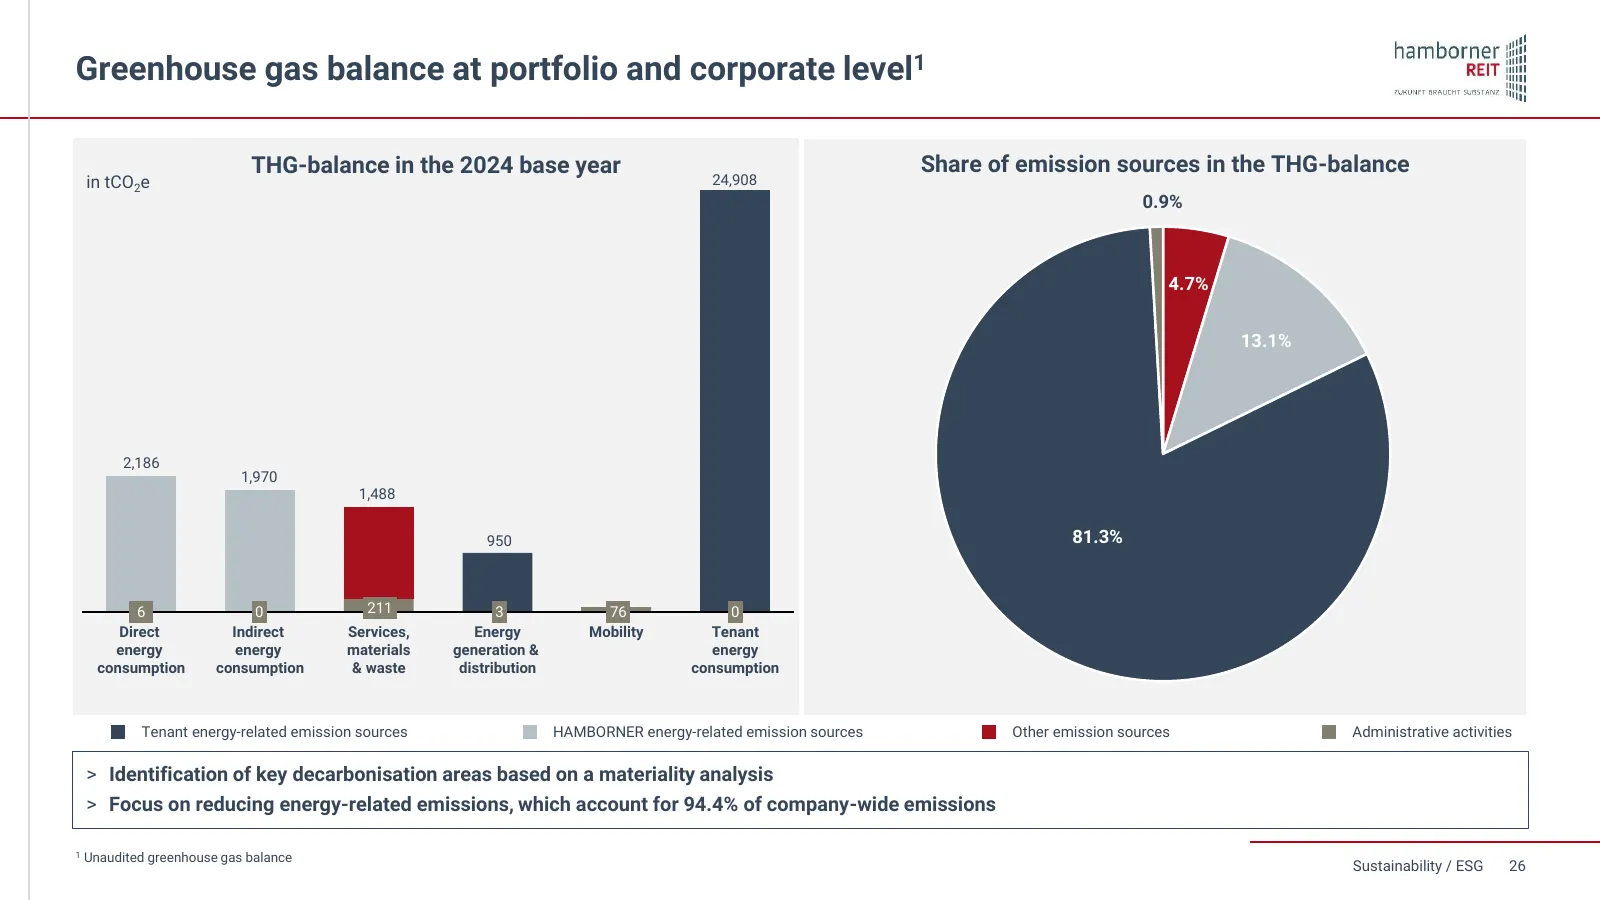
Slide 26: Greenhouse gas balance at portfolio and corporate level
Greenhouse gas balance at portfolio and corporate level1 THG-balance in the 2024 base year Share of emission sources in the THG-balance in tCO2e 24,908 0.9% 4.7% 13.1% 2,186 1,970 1,488 950 81.3% 6 0 211 3 76 0 Direct Indirect Services, Energy Mobility Tenant energy energy materials generation & ene
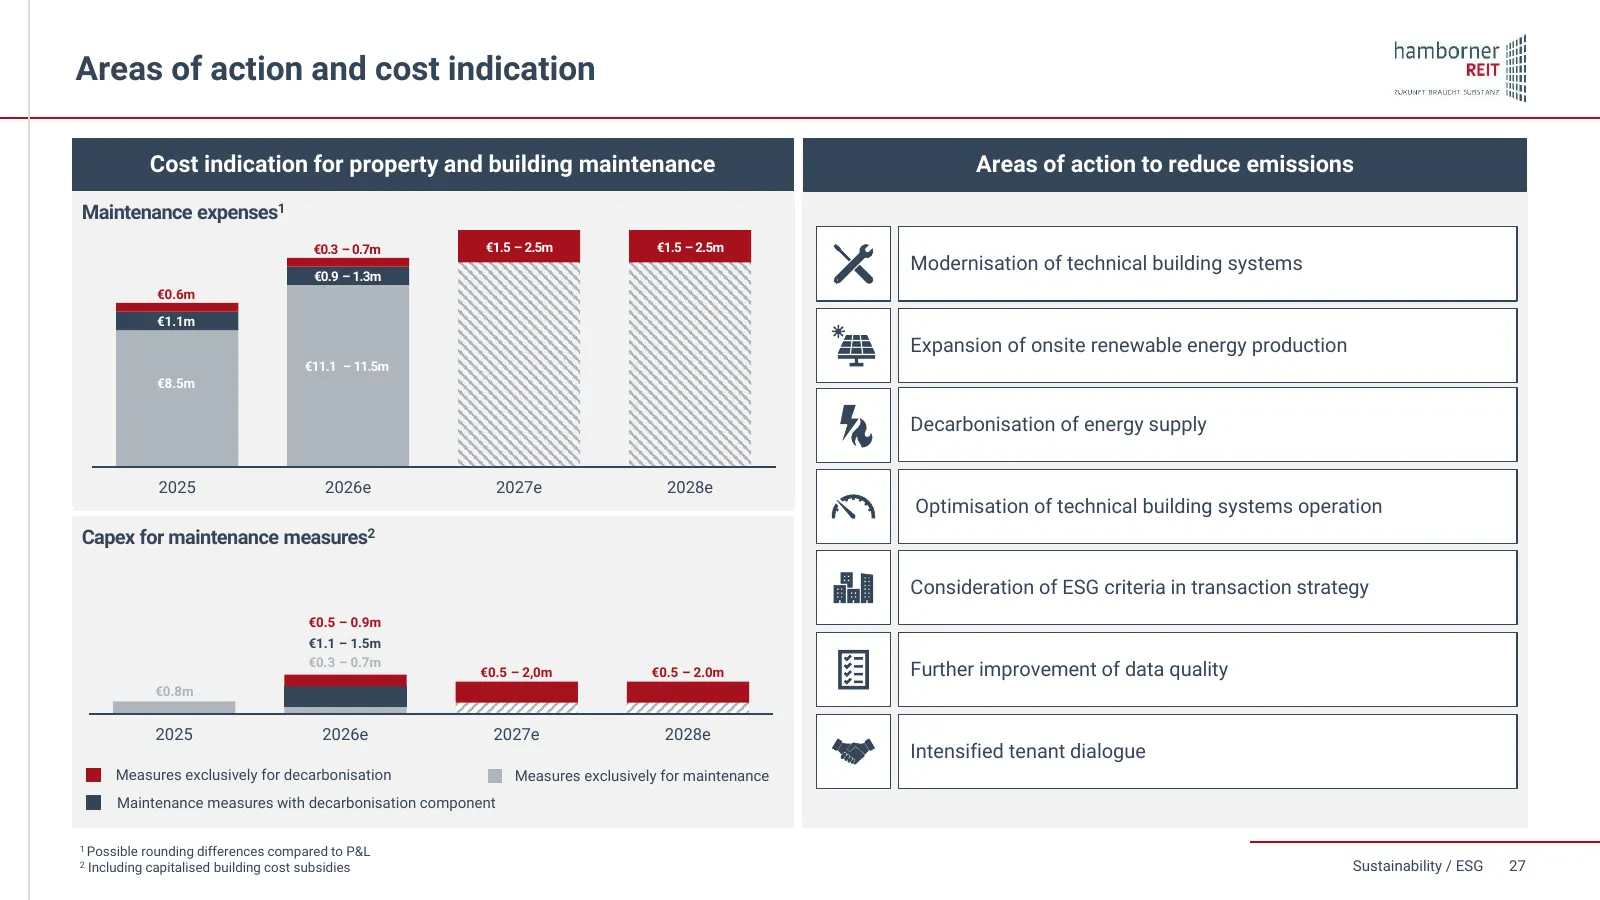
Slide 27: Areas of action and cost indication
Areas of action and cost indication Cost indication for property and building maintenance Areas of action to reduce emissions Maintenance expenses1 €0.3 – 0.7m €1.5 – 2.5m €1.5 – 2.5m Modernisation of technical building systems €0.9 – 1.3m €0.6m €1.1m Expansion of onsite renewable energy production
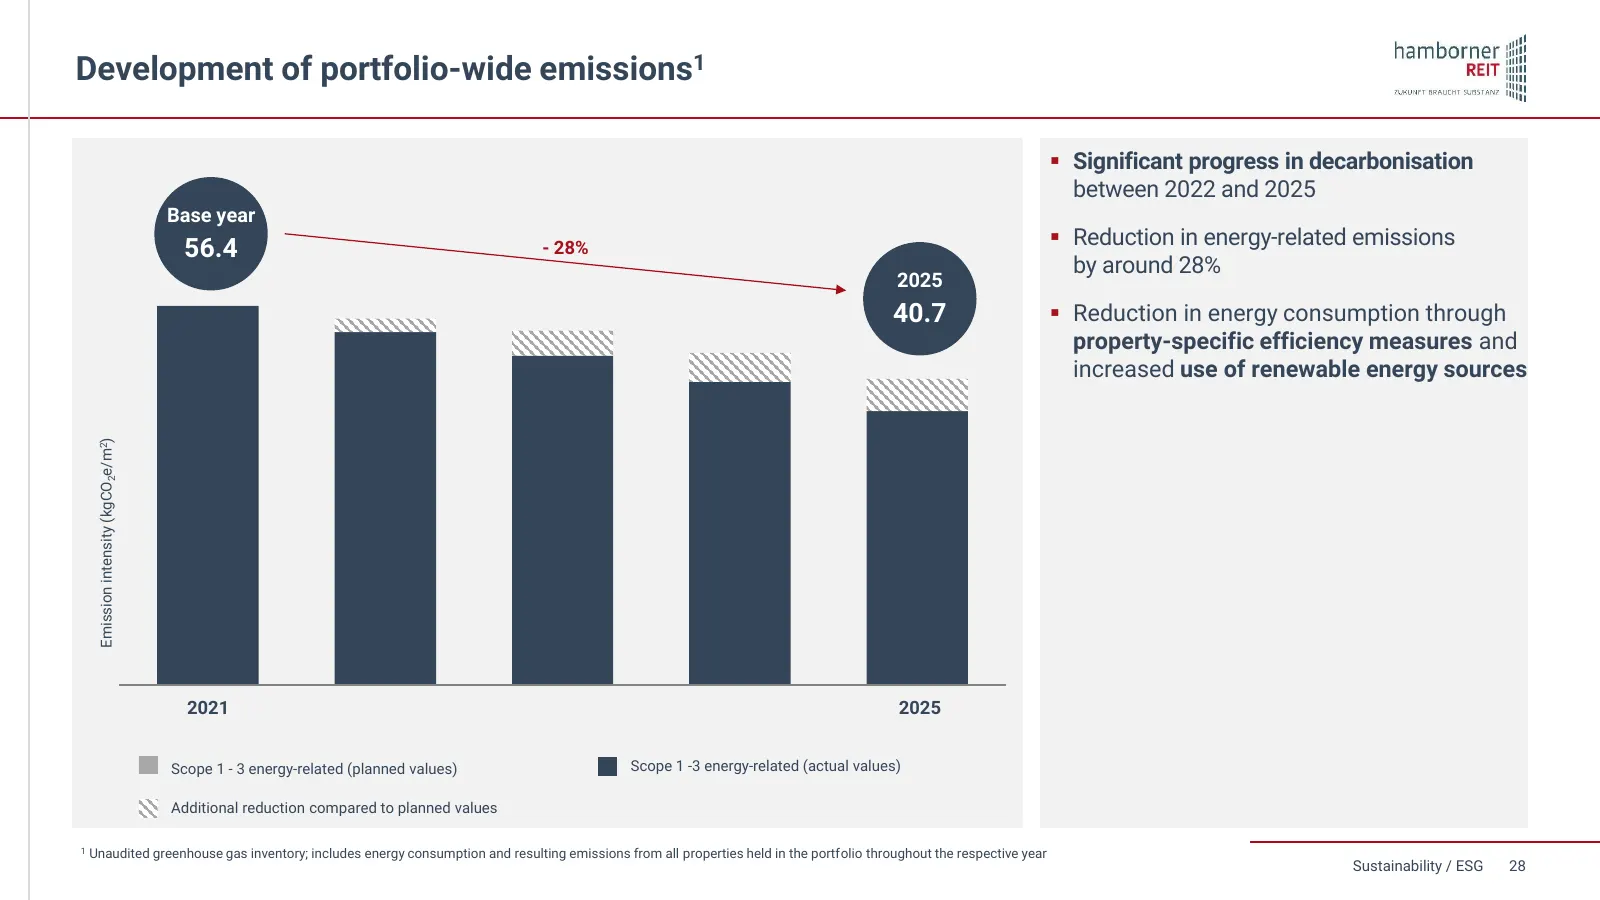
Slide 28: Development of portfolio-wide emissions
Development of portfolio-wide emissions1 ▪ Significant progress in decarbonisation between 2022 and 2025 Base year ▪ Reduction in energy-related emissions 56.4 - 28% by around 28% 2025 40.7 ▪ Reduction in energy consumption through property-specific efficiency measures and / m²) increased use of ren
Slide 29: Appendix
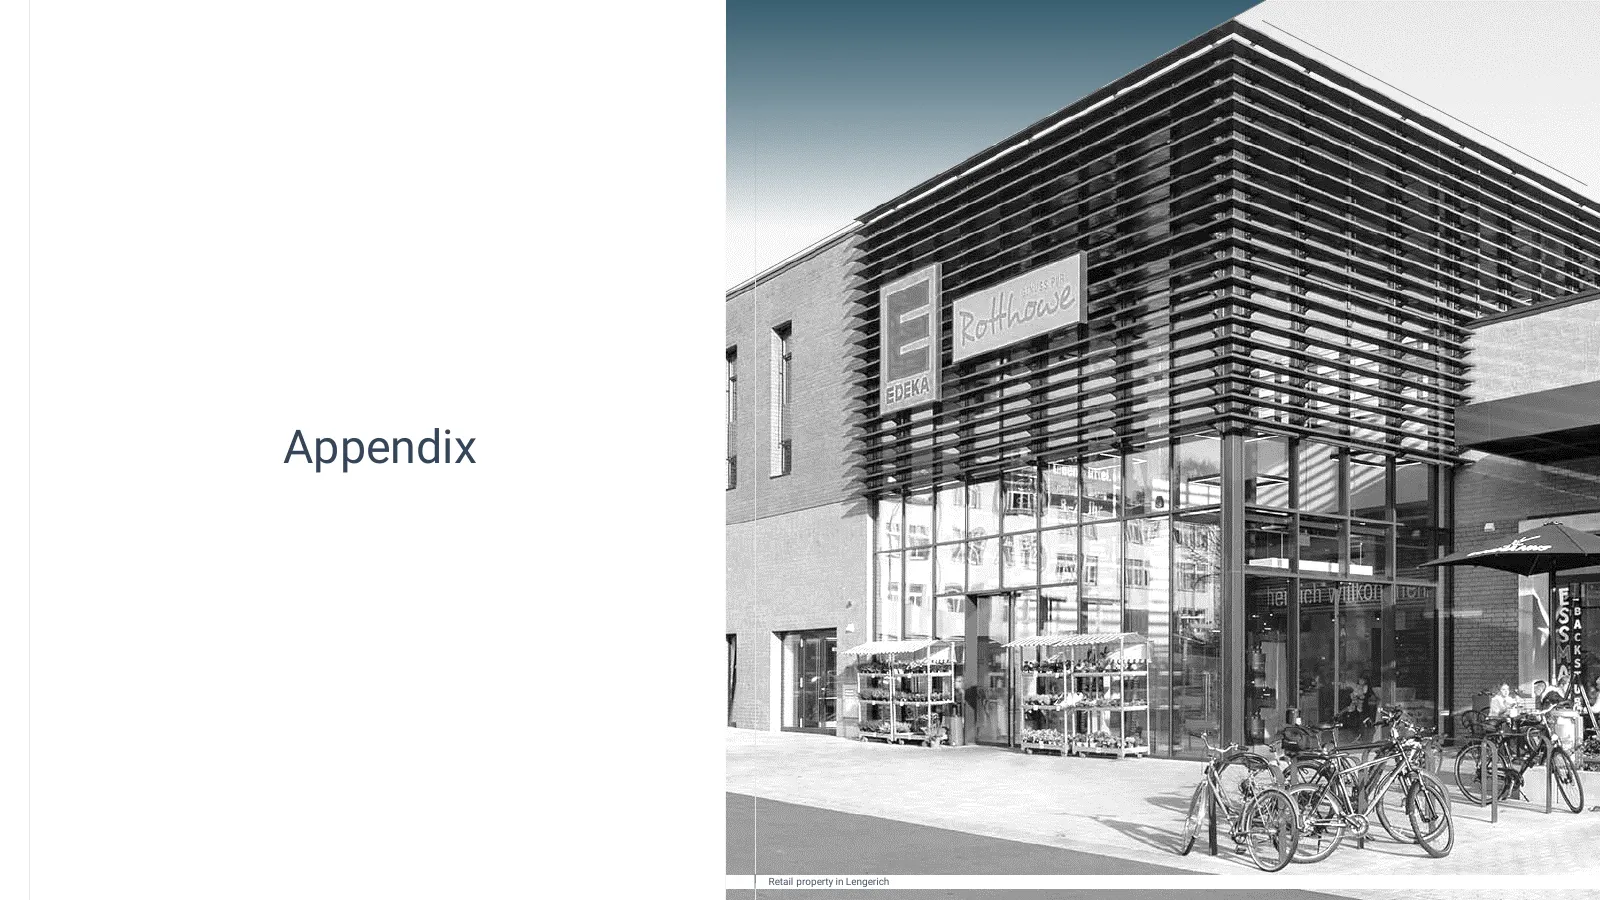
Appendix Retail property in Lengerich
Slide 30: Acquisition Profile
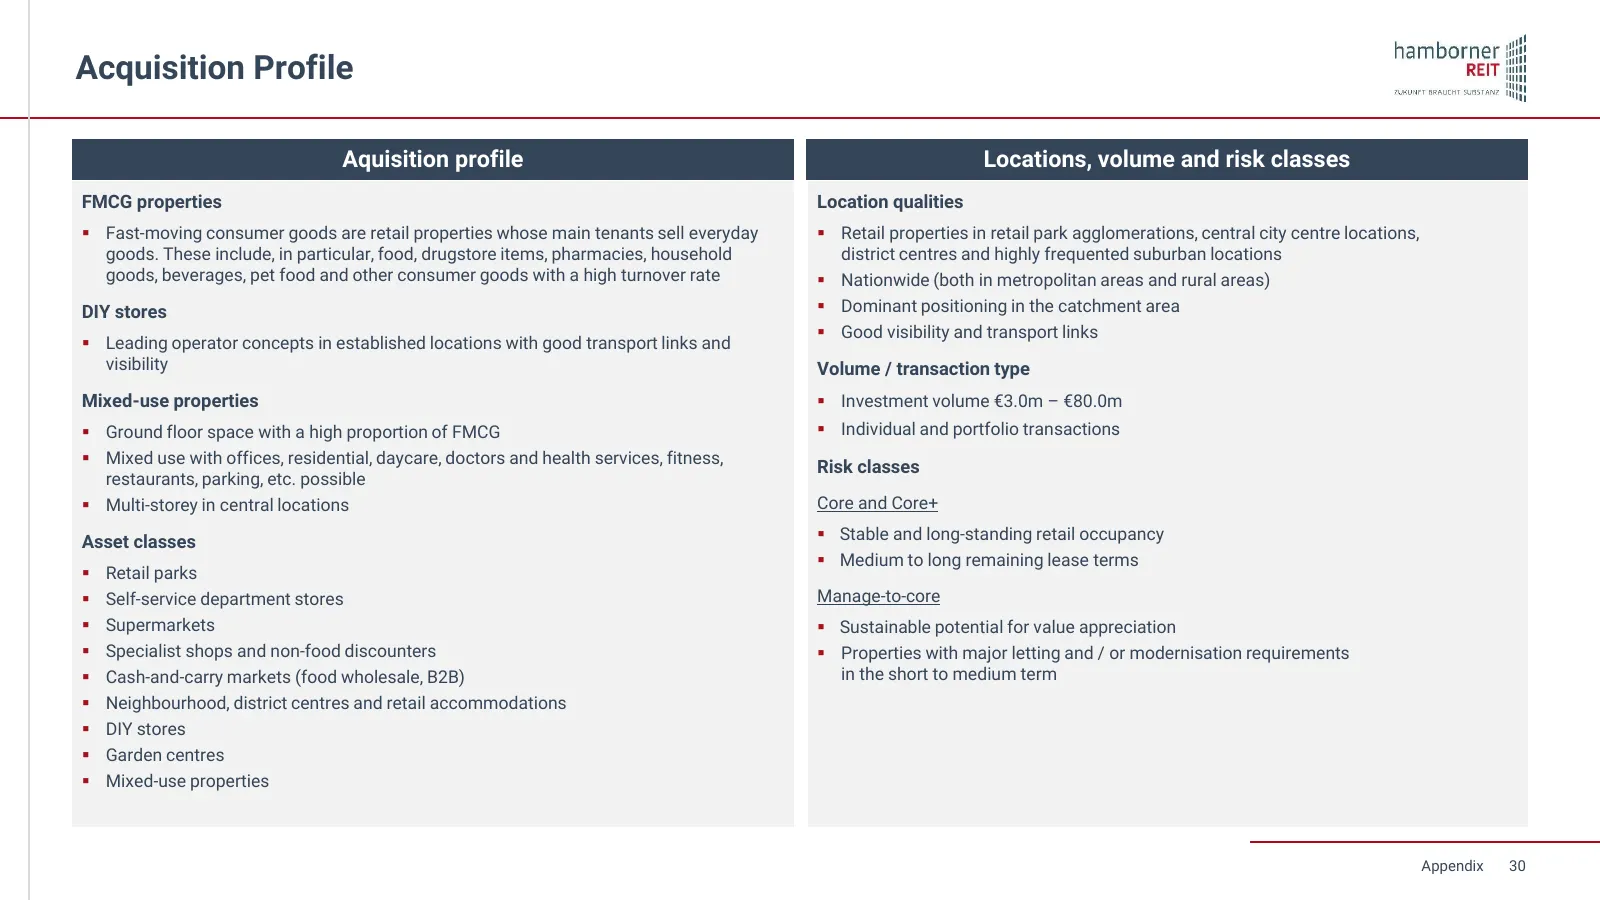
Acquisition Profile Aquisition profile Locations, volume and risk classes FMCG properties Location qualities ▪ Fast-moving consumer goods are retail properties whose main tenants sell everyday ▪ Retail properties in retail park agglomerations, central city centre locations, goods. These include, in
Slide 31: Top-10 Properties (1/2)
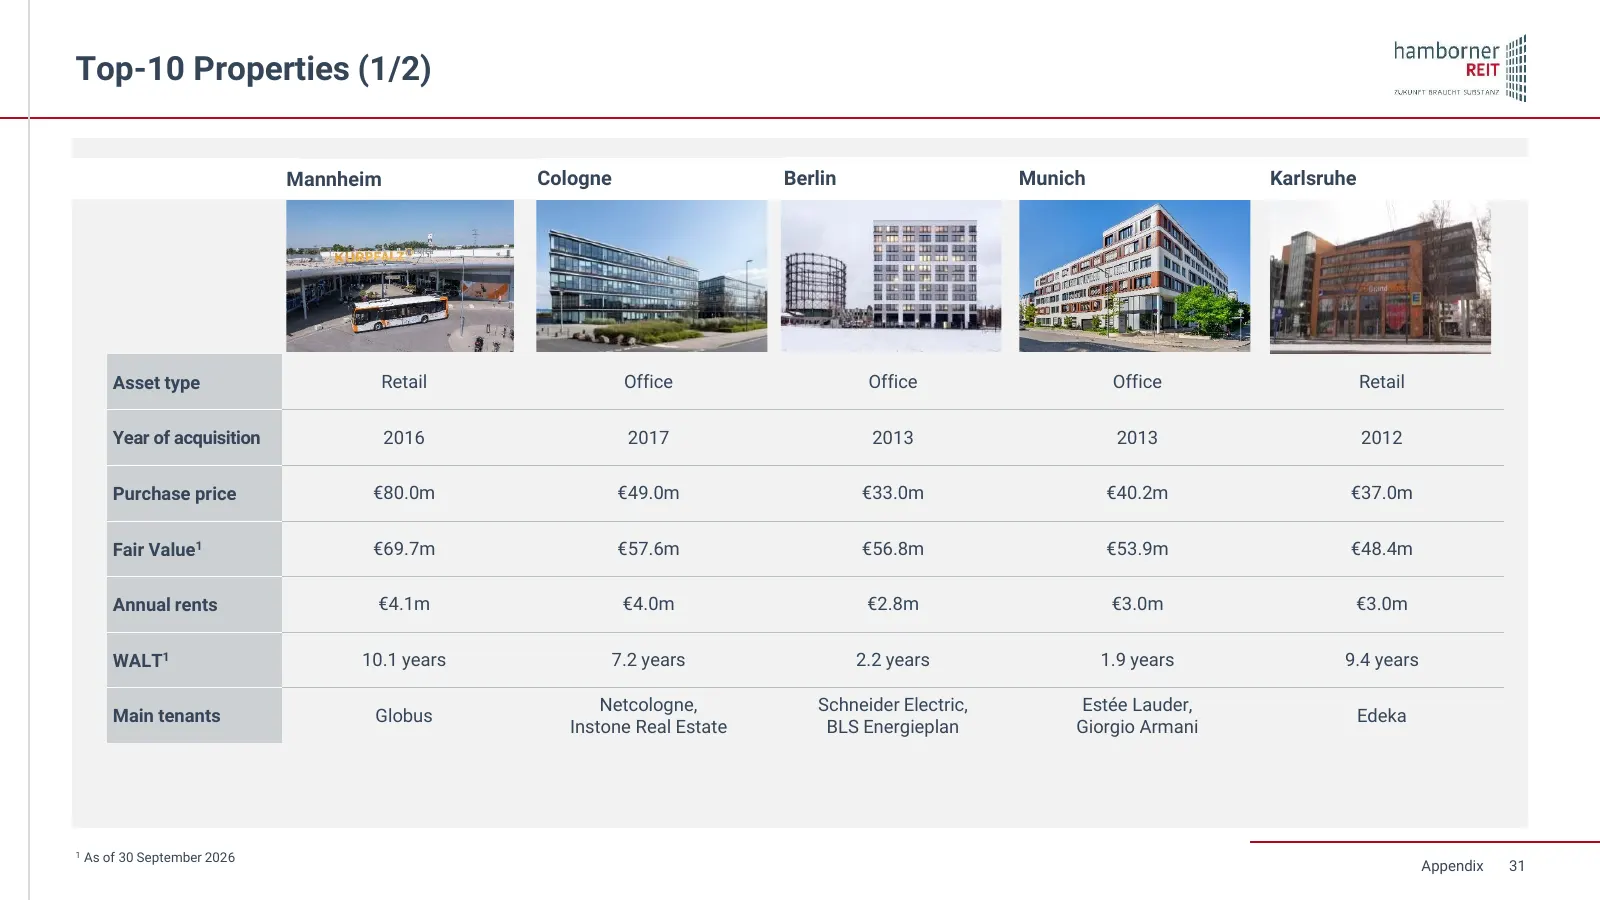
Top-10 Properties (1/2) Mannheim Cologne Berlin Munich Karlsruhe Asset type Retail Office Office Office Retail Year of acquisition 2016 2017 2013 2013 2012 Purchase price €80.0m €49.0m €33.0m €40.2m €37.0m Fair Value1 €69.7m €57.6m €56.8m €53.9m €48.4m Annual rents €4.1m €4.0m €2.8m €3.0m €3.0m WALT
Slide 32: Top-10 Properties (2/2)
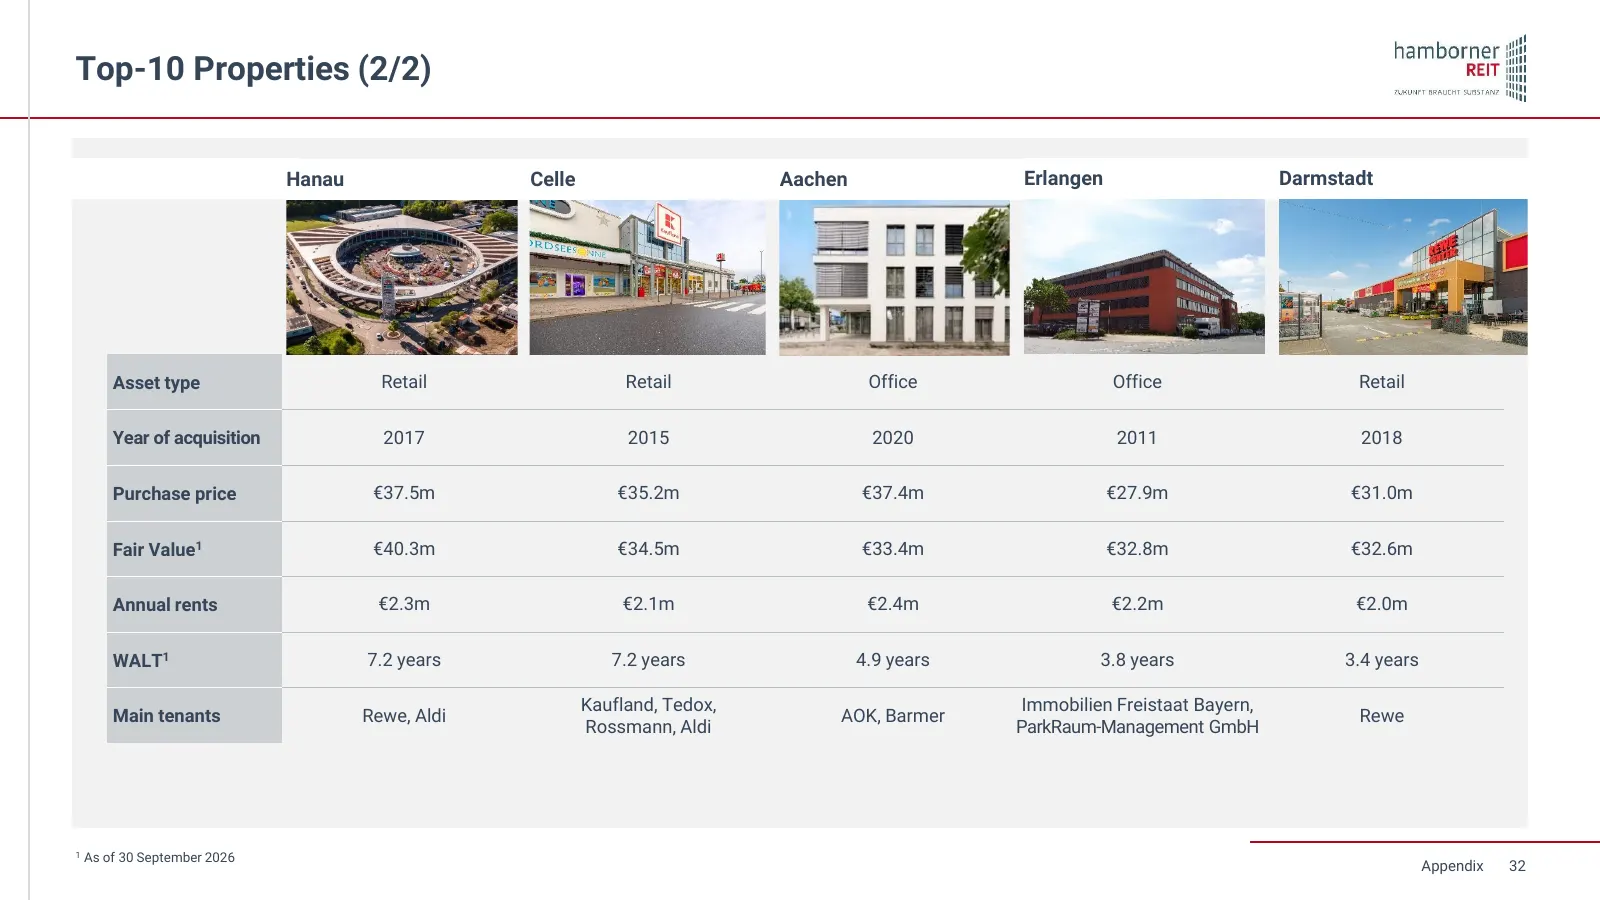
Top-10 Properties (2/2) Hanau Celle Aachen Erlangen Darmstadt Asset type Retail Retail Office Office Retail Year of acquisition 2017 2015 2020 2011 2018 Purchase price €37.5m €35.2m €37.4m €27.9m €31.0m Fair Value1 €40.3m €34.5m €33.4m €32.8m €32.6m Annual rents €2.3m €2.1m €2.4m €2.2m €2.0m WALT1 7
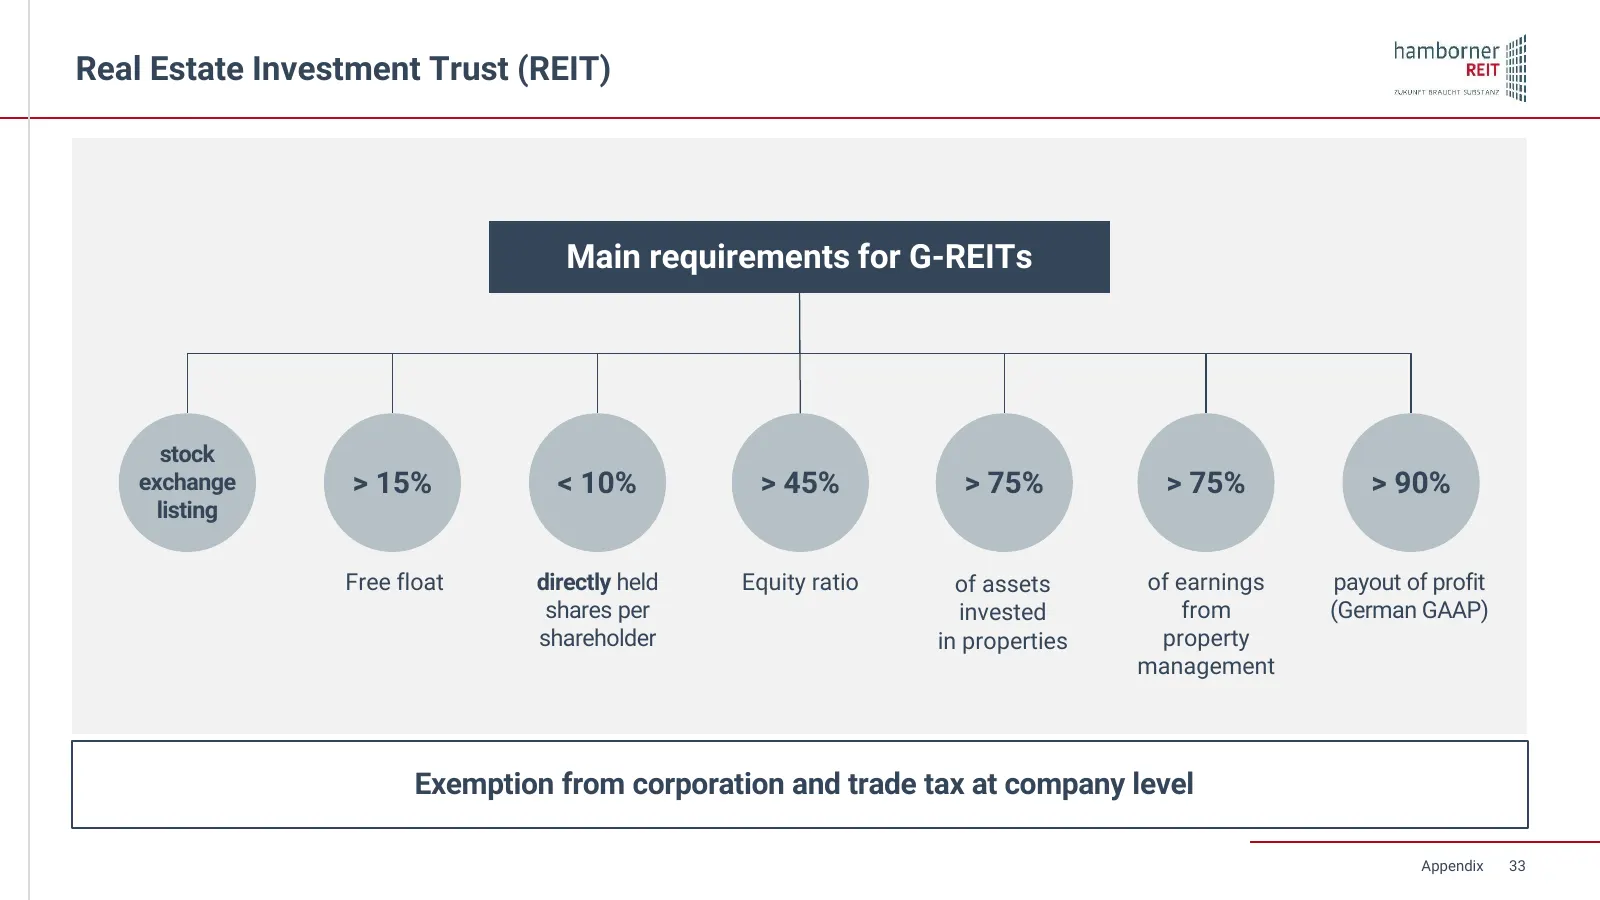
Slide 33: Real Estate Investment Trust (REIT): Main requirements for G-REITs
Real Estate Investment Trust (REIT) Main requirements for G-REITs stock exchange > 15% < 10% > 45% > 75% > 75% > 90% listing Free float directly held Equity ratio of assets of earnings payout of profit shares per invested from (German GAAP) shareholder in properties property management Exemption fro
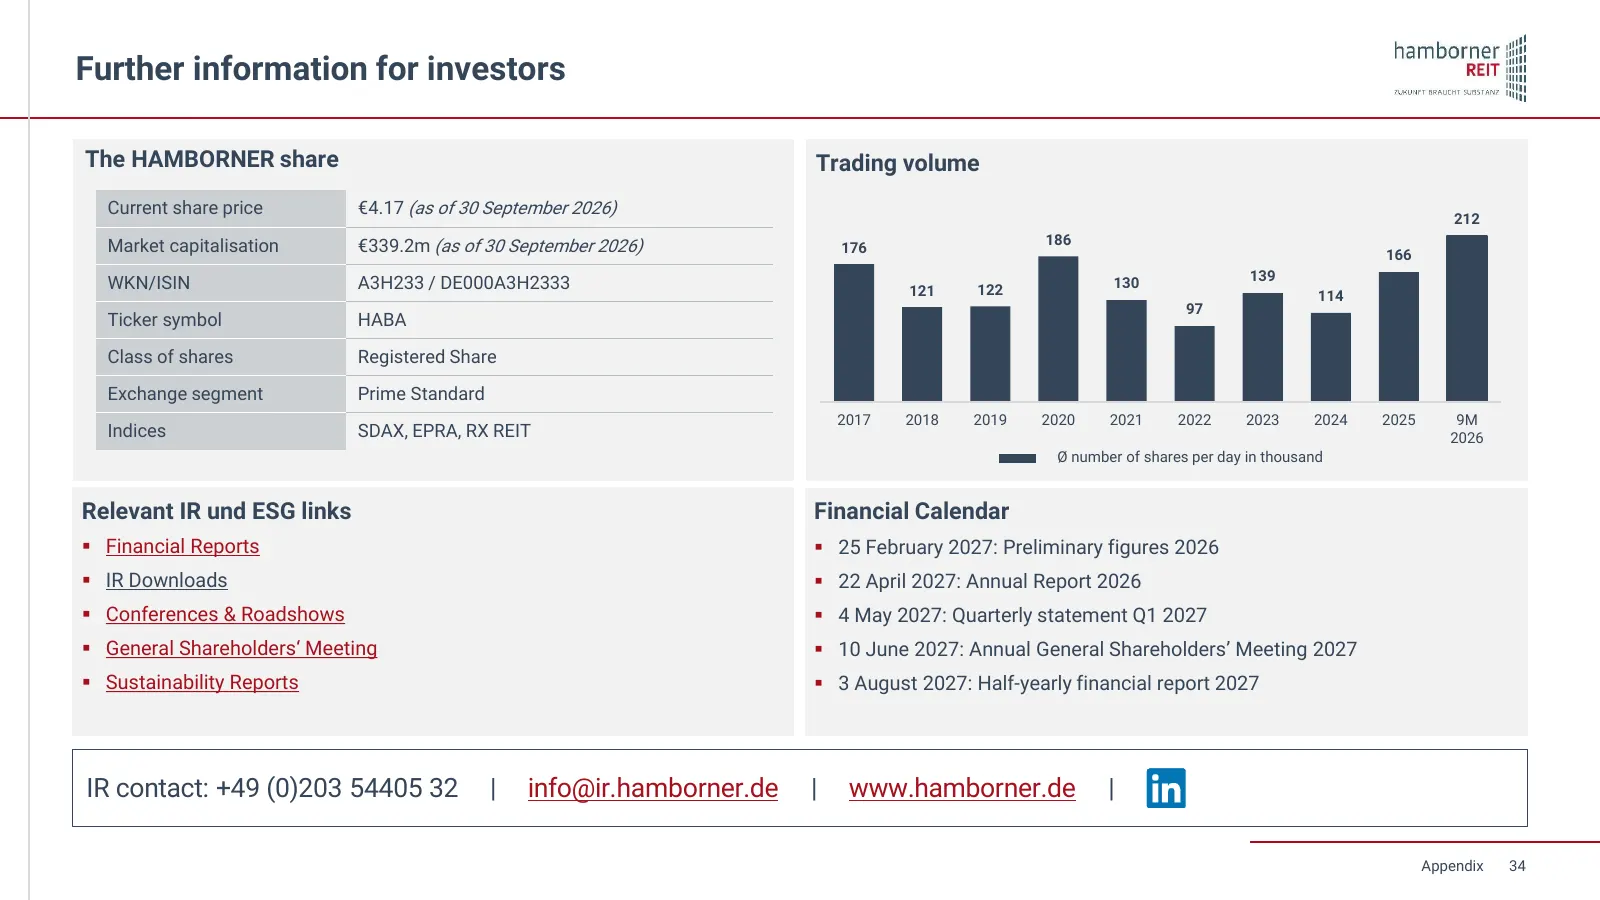
Slide 34: Further information for investors
Further information for investors The HAMBORNER share Trading volume Current share price €4.17 (as of 30 September 2026) 212 Market capitalisation €339.2m (as of 30 September 2026) 186 176 166 WKN/ISIN A3H233 / DE000A3H2333 130 139 121 122 114 97 Ticker symbol HABA Class of shares Registered Share E
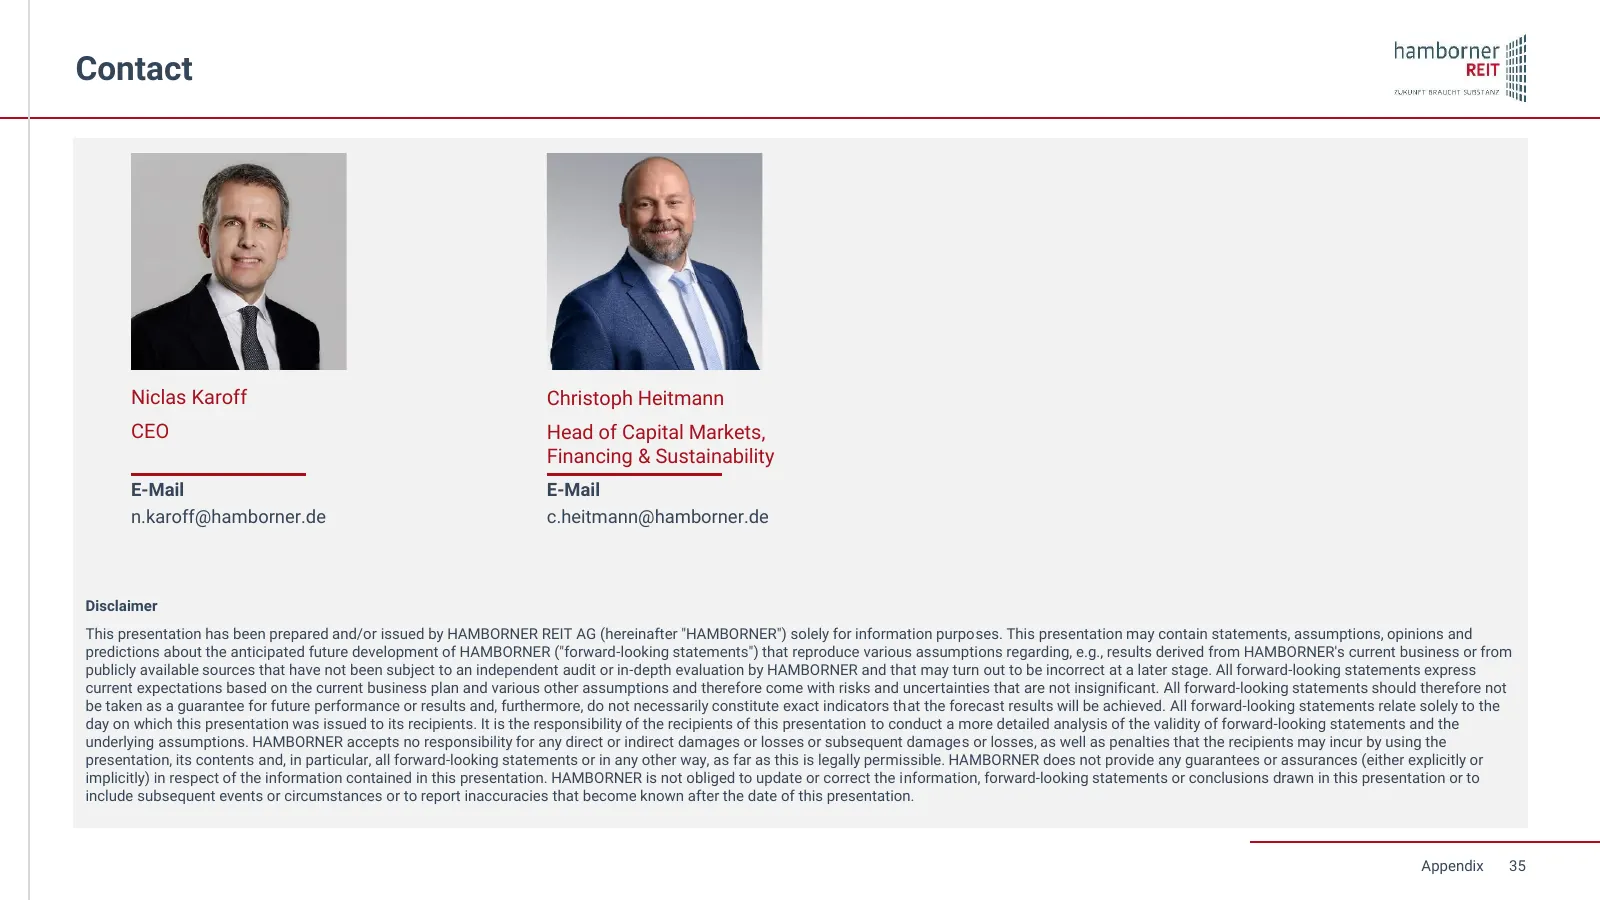
Slide 35: Contact
Contact Niclas Karoff Christoph Heitmann CEO Head of Capital Markets, Financing & Sustainability E-Mail E-Mail n.karoff@hamborner.de c.heitmann@hamborner.de Disclaimer This presentation has been prepared and/or issued by HAMBORNER REIT AG (hereinafter "HAMBORNER") solely for information purposes. Th
Source: company website
More decks from Hamborner REIT AG
 9M 2026 Earnings Presentation10 slides · Nov 10, 2026
 Fact Sheet (November 2026)2 slides · November 2026
 Investor Presentation (November 2026)35 slides · November 2026
 Fact Sheet (September 2026)2 slides · Sep 30, 2026
 Investor Presentation (September 2026)36 slides · September 2026
 Investor Presentation (September 2026)36 slides · September 2026