Franklin Financial Network Inc
Franklin Financial Network — Q2 2015 Earnings Presentation
42 slides from Franklin Financial Network's earnings presentation, Jul 29, 2015

Slide 1: Franklin Financial Network Second Quarter 2015 Investor Call
Franklin Financial Network Second Quarter 2015 Investor Call July 29, 2015
Slide 2: Forward-Looking Statements
Forward-Looking Statements Except for the historical information contained herein, this presentation contains forward-looking statements within the meaning of Section 27A of the Securities Act of 1933, as amended, and Section 21E of the Securities Exchange Act of 1934, as amended. The forward-lookin
Slide 3: Franklin Financial Network
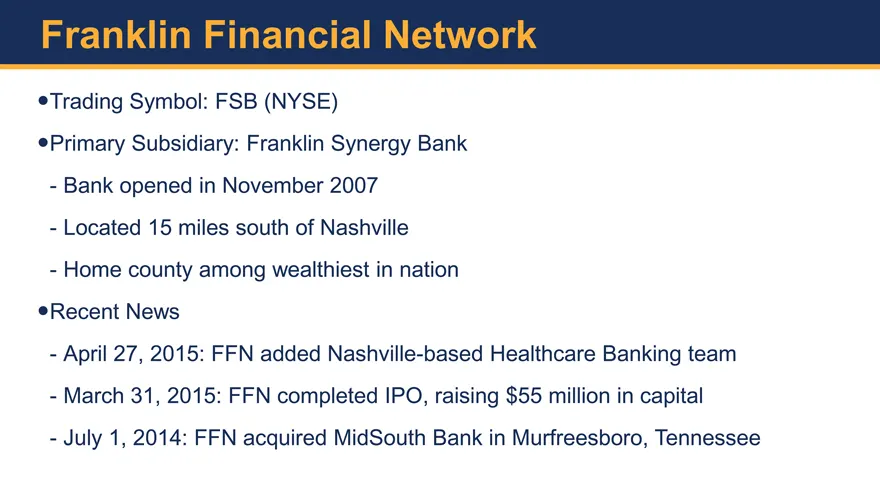
Franklin Financial Network Trading Symbol: FSB (NYSE) Primary Subsidiary: Franklin Synergy Bank Bank opened in November 2007 Located 15 miles south of Nashville Home county among wealthiest in nation Recent News April 27, 2015: FFN added Nashville-based Healthcare Banking team March 31, 2015: FFN co
Slide 4: 2Q 2015 Financial Highlights
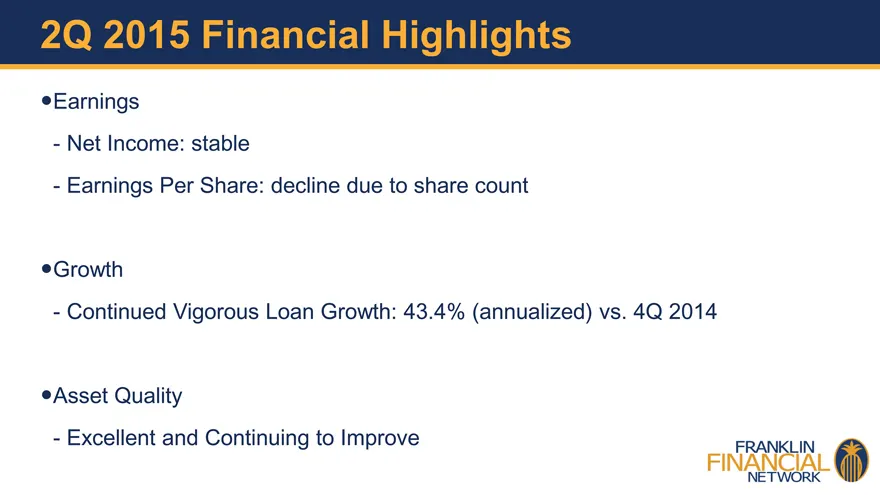
2Q 2015 Financial Highlights Earnings Net Income: stable Earnings Per Share: decline due to share count Growth Continued Vigorous Loan Growth: 43.4% (annualized) vs. 4Q 2014 Asset Quality Excellent and Continuing to Improve
Slide 5: Quarterly Net Income
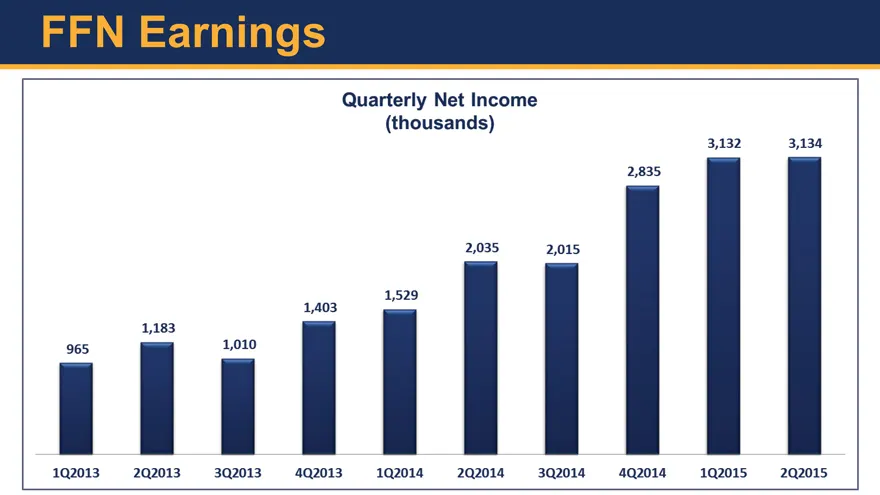
965 192013 1,183 202013 1,010 302013 Quarterly Net Income (thousands) 2,035 1,529 1,403 ' 4Q2013 1Q2014 202014 2,835 2,015 | 302014 —-4Q2014 3,132 3,134 192015 202015
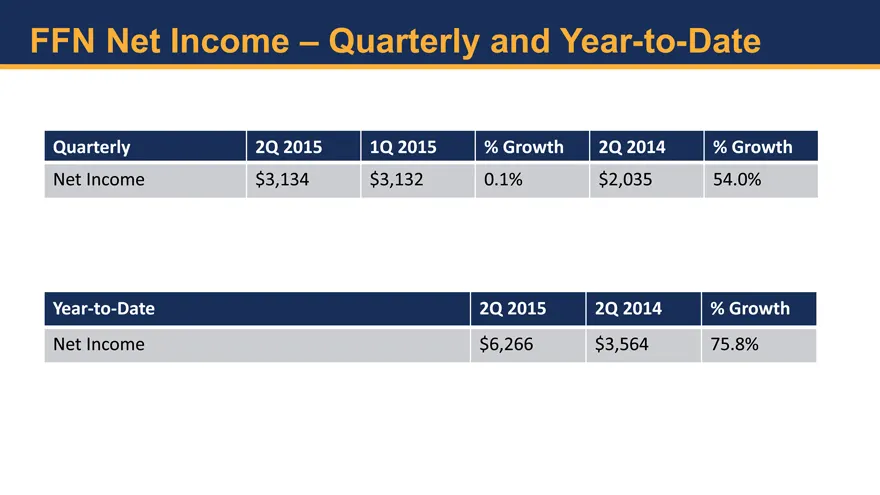
Slide 6: FFN Net Income – Quarterly and Year-to-Date
FFN Net Income – Quarterly and Year-to-Date Quarterly 2Q 2015 1Q 2015 % Growth 2Q 2014 % Growth Net Income $3,134 $3,132 0.1% $2,035 54.0% Year-to-Date 2Q 2015 2Q 2014 % Growth Net Income $6,266 $3,564 75.8%
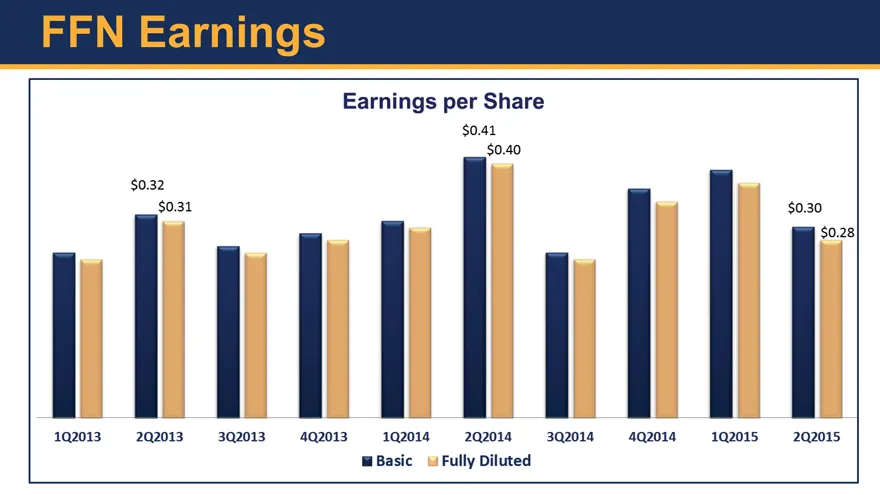
Slide 7: Earnings per Share
192013 $0.32 $0.31 292013 302013 Earnings per Share $0.41 $0.40 4Q2013 1Q2014 2Q2014 Basic i Fully Diluted $0.30 | $0.28) 302014 = 4Q2014 = 1Q2015-2Q2015
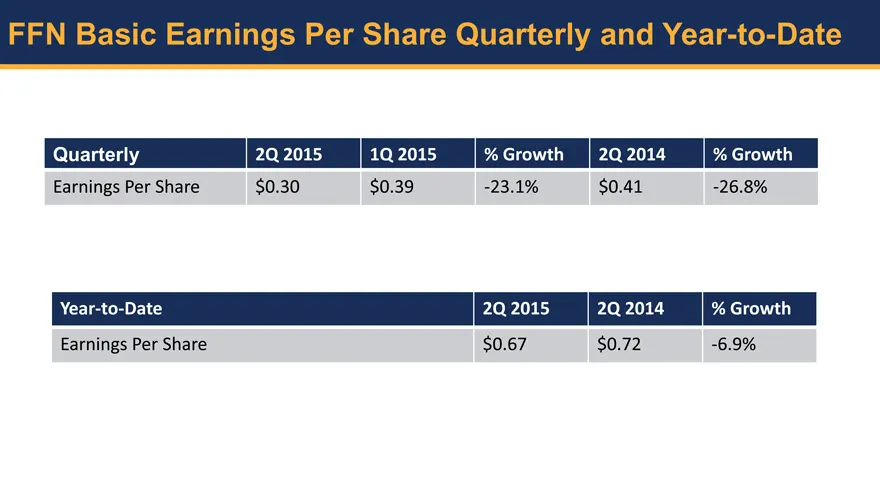
Slide 8: FFN Basic Earnings Per Share Quarterly and Year-to-Date
FFN Basic Earnings Per Share Quarterly and Year-to-Date Quarterly 2Q 2015 1Q 2015 % Growth 2Q 2014 % Growth Earnings Per Share $0.30 $0.39 -23.1% $0.41 -26.8% Year-to-Date 2Q 2015 2Q 2014 % Growth Earnings Per Share $0.67 $0.72 -6.9%
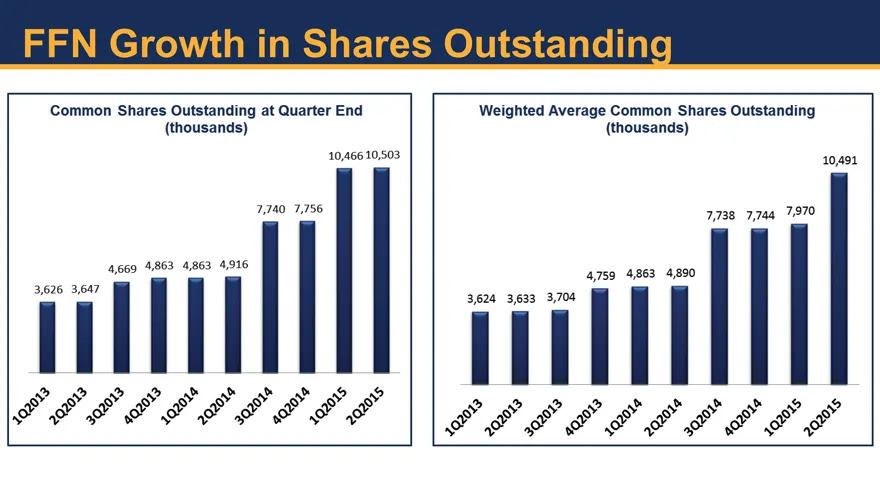
Slide 9: FFN Growth in Shares Outstanding
FFN Growth in Shares Outstanding
Slide 10: Events Impacting Share Count
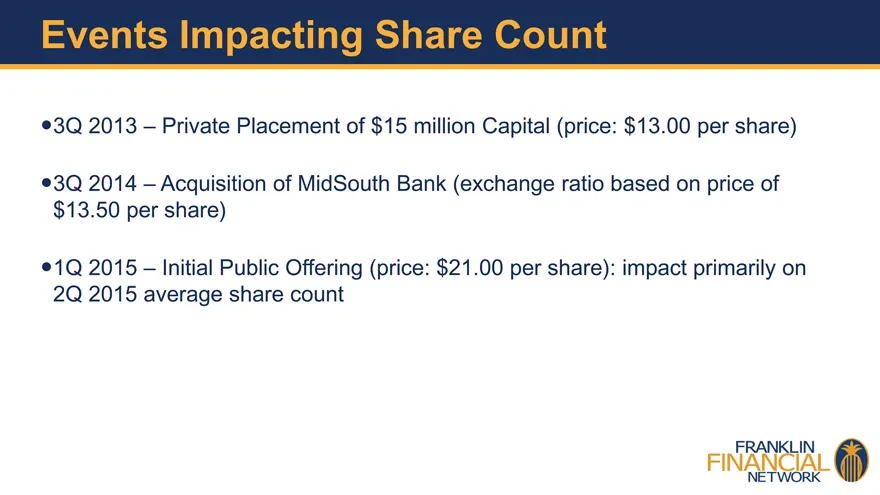
Events Impacting Share Count 3Q 2013 – Private Placement of $15 million Capital (price: $13.00 per share) 3Q 2014 – Acquisition of MidSouth Bank (exchange ratio based on price of $13.50 per share) 1Q 2015 – Initial Public Offering (price: $21.00 per share): impact primarily on 2Q 2015 average share
Slide 11: Items Significantly Impacting 2Q 2015 Net Income
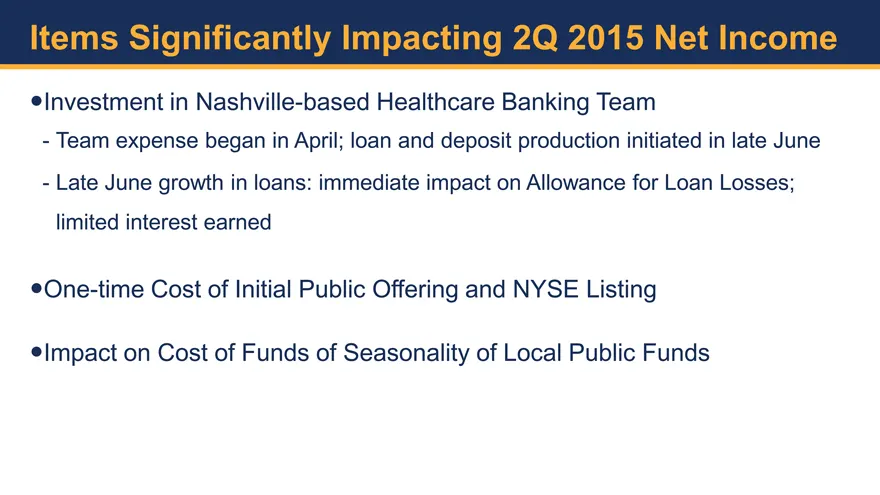
Items Significantly Impacting 2Q 2015 Net Income Investment in Nashville-based Healthcare Banking Team Team expense began in April; loan and deposit production initiated in late June Late June growth in loans: immediate impact on Allowance for Loan Losses; limited interest earned One-time Cost of In
Slide 12: FFN Value
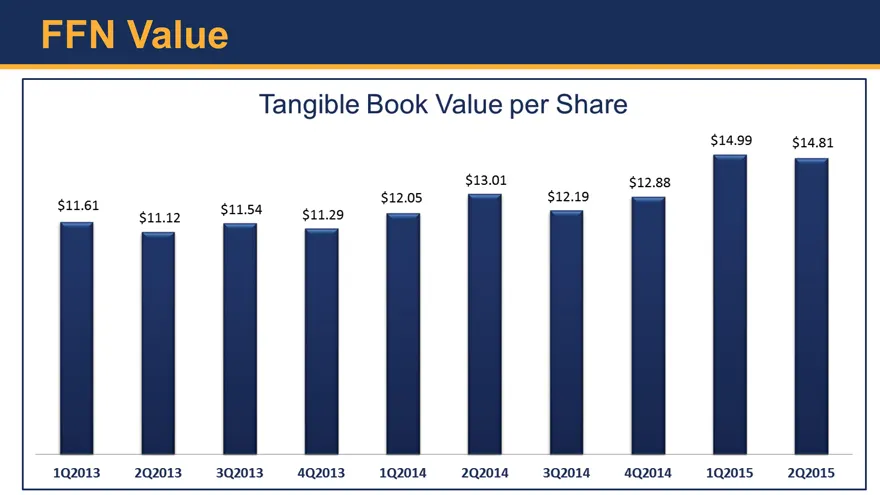
FFN Value Tangible Book Value per Share $14.99 $14.81 $13.01 $ $12.88 $12.05 12.19 $11.61 giisa $11.12 $11.29 102013 202013.» -3Q2013. «42013.» «1Q2014 © 202014» 32014 «42014. = -1Q2015 —-2Q2015
Slide 13: FFN Profitability
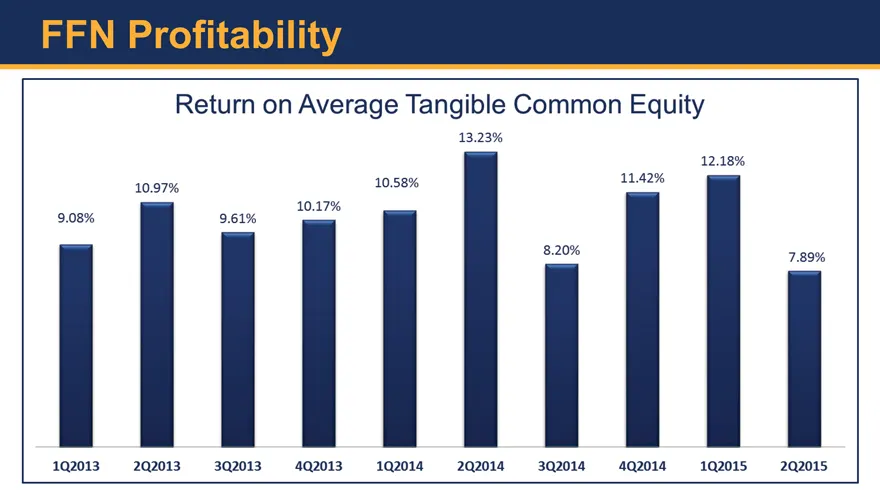
FFN Profitability Return on Average Tangible Common Equity 13.23% 12.18% 10.97% 10.58% 11.42% 10.17% 9.08% 9.61% , 1Q2013 2Q2013 302013. -4Q2013. «| 1Q2014 202014» 3Q2014 4Q2014 © 102015 -2Q2015
Slide 14: FFN Profitability
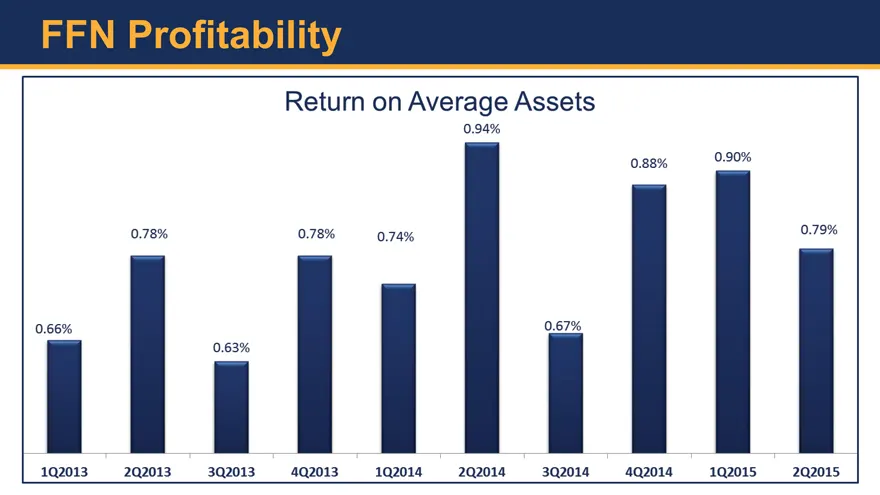
FFN Profitability Return on Average Assets 0.94% 0.88% 0.90% 0.78% 0.78% 0.74% 0.79% 0.66% 0.57% uJ 0.63% 1Q2013_2Q2013_3Q2013_ 402013 102014202014 3Q2014—AQ2014—1Q2015_— 202015
Slide 15: Key Elements of FFN Performance
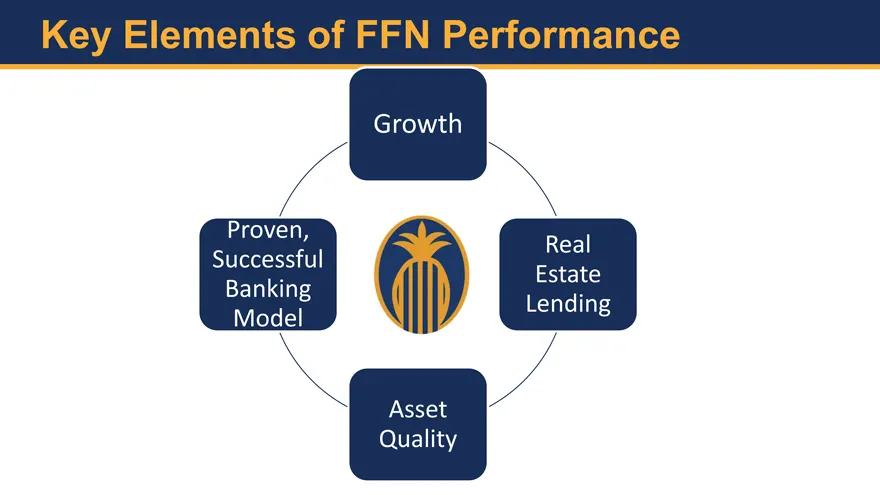
Key Elements of FFN Performance Growth Proven, Real Successful Estate Banking Lending Model Asset Quality

Slide 16: GROWTH
GROWTH
Slide 17: FFN Loan Growth
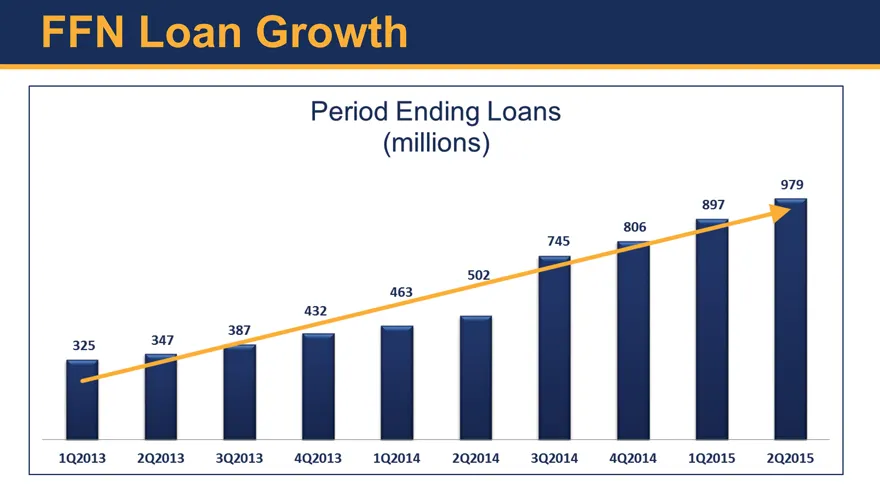
FFN Loan Growt Period Ending Loans (millions) 979 897 745 = 502 463 432 387 325 347 192013 2Q2013. © 302013.» 402013. :1Q20142Q2014 302014402014 1Q20152Q2015
Slide 18: Loan Growth Rates (End of Period Loans)
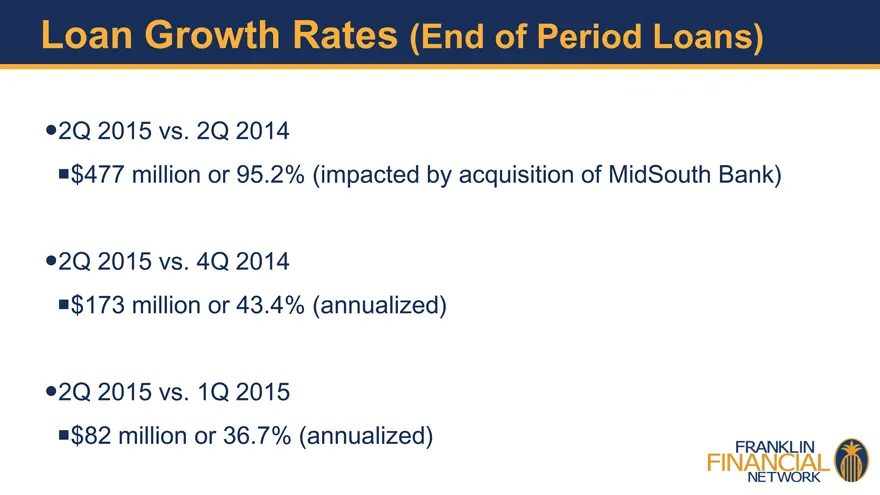
Loan Growth Rates (End of Period Loans) 2Q 2015 vs. 2Q 2014 $477 million or 95.2% (impacted by acquisition of MidSouth Bank) 2Q 2015 vs. 4Q 2014 $173 million or 43.4% (annualized) 2Q 2015 vs. 1Q 2015 $82 million or 36.7% (annualized)
Slide 19: FFN Deposit Growth
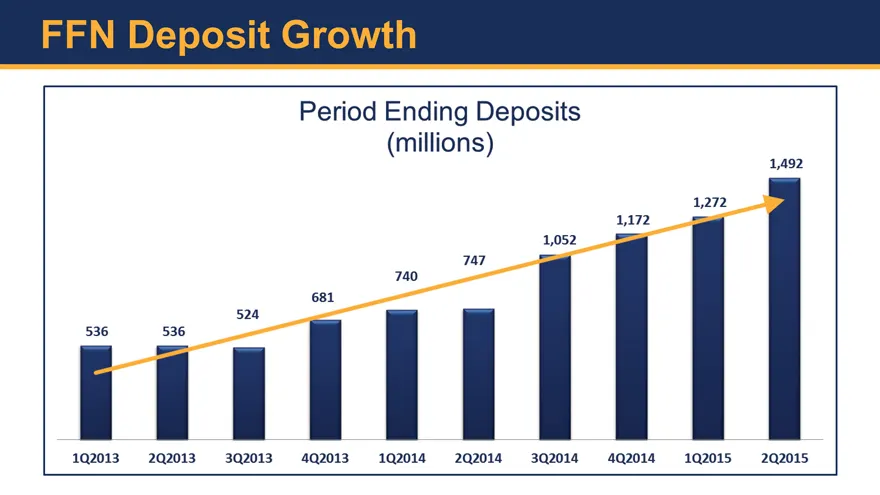
FFN Deposit Grow Period Ending Deposits (millions) 1,492 1,272 1,172 = 1,052 747 — 740 681 524 ; ; ’ ' ' 102013 2Q2013.-3Q2013. | 4Q2013 102014202014 3Q2014. «| 4Q2014 «102015202015 \
Slide 20: Deposit Growth Rates (End of Period Deposits)
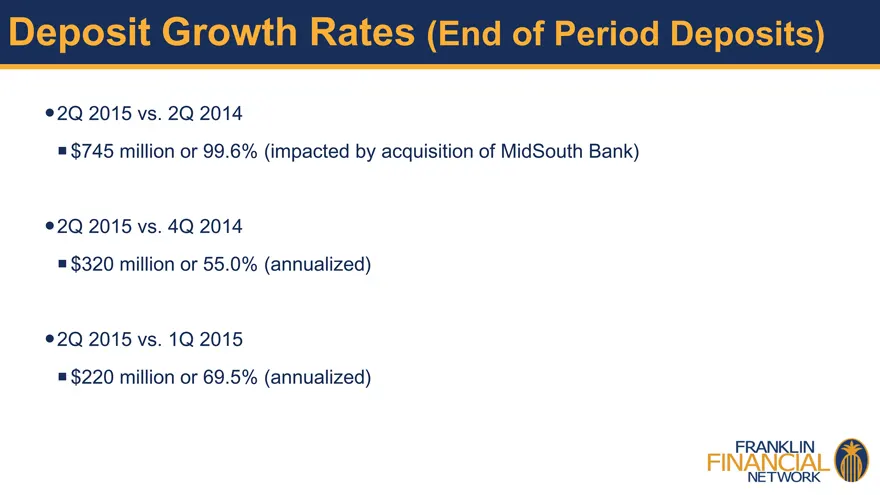
Deposit Growth Rates (End of Period Deposits) 2Q 2015 vs. 2Q 2014 $745 million or 99.6% (impacted by acquisition of MidSouth Bank) 2Q 2015 vs. 4Q 2014 $320 million or 55.0% (annualized) 2Q 2015 vs. 1Q 2015 $220 million or 69.5% (annualized)
Slide 21: FFN Investment Portfolio Growth
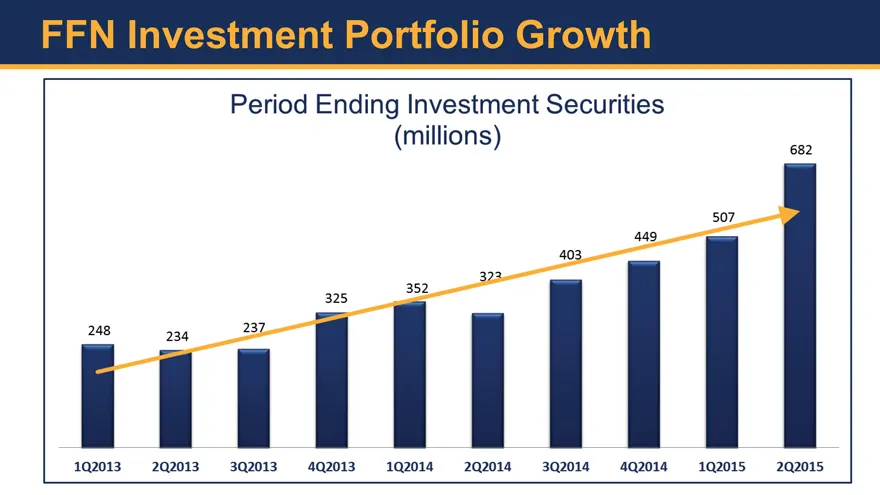
FFN Investment Portfolio Growth
Slide 22: Investment Portfolio Growth
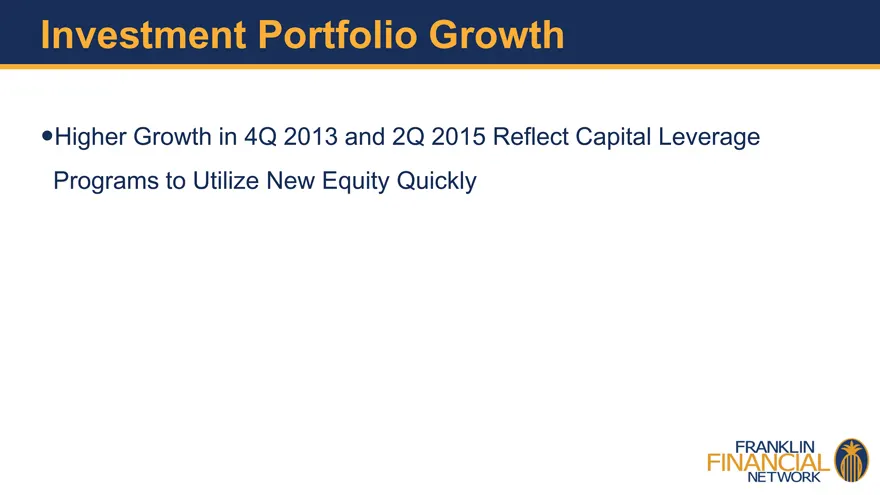
Investment Portfolio Growth Higher Growth in 4Q 2013 and 2Q 2015 Reflect Capital Leverage Programs to Utilize New Equity Quickly

Slide 23: REAL ESTATE LENDING
REAL ESTATE LENDING
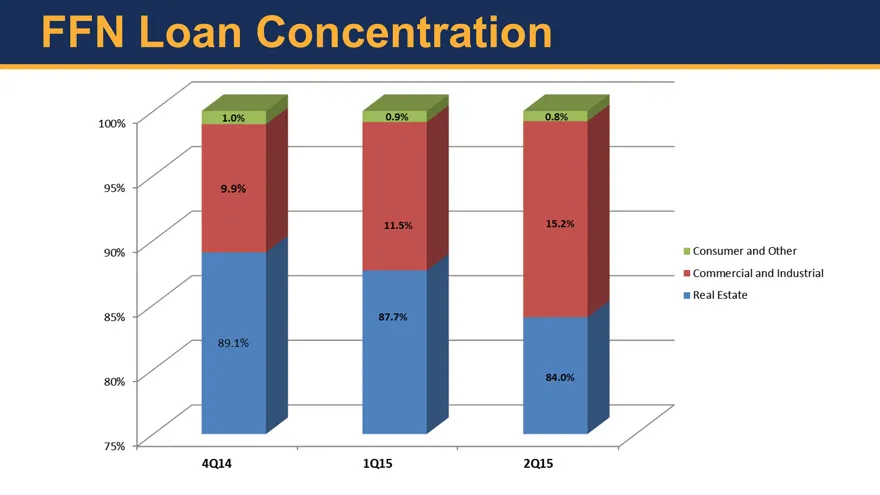
Slide 24: FFN Loan Concentration
FFN Loan Concentration 95% {~ as% 1“ 75% 1 aqua 1ais 2a15
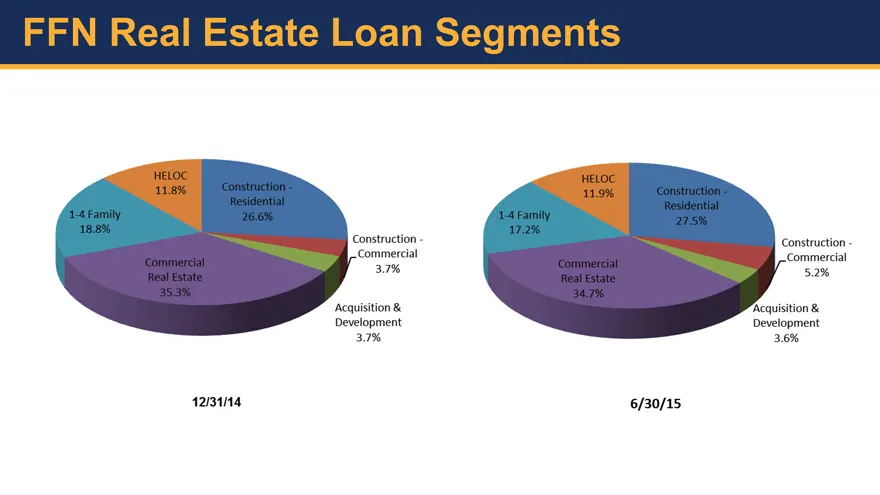
Slide 25: FFN Real Estate Loan Segments
FFN Real Estate Loan Segments

Slide 26: ASSET QUALITY
ASSET QUALITY
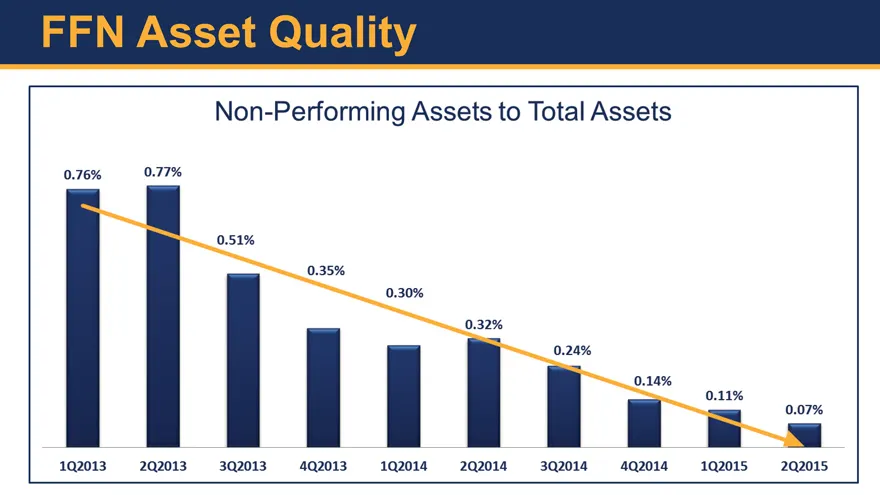
Slide 27: FFN Asset Quality
FFN Asset Quality 0.77% 0.76% 192013 202013 Non-Performing Assets to Total Assets 0.51% 0.35% 0.32% 4 0.24% 0.14% 0.11% ~ 302013 © 4Q2013. «102014202014 -3Q2014-4Q2014 102015 0.07% 292015
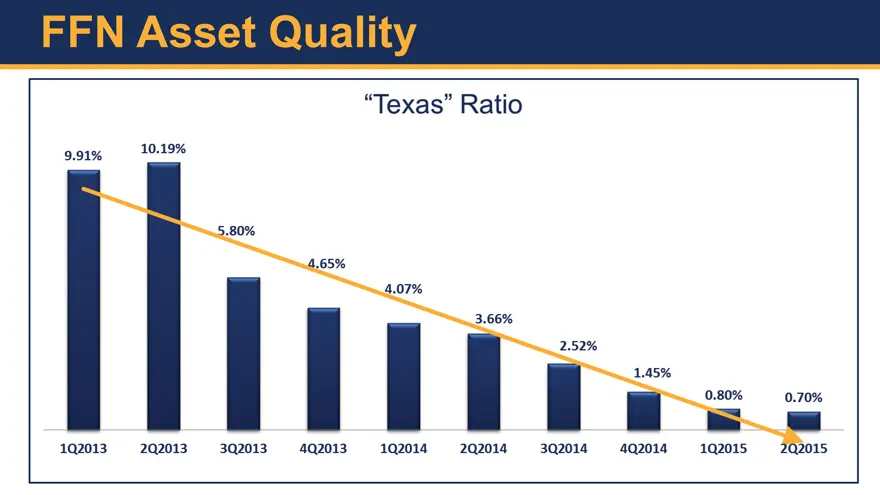
Slide 28: FFN Asset Quality
FFN Asset Quality “Texas” Ratio 9.91% 10.19% 5.80% 4.65% 4.07% ' 3.66% 102013 202013. © 3Q2013.««4Q2013. «Ss 102014202014 302014 1.45% 42014 0.80% 0.70% | 192015 2Q2015
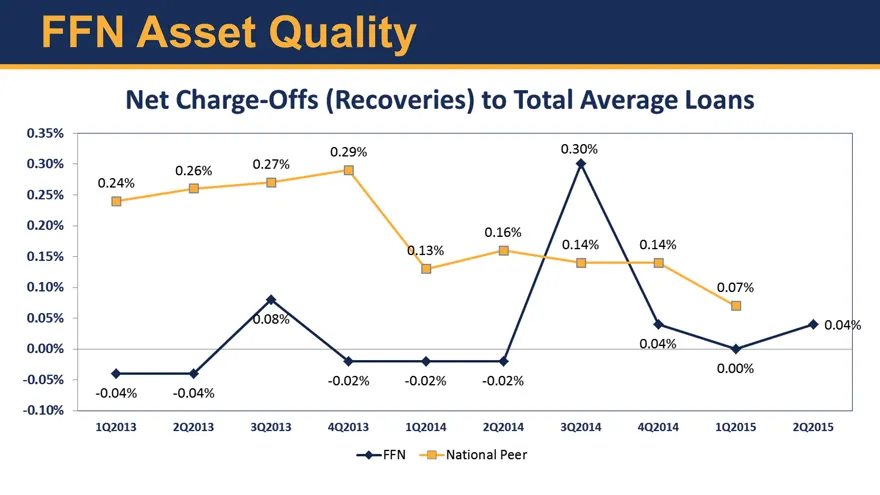
Slide 29: Net Charge-Offs (Recoveries) to Total Average Loans
0.35% 0.30% 0.25% 0.20% 0.15% 0.10% 0.05% 0.00% -0.05% -0.10% Net Charge-Offs (Recoveries) to Total Average Loans 0.29% 0.30% 0.24% 0.04} -0.02% — -0.02% —— -0.02% -0.04% — -0.04% 102013 202013302013. «402013. «| 1a2014 «202014» 3Q2014 © 4q2014 = 1a2015—202015 —+-FFN National Peer

Slide 30: LONG TERM PLAN METRICS
LONG TERM PLAN METRICS
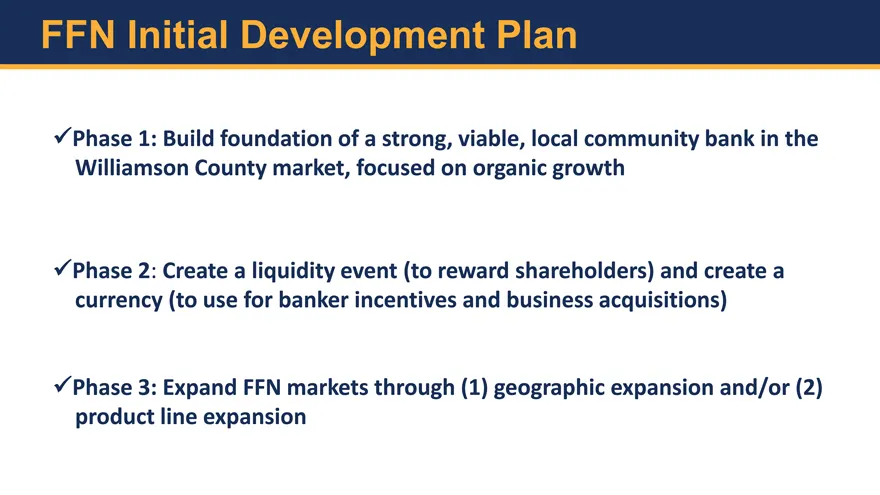
Slide 31: FFN Initial Development Plan
FFN Initial Development Plan Phase 1: Build foundation of a strong, viable, local community bank in the Williamson County market, focused on organic growth Phase 2: Create a liquidity event (to reward shareholders) and create a currency (to use for banker incentives and business acquisitions) Phase
Slide 32: Keys to Enhancing FFN Profitability
Keys to Enhancing FFN Profitability Improve interest margins
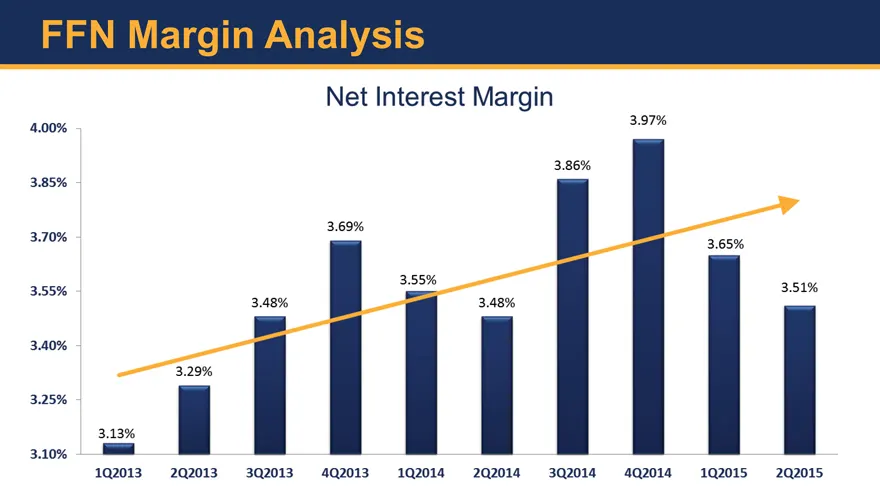
Slide 33: FFN Margin Analysis
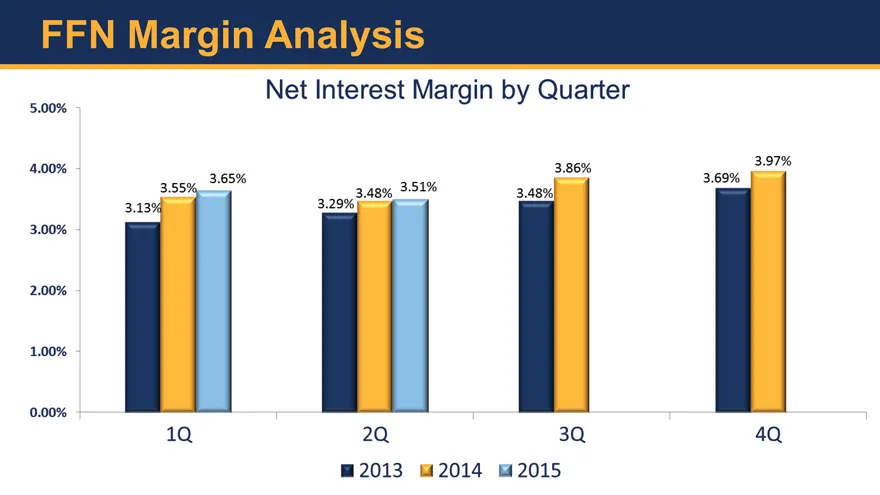
FFN Margin Analysis Net Interest Margin 00% 3.97% 3.86% 3.85% 3.69% 3.70% 3.55% penta 3.51% 3.48% 3.48% 3.40% 3.29% 3.25% 3.13% 3.10% |__ 102013 202013 3Q2013.««4Q2013.««:1Q2014 202014» -3Q2014 «42014102015 2Q2015 \
Slide 34: FFN Margin Analysis
FFN Margin Analysis Net Interest Margin by Quarter 5.00% 3.97% 4.00% sex astm 3.86% nex 3.55: 3.48% 3: 3.48%) 3.13 3.29% 3.00% 2.00% 1.00% 0.00% 2Q 3Q 4Q 2013 2014 ™2015
Slide 35: FFN Margin Analysis
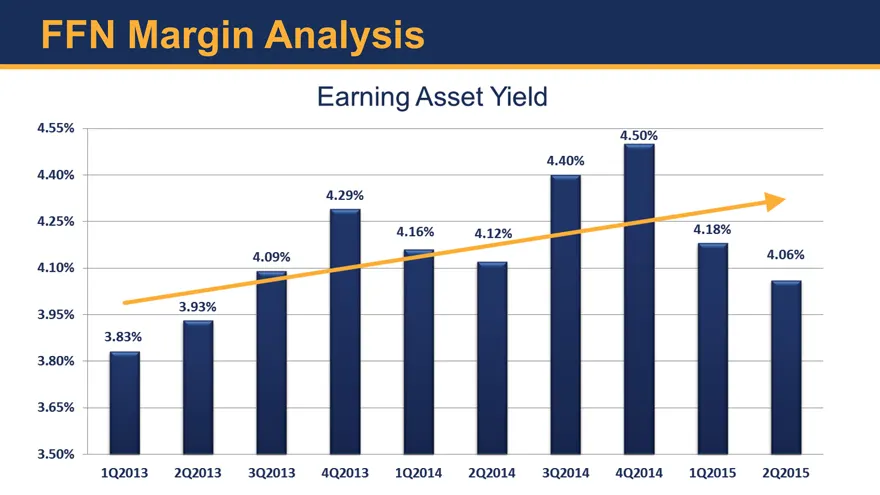
FFN Margin Analysis Earning Asset Yield 455% 50% 4.40% 4.40% 4.29% 4.18% 4.25% 4.16% 4.12% ax 4.09% 4.06% : -_= 3.95% 3.93% 3.83% 3.80% 3.65% 3.50% 102013 202013 302013 4Q2013. 192014202014 «302014 4Q2014 «12015202015
Slide 36: FFN Margin Analysis
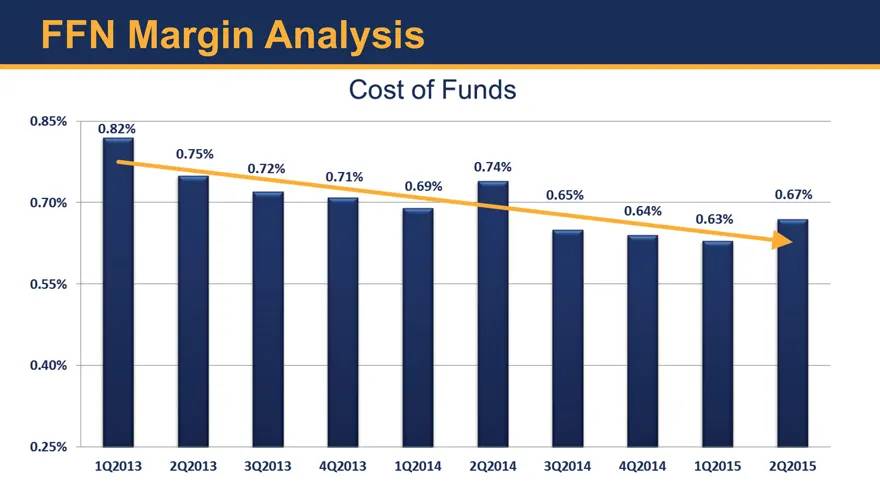
FFN Margin Analysis Cost of Funds 0.85% 0.82% —. 0.74% 0.72% oye cove 0.65% 0.67% 0.70% a 0.63% 0.55% 0.40% 0.25% 192013 20201332013. 402013. 102014 2Q2014«-3Q2014§ 4Q2014 © 192015 _2Q2015
Slide 37: Keys to Enhancing FFN Profitability
Keys to Enhancing FFN Profitability Improve interest margins Improve efficiency ratio
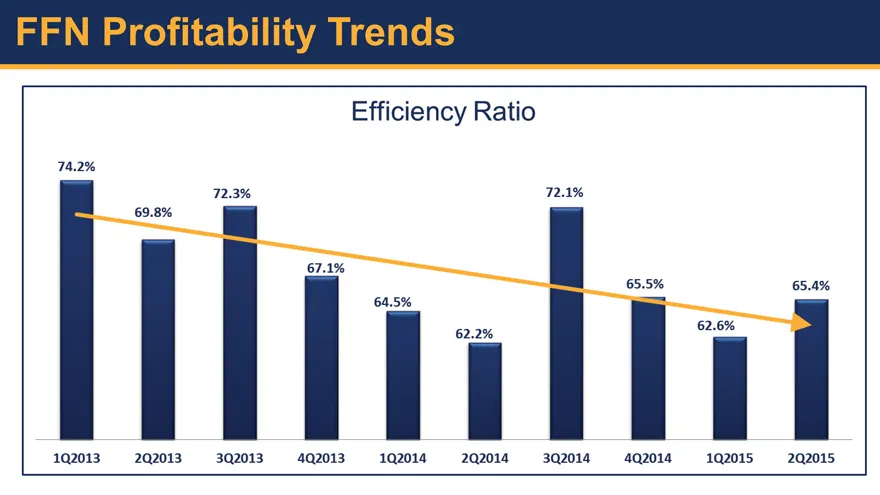
Slide 38: Efficiency Ratio
192013 202013 302013 Efficiency Ratio 72.1% 67.1% 64.5% ’ wa2% 402013 © 102014 2Q2014-3Q2014 65.5% 4a2014 62.6% 192015 65.4% 202015
Slide 39: Keys to Enhancing FFN Profitability
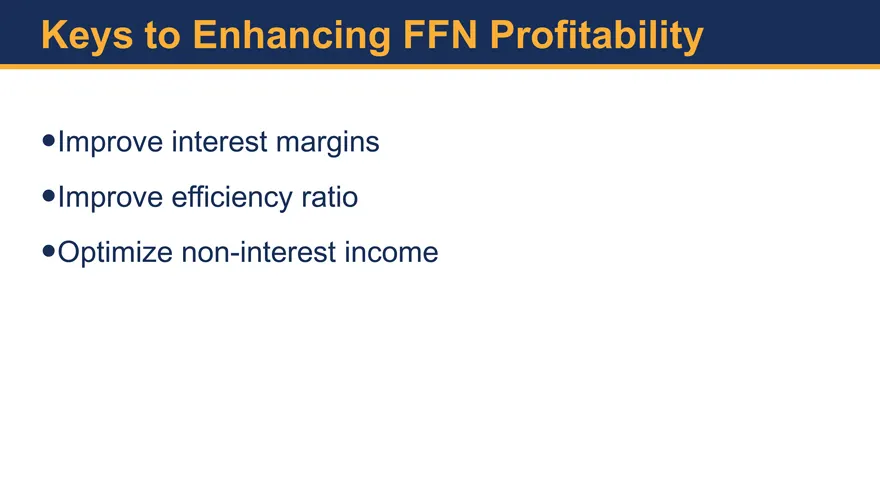
Keys to Enhancing FFN Profitability Improve interest margins Improve efficiency ratio Optimize non-interest income
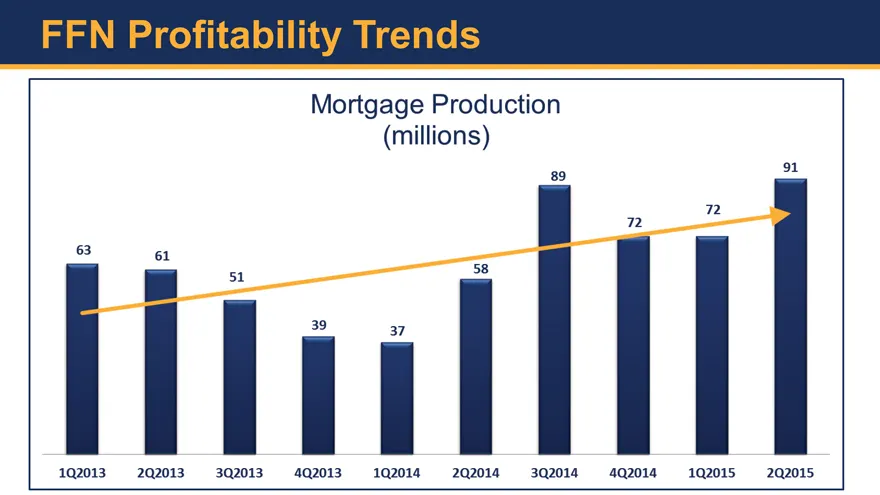
Slide 40: FFN Profitability Trends
FEN Profitability Trends Mortgage Production (millions) - a1 58 ' ) | 192013 2Q2013. | 302013.» -402013. «| :1Q2014- 2Q2014 302014 «402014» :1Q2015 202015 R 2 63 51 | B
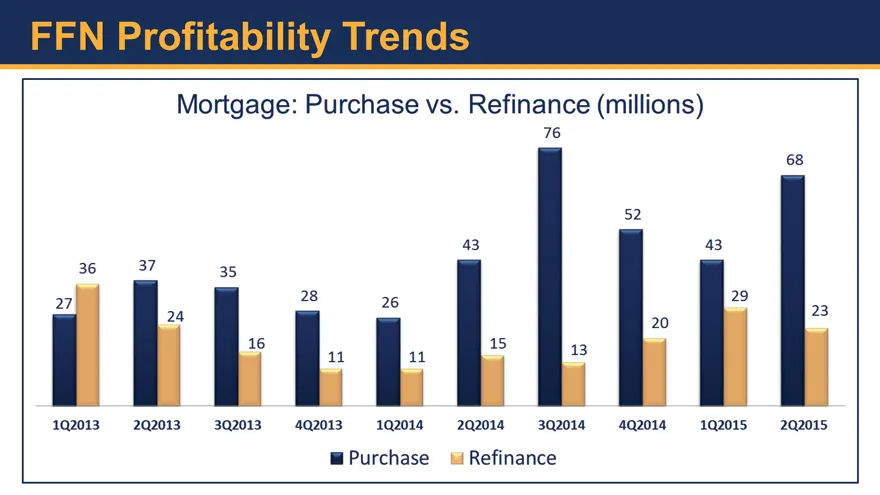
Slide 41: FFN Profitability Trends
FFN Profitability Trends Mortgage: Purchase vs. penance: (millions) 68 52 43 29 23 20 ‘ ‘ \ 1Q2013 2Q2013. 302013. -4Q2013.»1Q2014 202014 3Q2014-4Q2014 © 102015 -2Q2015 m@ Purchase i Refinance
Slide 42: Keys to Enhancing FFN Profitability
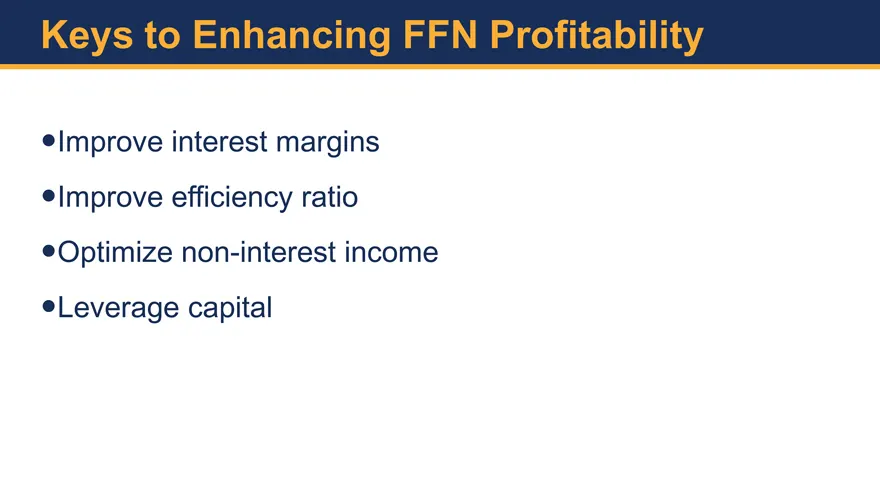
Keys to Enhancing FFN Profitability Improve interest margins Improve efficiency ratio Optimize non-interest income Leverage capital
Source: SEC EDGAR · 8-K filed Jul 29, 2015
More decks from Franklin Financial Network Inc
 Merger or Acquisition (January 2020)17 slides · Jan 21, 2020
 Q3 2019 Earnings Presentation21 slides · Nov 1, 2019
 Q3 2019 Earnings Presentation15 slides · Oct 23, 2019
 Q2 2019 Earnings Presentation19 slides · Jul 26, 2019
 Q2 2019 Earnings Presentation15 slides · Jul 24, 2019
 Q1 2019 Earnings Presentation19 slides · May 10, 2019