Franklin Financial Network Inc
Franklin Financial Network — Q1 2019 Earnings Presentation
19 slides from Franklin Financial Network's earnings presentation, May 10, 2019
Slide 1: Quarterly Investor Presentation
Franklin Financial Network, Inc. (NYSE:FSB) Quarterly Investor Presentation May 10, 2019
Slide 2: Forward-Looking Statements
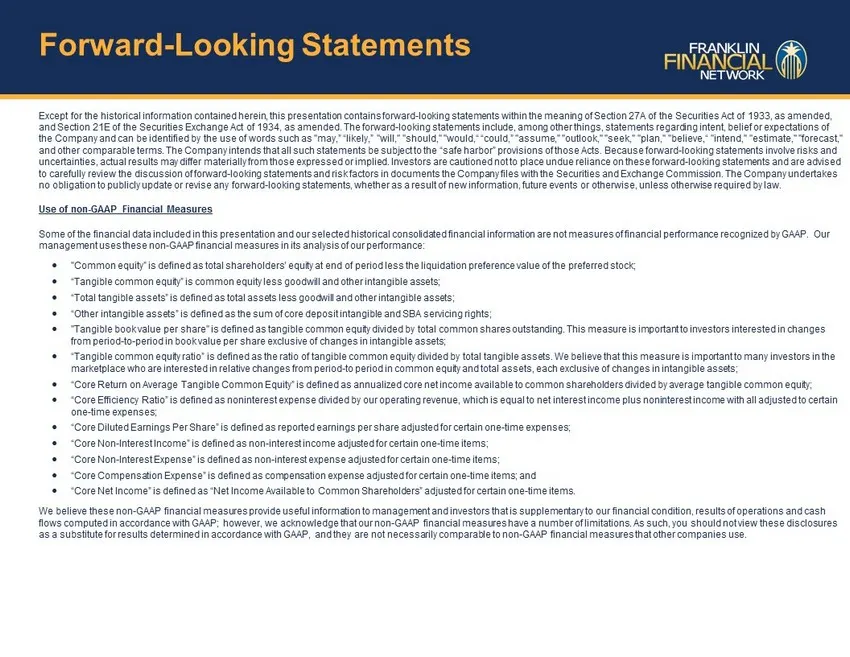
Forward - Looking Statements Except for the historical information contained herein, this presentation contains forward - looking statements within the meaning of Section 27A of the Securities Act of 1933, as amended, and Section 21E of the Securities Exchange Act of 1934, as amended. The forward -
Slide 3: Strong Foundation & Momentum
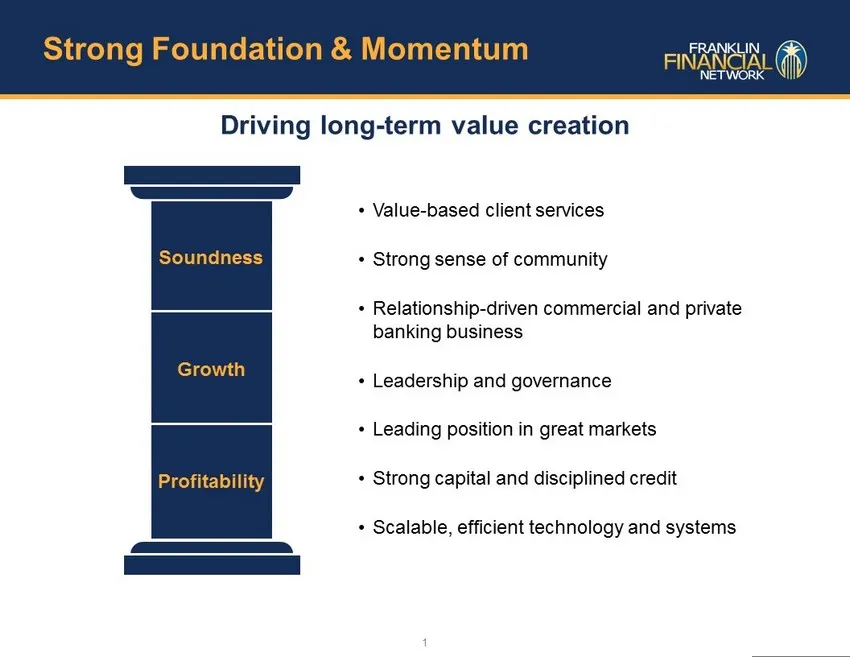
Strong Foundation & Momentum Soundness Growth Profitability 1 Driving long - term value creation • Value - based client services • Strong sense of community • Relationship - driven commercial and private banking business • Leadership and governance • Leading position in great markets • Strong capita
Slide 4: Leading Nashville Bank
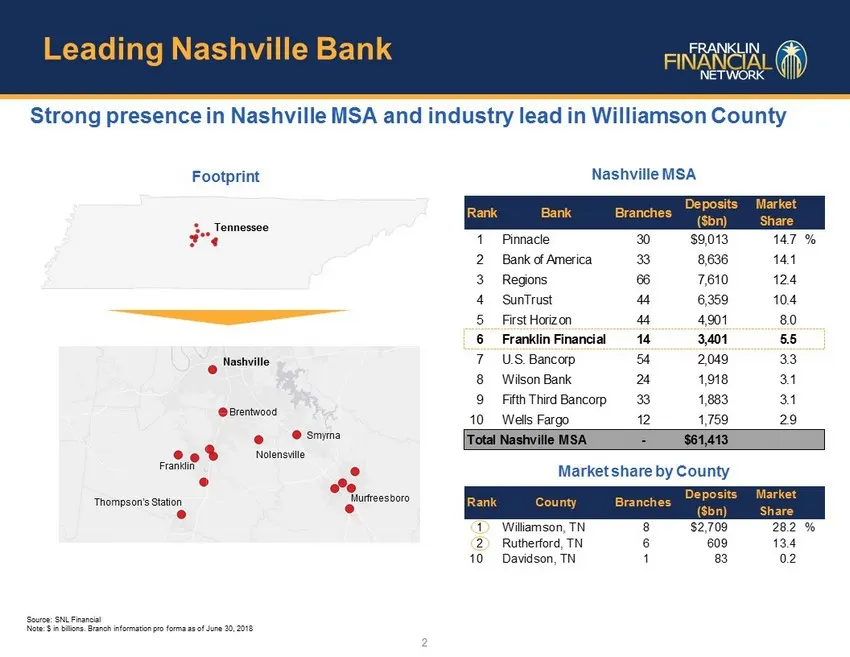
Leading Nashville Bank 2 Nashville Brentwood Nolensville Smyrna Murfreesboro Thompson’s Station Franklin Rank Bank Branches Deposits ($bn) Market Share 1 Pinnacle 30 $9,013 14.7 % 2 Bank of America 33 8,636 14.1 3 Regions 66 7,610 12.4 4 SunTrust 44 6,359 10.4 5 First Horizon 44 4,901 8.0 6 Franklin
Slide 5: Highly Experienced Management Team
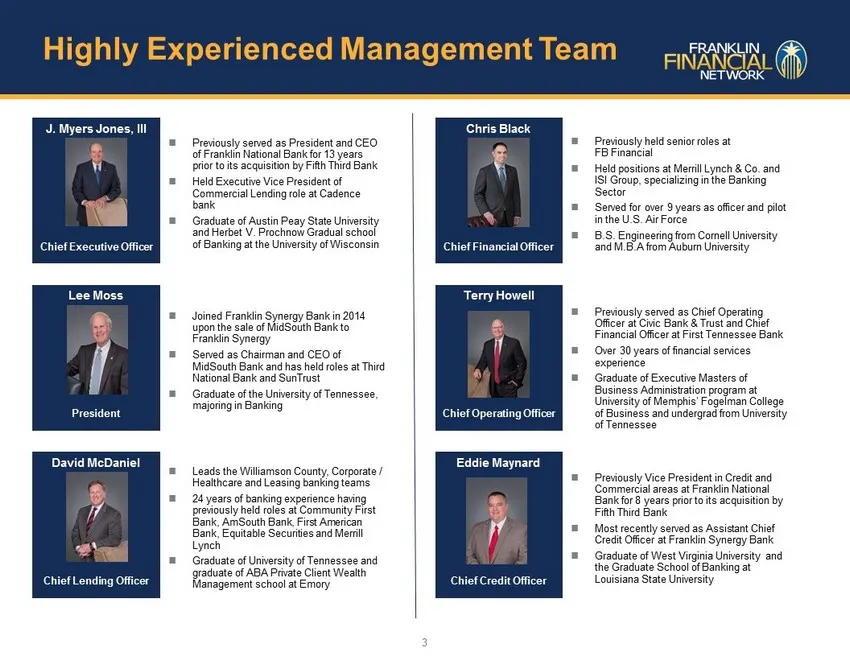
Highly Experienced Management Team 3 Chris Black Chief Financial Officer Previously held senior roles at FB Financial Held positions at Merrill Lynch & Co. and ISI Group, specializing in the Banking Sector Served for over 9 years as officer and pilot in the U.S. Air Force B.S. Engineering fr
Slide 6: Evolution of the Franchise
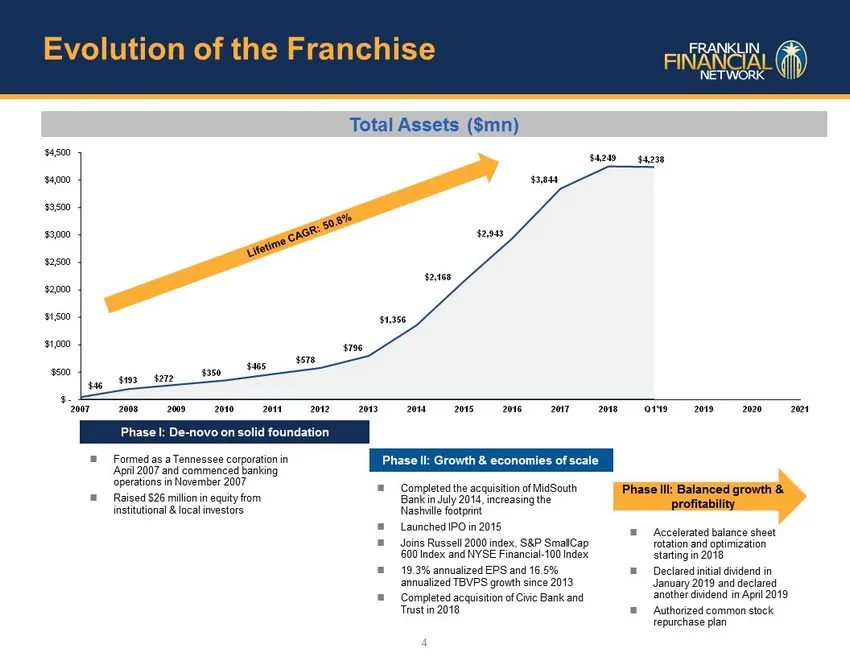
$46 $193 $272 $350 $465 $578 $796 $1,356 $2,168 $2,943 $3,844 $4,249 $ - $500 $1,000 $1,500 $2,000 $2,500 $3,000 $3,500 $4,000 $4,500 2007 2008 2009 2010 2011 2012 2013 2014 2015 2016 2017 2018 Q1'19 2019 2020 2021 $4,238 Evolution of the Franchise 4 Total Assets ($ mn ) Phase I: De - novo on solid
Slide 7: Financial Highlights and Recent Developments
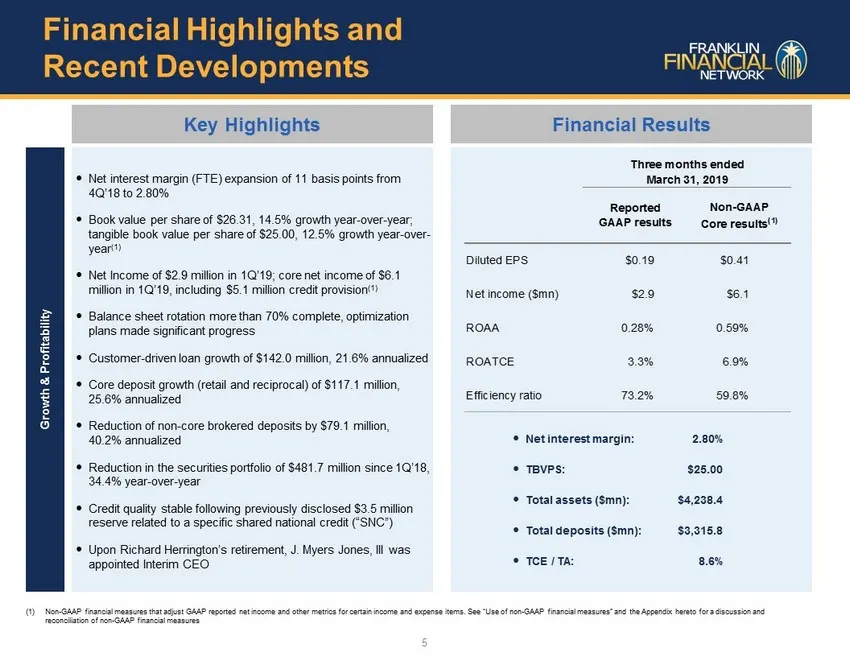
Key Highlights Financial Results (1) Non - GAAP financial measures that adjust GAAP reported net income and other metrics for certain income and expense items. See “Us e of non - GAAP financial measures” and the Appendix hereto for a discussion and reconciliation of non - GAAP financial measures 5 F
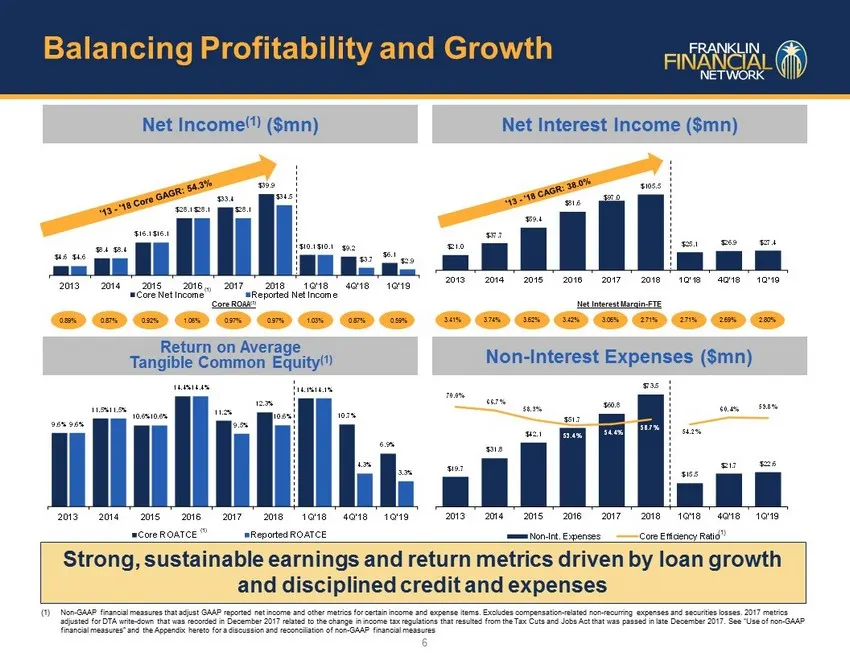
Slide 8: $19.7 $31.8 $42.1 $51.7 $60.8 $73.5 $15.5 $21.7 $22.6 70.0% 66.7% 58.3% 53.4% 54.4%
$19.7 $31.8 $42.1 $51.7 $60.8 $73.5 $15.5 $21.7 $22.6 70.0% 66.7% 58.3% 53.4% 54.4% 58.7% 54.2% 60.4% 59.8% 2013 2014 2015 2016 2017 2018 1Q'18 4Q'18 1Q'19 Non-Int. Expenses Core Efficiency Ratio 9.6% 11.5% 10.6% 14.4% 11.2% 12.3% 14.1% 10.7% 6.9% 9.6% 11.5% 10.6% 14.4% 9.5% 10.6% 14.1% 4.3% 3.3% 20
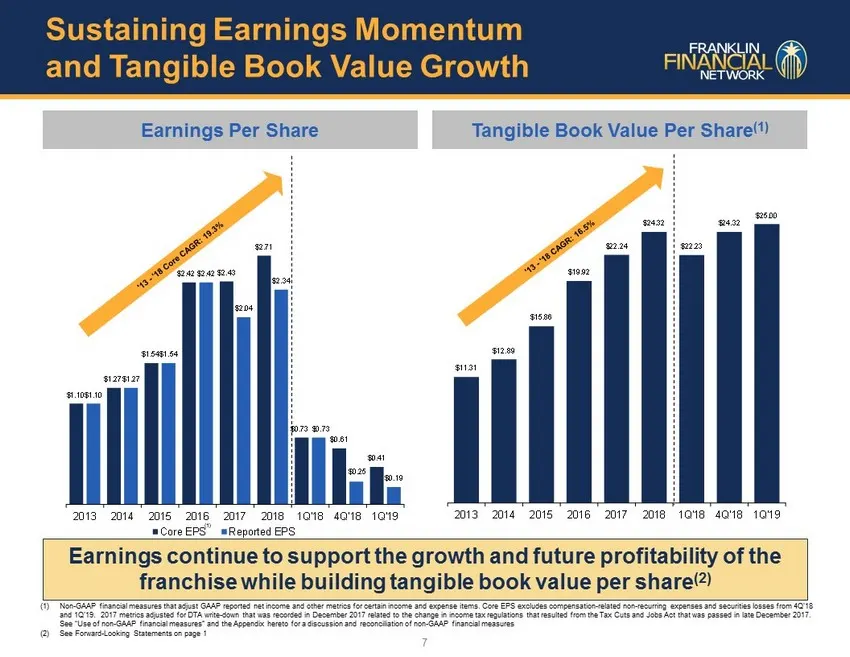
Slide 9: Sustaining Earnings Momentum and Tangible Book Value Growth
$1.10 $1.27 $1.54 $2.42 $2.43 $2.71 $0.73 $0.61 $0.41 $1.10 $1.27 $1.54 $2.42 $2.04 $2.34 $0.73 $0.25 $0.19 2013 2014 2015 2016 2017 2018 1Q'18 4Q'18 1Q'19 Core EPS Reported EPS $11.31 $12.89 $15.86 $19.92 $22.24 $24.32 $22.23 $24.32 $25.00 2013 2014 2015 2016 2017 2018 1Q'18 4Q'18 1Q'19 Earnings Pe
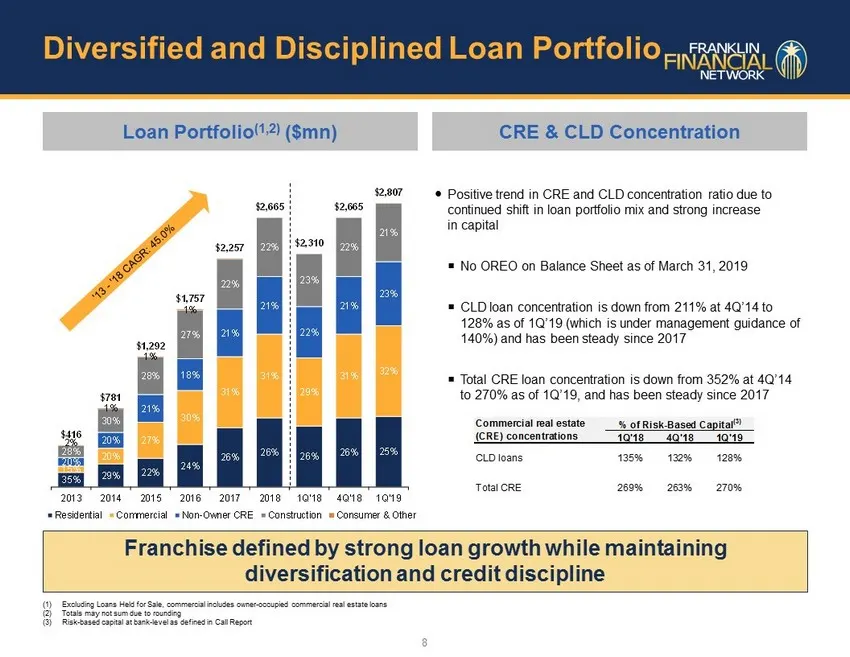
Slide 10: Diversified and Disciplined Loan Portfolio
35% 29% 22% 24% 26% 26% 26% 26% 25% 15% 20% 27% 30% 31% 31% 29% 31% 32% 20% 20% 21% 18% 21% 21% 22% 21% 23% 28% 30% 28% 27% 22% 22% 23% 22% 21% 2% 1% 1% 1% $416 $781 $1,292 $1,757 $2,257 $2,665 $2,310 $2,665 $2,807 2013 2014 2015 2016 2017 2018 1Q'18 4Q'18 1Q'19 Residential Commercial Non-Owner CRE
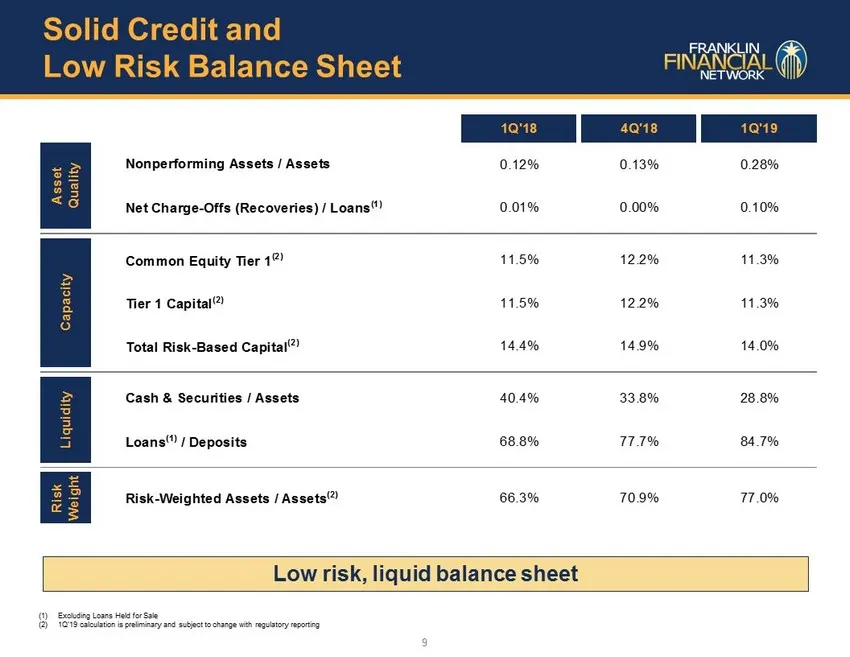
Slide 11: Solid Credit and Low Risk Balance Sheet
(1) Excluding Loans Held for Sale (2) 1Q’19 calculation is preliminary and subject to change with regulatory reporting Low risk, liquid balance sheet 9 Solid Credit and Low Risk Balance Sheet 1Q'18 4Q'18 1Q'19 Nonperforming Assets / Assets 0.12% 0.13% 0.28% Net Charge-Offs (Recoveries) / Loans (1) 0
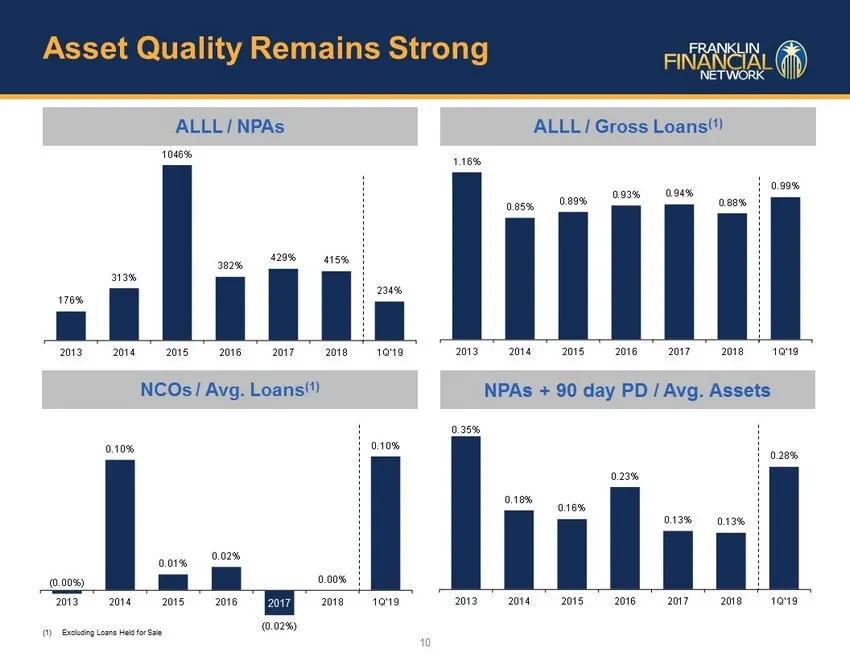
Slide 12: Asset Quality Remains Strong
0.35% 0.18% 0.16% 0.23% 0.13% 0.13% 0.28% 2013 2014 2015 2016 2017 2018 1Q'19 ALLL / NPAs ALLL / Gross Loans (1) NCOs / Avg. Loans (1) NPAs + 90 day PD / Avg. Assets 176% 313% 1046% 382% 429% 415% 234% 2013 2014 2015 2016 2017 2018 1Q'19 1.16% 0.85% 0.89% 0.93% 0.94% 0.88% 0.99% 2013 2014 2015 2016
Slide 13: New Medium-Term Performance Targets
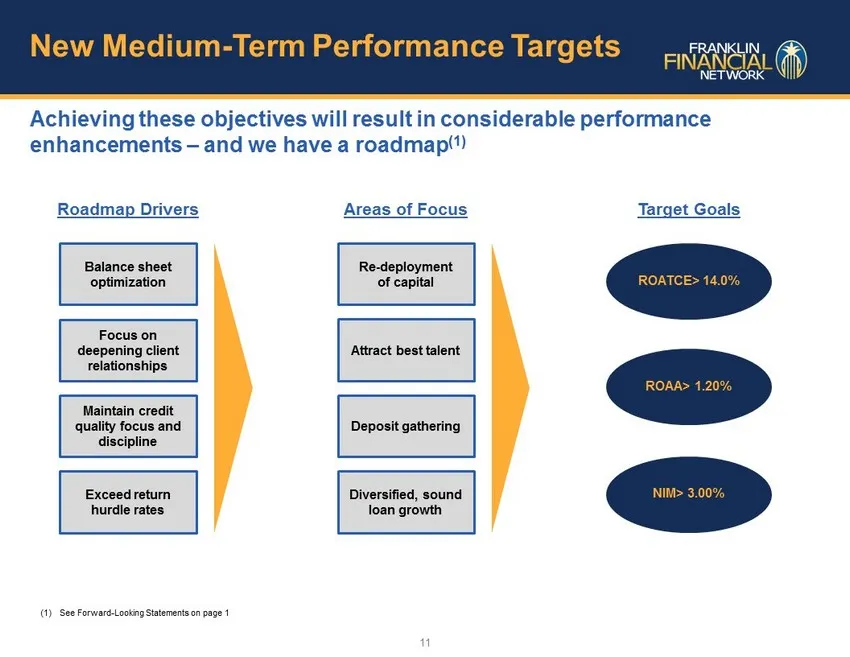
New Medium - Term Performance Targets Achieving these objectives will result in considerable performance enhancements – and we have a roadmap (1) 11 ROATCE> 14.0% ROAA> 1.20% NIM> 3.00% (1) See Forward - Looking Statements on page 1 Roadmap Drivers Balance sheet optimization Focus on deepening clien
Slide 14: Key Drivers of FSB Performance
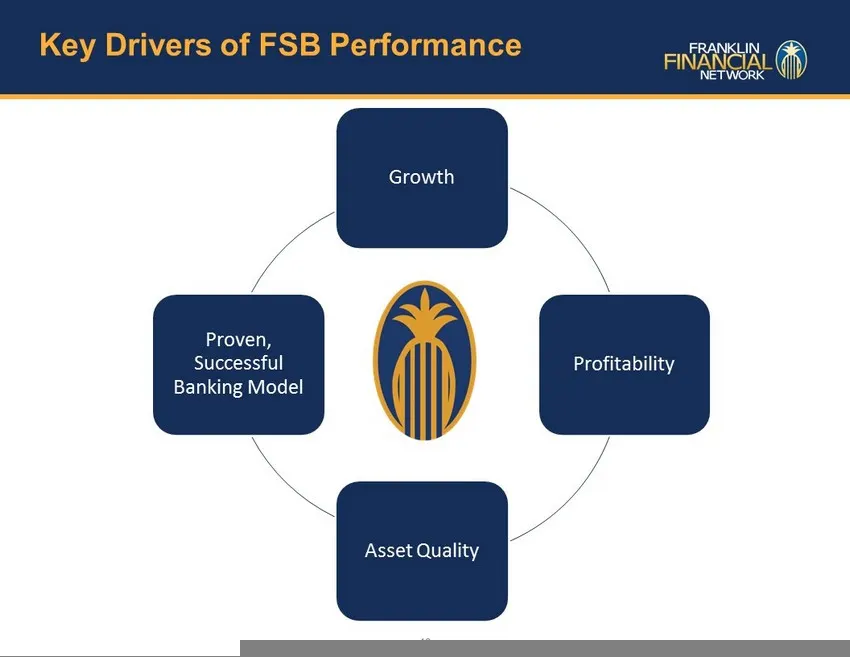
Growth Profitability Asset Quality Proven, Successful Banking Model Key Drivers of FSB Performance 12

Slide 15: Appendix
Appendix
Slide 16: Shared National Credit & Healthcare Portfolios
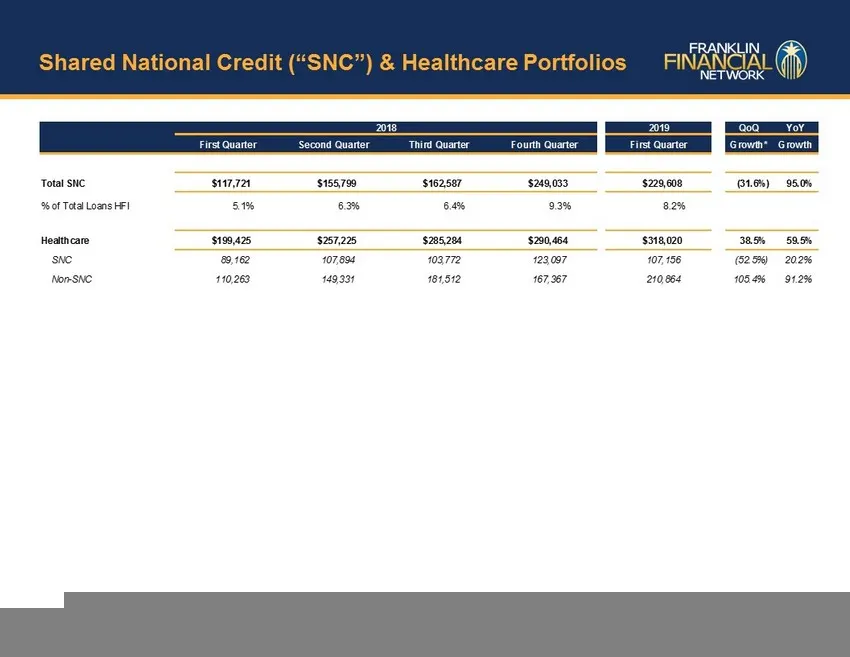
Shared National Credit (“SNC”) & Healthcare Portfolios Note: $ in 000s * Annualized 2018 2019 QoQ YoY First Quarter Second Quarter Third Quarter Fourth Quarter First Quarter Growth* Growth Total SNC $117,721 $155,799 $162,587 $249,033 $229,608 (31.6%) 95.0% % of Total Loans HFI 5.1% 6.3% 6.4% 9.3% 8
Slide 17: Non-GAAP Reconciliations
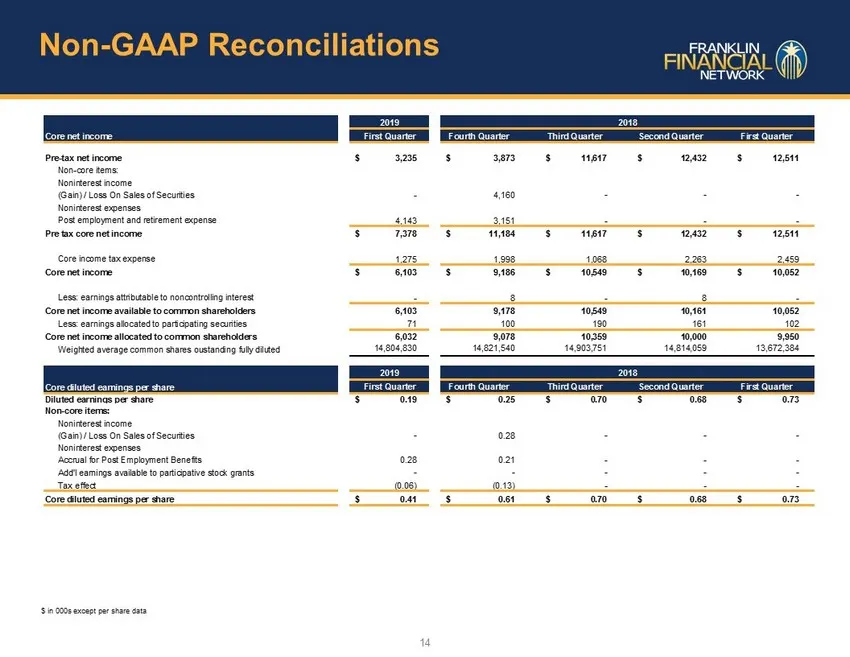
Non - GAAP Reconciliations 14 $ in 000s except per share data 2019 2018 Core net income First Quarter Fourth Quarter Third Quarter Second Quarter First Quarter Pre-tax net income $ 3,235 $ 3,873 $ 11,617 $ 12,432 $ 12,511 Non-core items: Noninterest income (Gain) / Loss On Sales of Securities - 4,16
Slide 18: Non-GAAP Reconciliations
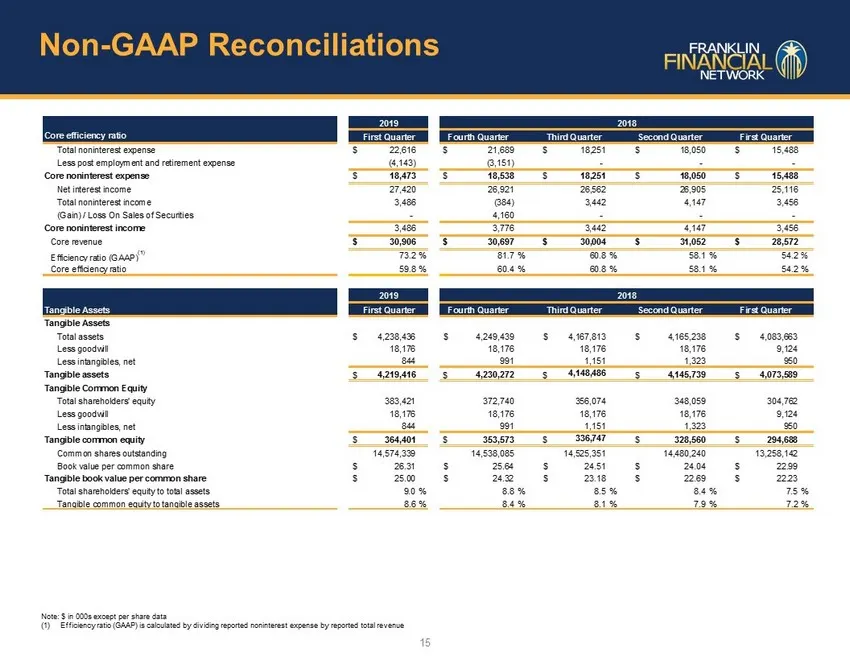
Non - GAAP Reconciliations 15 Note: $ in 000s except per share data (1) Efficiency ratio (GAAP) is calculated by dividing reported noninterest expense by reported total revenue 2019 2018 Core efficiency ratio First Quarter Fourth Quarter Third Quarter Second Quarter First Quarter Total noninterest e
Slide 19: Non-GAAP Reconciliations
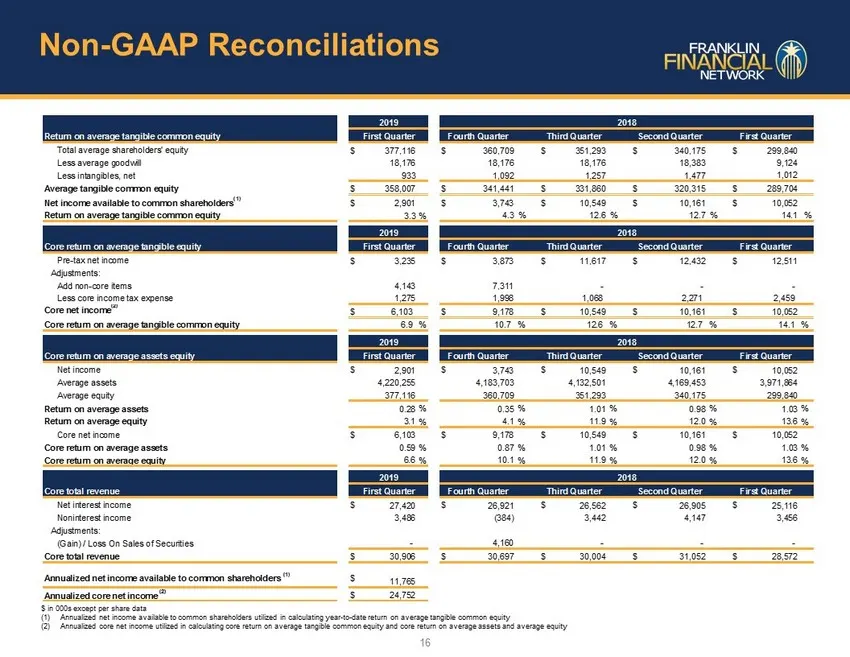
Non - GAAP Reconciliations 16 2019 2018 Return on average tangible common equity First Quarter Fourth Quarter Third Quarter Second Quarter First Quarter Total average shareholders' equity $ 377,116 $ 360,709 $ 351,293 $ 340,175 $ 299,840 Less average goodwill 18,176 18,176 18,176 18,383 9,124 Less i
Source: SEC EDGAR · 8-K filed May 10, 2019
More decks from Franklin Financial Network Inc
 Merger or Acquisition (January 2020)17 slides · Jan 21, 2020
 Q3 2019 Earnings Presentation21 slides · Nov 1, 2019
 Q3 2019 Earnings Presentation15 slides · Oct 23, 2019
 Q2 2019 Earnings Presentation19 slides · Jul 26, 2019
 Q2 2019 Earnings Presentation15 slides · Jul 24, 2019
 Q1 2019 Earnings Presentation15 slides · Apr 24, 2019