Franklin Financial Network Inc
Franklin Financial Network — Q3 2019 Earnings Presentation
15 slides from Franklin Financial Network's earnings presentation, Oct 23, 2019
Slide 1: Third Quarter 2019 Investor Call
Franklin Financial Network, Inc. (NYSE:FSB) Third Quarter 2019 Investor Call October 24, 2019 Exhibit 99.2
Slide 2: Forward-Looking Statements
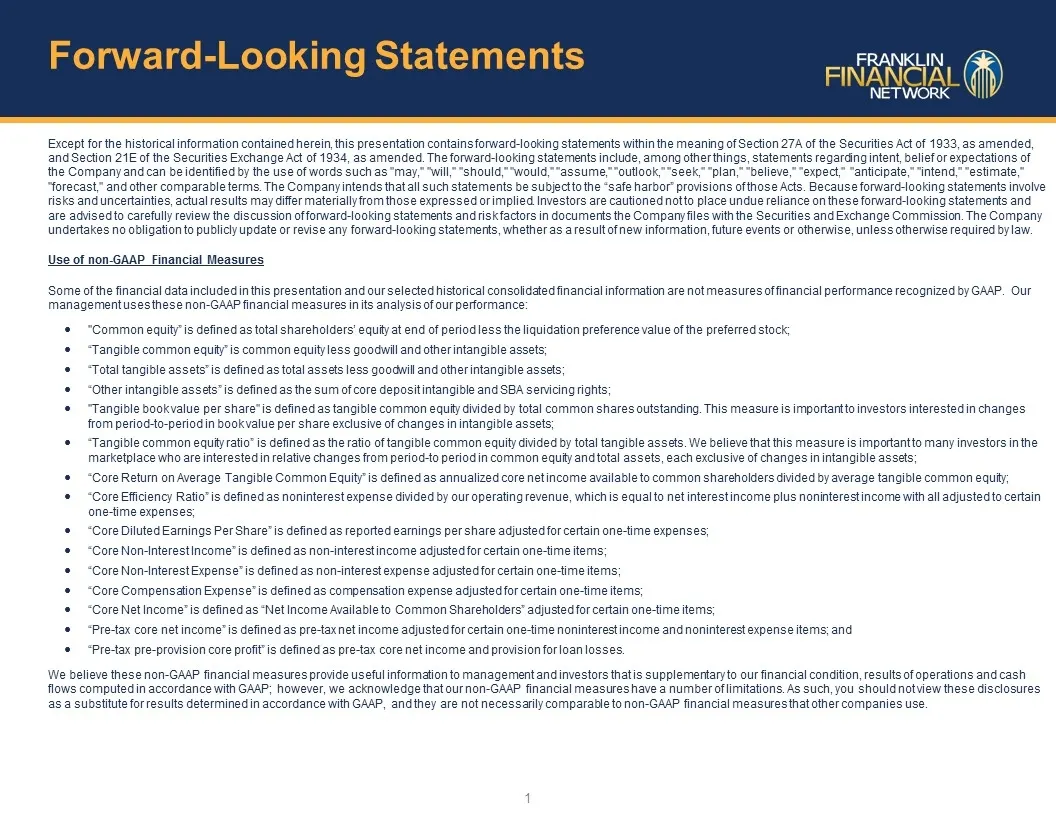
Forward-Looking Statements Except for the historical information contained herein, this presentation contains forward-looking statements within the meaning of Section 27A of the Securities Act of 1933, as amended, and Section 21E of the Securities Exchange Act of 1934, as amended. The forward-lookin
Slide 3: Key Highlights Financial Results
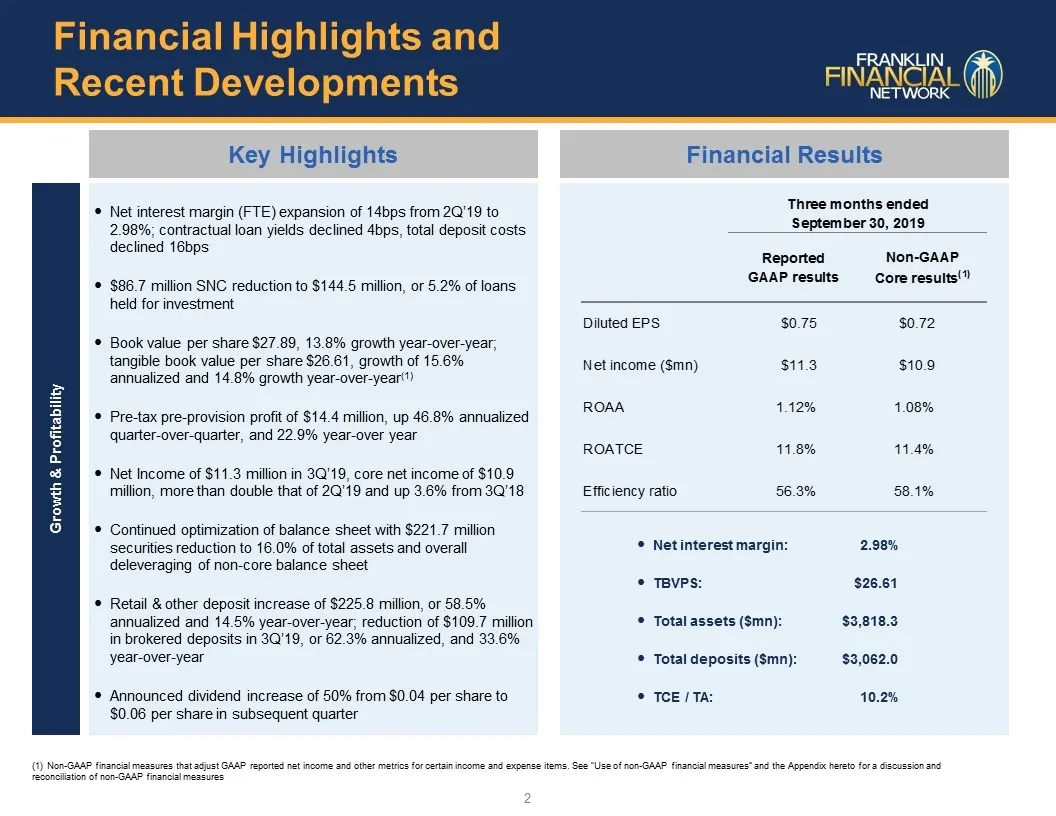
Key Highlights Financial Results Non-GAAP financial measures that adjust GAAP reported net income and other metrics for certain income and expense items. See “Use of non-GAAP financial measures” and the Appendix hereto for a discussion and reconciliation of non-GAAP financial measures 2 Financial Hi
Slide 4: Balancing Profitability and Growth
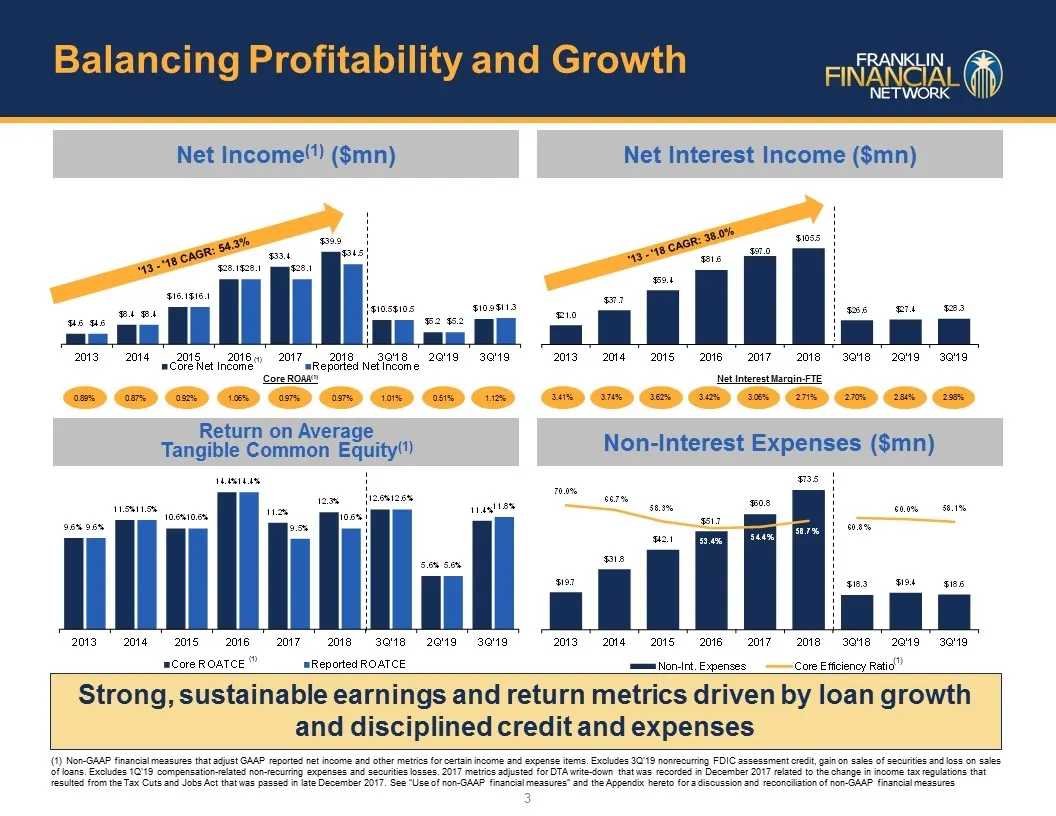
Non-GAAP financial measures that adjust GAAP reported net income and other metrics for certain income and expense items. Excludes 3Q’19 nonrecurring FDIC assessment credit, gain on sales of securities and loss on sales of loans. Excludes 1Q’19 compensation-related non-recurring expenses and securiti
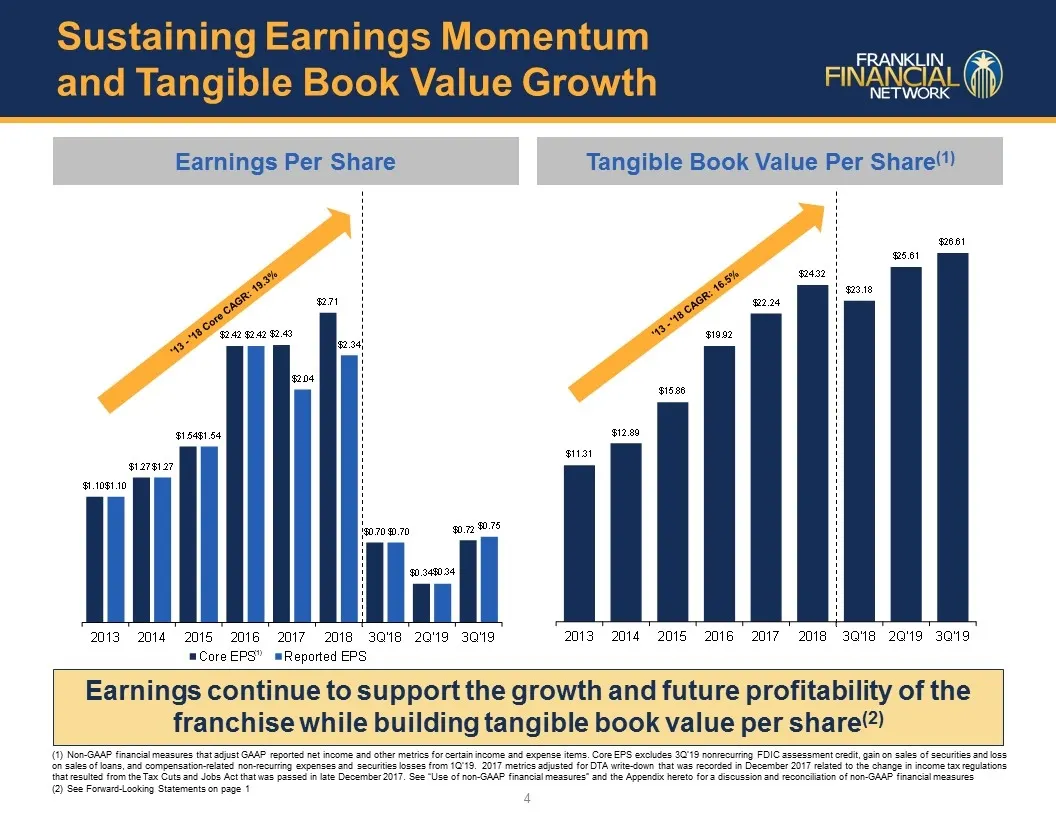
Slide 5: Sustaining Earnings Momentum and Tangible Book Value Growth
Earnings Per Share Tangible Book Value Per Share(1) Earnings continue to support the growth and future profitability of the franchise while building tangible book value per share(2) 4 Sustaining Earnings Momentum and Tangible Book Value Growth Non-GAAP financial measures that adjust GAAP reported ne
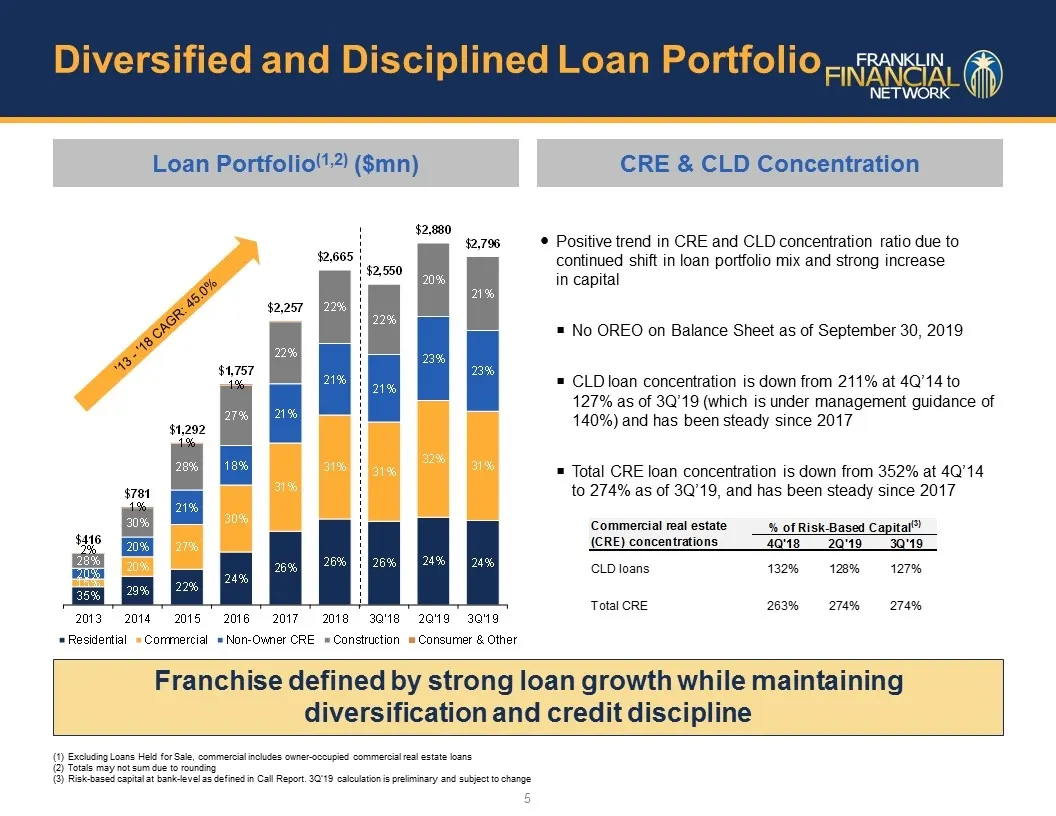
Slide 6: Diversified and Disciplined Loan Portfolio
Diversified and Disciplined Loan Portfolio Loan Portfolio(1,2) ($mn) CRE & CLD Concentration Franchise defined by strong loan growth while maintaining diversification and credit discipline Excluding Loans Held for Sale, commercial includes owner-occupied commercial real estate loans Totals may not s
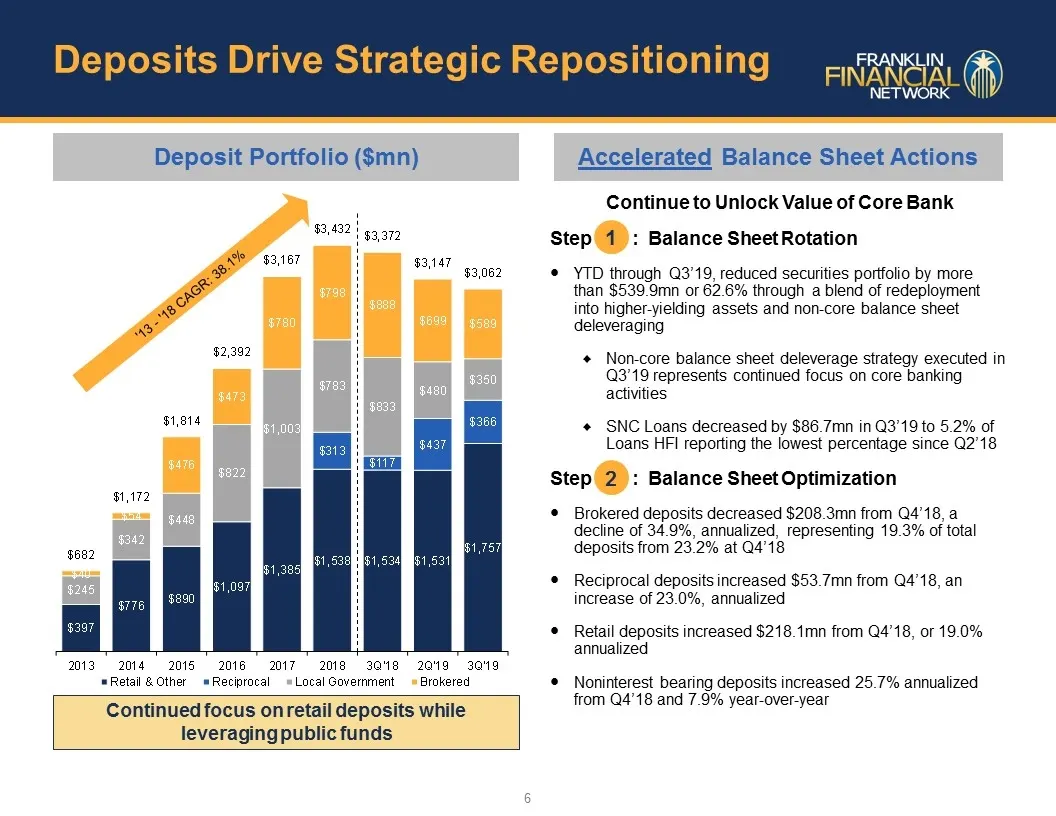
Slide 7: Continue to Unlock Value of Core Bank
Continue to Unlock Value of Core Bank Step : Balance Sheet Rotation YTD through Q3’19, reduced securities portfolio by more than $539.9mn or 62.6% through a blend of redeployment into higher-yielding assets and non-core balance sheet deleveraging Non-core balance sheet deleverage strategy executed i
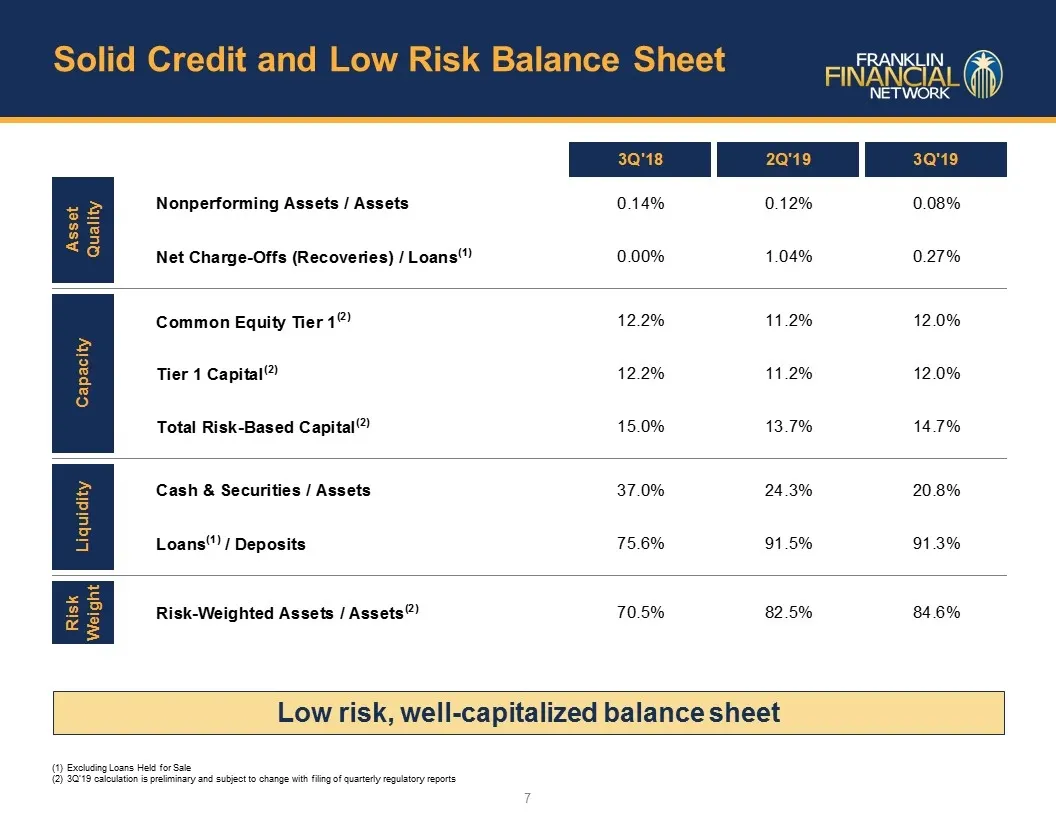
Slide 8: Solid Credit and Low Risk Balance Sheet
Excluding Loans Held for Sale 3Q’19 calculation is preliminary and subject to change with filing of quarterly regulatory reports Low risk, well-capitalized balance sheet 7 Solid Credit and Low Risk Balance Sheet
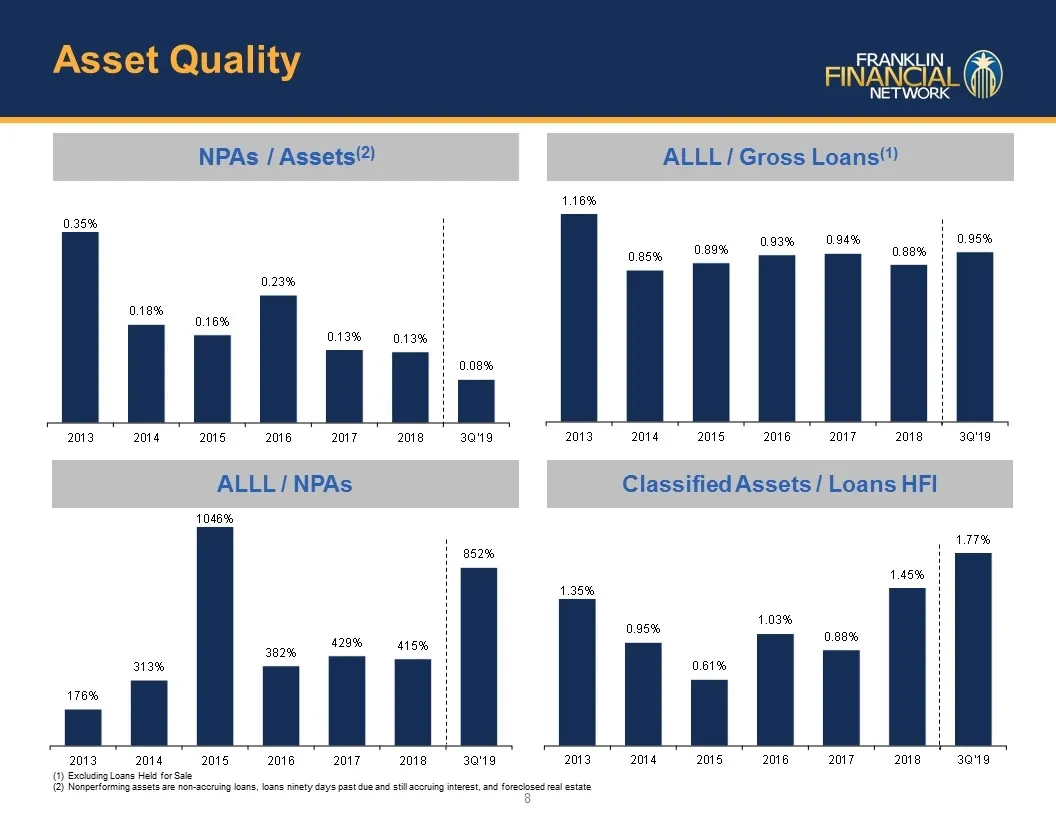
Slide 9: Asset Quality
ALLL / NPAs ALLL / Gross Loans(1) Classified Assets / Loans HFI NPAs / Assets(2) 8 Excluding Loans Held for Sale Nonperforming assets are non-accruing loans, loans ninety days past due and still accruing interest, and foreclosed real estate Asset Quality
Slide 10: Key Drivers of FSB Performance
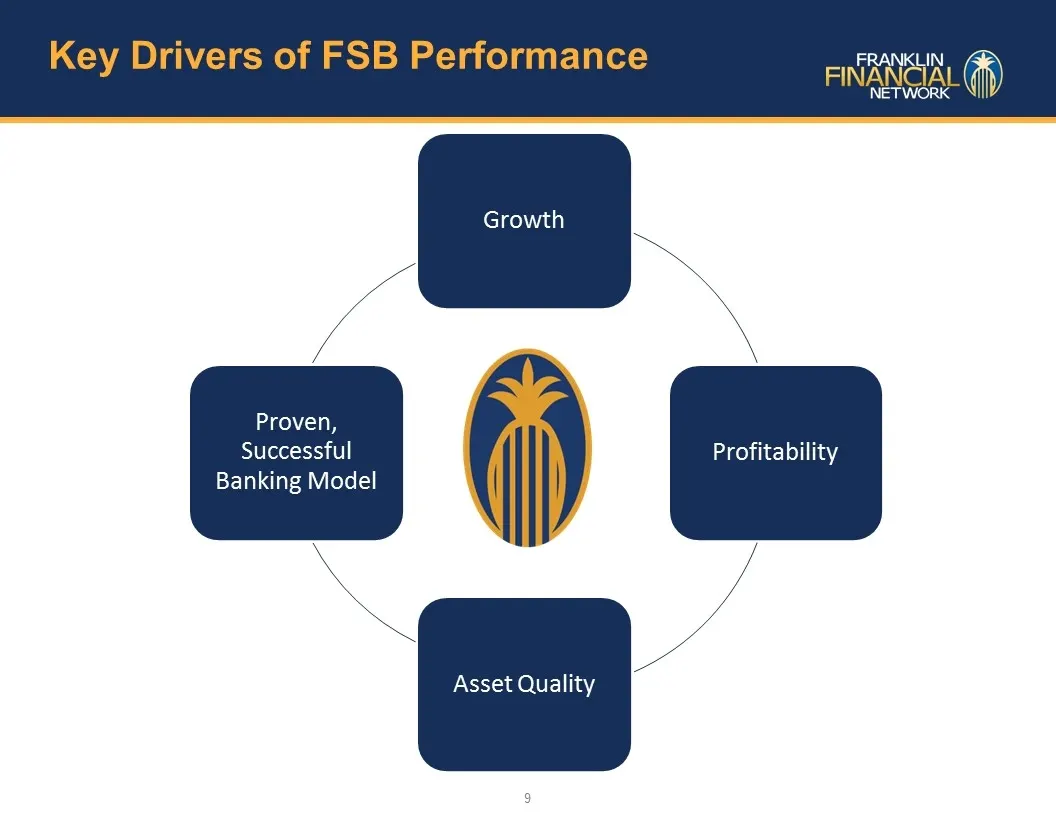
Key Drivers of FSB Performance 9 Growth Profitability Asset Quality Proven, Successful Banking Model

Slide 11: Appendix
Appendix
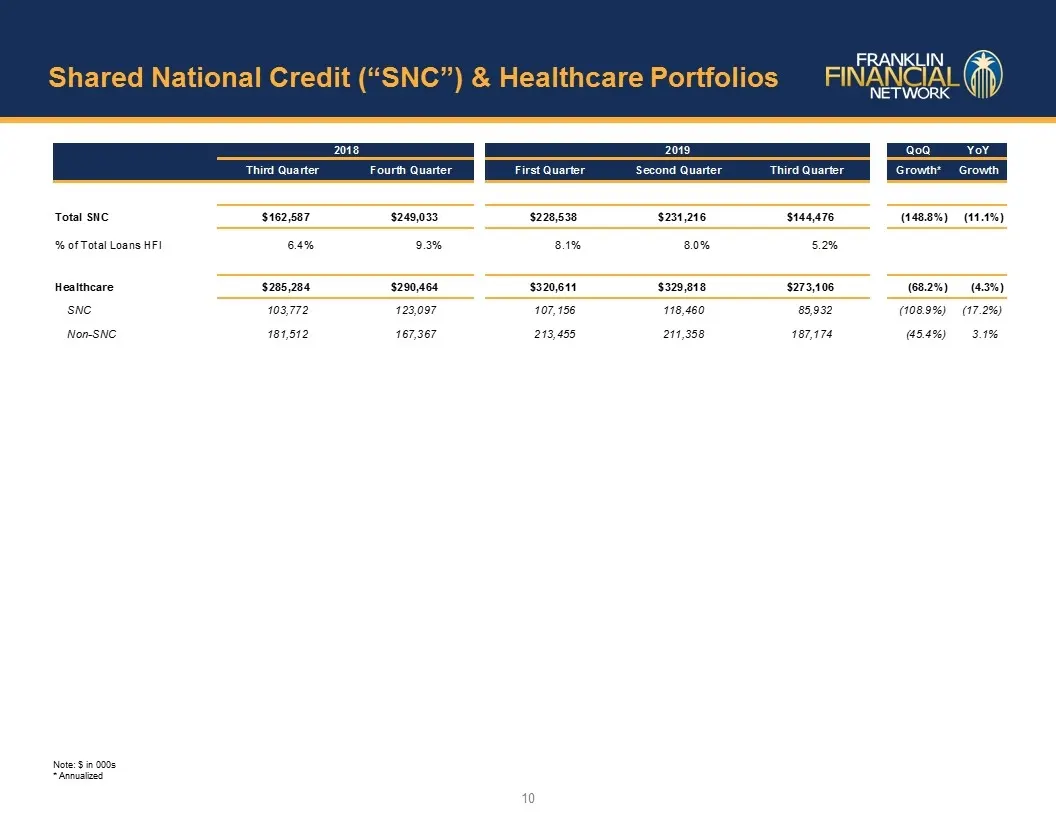
Slide 12: Shared National Credit (SNC) & Healthcare Portfolios
Shared National Credit (“SNC”) & Healthcare Portfolios Note: $ in 000s * Annualized 10
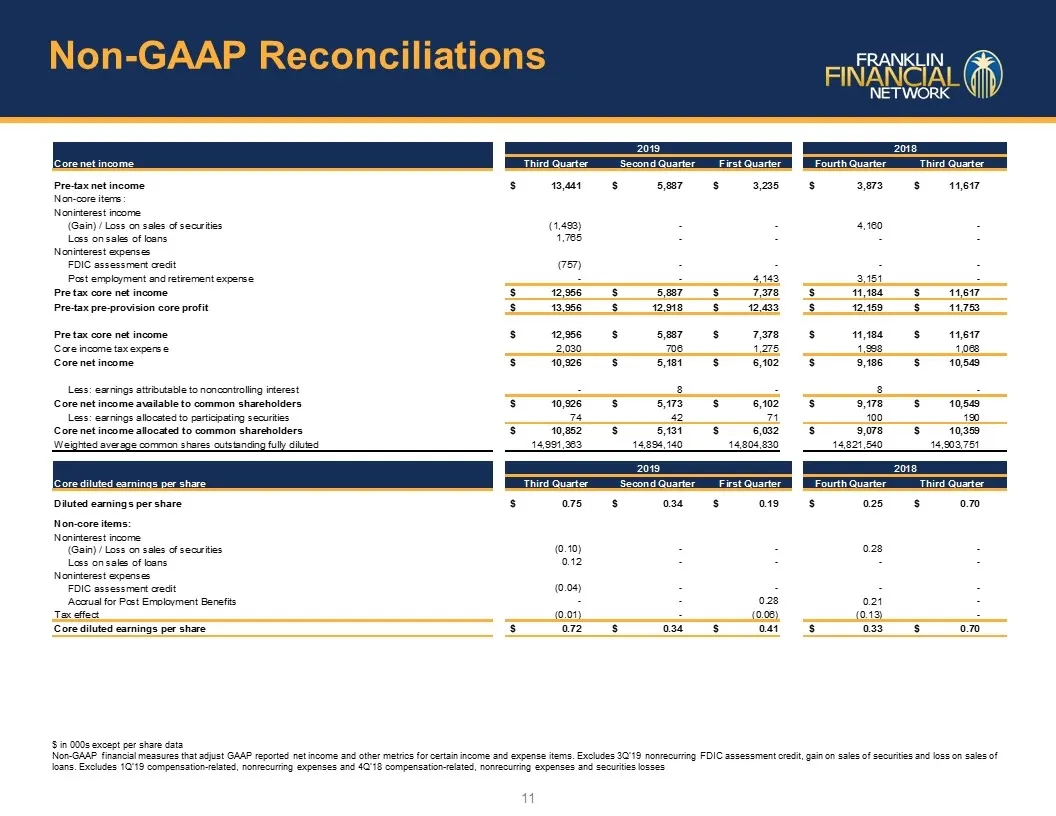
Slide 13: Non-GAAP Reconciliations
Non-GAAP Reconciliations 11 $ in 000s except per share data Non-GAAP financial measures that adjust GAAP reported net income and other metrics for certain income and expense items. Excludes 3Q’19 nonrecurring FDIC assessment credit, gain on sales of securities and loss on sales of loans. Excludes 1Q
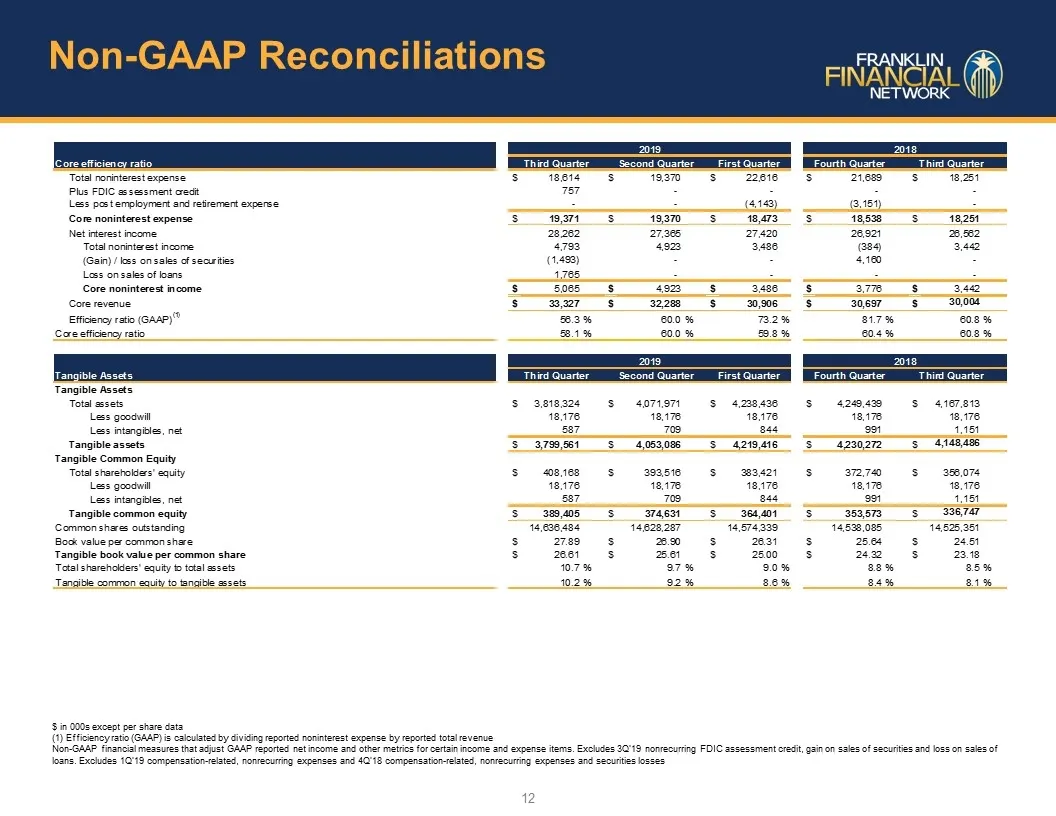
Slide 14: Non-GAAP Reconciliations
Non-GAAP Reconciliations 12 $ in 000s except per share data (1) Efficiency ratio (GAAP) is calculated by dividing reported noninterest expense by reported total revenue Non-GAAP financial measures that adjust GAAP reported net income and other metrics for certain income and expense items. Excludes 3
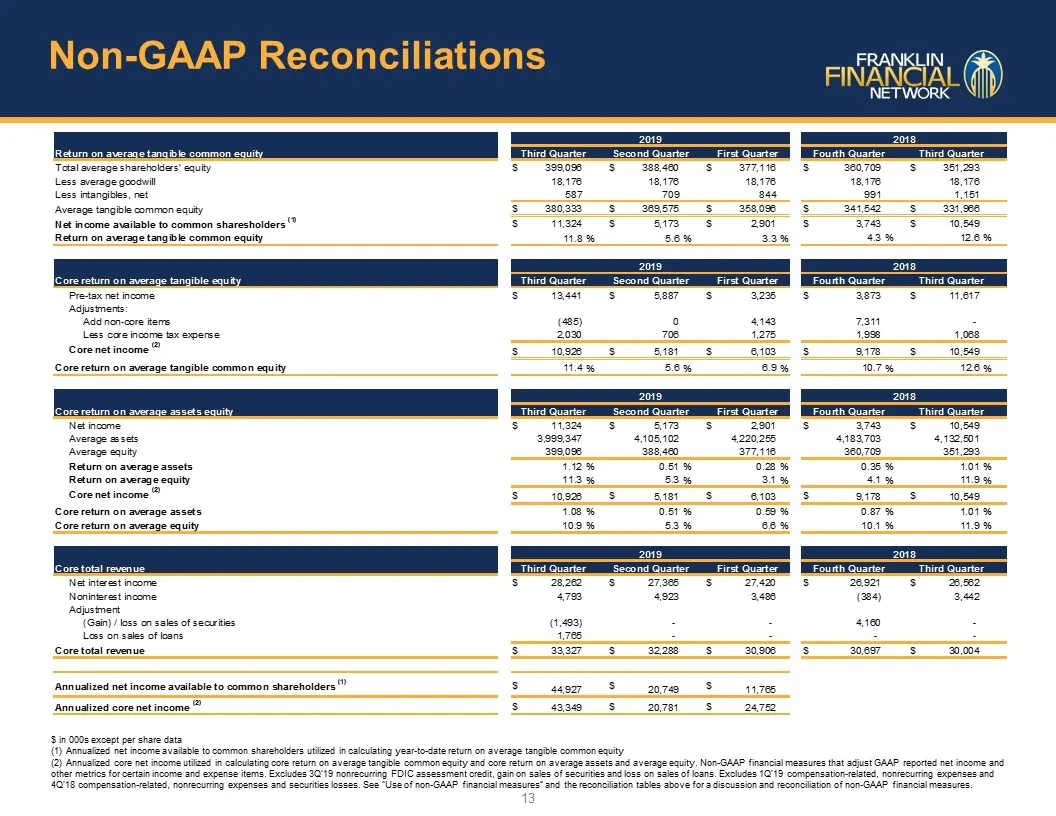
Slide 15: Non-GAAP Reconciliations
Non-GAAP Reconciliations 13 $ in 000s except per share data Annualized net income available to common shareholders utilized in calculating year-to-date return on average tangible common equity Annualized core net income utilized in calculating core return on average tangible common equity and core r
Source: SEC EDGAR · 8-K filed Oct 23, 2019
More decks from Franklin Financial Network Inc
 Merger or Acquisition (January 2020)17 slides · Jan 21, 2020
 Q3 2019 Earnings Presentation21 slides · Nov 1, 2019
 Q2 2019 Earnings Presentation19 slides · Jul 26, 2019
 Q2 2019 Earnings Presentation15 slides · Jul 24, 2019
 Q1 2019 Earnings Presentation19 slides · May 10, 2019
 Q1 2019 Earnings Presentation15 slides · Apr 24, 2019