Franklin Financial Network Inc
Franklin Financial Network — Q3 2019 Earnings Presentation
21 slides from Franklin Financial Network's earnings presentation, Nov 1, 2019
Slide 1: Quarterly Investor Presentation November 2019
Franklin Financial Network, Inc.(NYSE:FSB)Quarterly Investor Presentation November 2019
Slide 2: Forward-Looking Statements
Forward-Looking Statements Except for the historical information contained herein, this presentation contains forward-looking statements within the meaning of Section 27A of the Securities Act of 1933, as amended, and Section 21E of the Securities Exchange Act of 1934, as amended. The forward-lookin
Slide 3: Strong Foundation & Momentum
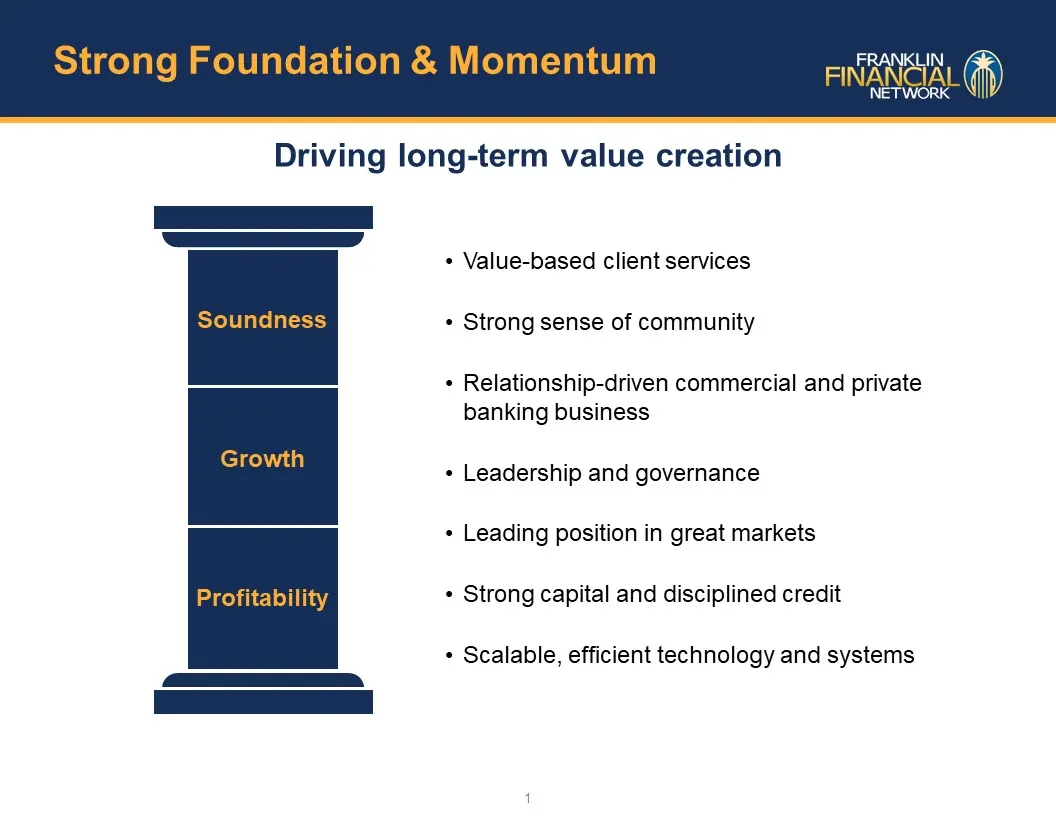
Strong Foundation & Momentum Soundness Growth Profitability 1 Driving long-term value creation Value-based client servicesStrong sense of communityRelationship-driven commercial and private banking businessLeadership and governanceLeading position in great marketsStrong capital and disciplined credi
Slide 4: Leading Nashville Bank
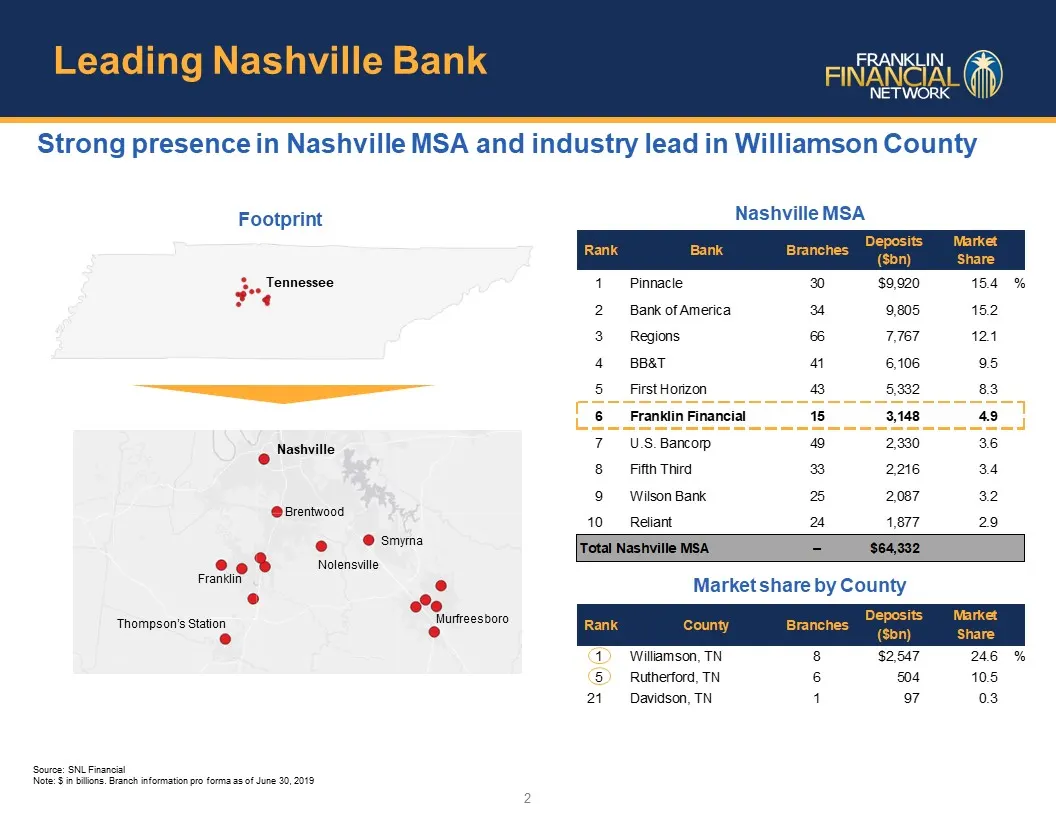
Leading Nashville Bank 2 Nashville Brentwood Nolensville Smyrna Murfreesboro Thompson’s Station Franklin Nashville MSA Source: SNL FinancialNote: $ in billions. Branch information pro forma as of June 30, 2019 Footprint Market share by County Strong presence in Nashville MSA and industry lead in Wil
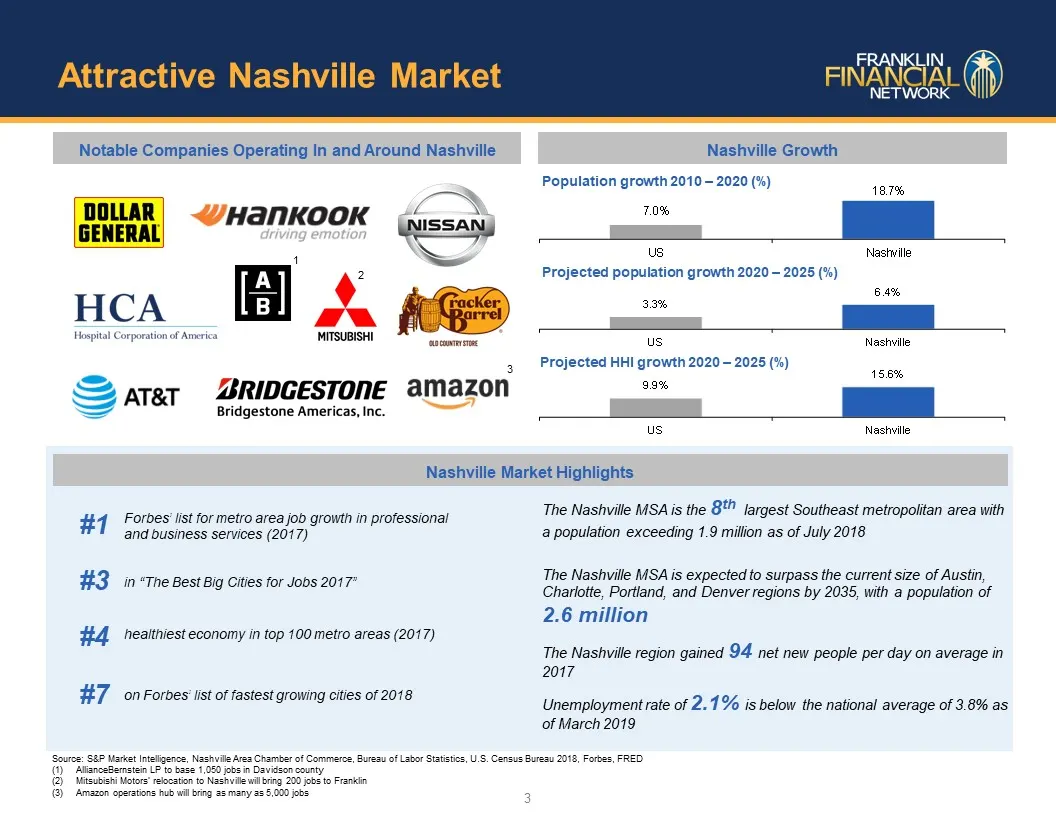
Slide 5: Attractive Nashville Market
Attractive Nashville Market Notable Companies Operating In and Around Nashville Population growth 2010 – 2020 (%) Projected population growth 2020 – 2025 (%) Projected HHI growth 2020 – 2025 (%) Nashville Market Highlights The Nashville MSA is the 8th largest Southeast metropolitan area with a popul
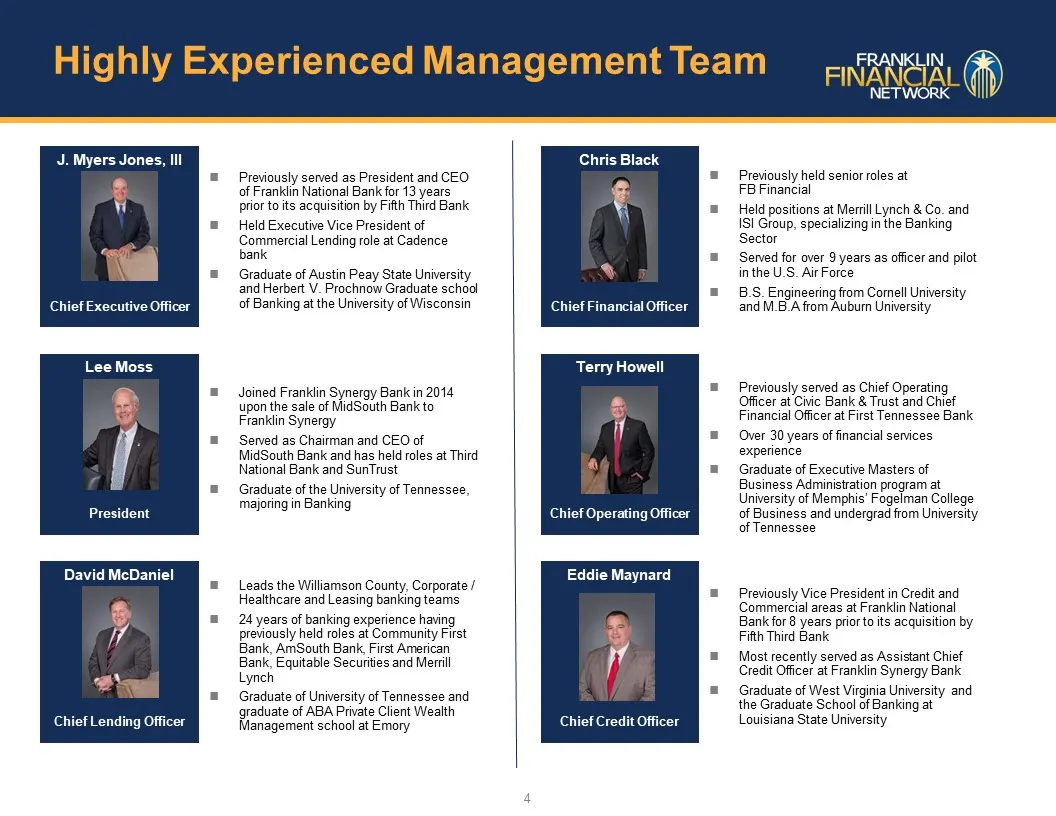
Slide 6: Highly Experienced Management Team
Highly Experienced Management Team 4 Chris BlackChief Financial Officer Previously held senior roles at FB FinancialHeld positions at Merrill Lynch & Co. and ISI Group, specializing in the Banking SectorServed for over 9 years as officer and pilot in the U.S. Air ForceB.S. Engineering from Cornell U
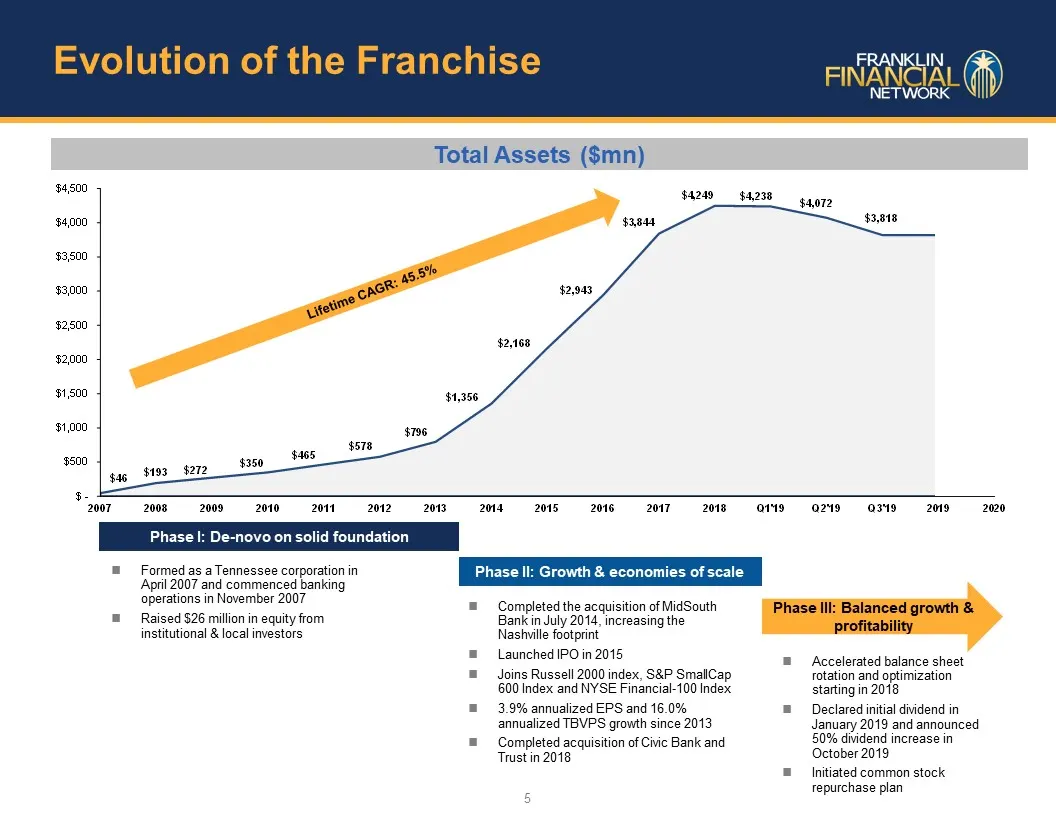
Slide 7: Evolution of the Franchise
Evolution of the Franchise 5 Total Assets ($mn) Phase I: De-novo on solid foundation Phase II: Growth & economies of scale Phase III: Balanced growth & profitability Formed as a Tennessee corporation in April 2007 and commenced banking operations in November 2007Raised $26 million in equity from ins
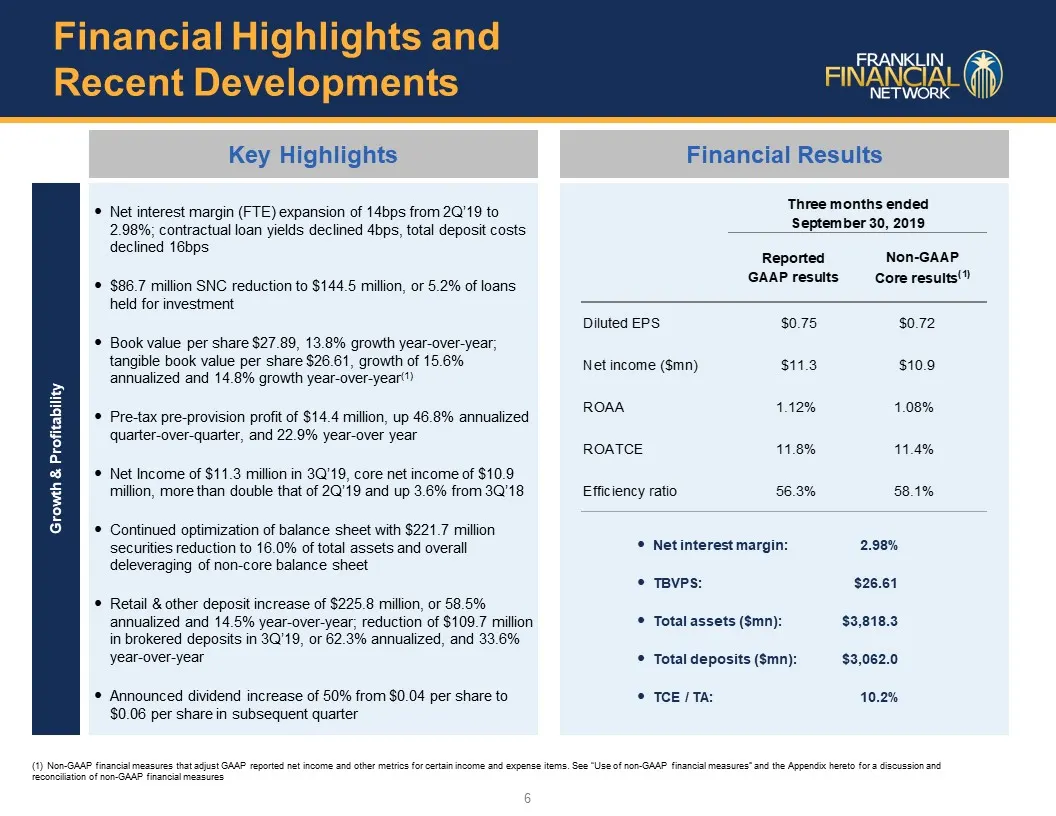
Slide 8: Key Highlights: Financial Highlights and Recent Developments
Key Highlights Financial Results Non-GAAP financial measures that adjust GAAP reported net income and other metrics for certain income and expense items. See “Use of non-GAAP financial measures” and the Appendix hereto for a discussion and reconciliation of non-GAAP financial measures 6 Financial Hi
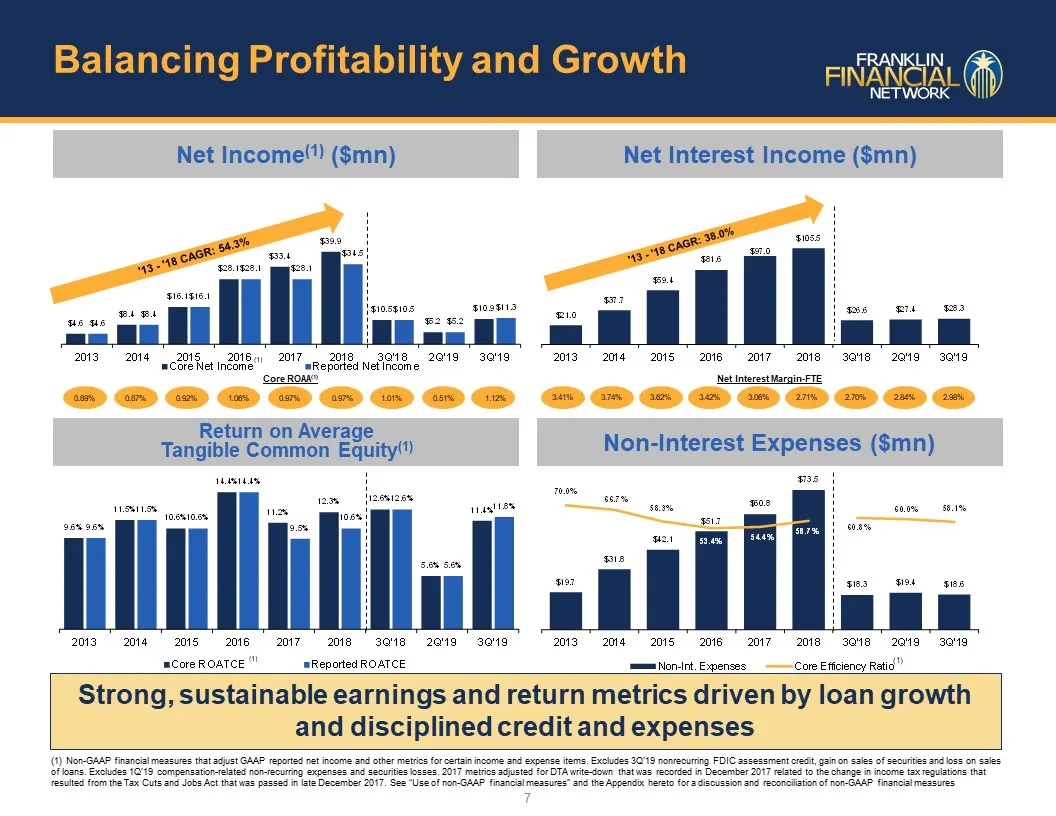
Slide 9: Balancing Profitability and Growth
Non-GAAP financial measures that adjust GAAP reported net income and other metrics for certain income and expense items. Excludes 3Q’19 nonrecurring FDIC assessment credit, gain on sales of securities and loss on sales of loans. Excludes 1Q’19 compensation-related non-recurring expenses and securiti
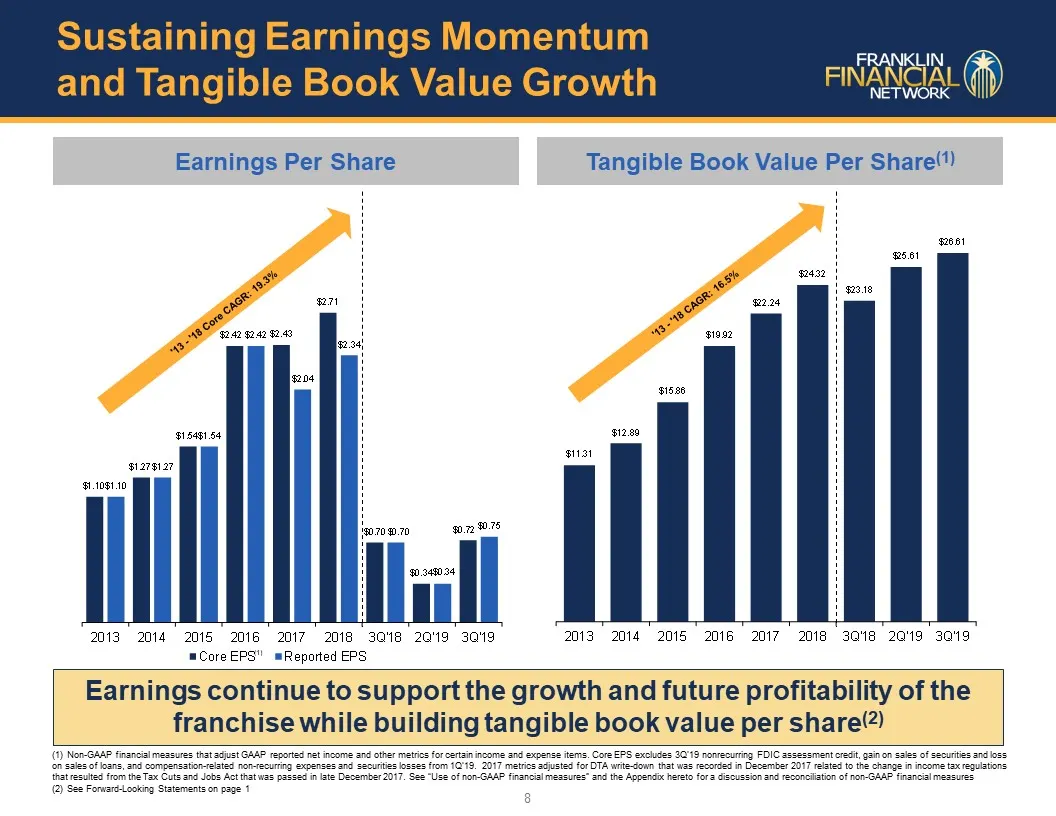
Slide 10: Sustaining Earnings Momentum and Tangible Book Value Growth
Earnings Per Share Tangible Book Value Per Share(1) Earnings continue to support the growth and future profitability of the franchise while building tangible book value per share(2) 8 Sustaining Earnings Momentum and Tangible Book Value Growth Non-GAAP financial measures that adjust GAAP reported ne
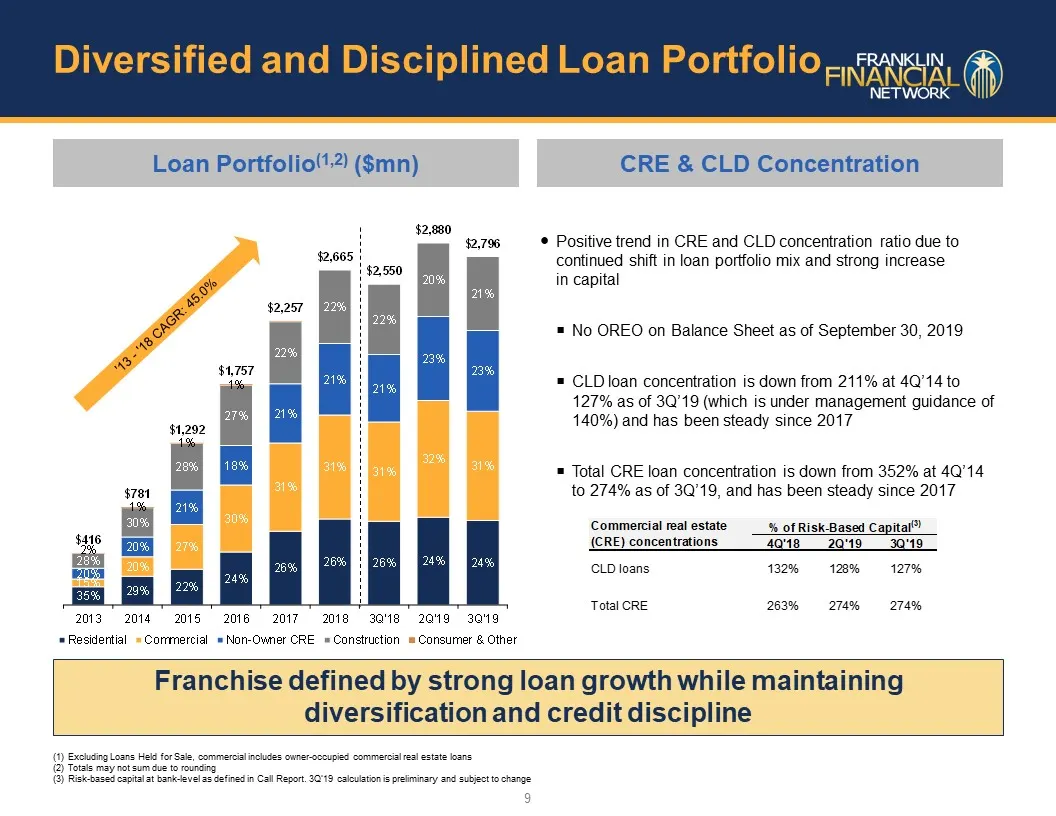
Slide 11: Diversified and Disciplined Loan Portfolio
Diversified and Disciplined Loan Portfolio Loan Portfolio(1,2) ($mn) CRE & CLD Concentration Franchise defined by strong loan growth while maintaining diversification and credit discipline Excluding Loans Held for Sale, commercial includes owner-occupied commercial real estate loans Totals may not s
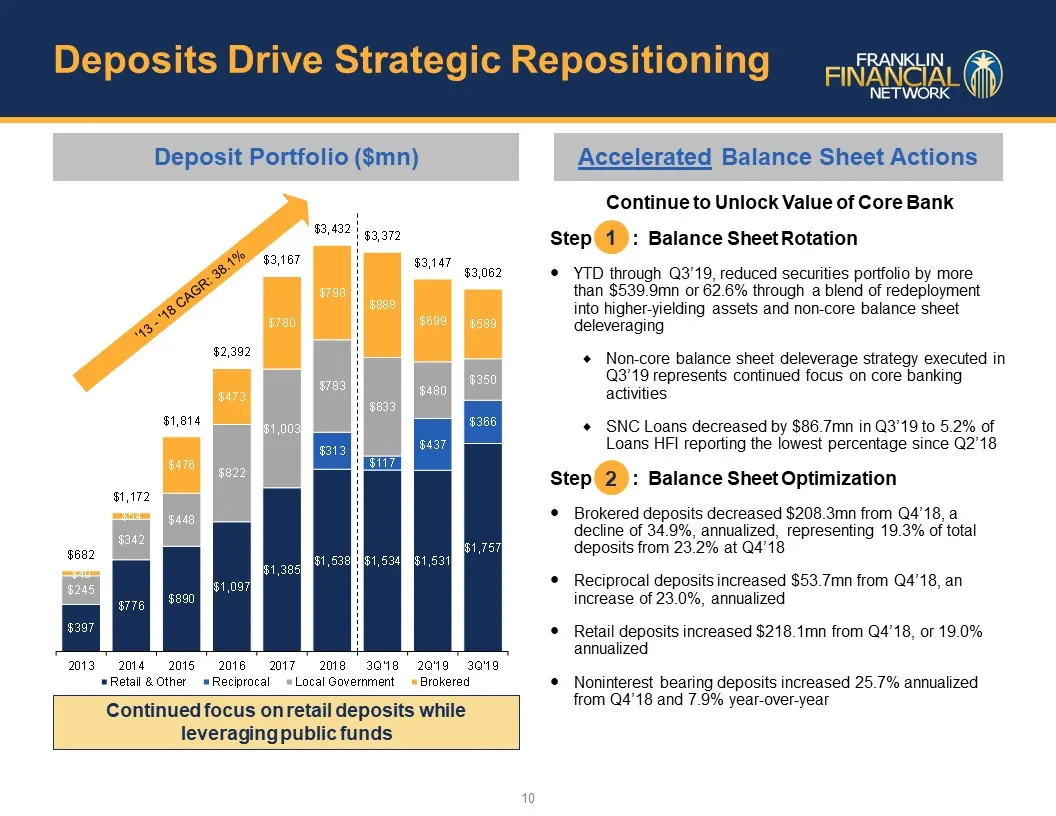
Slide 12: Continue to Unlock Value of Core Bank
Continue to Unlock Value of Core Bank Step : Balance Sheet RotationYTD through Q3’19, reduced securities portfolio by more than $539.9mn or 62.6% through a blend of redeployment into higher-yielding assets and non-core balance sheet deleveragingNon-core balance sheet deleverage strategy executed in
Slide 13: Solid Credit and Low Risk Balance Sheet
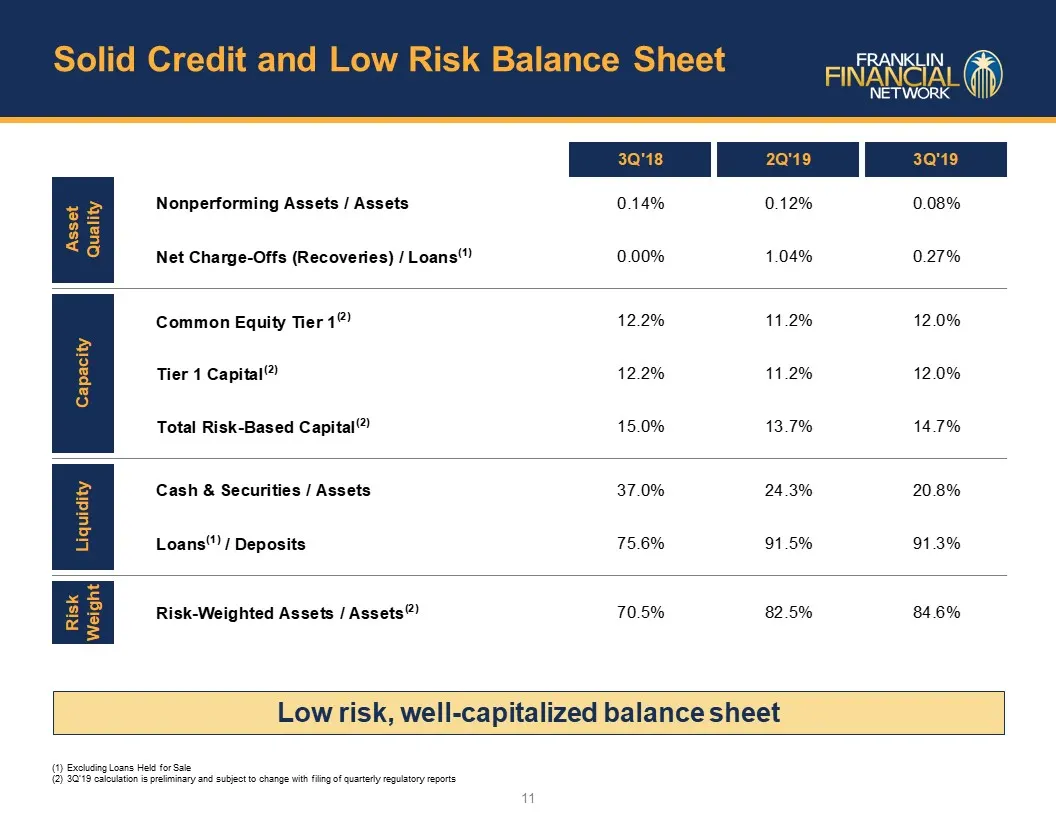
Excluding Loans Held for Sale 3Q’19 calculation is preliminary and subject to change with filing of quarterly regulatory reports Low risk, well-capitalized balance sheet 11 Solid Credit and Low Risk Balance Sheet
Slide 14: Asset Quality
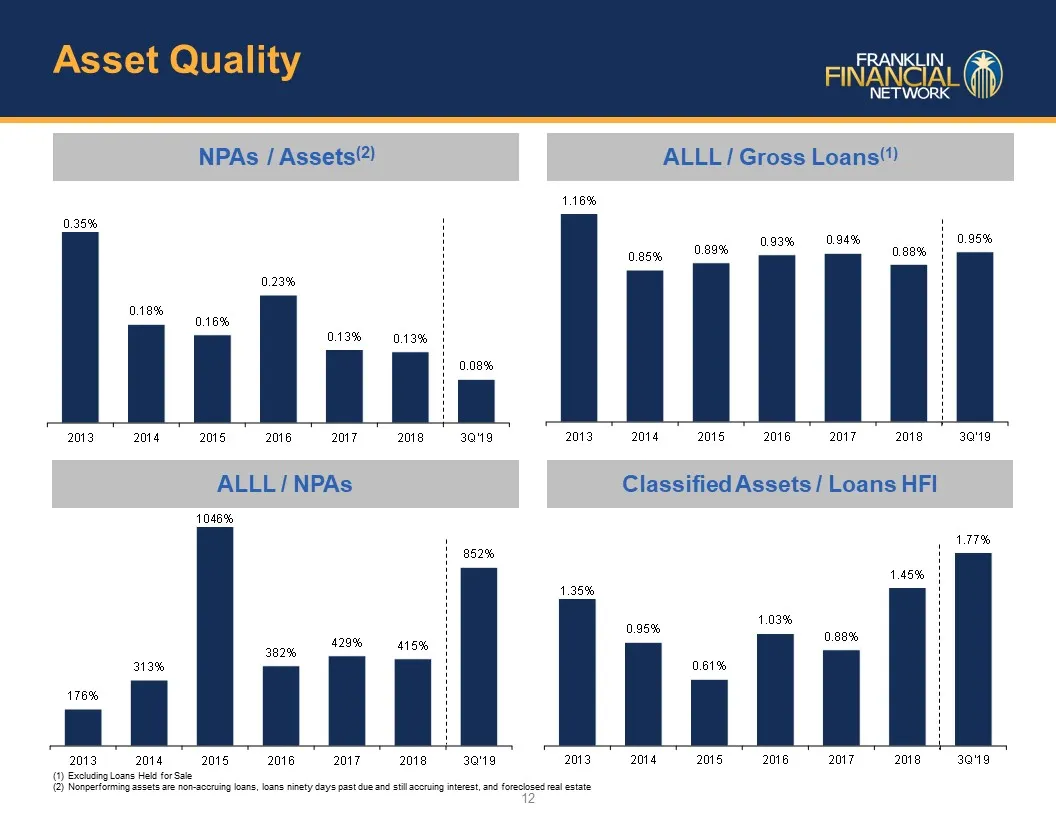
ALLL / NPAs ALLL / Gross Loans(1) Classified Assets / Loans HFI NPAs / Assets(2) 12 Excluding Loans Held for Sale Nonperforming assets are non-accruing loans, loans ninety days past due and still accruing interest, and foreclosed real estate Asset Quality
Slide 15: Medium-Term Performance Targets
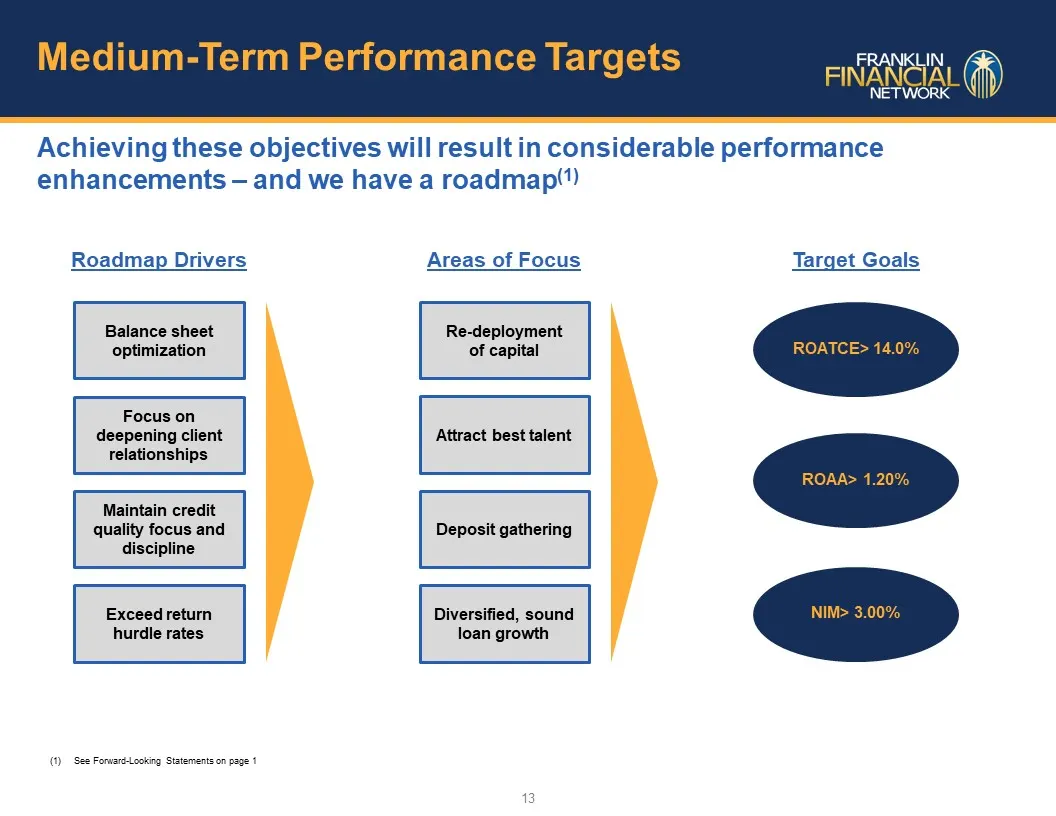
Medium-Term Performance Targets Achieving these objectives will result in considerable performance enhancements – and we have a roadmap(1) 13 ROATCE> 14.0% ROAA> 1.20% NIM> 3.00% See Forward-Looking Statements on page 1 Roadmap Drivers Balance sheet optimization Focus on deepening client relationshi
Slide 16: Key Drivers of FSB Performance
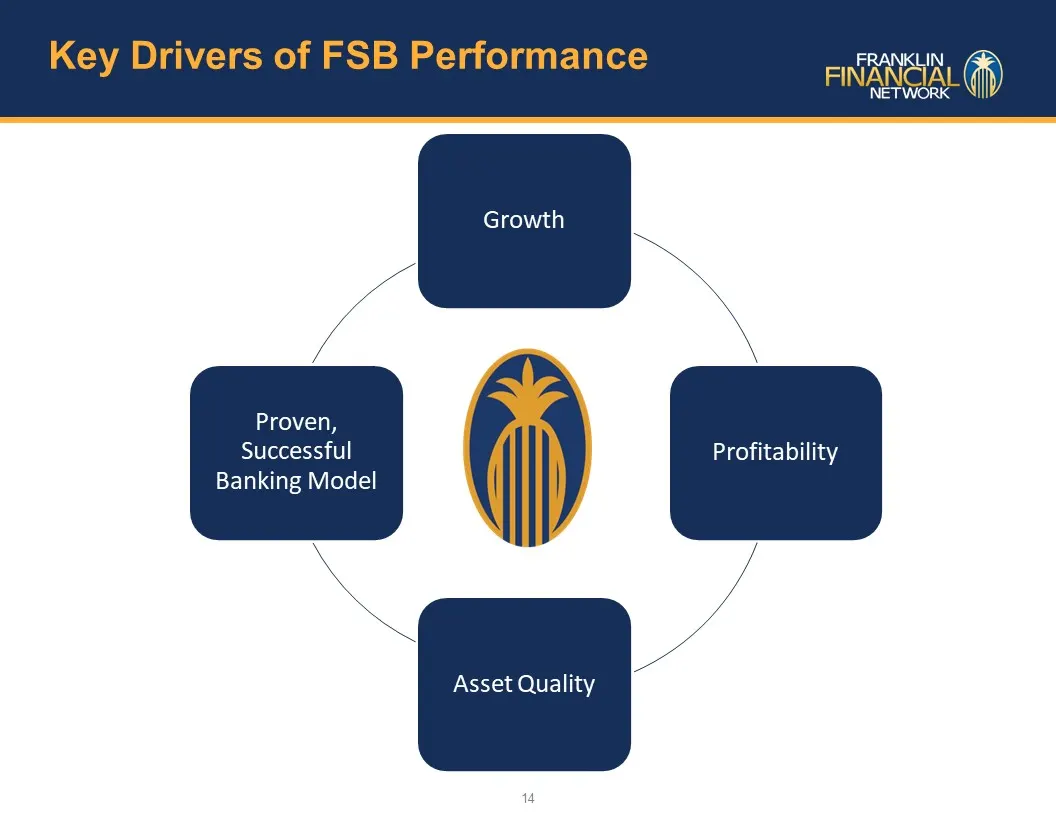
Key Drivers of FSB Performance 14

Slide 17: Appendix
Appendix
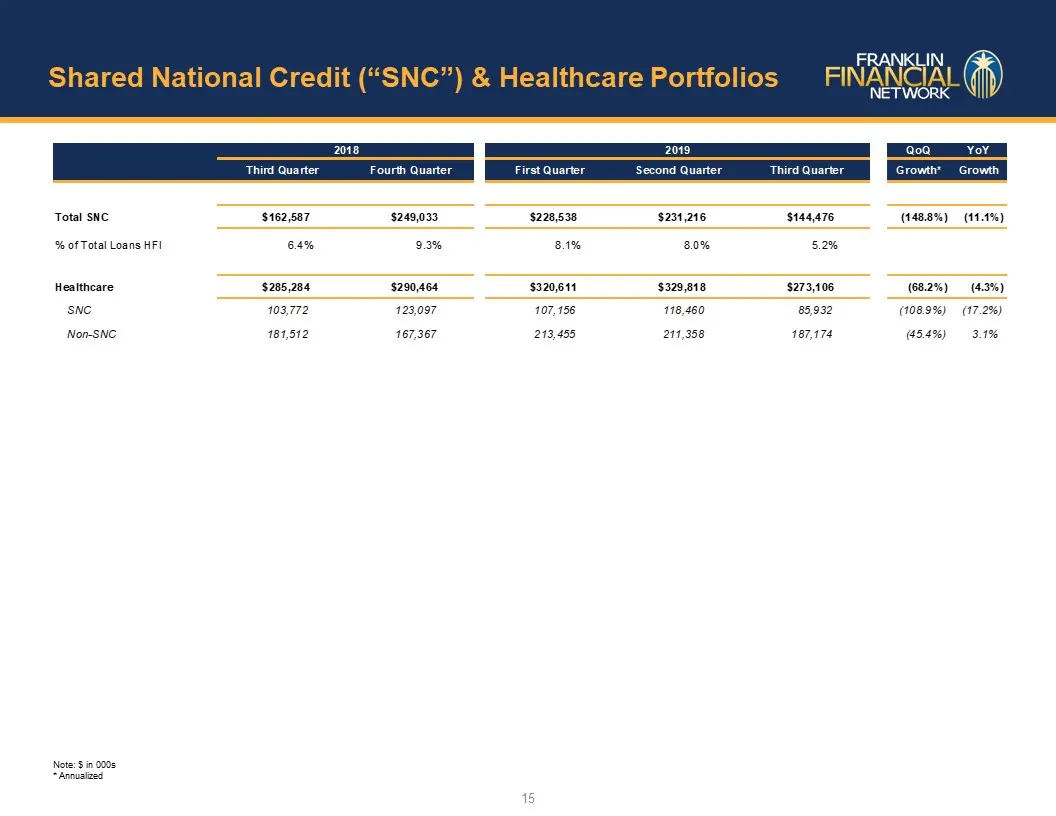
Slide 18: Shared National Credit (SNC) & Healthcare Portfolios
Shared National Credit (“SNC”) & Healthcare Portfolios Note: $ in 000s* Annualized 15
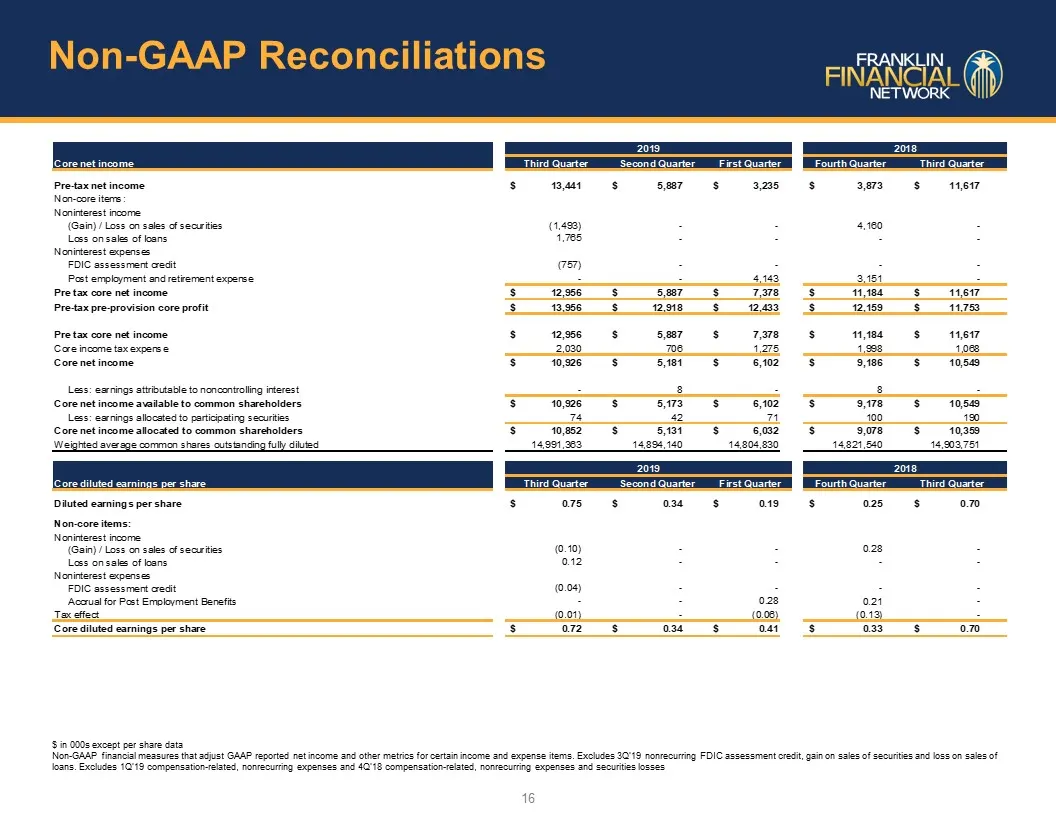
Slide 19: Non-GAAP Reconciliations
Non-GAAP Reconciliations 16 $ in 000s except per share dataNon-GAAP financial measures that adjust GAAP reported net income and other metrics for certain income and expense items. Excludes 3Q’19 nonrecurring FDIC assessment credit, gain on sales of securities and loss on sales of loans. Excludes 1Q’
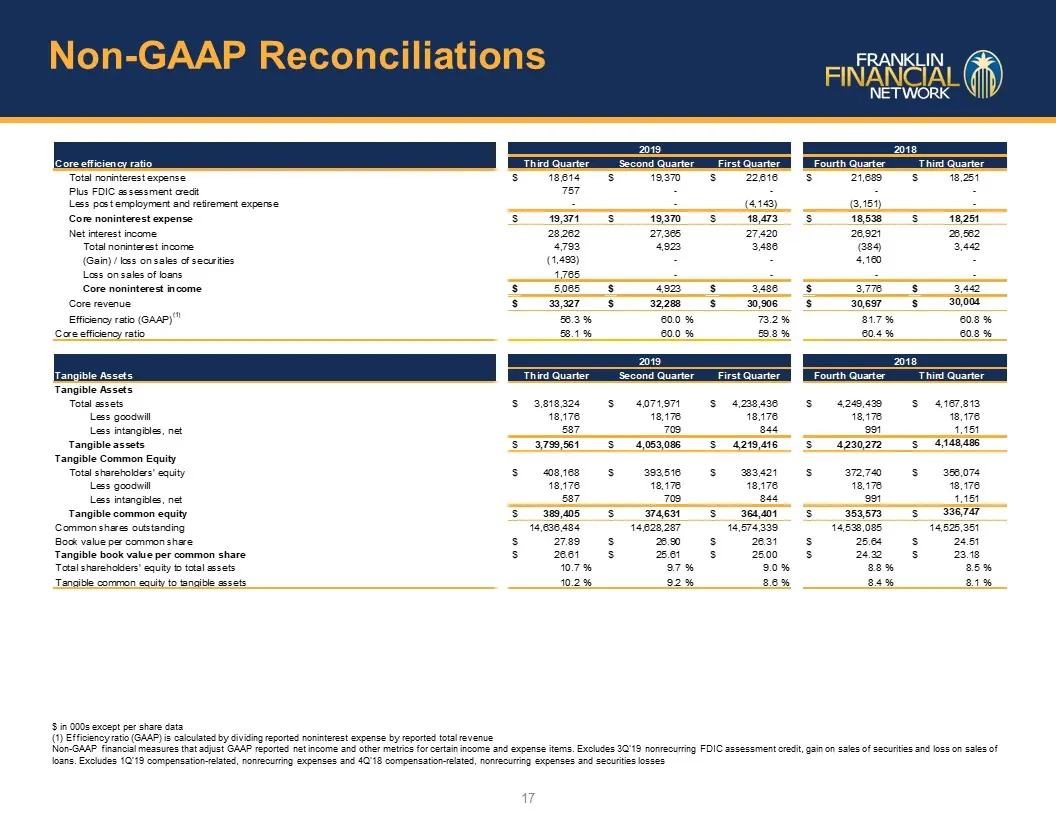
Slide 20: Non-GAAP Reconciliations
Non-GAAP Reconciliations 17 $ in 000s except per share data(1) Efficiency ratio (GAAP) is calculated by dividing reported noninterest expense by reported total revenue Non-GAAP financial measures that adjust GAAP reported net income and other metrics for certain income and expense items. Excludes 3Q
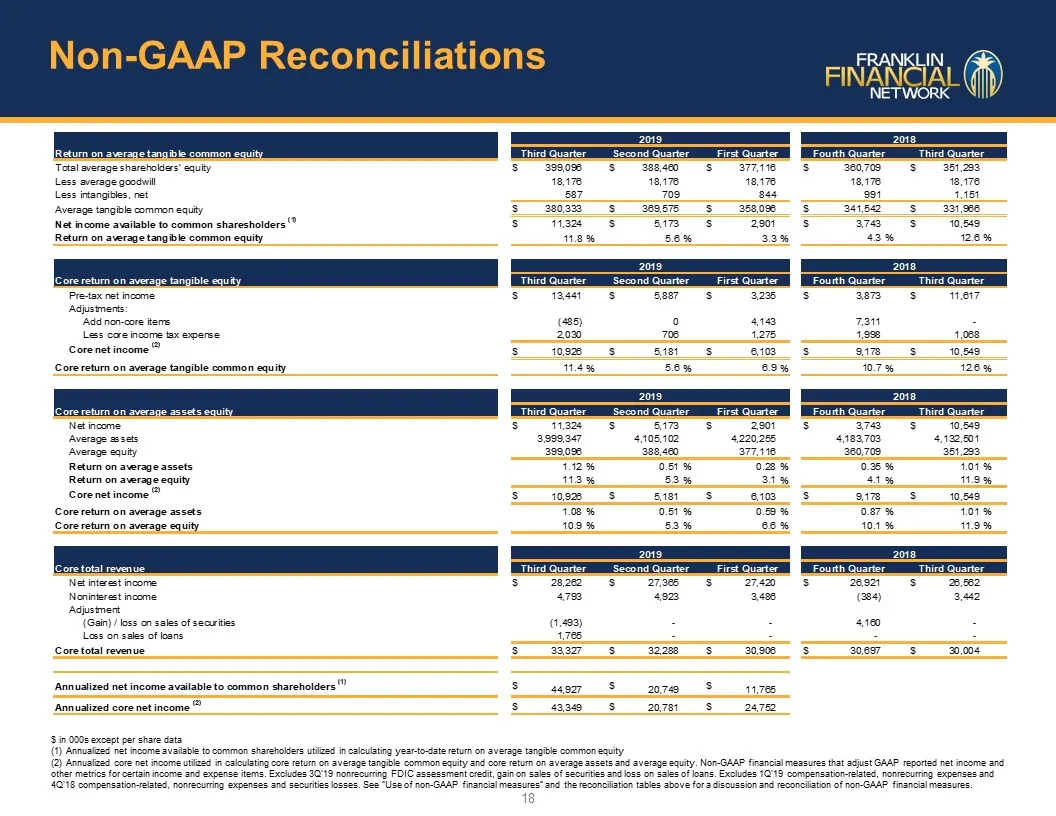
Slide 21: Non-GAAP Reconciliations
Non-GAAP Reconciliations 18 $ in 000s except per share data Annualized net income available to common shareholders utilized in calculating year-to-date return on average tangible common equity Annualized core net income utilized in calculating core return on average tangible common equity and core r
Source: SEC EDGAR · 8-K filed Nov 1, 2019
More decks from Franklin Financial Network Inc
 Merger or Acquisition (January 2020)17 slides · Jan 21, 2020
 Q3 2019 Earnings Presentation15 slides · Oct 23, 2019
 Q2 2019 Earnings Presentation19 slides · Jul 26, 2019
 Q2 2019 Earnings Presentation15 slides · Jul 24, 2019
 Q1 2019 Earnings Presentation19 slides · May 10, 2019
 Q1 2019 Earnings Presentation15 slides · Apr 24, 2019