Nstar — Williams Capital East Coast Conference 2011
37 slides from Nstar's conference presentation, Aug 10, 2011

Slide 1: Williams Capital East Coast Conference
Williams Capital East Coast Conference AUGUST 10, 2011

Slide 2: NU Safe Harbor Provisions
NU Safe Harbor Provisions This presentation contains statements concerning NU’s expectations, beliefs, plans, objectives, goals, strategies, assumptions of future events, future financial performance or growth and other statements that are not historical facts. These statements are “forward-looking

Slide 3: NU Safe Harbor Provisions
NU Safe Harbor Provisions Information Concerning Forward-Looking Statements Relating to the NU–NSTAR Merger In addition to historical information, this communication may contain a number of “forward-looking statements” as defined in the Private Securities Litigation Reform Act of 1995. Words such as

Slide 4: NSTAR Safe Harbor Provisions
NSTAR Safe Harbor Provisions Information Concerning Forward-Looking Statements In addition to historical information, this presentation may contain a number of “forward-looking statements” as defined in the Private Securities Litigation Reform Act of 1995. Words such as anticipate, expect, project,

Slide 5: Topics for Today
Topics for Today • Merger update • Current results – NU • Current results -- NSTAR • Transmission update • Regulatory update

Slide 6: Merger Update
Merger Update
Slide 7: A Compelling Combination – Creates Largest Utility Company in New England
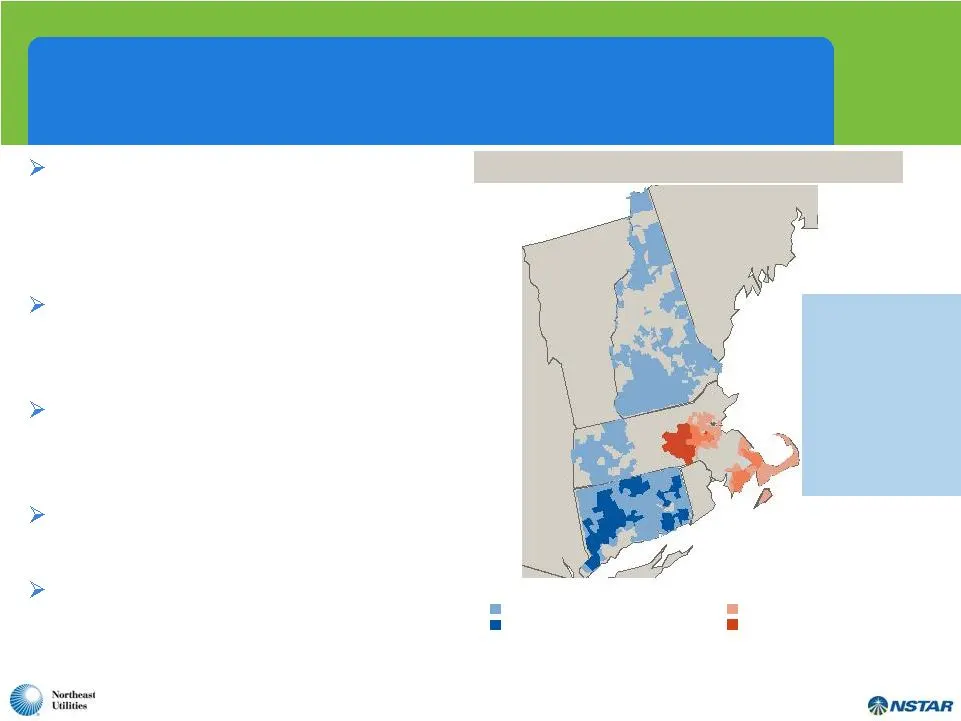
A Compelling Combination – Creates Largest Utility Company in New England Significant infrastructure investment opportunities combined with balance sheet strength provides for substantial growth potential Larger, diverse and better positioned to support economic growth and state public policy initia
Slide 8: Key Merger Terms
Key Merger Terms Timing / Approvals: Expected to close in the fourth quarter of 2011 Headquarters: Dual – Hartford and Boston Company Name: Northeast Utilities Consideration: 100% stock Exchange Ratio: 1.312 shares of Northeast Utilities per NSTAR share Pro Forma Ownership: 56% Northeast Utilities s
Slide 9: Status of Merger Approvals
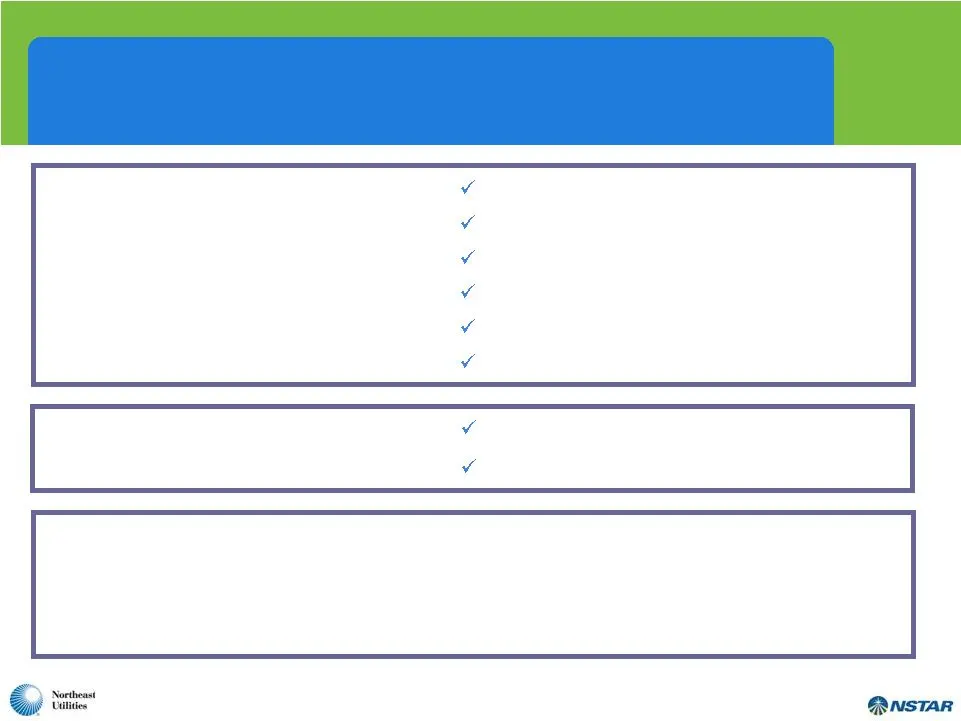
Status of Merger Approvals Securities and Exchange Commission Shareholders Department of Justice Federal Communications Commission Federal Energy Regulatory Commission Maine DPUC Massachusetts DPU Nuclear Regulatory Commission Approvals Received Applications Pending Connecticut PURA New Hampshire PU

Slide 10: Massachusetts Hearings on Merger
Massachusetts Hearings on Merger • Hearings ended July 28 • Net benefits study anticipates $784M in net savings over 10 years Elimination of duplicative efforts Adoption of best practices Attrition/retirements – 350 positions over time • Attorney General’s focus: Customer benefits • Other intervener

Slide 11: Connecticut Developments
Connecticut Developments • DPUC has twice ruled – no jurisdiction over merger • Office of Consumer Counsel and merchant plant owners’ appeals to CT Superior Court • Proposed Bill 1140 – oversight of M&A transactions Senate and House did not address before session ended in June • New Energy Legislati

Slide 12: Current Results - NU
Current Results - NU
Slide 13: NU – Strong First Half Earnings
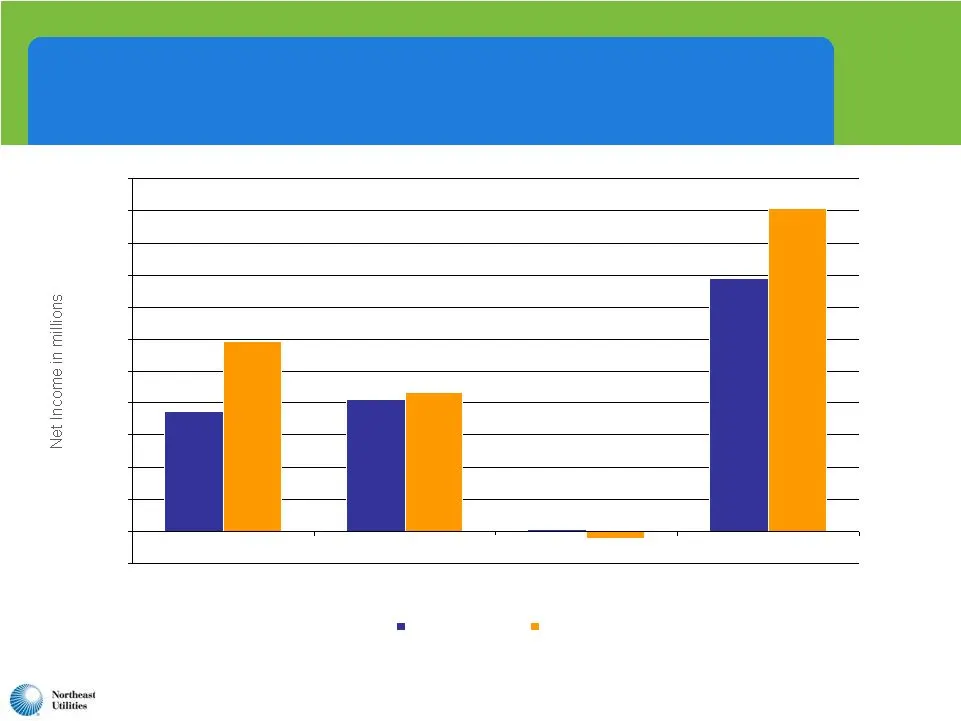
NU – Strong First Half Earnings $82.1 $158.2 $1.1 $75.0 $200.9 -$4.5 $86.9 $118.5 -$20.0 $0.0 $20.0 $40.0 $60.0 $80.0 $100.0 $120.0 $140.0 $160.0 $180.0 $200.0 $220.0 1H 2010 1H 2011 Distribution/Generation Transmission Parent/Other Total *Excludes $9.5 million of after-tax merger-related expenses i
Slide 14: NU First Half Earnings in Distribution/Generation Up Sharply
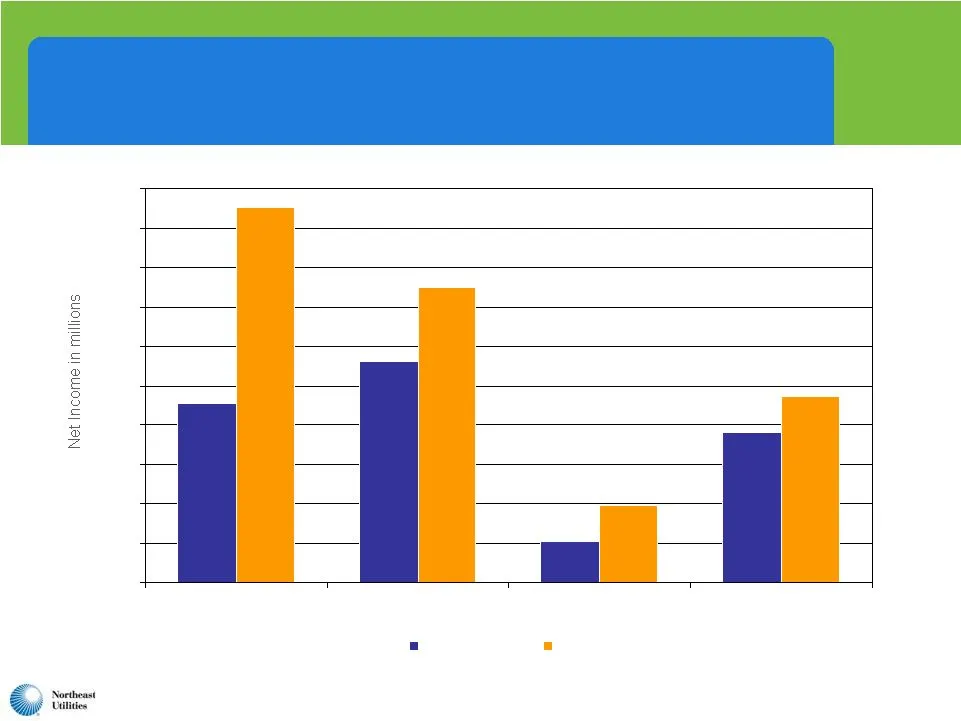
NU First Half Earnings in Distribution/Generation Up Sharply $28.1 $19.0 $5.2 $22.7 $23.7 $9.7 $37.5 $47.6 $0.0 $5.0 $10.0 $15.0 $20.0 $25.0 $30.0 $35.0 $40.0 $45.0 $50.0 CL&P PSNH WMECO Yankee Gas 1H 2010 1H 2011
Slide 15: NU Cash Flows Also Have Risen Significantly
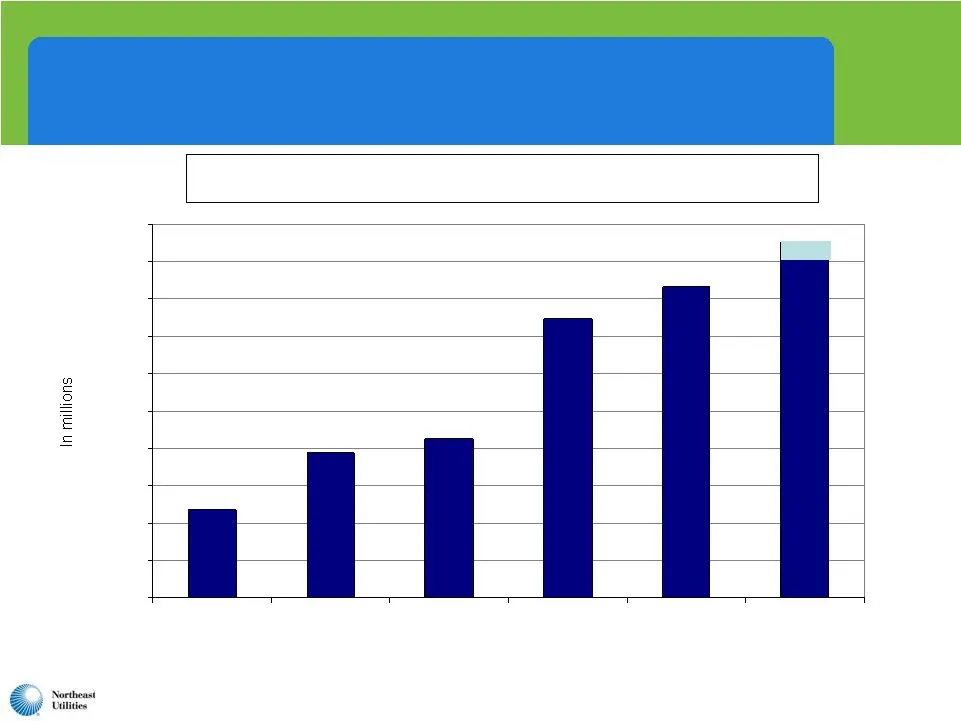
NU Cash Flows Also Have Risen Significantly $0 $100 $200 $300 $400 $500 $600 $700 $800 $900 $1,000 2011E *Excludes payment of $400 million of taxes due to November 2006 generation sale $234 $424 $389* $900 - $950 $745 $833 Net Cash Flows From Operations After Repayment of RRBs
Slide 16: NU Weather-Adjusted Retail Sales Trends
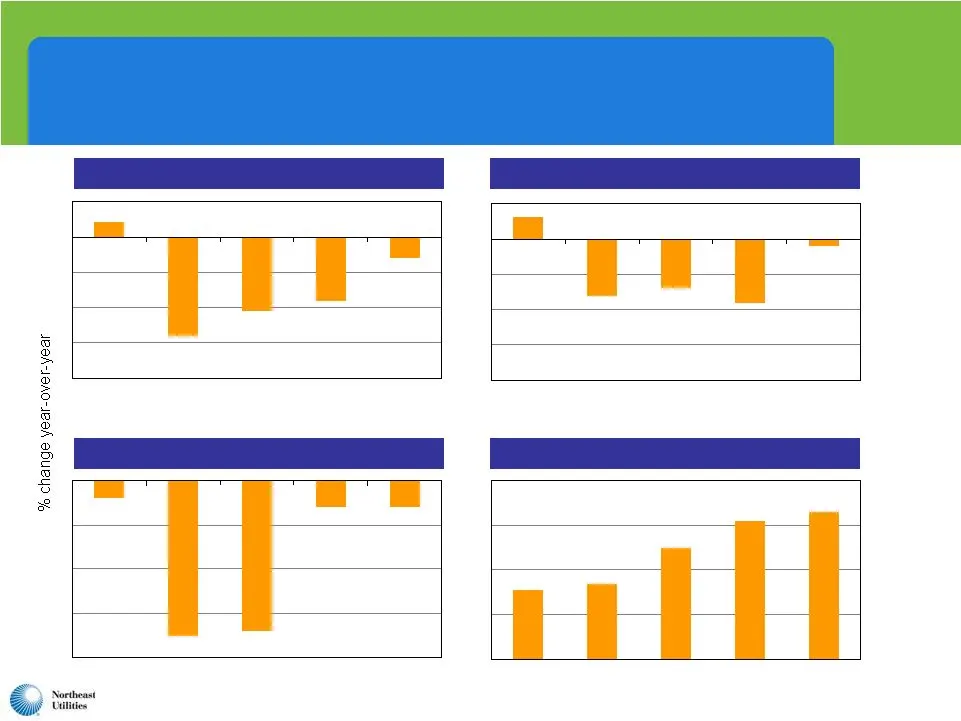
NU Weather-Adjusted Retail Sales Trends CL&P PSNH WMECO Yankee Gas (firm) -2.8 -2.1 -1.8 -0.6 0.4 2011 YTD -1.4 -1.8 -0.2 -1.6 0.6 2011 YTD -0.6 -0.6 -3.4 -3.5 -0.4 2011 YTD 3.4 6.2 6.6 5.0 3.1 2011 YTD
Slide 17: 2009 and 2010 Results and Standalone 2011 Guidance
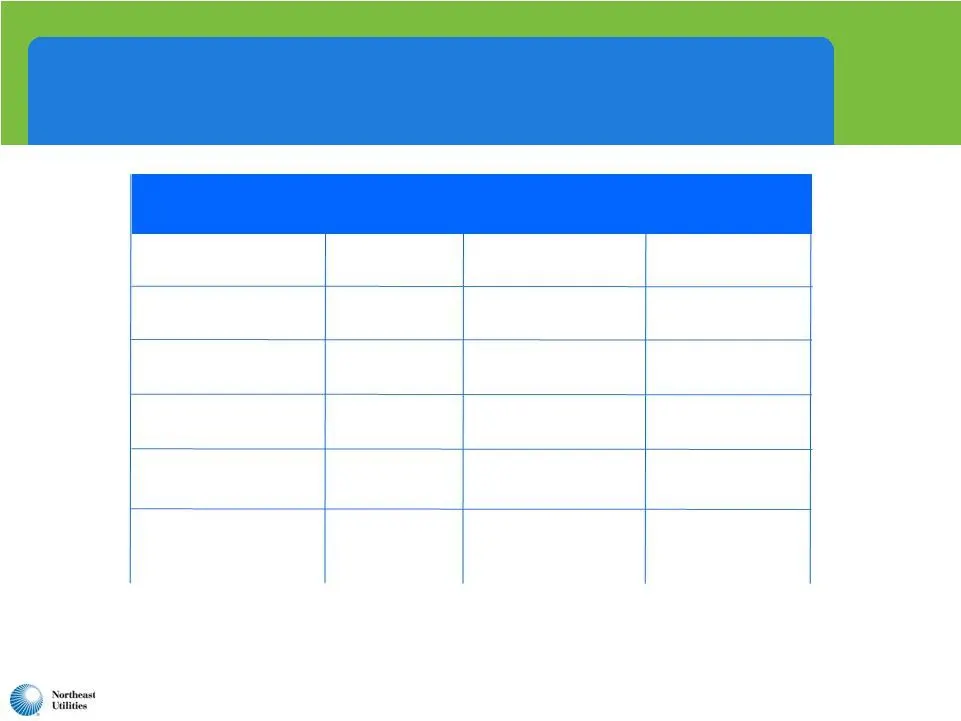
2009 and 2010 Results and Standalone 2011 Guidance 2009 Actual 2010 Actual Revised 2011 Guidance NU Consolidated EPS (GAAP) $1.91 $2.19 $2.10 - $2.20 Distribution/Generation $0.92 $1.16 $1.30 - $1.35 Transmission $0.95 $1.00 $1.05 – $1.10 Competitive $0.09 $0.05 N/A NU Parent/Other ($0.05) ($0.05)*

Slide 18: Current Results - NSTAR
Current Results - NSTAR
Slide 19: NSTAR – Solid Results For Q2-2011
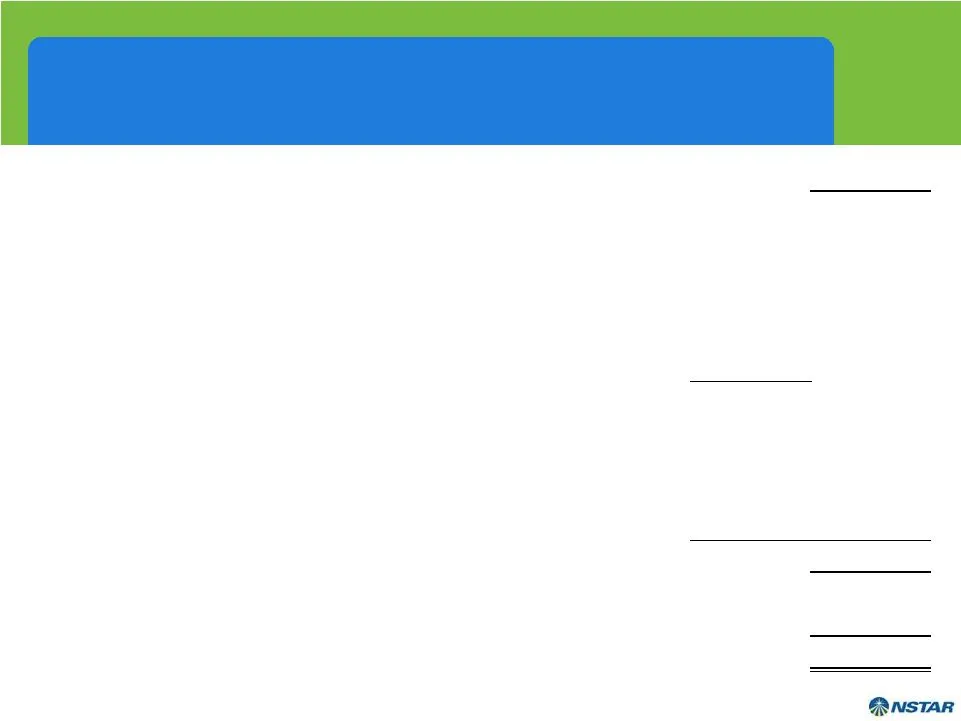
NSTAR – Solid Results For Q2-2011 Q2- 2010 EPS before one-time gain 0.58 $ DPU order - transition revenues adjustment (2010) 0.03 Increase in gas sales (+15.4%) 0.01 Increase in transmission revenue 0.01 Energy efficiency revenues 0.01 Decrease in common shares outstanding 0.01 Telecommunications op

Slide 20: Premier Service Territory Now & For Merged NU
Premier Service Territory Now & For Merged NU • • Solid, diverse customer base Solid, diverse customer base • • Sales growth better than U.S. Sales growth better than U.S. overall overall • • Positive outlook for economy Positive outlook for economy
Slide 21: J.D. Power Survey Recognizes Customer Service Efforts
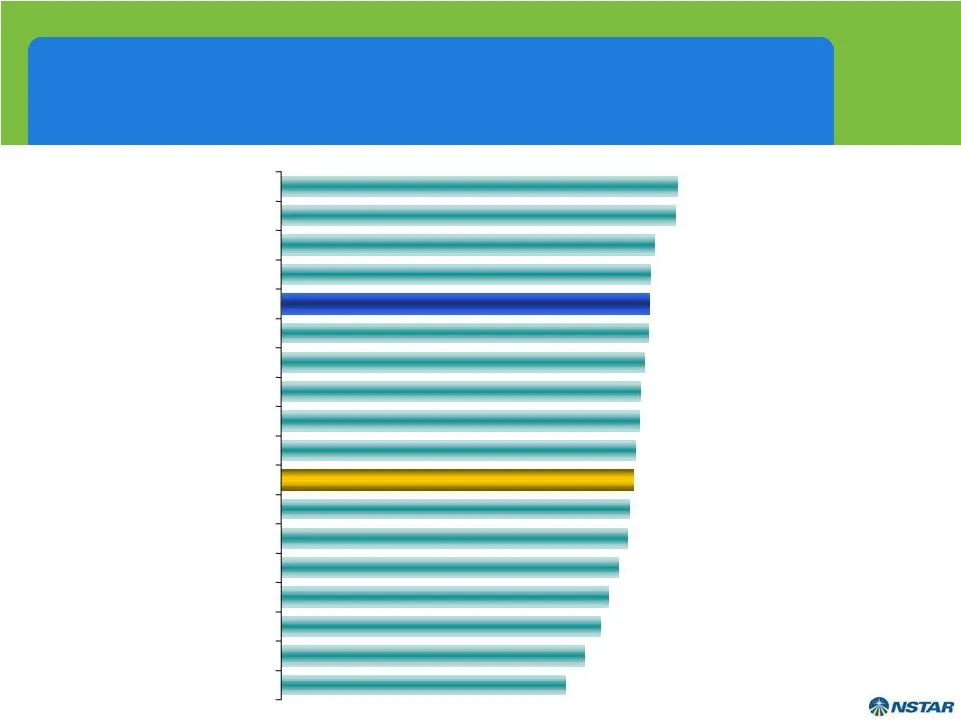
J.D. Power Survey Recognizes Customer Service Efforts Company A Company B Company C Company D NSTAR Company E Company F Company G Company H Company I EAST LARGE AVERAGE Company J Company K Company L Company M Company N Company O Company P

Slide 22: Transmission Update
Transmission Update

Slide 23: NSTAR System Has Significant Transmission Investment Ahead
NSTAR System Has Significant Transmission Investment Ahead • Transmission Rate Base is expected to double within 5 years to approximately $1.6 billion • Growth/reliability spending averages $100 million per year • Incremental Major Projects: – Cape Cod Line $120 million (2011-2012) – Boston 345kV Co
Slide 24: Transmission Business Strategy: Major Initiatives Across Wider New England
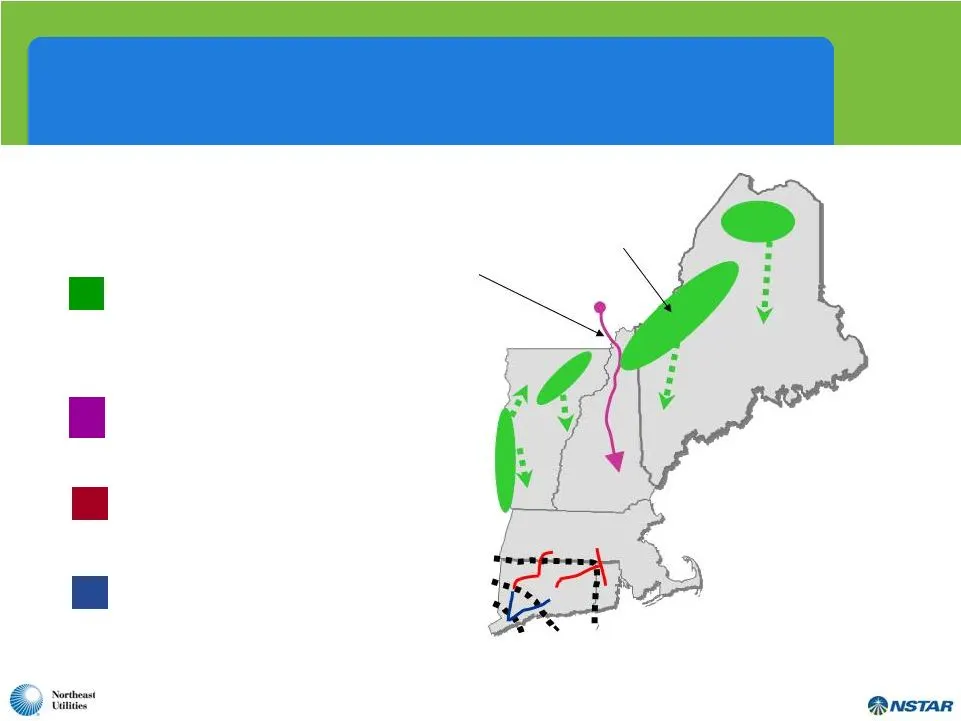
1 2 Transmission Business Strategy: Major Initiatives Expanding Across Wider New England Geography 3 4 Southwest Connecticut Reliability: Projects Complete Connecticut Borders (MA, RI) : NEEWS Projects Under Way NPT HVDC Northern Pass Transmission (NPT) Line between Quebec and New Hampshire Renewabl
Slide 25: NEEWS Projects Advance Current Status Report
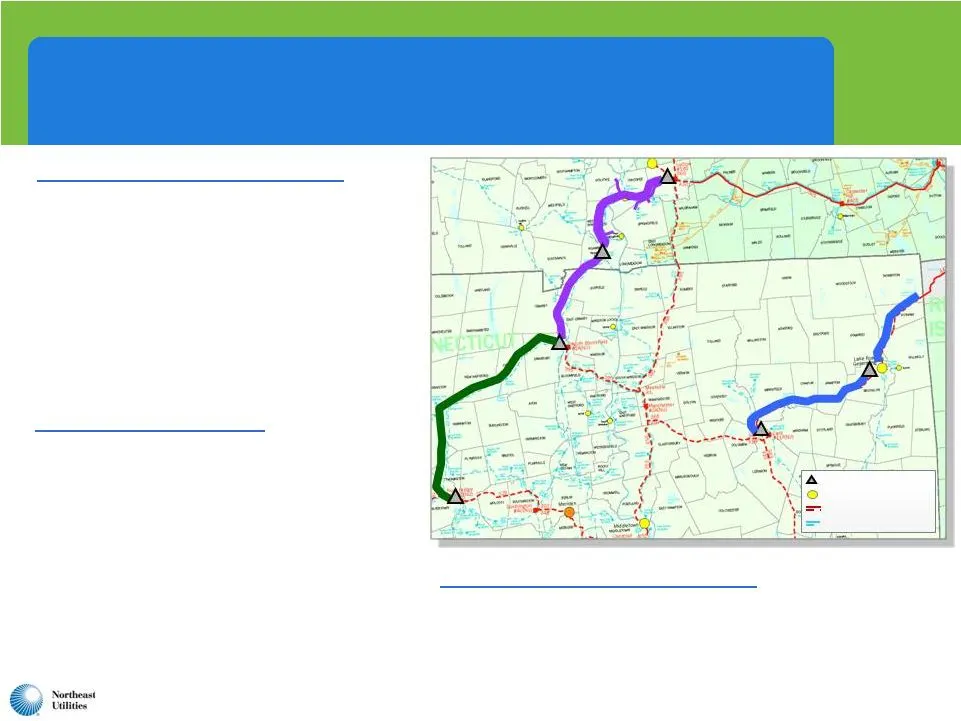
NEEWS Projects Advance Current Status Report Greater Springfield Reliability Project • Substation construction commenced in MA in Dec. 2010; in CT in July/August 2011 • Commenced overhead site work in MA in February 2011 • Commence overhead construction in CT in early 2012 following receipt of envir
Slide 26: Northern Pass Transmission – a $1.1 Billion Capital Investment
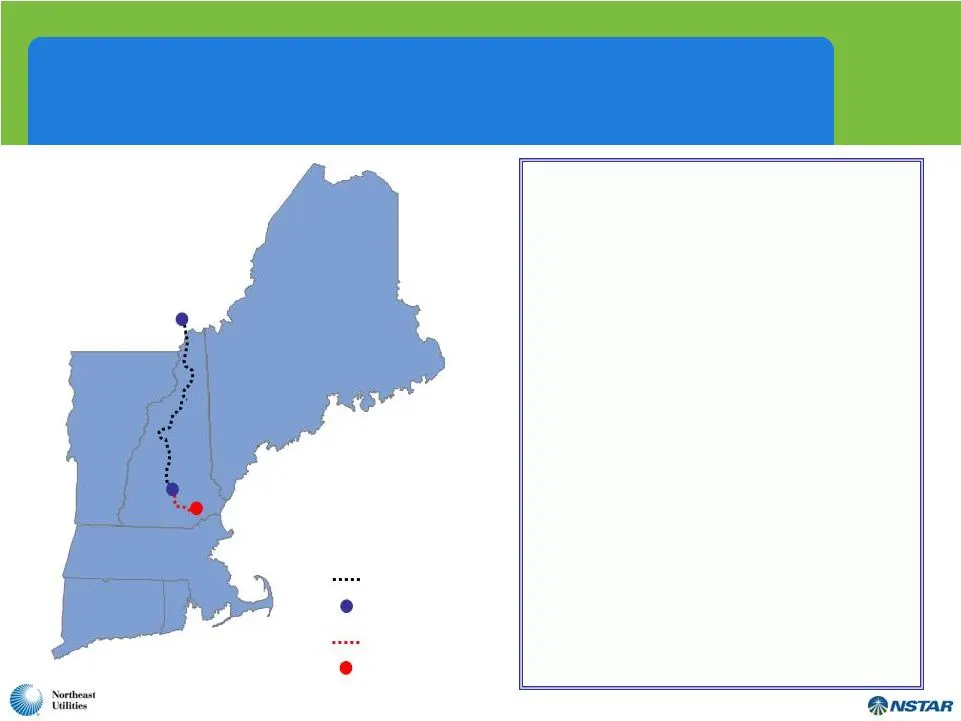
Northern Pass Transmission – a $1.1 Billion Capital Investment ´ • To be owned by Northern Pass Transmission LLC - NU (75%) and NSTAR (25%) • 1,200 MW transfer capability • Northern terminus at Des Cantons (Québec), southern terminus in Franklin (New Hampshire) • Québec terminal will convert the pow
Slide 27: Review of FERC-Approved Transmission ROEs
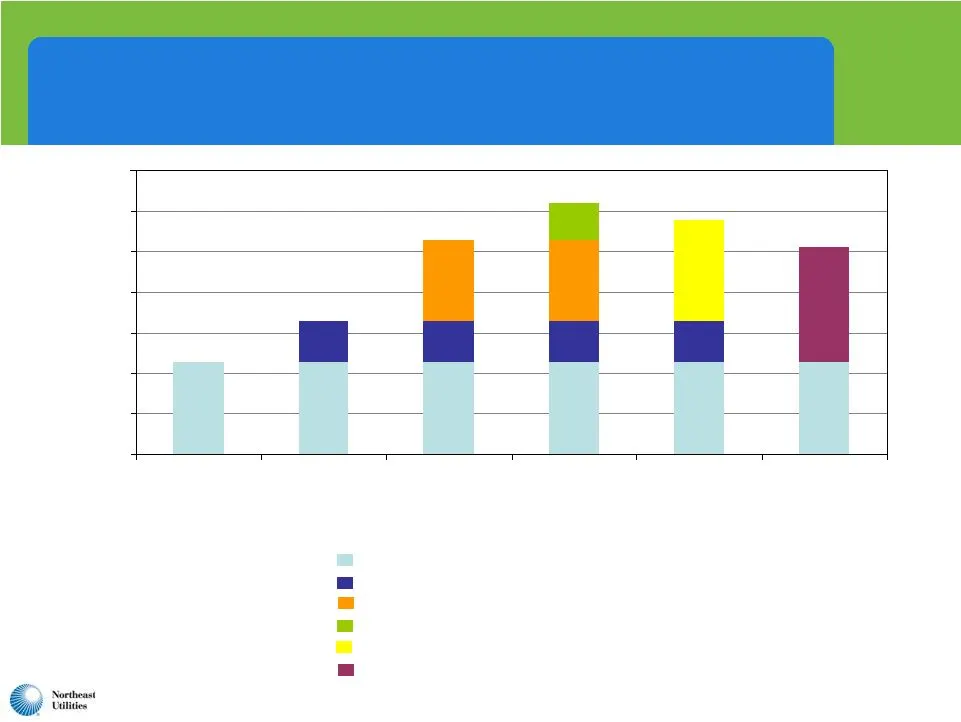
Review of FERC-Approved Transmission ROEs 10.00% 10.50% 11.00% 11.50% 12.00% 12.50% 13.00% 13.50% Local Network Service Regional Network Service Base 2005-2008 Regional Projects M-N Underground NEEWS Northern Pass NU’s Local Network Service Tariff ROE NE RTO Incentive adder of 50 basis points on PTF

Slide 28: Regulatory Update
Regulatory Update
Slide 29: Improved Results Due In Part to Resolution of All Three Electric Distribution Rate Cases
Improved Results Due In Part to Resolution of All Three Electric Distribution Rate Cases • Five-year settlement approved by NHPUC on 6/28/2010 • $45.5 million increase on 7/1/10 in addition to 8/1/09 temporary increase of $25.6 million • $2.3 million decrease on 7/1/11 • 2012 & 2013 projected increa
Slide 30: Yankee Gas Rate Decision Less Supportive
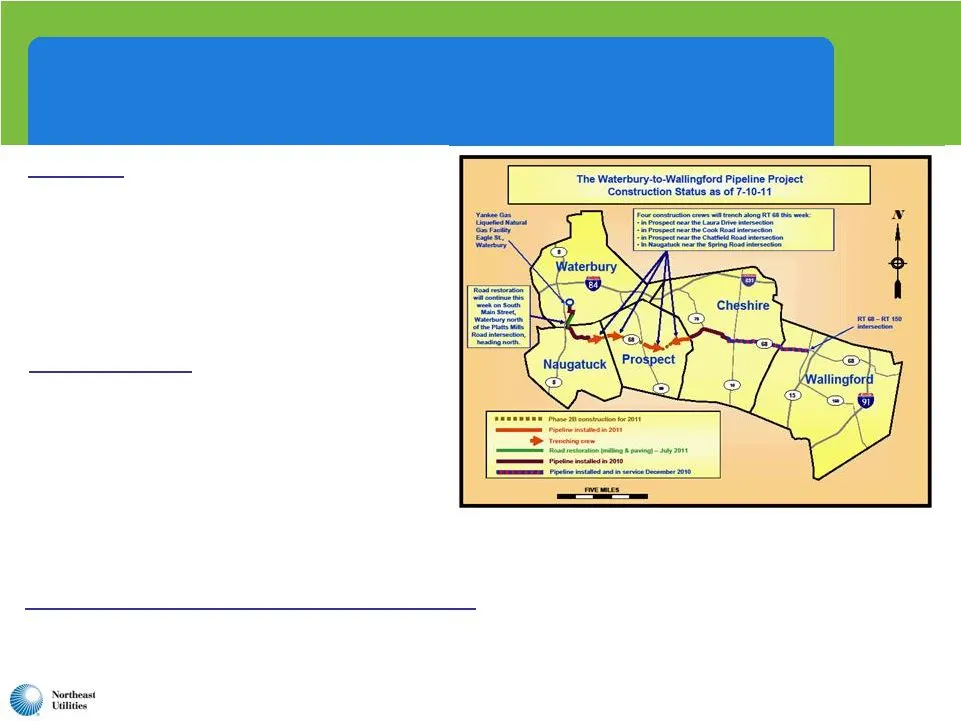
Yankee Gas Rate Decision Less Supportive The Good • Supported full projected cost of Waterbury to Wallingford line • Supported ramp-up to $40 million annual spending for pipeline replacement • Authorized capital structure of 52.2% equity; 47.8% debt The Not So Good • 8.83% authorized ROE • First-yea
Slide 31: NSTAR Rate Cases
NSTAR Rate Cases • Effective January 1, 2006 to December 31, 2012 • Customers’ overall delivery rates flat • Annual inflation-adjusted distribution rate change offset by transition charge • Allowed ROE of 10.5% (8.5% to 12.5% band) • Recovery of Incremental Safety & Reliability Program Costs • Inclu

Slide 32: Appendix
Appendix
Slide 33: NU – Improved Earnings Have Resulted in Rising Dividends
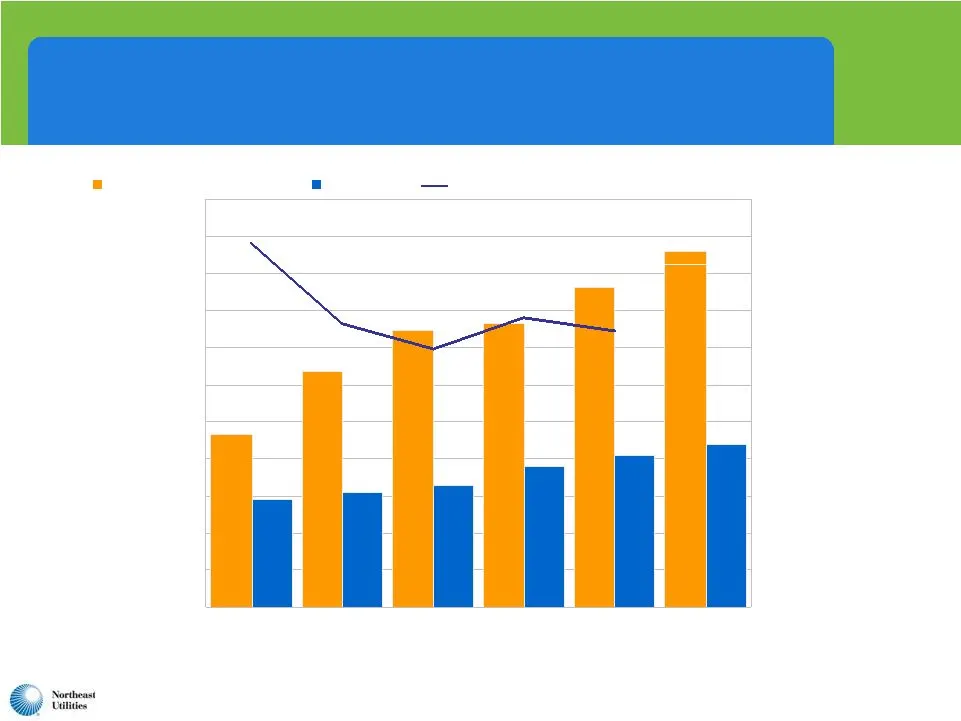
NU – Improved Earnings Have Resulted in Rising Dividends $0.825 $0.775 $0.725 $0.95 $1.025 $1.10 5 $0.00 $0.25 $0.50 $0.75 $1.00 $1.25 $1.50 $1.75 $2.00 $2.25 $2.50 $2.75 2011E 0.0% 10.0% 20.0% 30.0% 40.0% 50.0% 60.0% 70.0% 62.5% 48.7% 44.3% 49.7% $2.16 $1.86 $1.16 $1.59 Payout ratios EPS Dividends
Slide 34: 2006 – 2011 NU Consolidating EPS GAAP / Non-GAAP Reconciliation
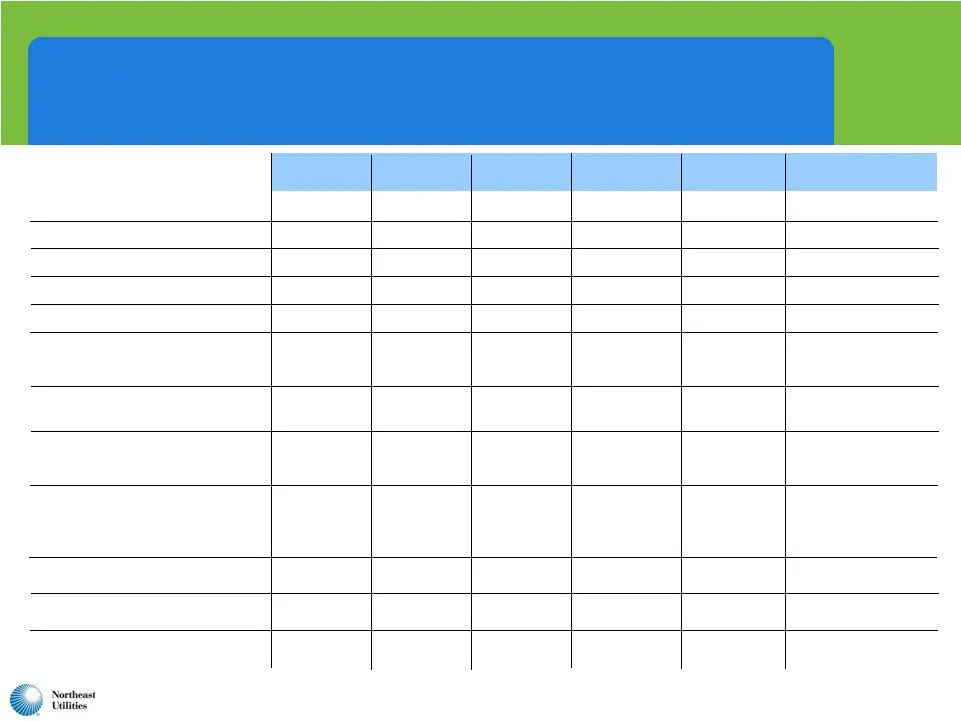
2006 – 2011 NU Consolidating EPS GAAP / Non-GAAP Reconciliation 2006 Actual 2007 Actual 2008 Actual 2009 Actual 2010 Actual 2011 Guidance Distribution/Generation $0.80 $0.94 $0.96 $0.92 $1.16 $1.30 – $1.35 Transmission 0.39 0.53 0.89 0.95 1.00 1.05 – 1.10 Total Regulated 1.19 1.47 1.85 1.87 2.16 2.3
Slide 35: NSTAR…20 Consecutive Years of Operating Earnings Growth
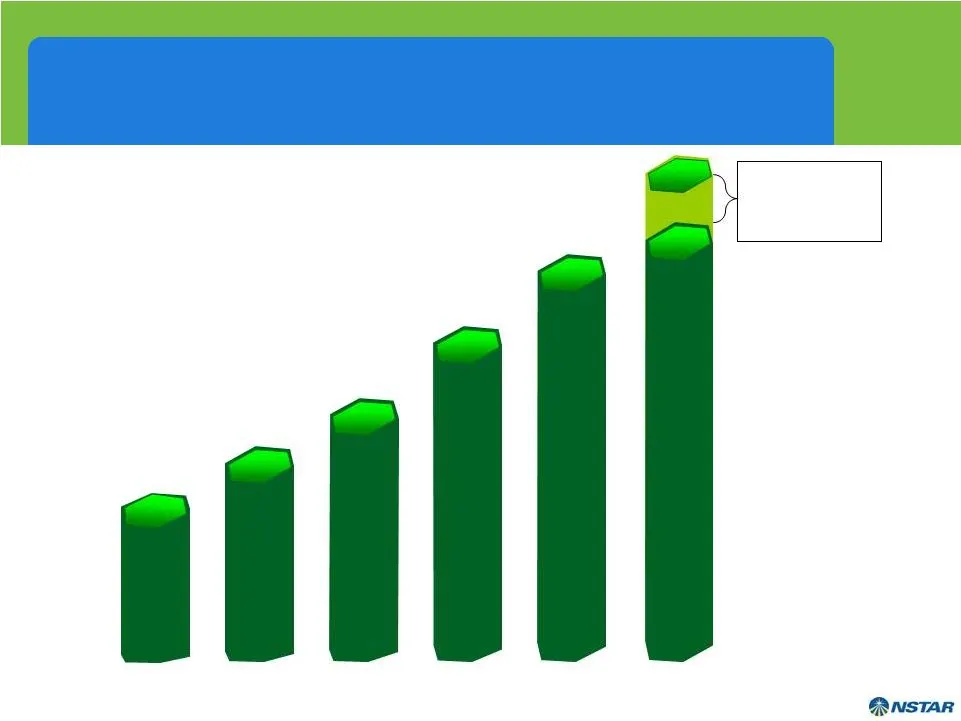
NSTAR…20 Consecutive Years of Operating Earnings Growth $2.37 $2.07 $2.22 $2.56 $2.60 - $2.75 Guidance $1.93
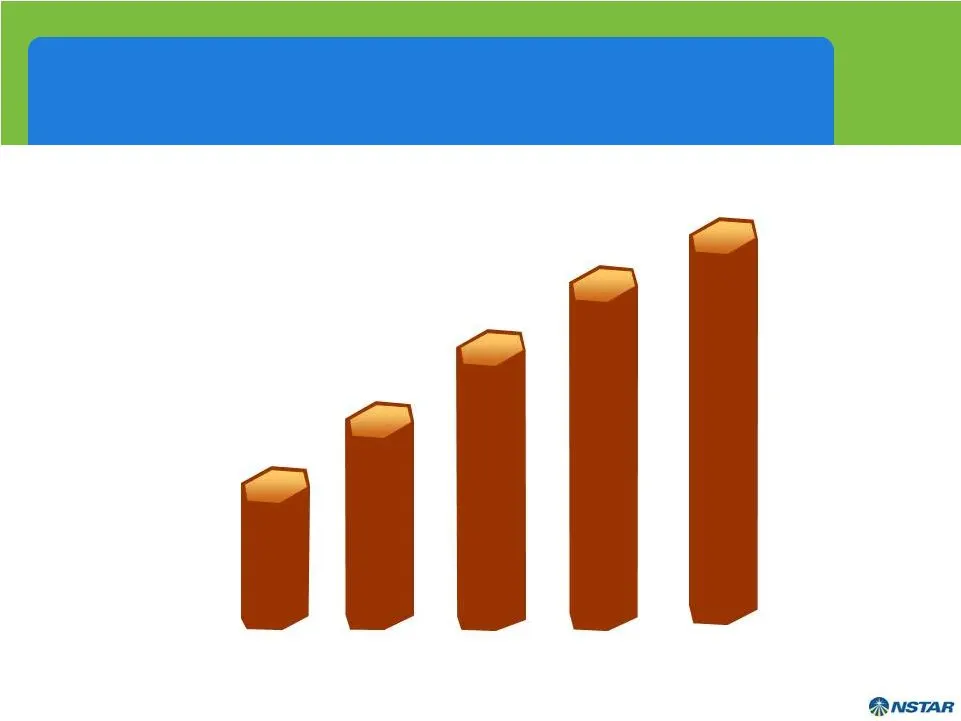
Slide 36: NSTAR – Consistent, Above Average Dividend Growth
NSTAR – Consistent, Above Average Dividend Growth …13 Consecutive Years of Increase… $1.30 $1.40 $1.50 $1.60 $1.70
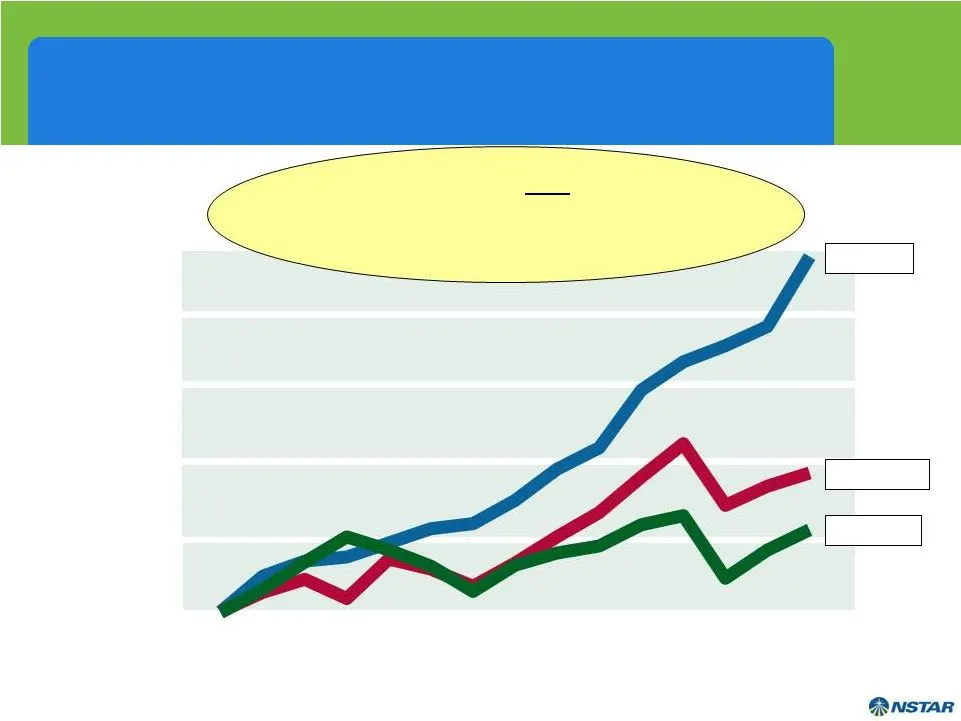
Slide 37: NSTAR Total Shareholder Return Outperforms the Industry
NSTAR Total Shareholder Return Outperforms the Industry Only Company in Any Industry to Deliver 14 Consecutive Years of Positive Total Shareholder Return $1,000 $2,000 $3,000 $4,000 $5,000 $6,000 S&P 500 Utility Index NSTAR
Source: SEC EDGAR · 425 filed Aug 10, 2011
More decks from Nstar
 Merger or Acquisition (February 2012)38 slides · Feb 29, 2012
 EEI Financial Conference 201151 slides · Nov 7, 2011
 EEI Financial Conference 201149 slides · Nov 7, 2011
 Barclays CEO Energy-Power Conference 201132 slides · Sep 8, 2011
 Deutsche Bank Conference (May 2011)24 slides · May 11, 2011
 Merger or Acquisition (March 2011)44 slides · Mar 10, 2011