Nstar — Deutsche Bank Conference (May 2011)
24 slides from Nstar's conference presentation, May 11, 2011

Slide 1: Filed by Northeast Utilities Pursuant to Rule 425
Filed by Northeast Utilities Pursuant to Rule 425 Under the Securities Act of 1933 Subject Company: NSTAR Commission File No.: 333-170754

Slide 2: Deutsche Bank Conference
Deutsche Bank Conference
Slide 3: Safe Harbor
Safe Harbor historical statements materially including capital changes NSTAR; only statement This income evaluate factors financial 2GAAP performance. as expenditures; presentation financial that of or in earnings and measure. facts. their is the loss from through are accounting affected made Provis
Slide 4: Safe Harbor and Additional Information
Safe Information In project, relating statements factors conditions consummate to of other Northeast looking Additional This and prospectus investors copies website “Investor 3Please realize addition future Northeast NSTAR, Harbor communication risks of refer could intend, to at (www.nu.com) stateme
Slide 5: Topics
4•Topics First quarter Capital NU-NSTAR forinvestment Today results mergerupdate and status 2011 outlook
Slide 6: Strong First Quarter Earnings
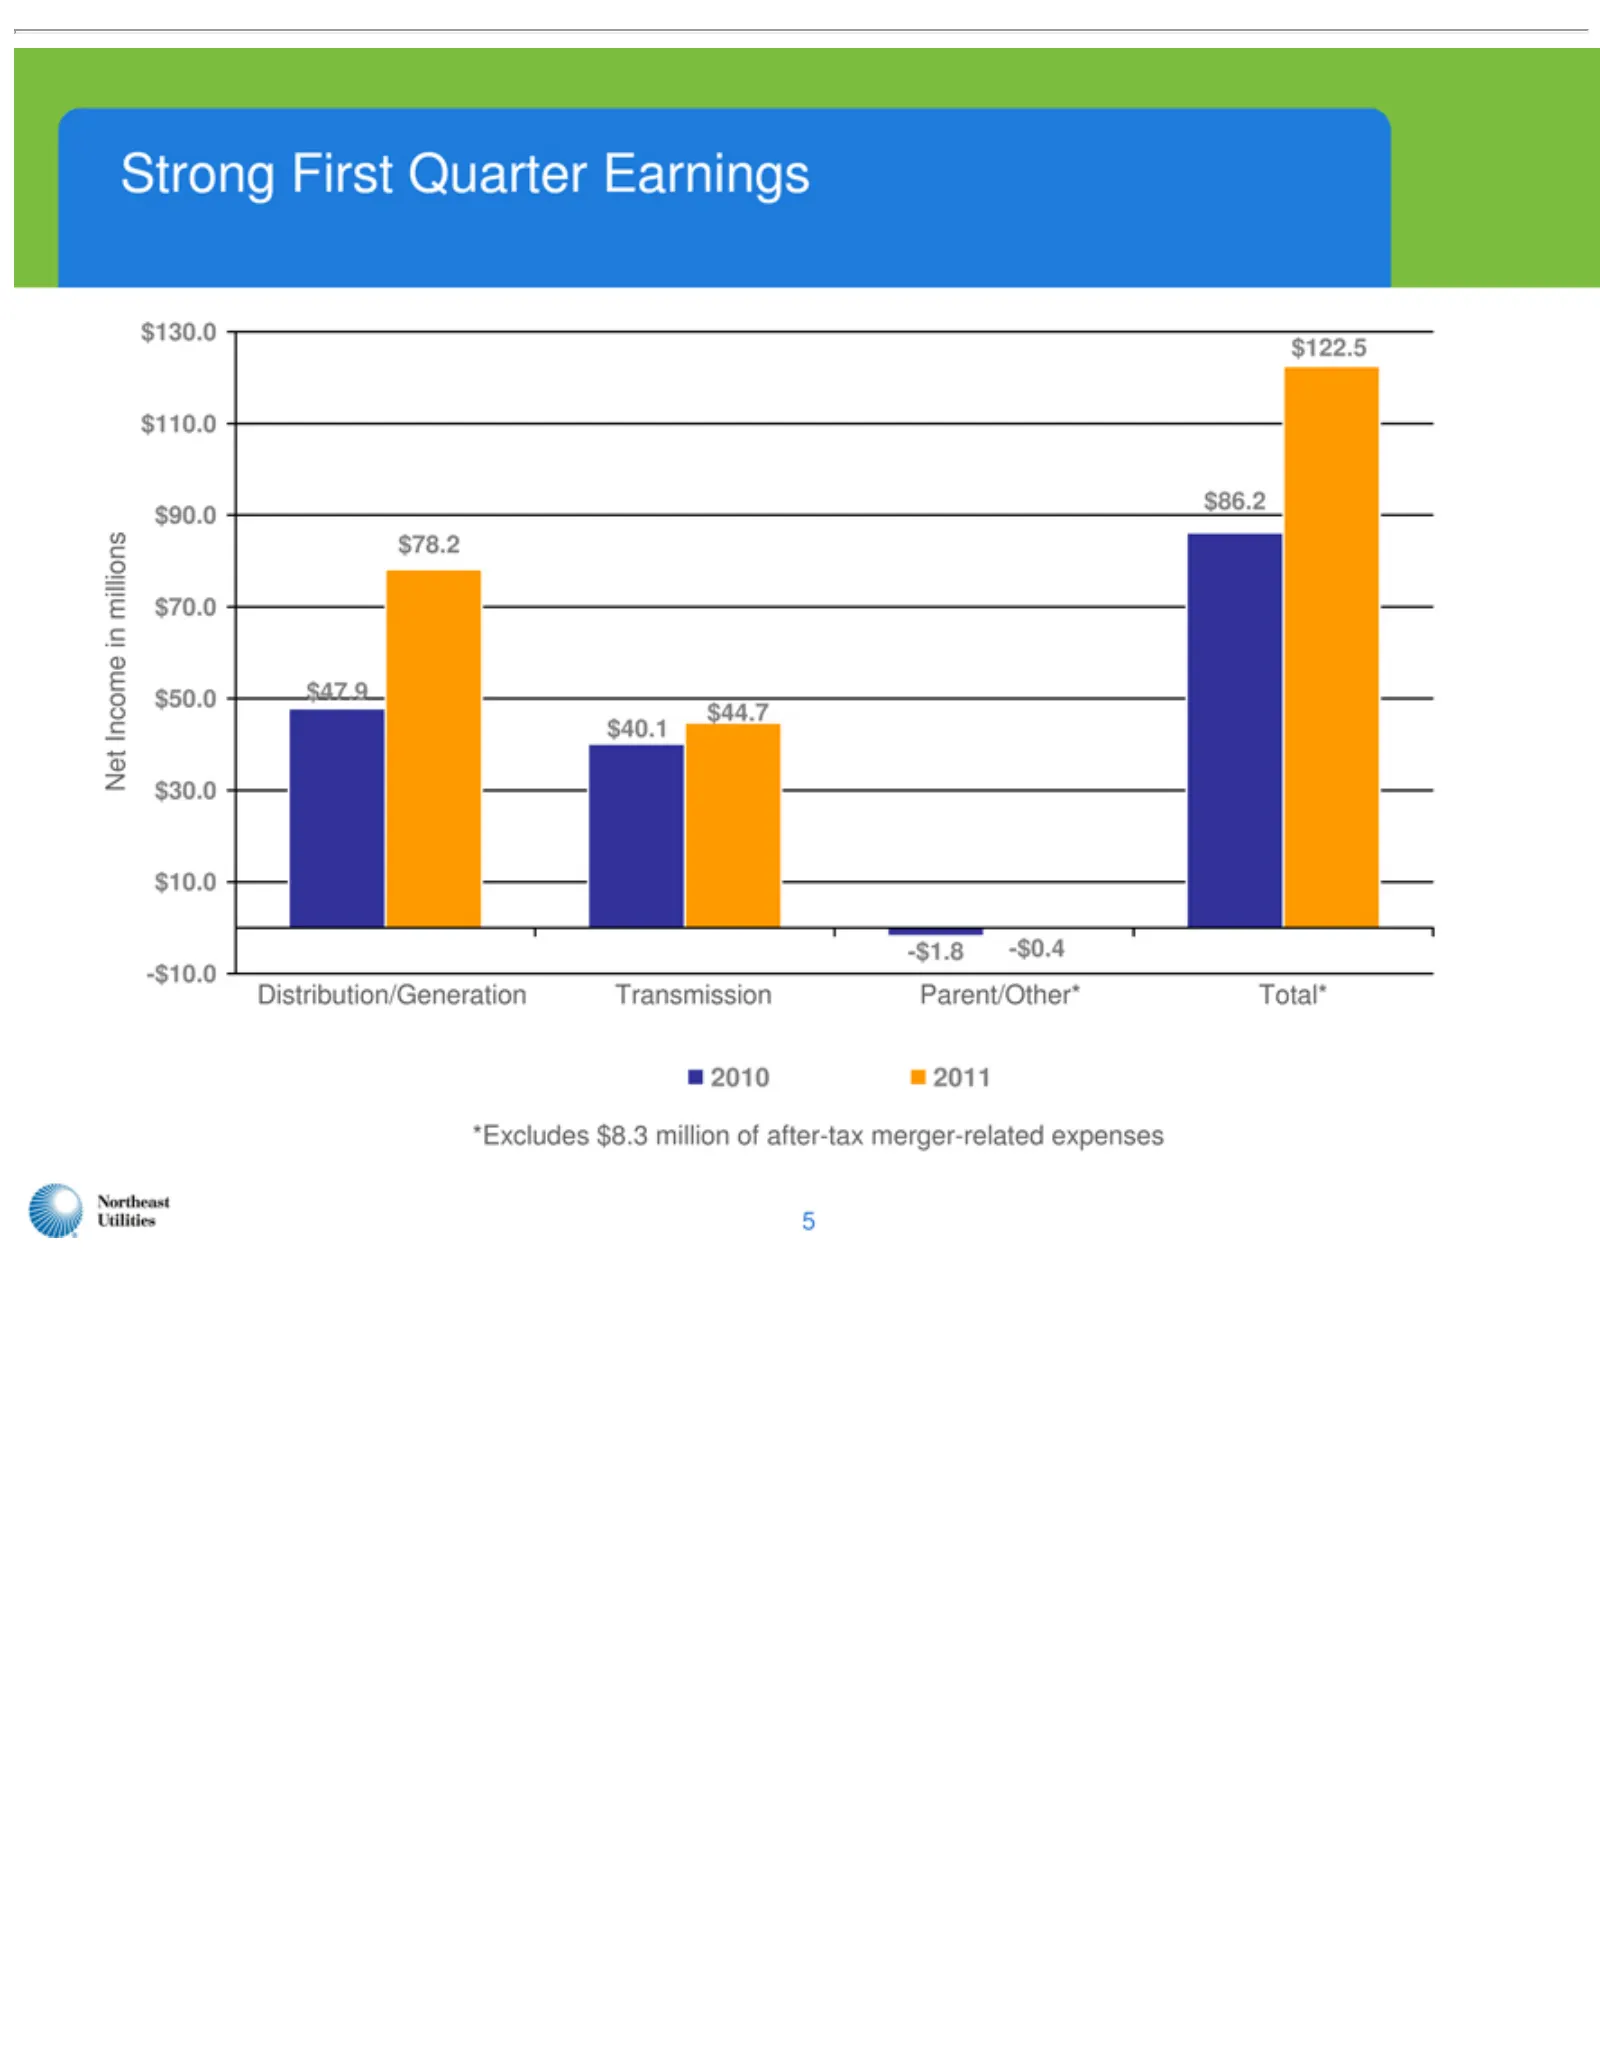
5Transmission Strong Net $130.0 -$1.8 $122.5 $86.2 $44.7 $40.1 $78.2 $47.9 -$10.0 *Excludes 2011 2010 Total* Parent/Other* Distribution/Generation Income -$0.4 First $110.0 $8.3 in Quarter $90.0 millions million Earnings $70.0 of after-tax $50.0 $30.0 merger-related $10.0 expenses
Slide 7: 2011 EPS Guidance and Actual Results
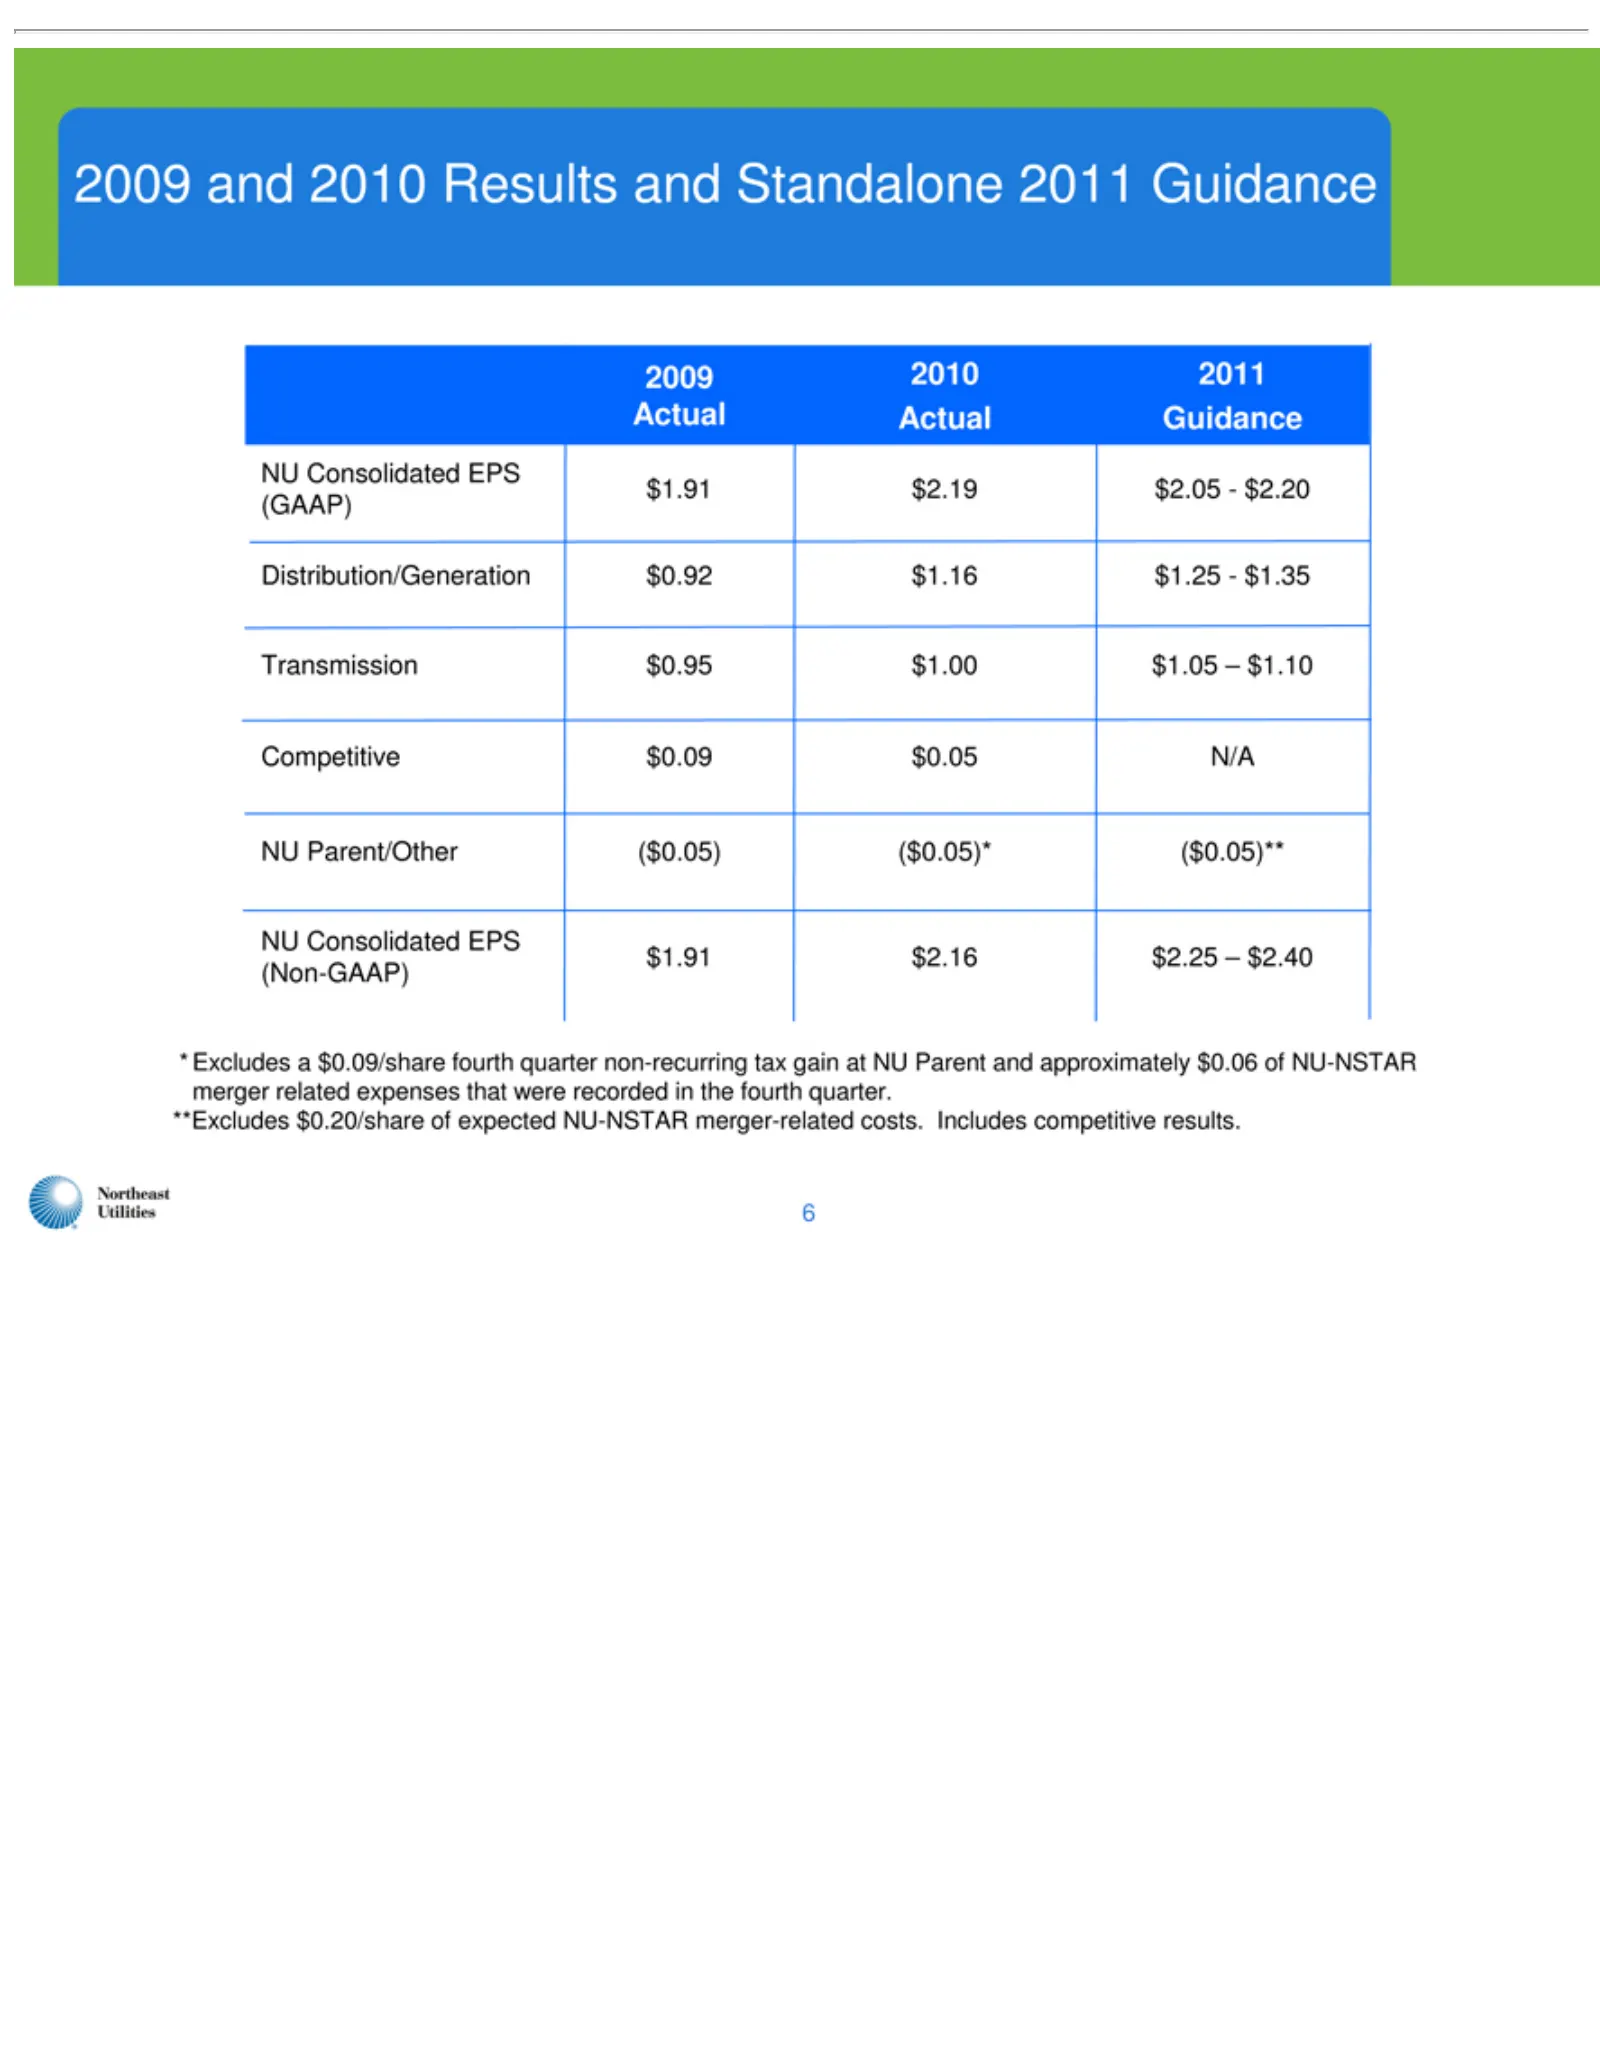
2009 $1.91 Distribution/Generation Transmission Competitive *NU 6**Excludes Excludes Parent/Other Consolidated Actual and $2.19 2010 a$0.20/share $2.05– 2010 $0.09 $0.09/share $0.95 Results ($0.05) EPS Actual $0.05 $2.20 $1.00 (GAAP) (Non-GAAP) and of $0.92 N/A ($0.05)* 2011 fourth $1.05– expected S
Slide 8: Improved Earnings Have Resulted in Rising Dividends
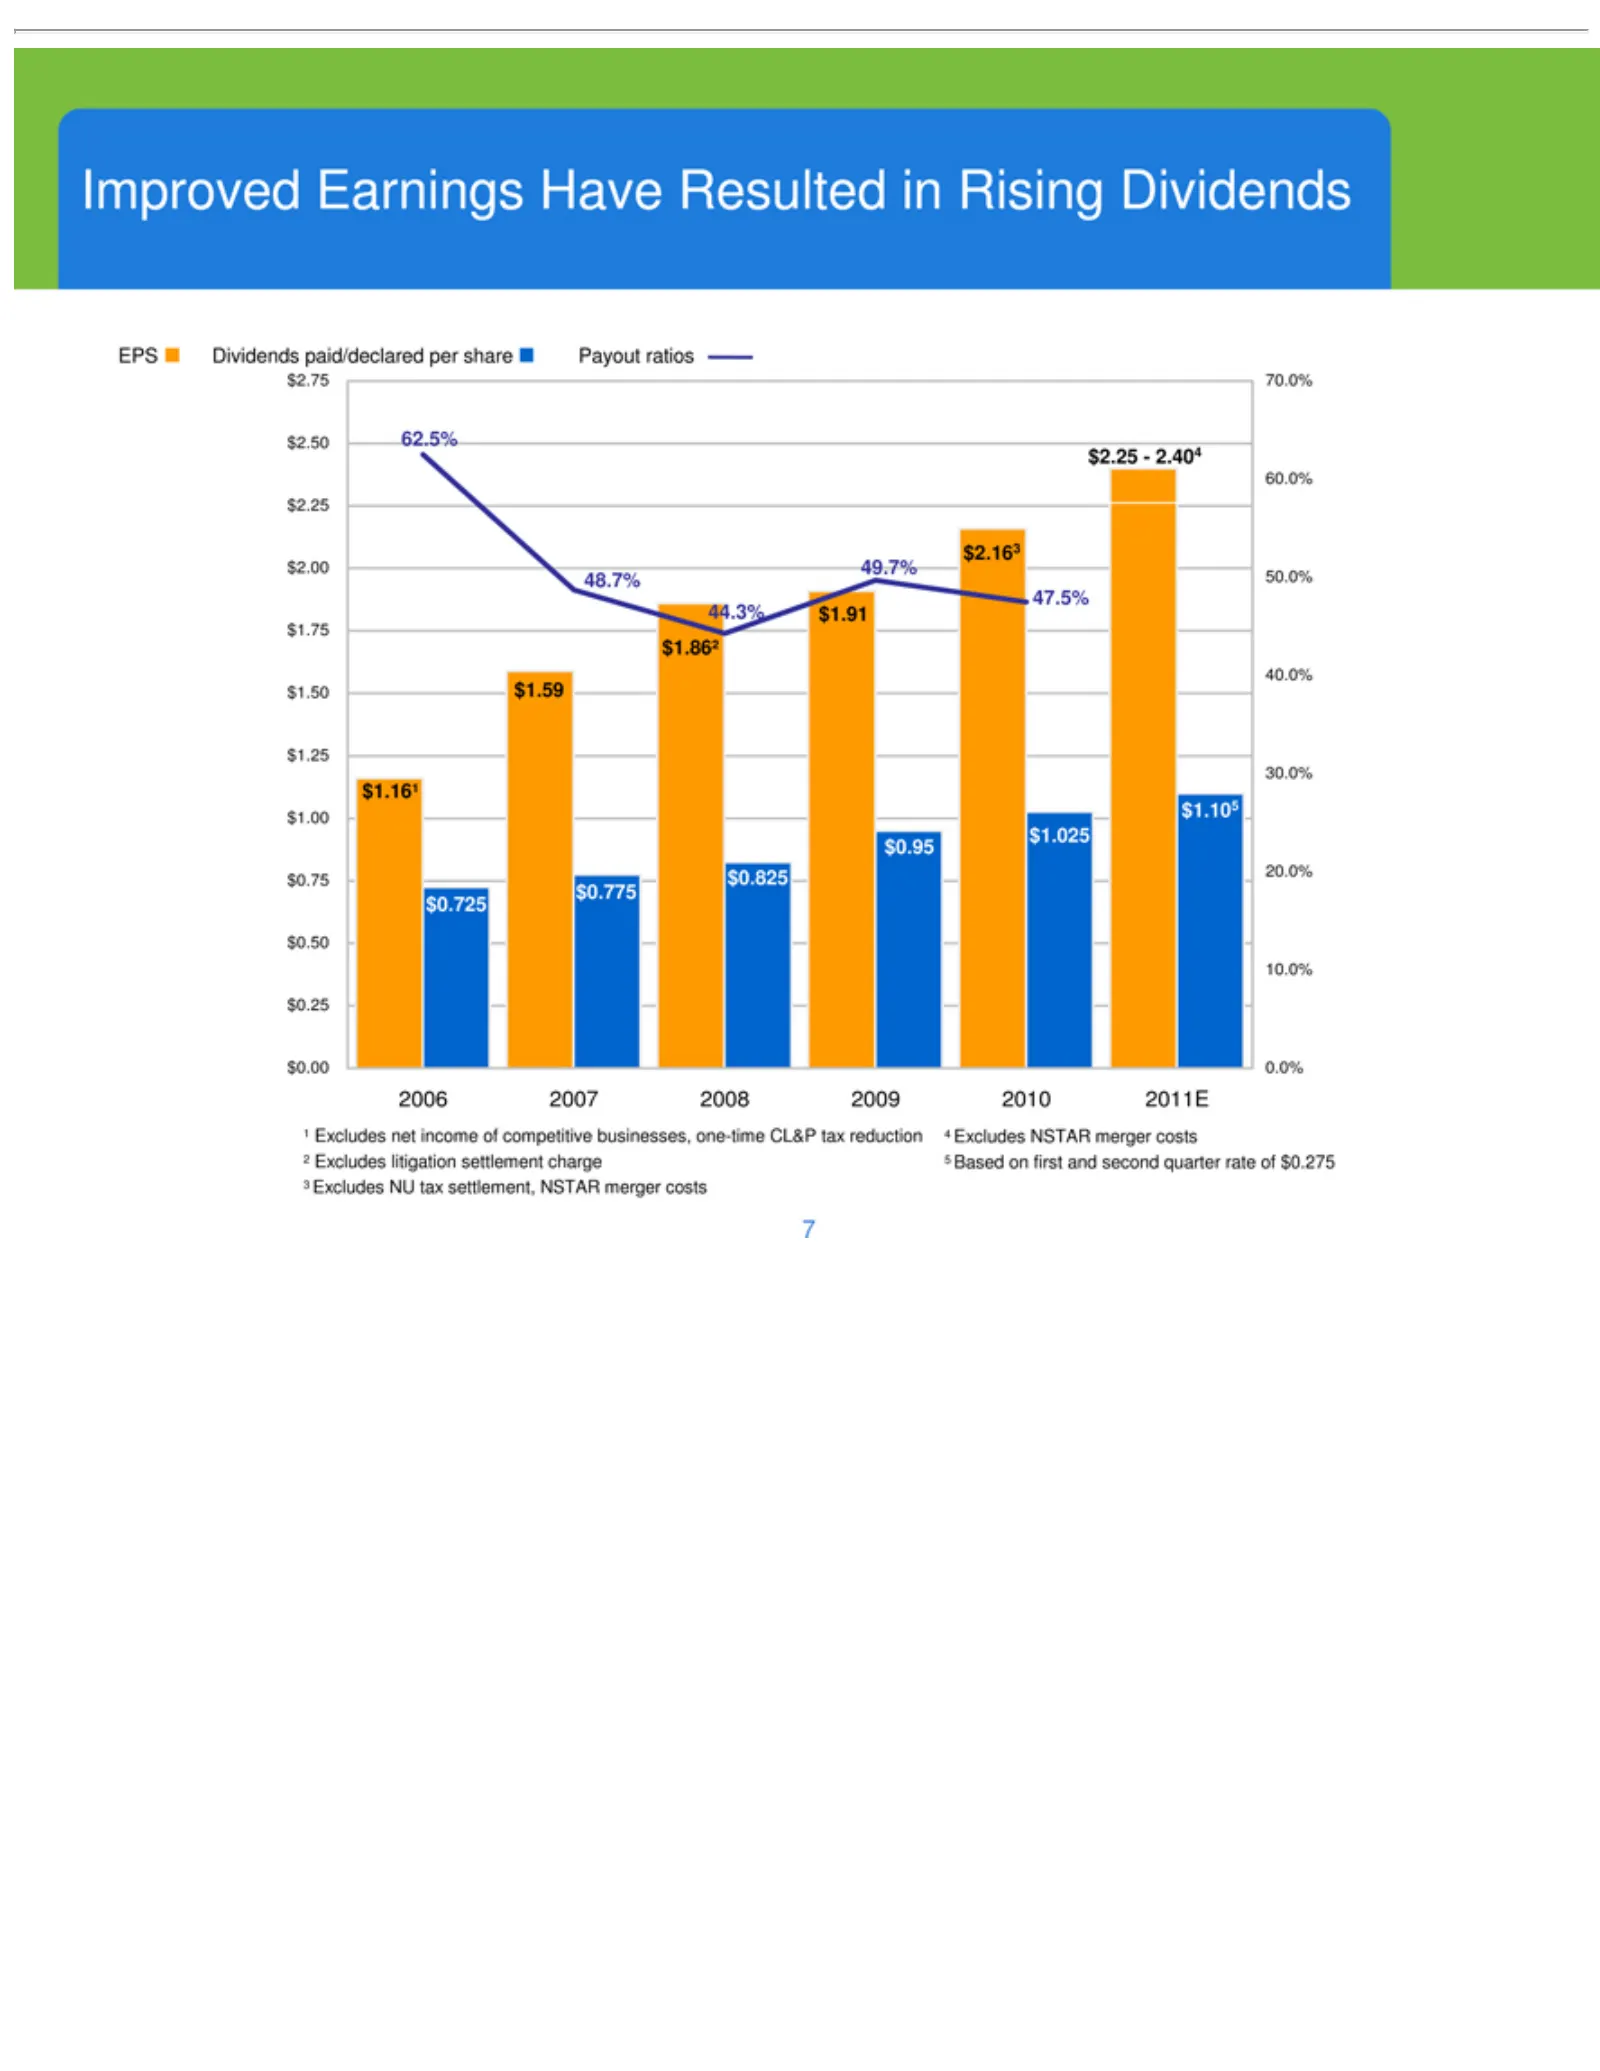
Improved EPS $2.75 2006 0.0% 10.0% 20.0% 30.0% 40.0% 50.0% 60.0% 70.0% $2.25—2.404 47.5% $2.163 49.7% $1.91 44.3% $1.86² 48.7% $1.59 62.5% 21$1.16¹ 7543 Dividends 2007 $2.50 Earnings 2008 $2.25 paid/declared Excludes Based 2009 on net $2.00 Have income 2010$1.75 litigation NU NSTAR first tax andResu
Slide 9: Capital Investment Update
Capital Investment Update
Slide 10: Transmission Business Strategy and Major Projects
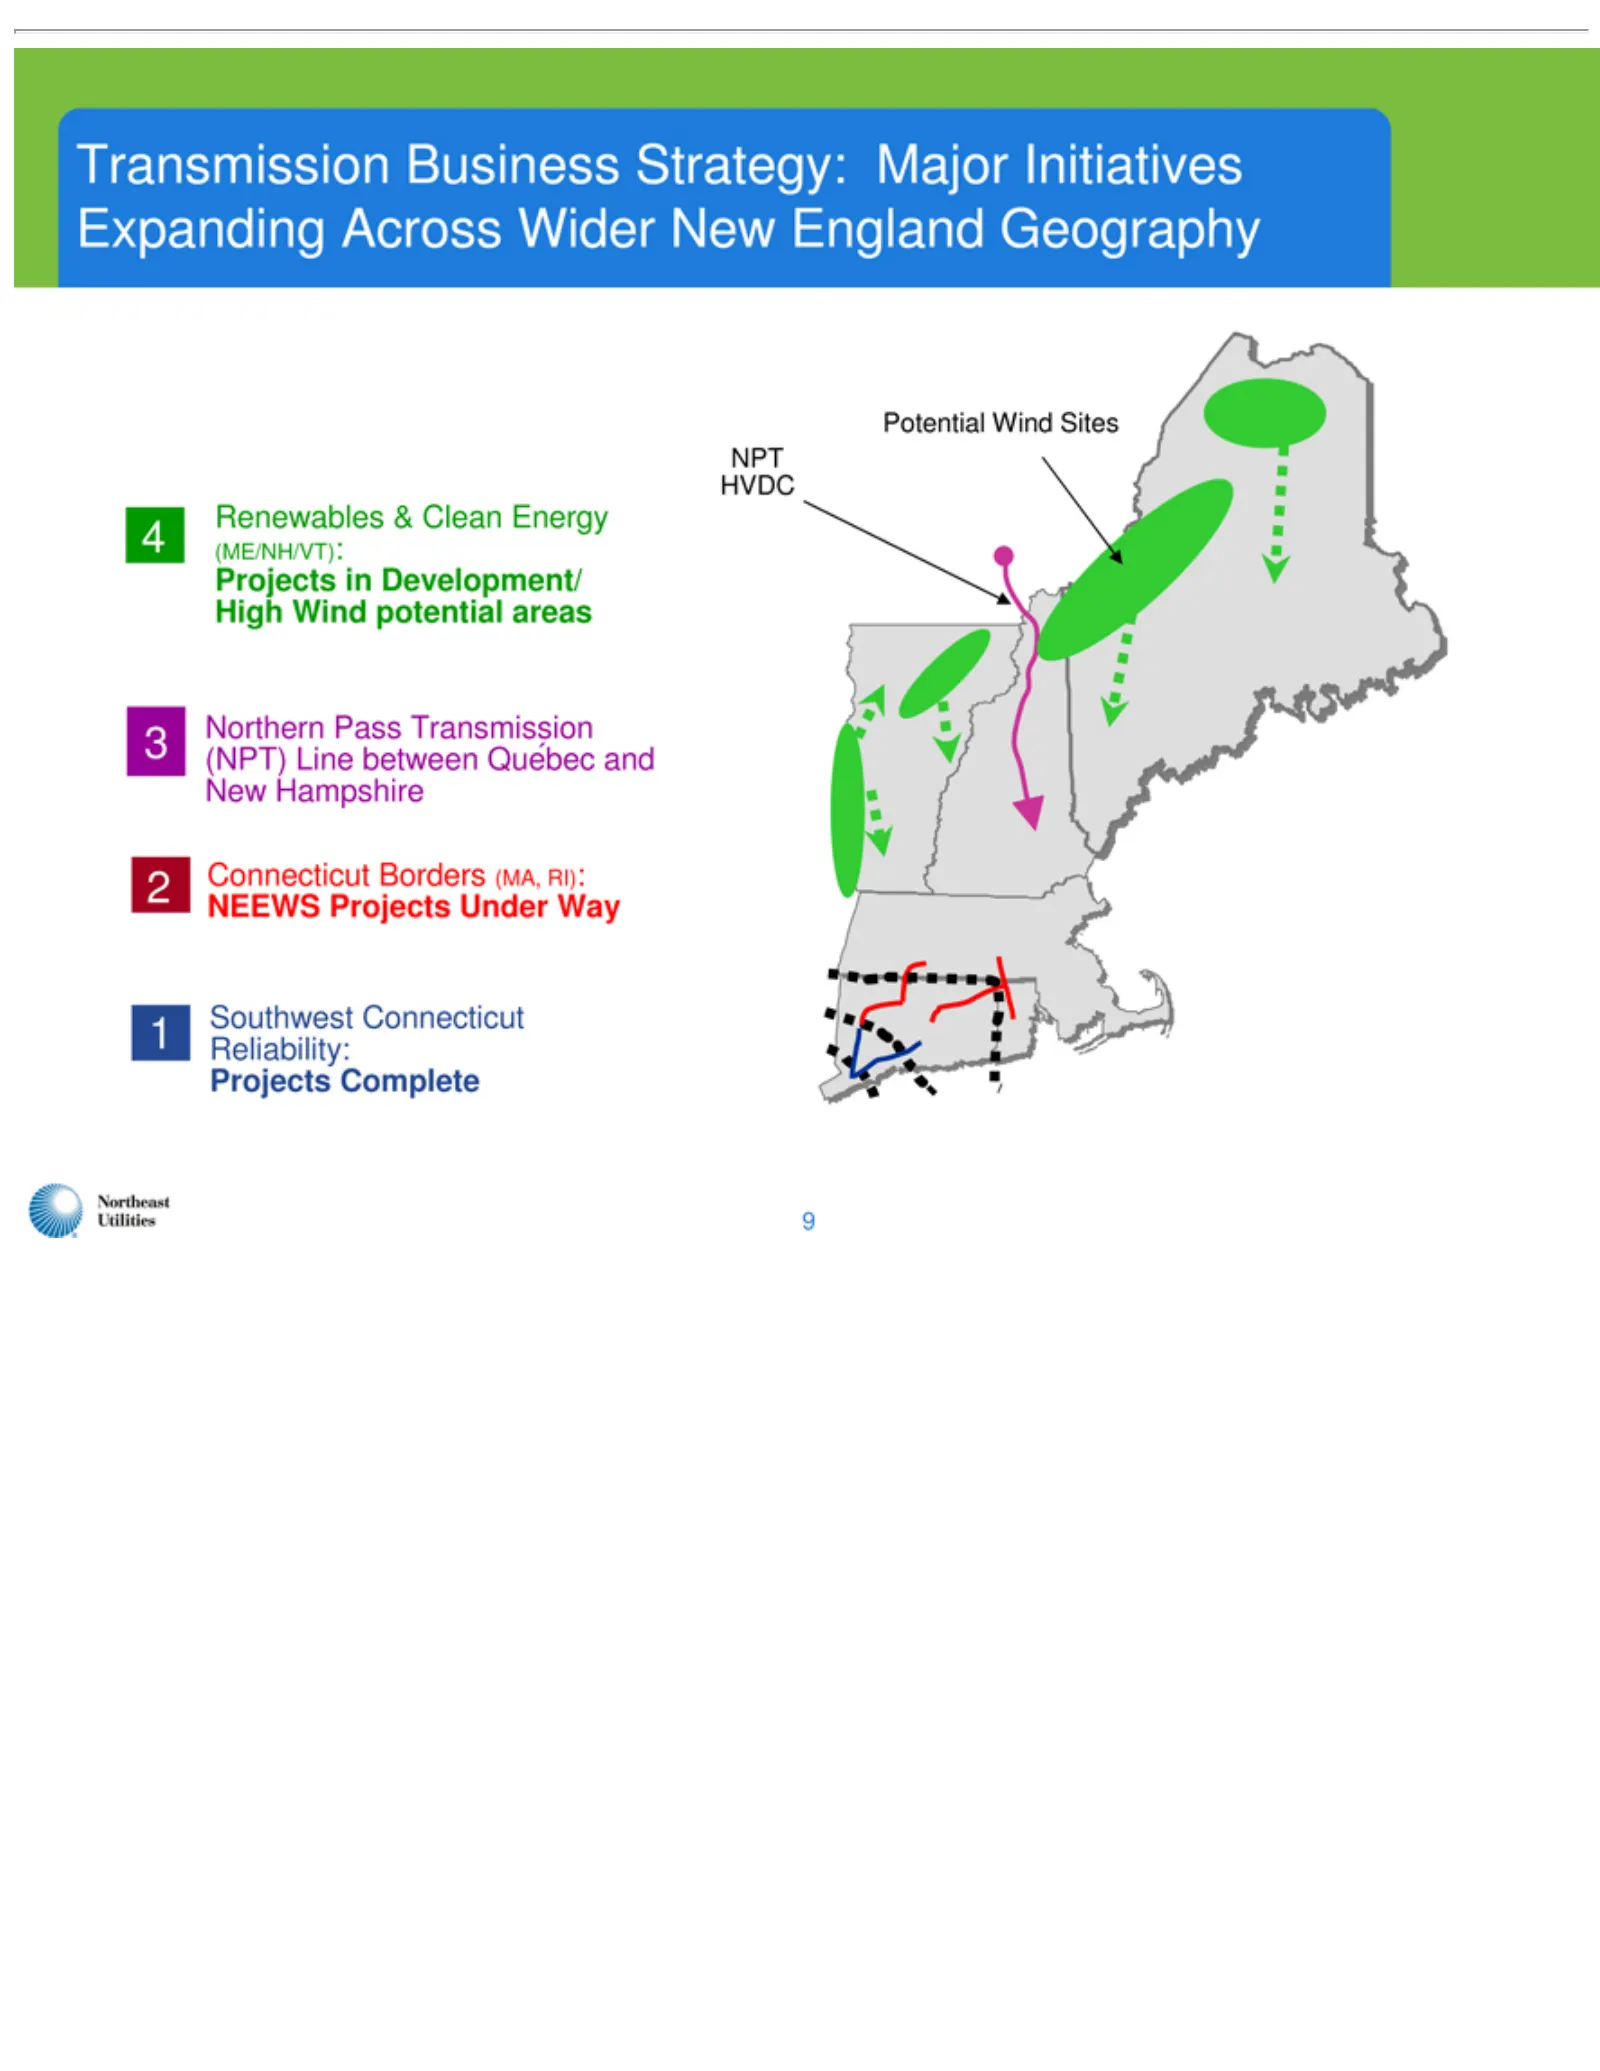
4Transmission 23(ME/NH/VT): 1NEEWS Projects NPT 9Potential Renewables Northern Connecticut Southwest HVDCin Complete Projects Wind Development/ Pass Connecticut Business & Borders Sites Transmission Clean Under(MA, Strategy: Energy Way Reliability: High RI): (NPT) Wind MajorLine potential Initiative
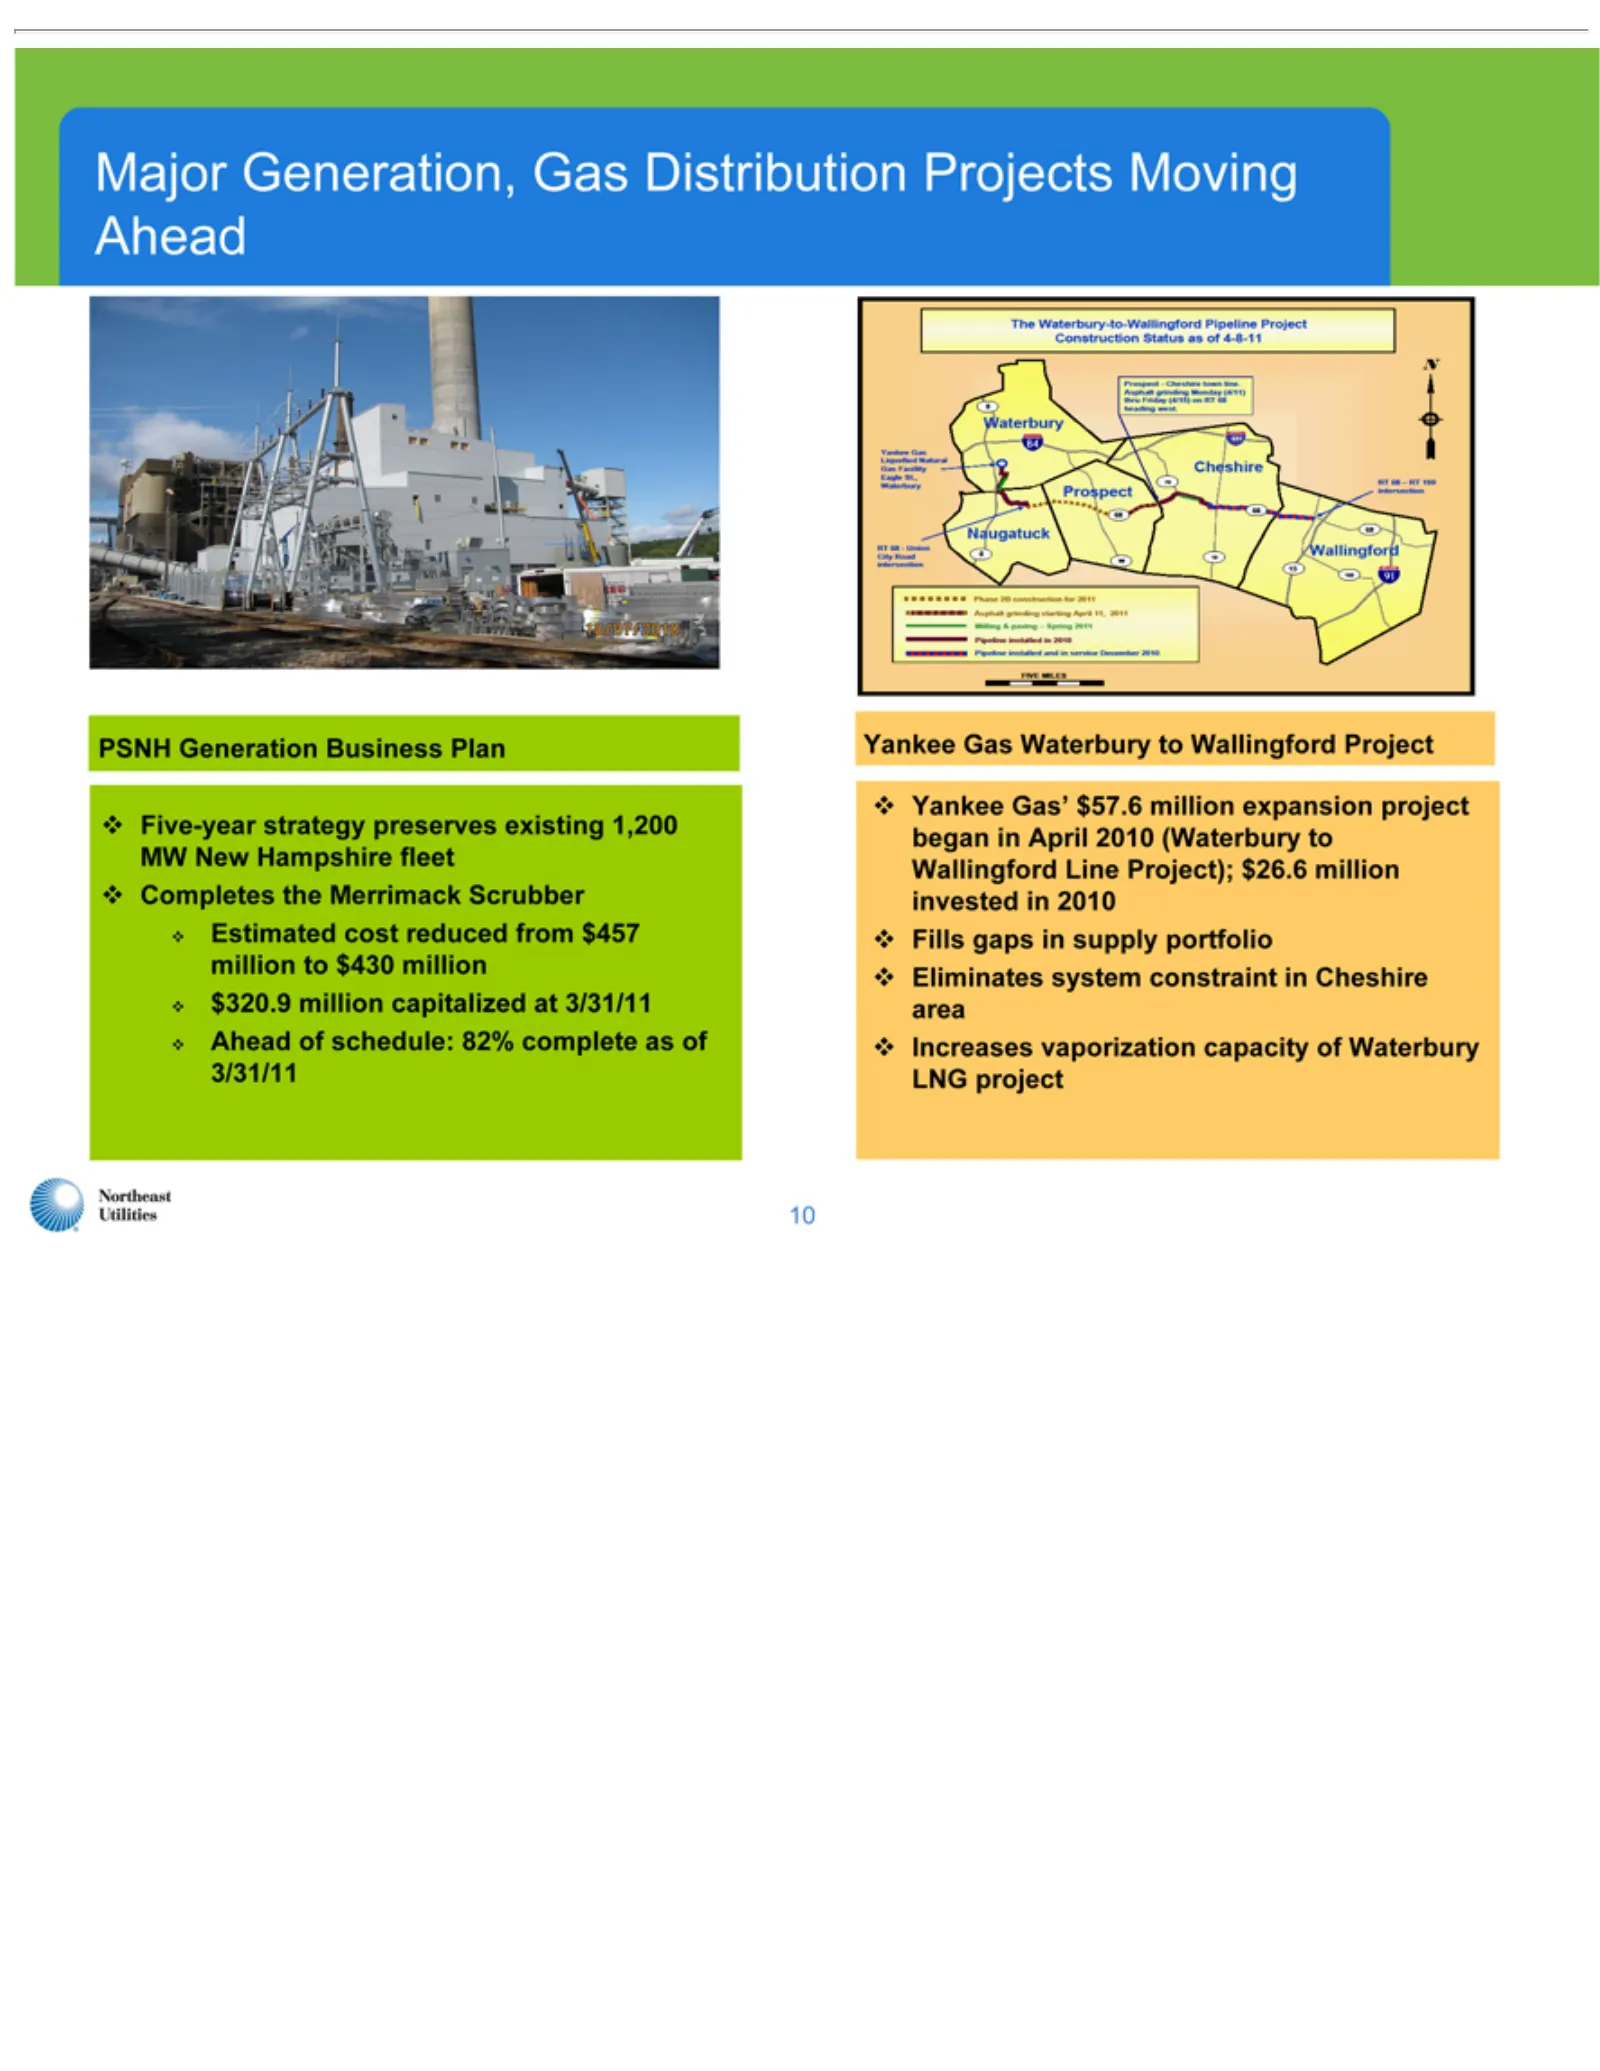
Slide 11: Major Projects Moving Ahead
Major PSNH _Yankee 10 Ahead Yankee Five-year Completes Estimated $320.9 Fills Eliminates Increases Generation, gaps Generation Gas of million Gas’ schedule: vaporization strategy in Waterbury cost system the supply $57.6 Merrimack reduced capitalized Business Gas preserves constraint million 82% por
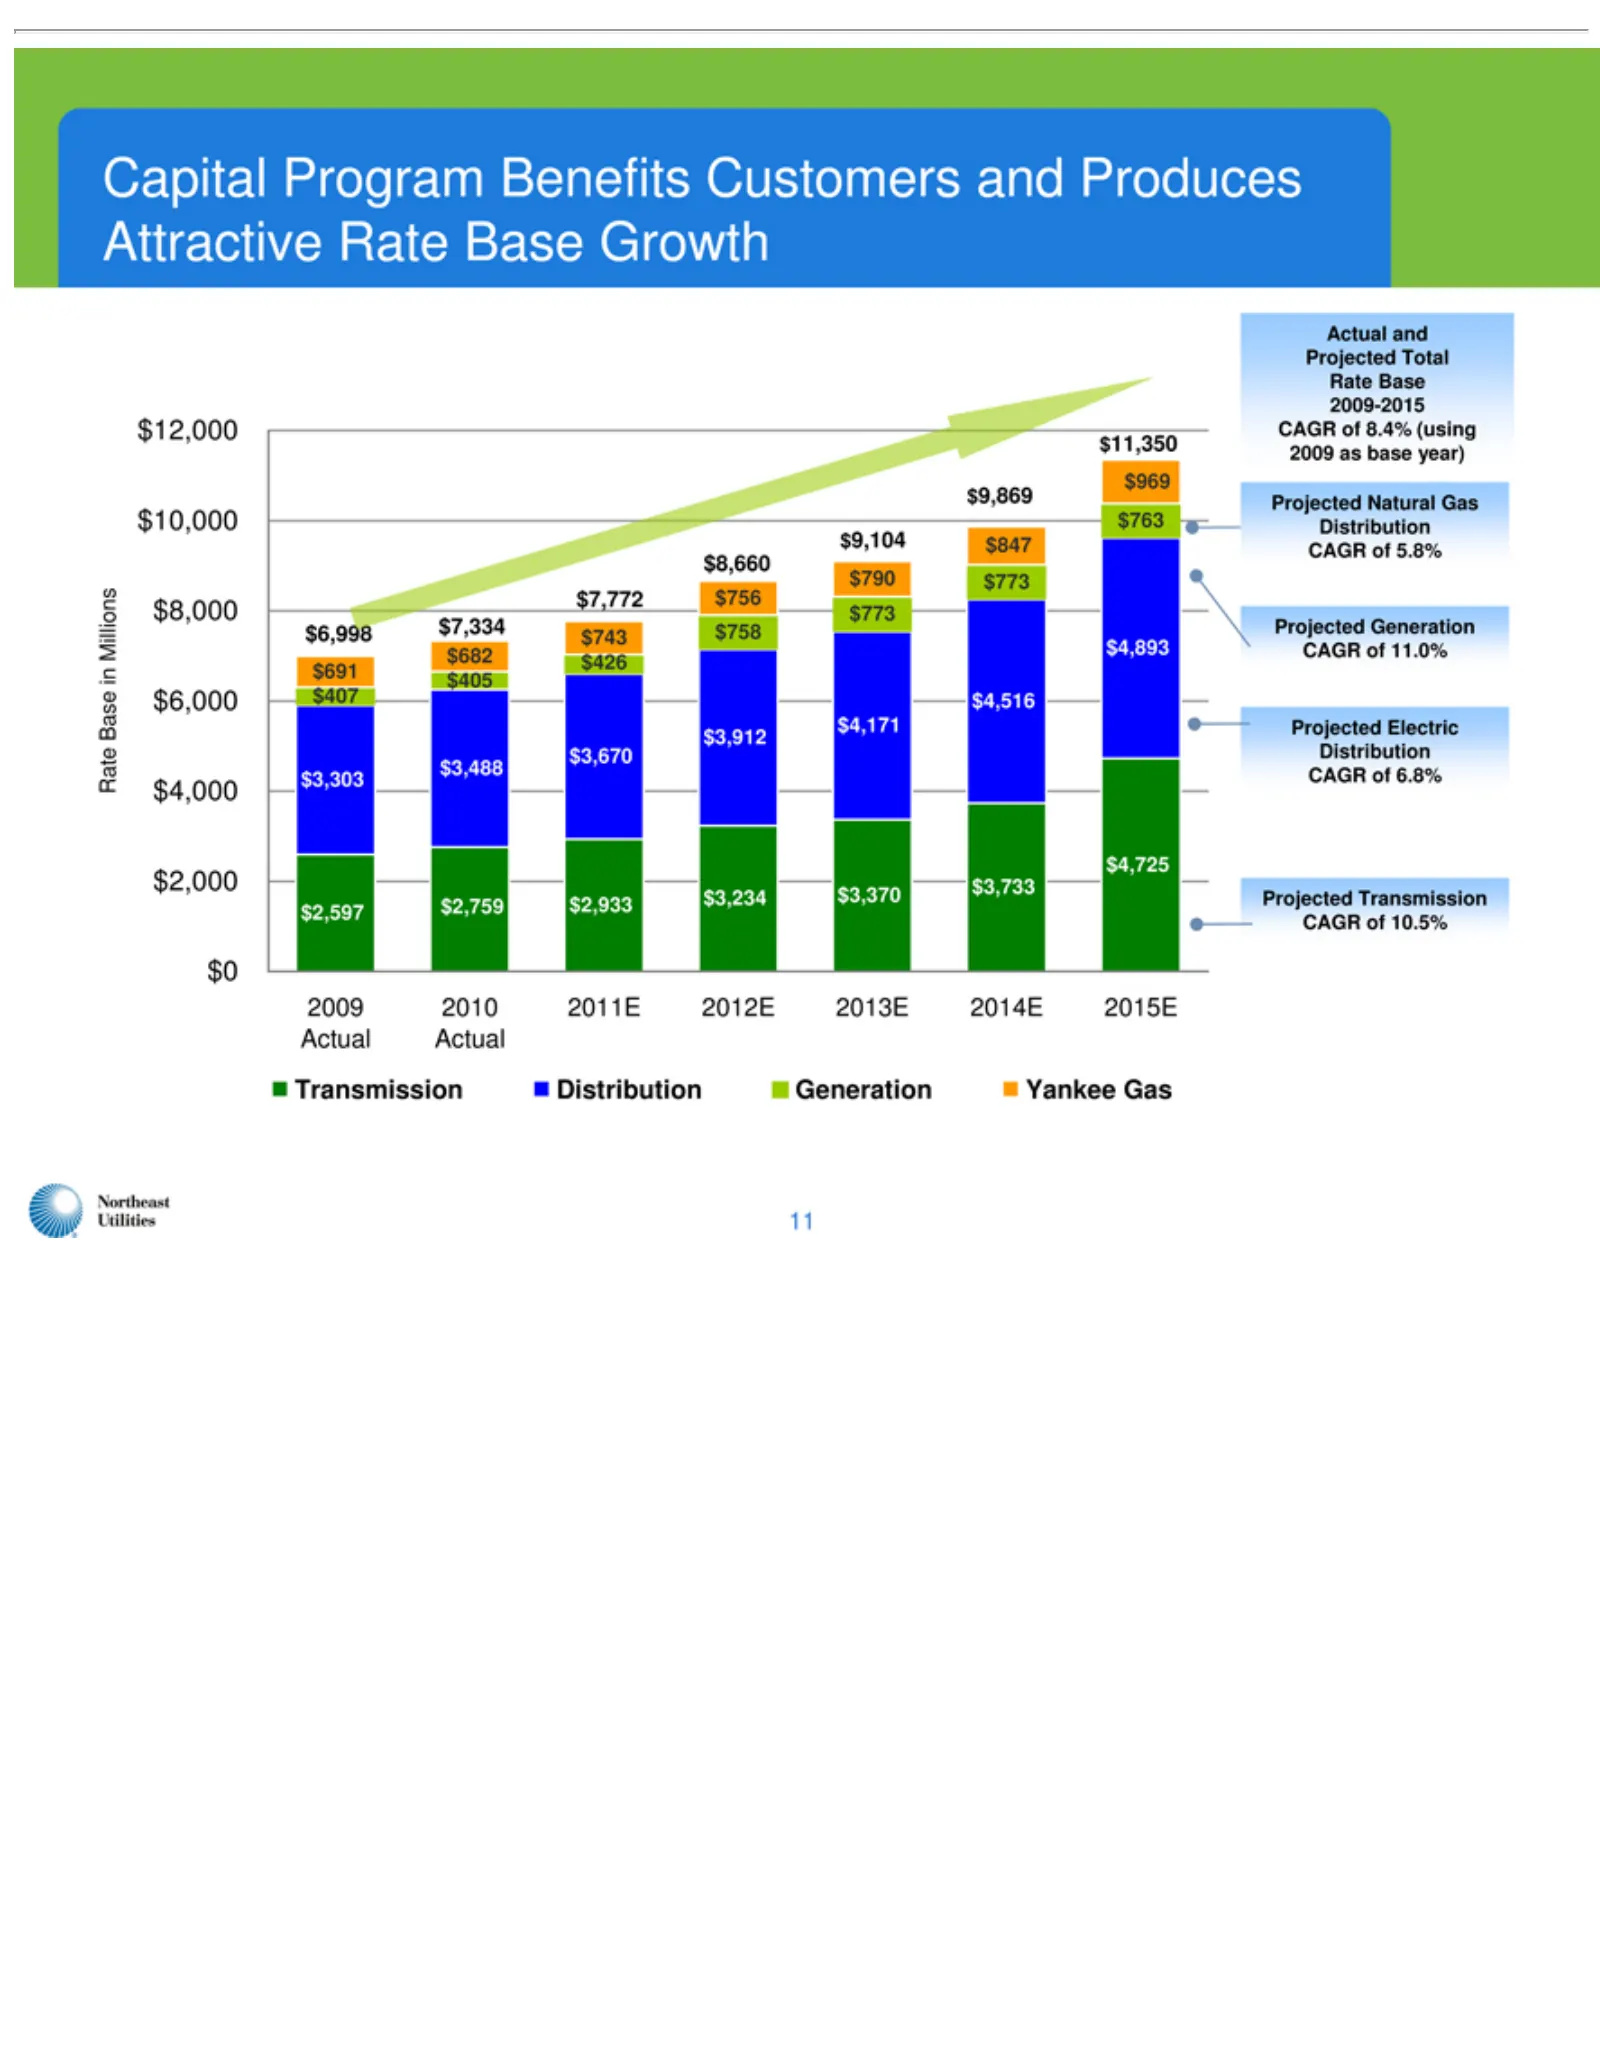
Slide 12: Capital Program and Rate Base Growth
Capital Rate $12,000 $6,998 $7,334 $2,597 $3,303 $7,772 $2,759 $3,488 $8,660 $2,933 $3,670 $9,104 $3,234 $3,912 $847 $9,869 $3,370 $4,171 $11,350 $3,733 $4,516 2009 $4,725 $4,893 Transmission Projected 11 Base Actual $773 $691 $682 $743 $756 $790 Program $969 $10,000 Total Transmission Natural Gener
Slide 13: NU-NSTAR Merger Status
NU-NSTAR Merger Status -
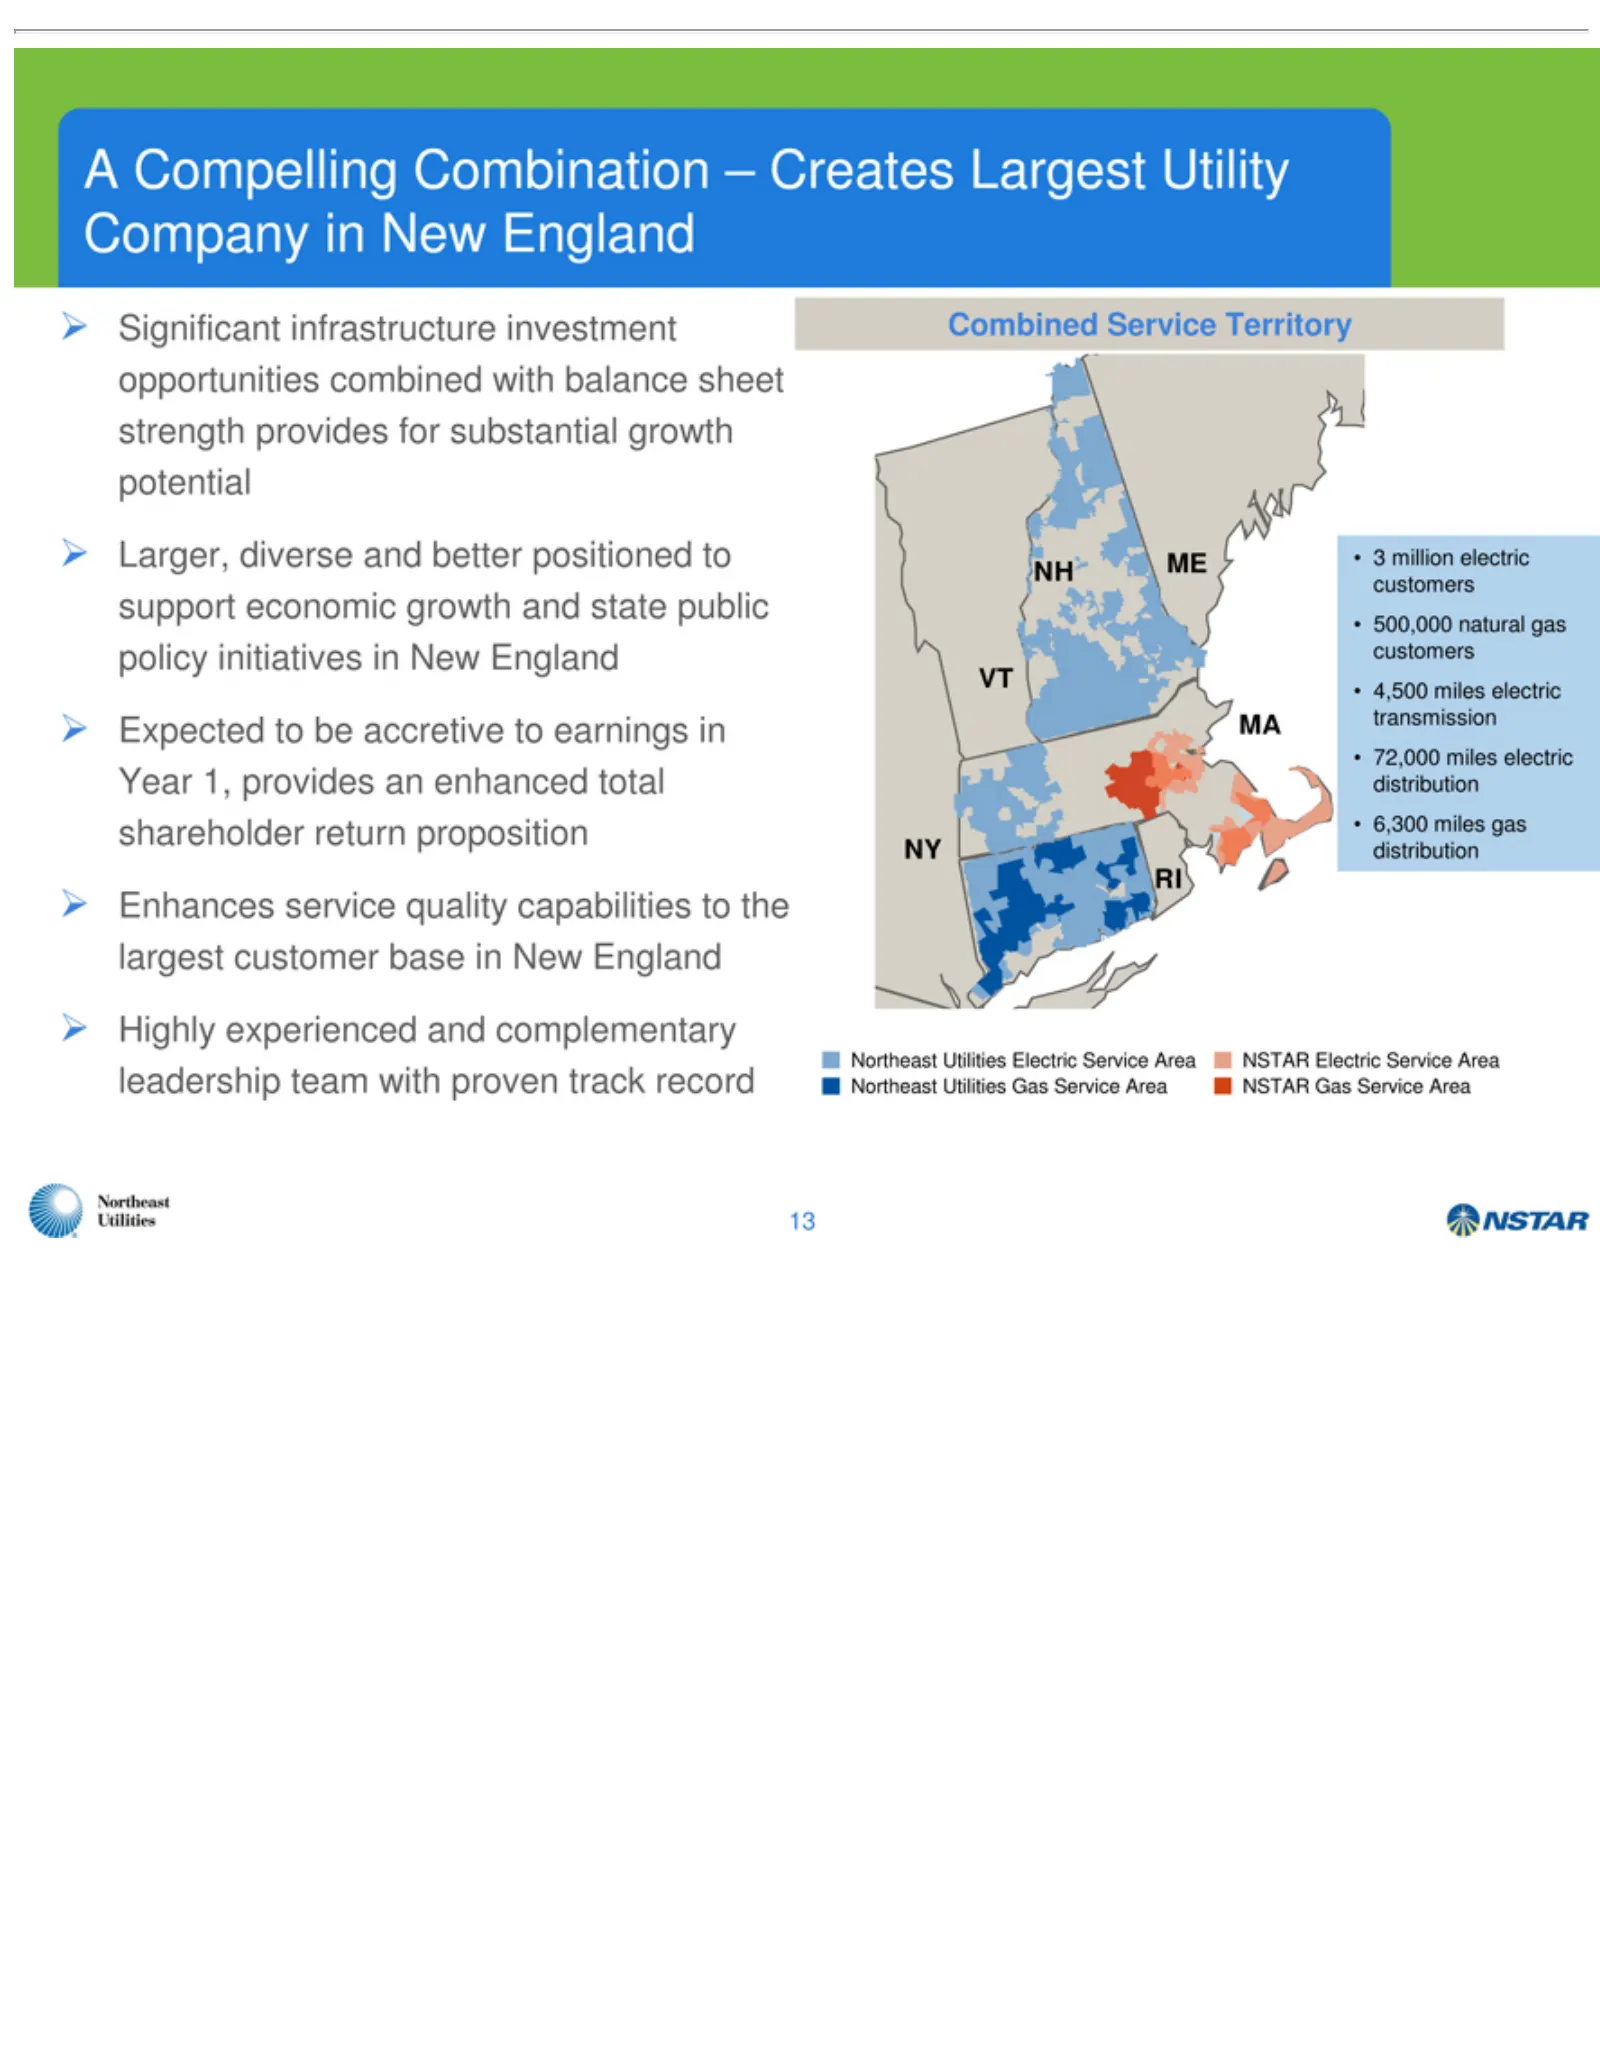
Slide 14: A Compelling Combination
A6,300 Significant Larger, Expected Enhances Highly Combined RI MA ME NH VT NY •12Compelling experienced diverse 3miles Northeast NSTAR 500,000 4,500 72,000 to service million Service milesinfrastructure begas ElectricCombination naturalaccretive and Utilitiesquality electric Territory electricbette
Slide 15: Key Merger Terms and Timing
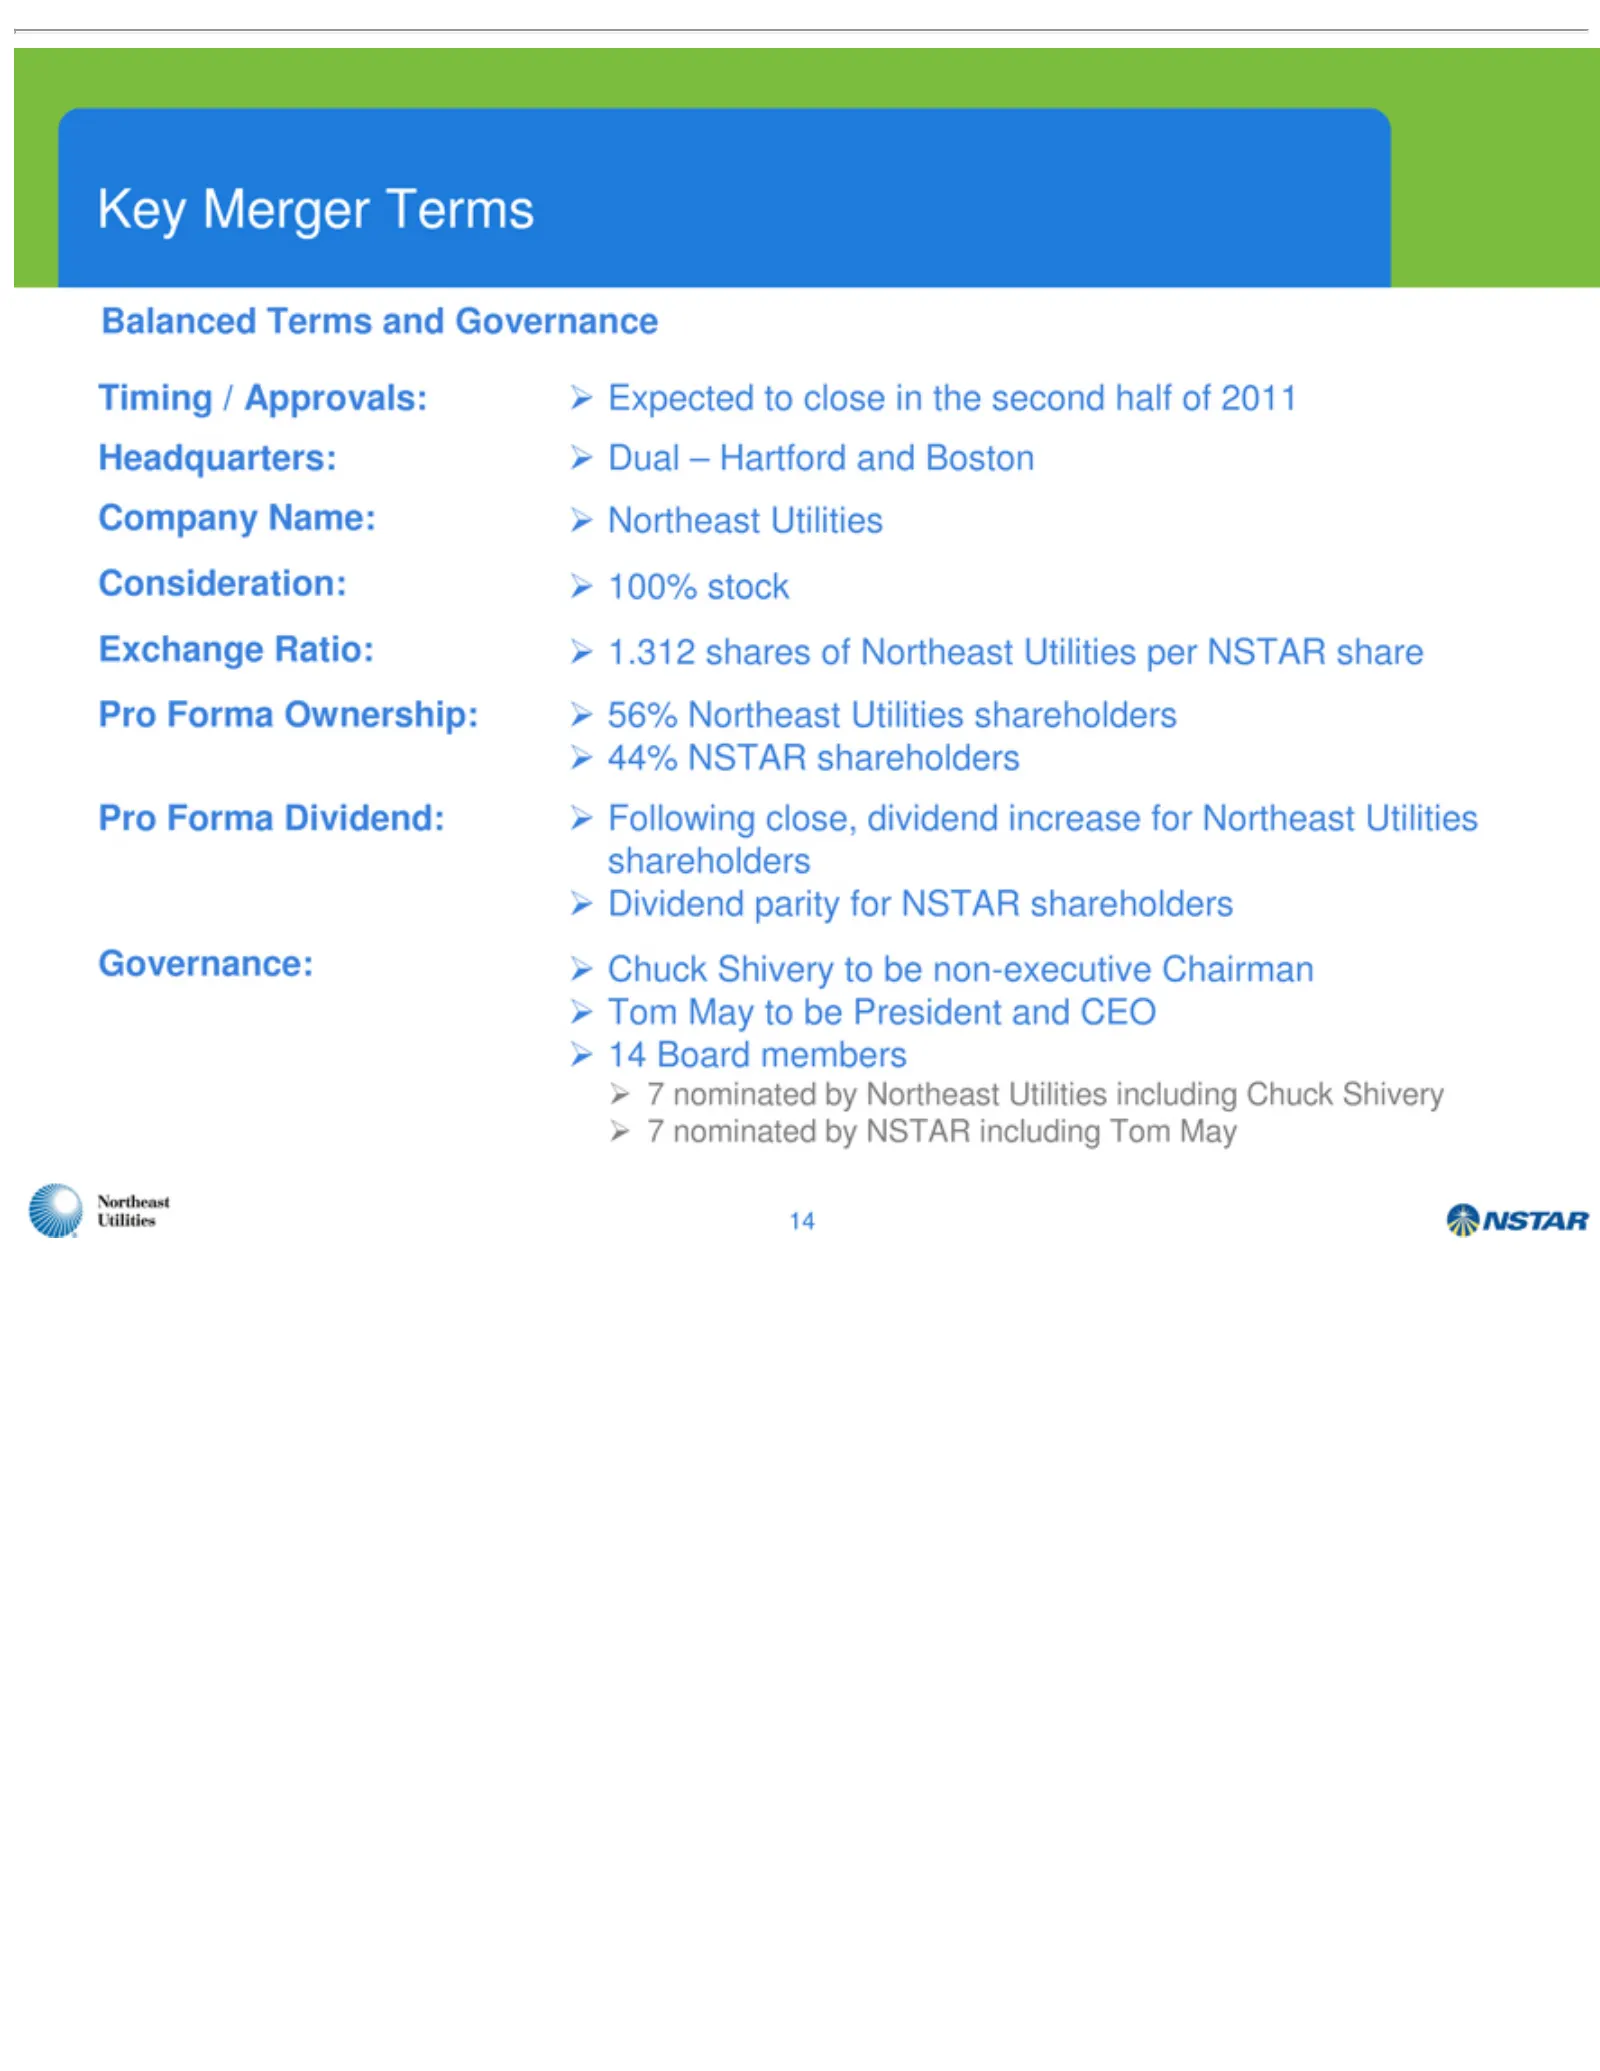
Key Balanced Timing Pro Expected Governance: Dual Northeast 100% 1.312 44% Following Dividend Chuck _Tom 147Board nominated Forma Merger May NSTAR –shares stock Shivery Hartford / Approvals: members Terms to parity Utilities to close, Dividend: close Terms be of shareholders by to Northeast Presiden
Slide 16: NU-NSTAR Merger Approval Status
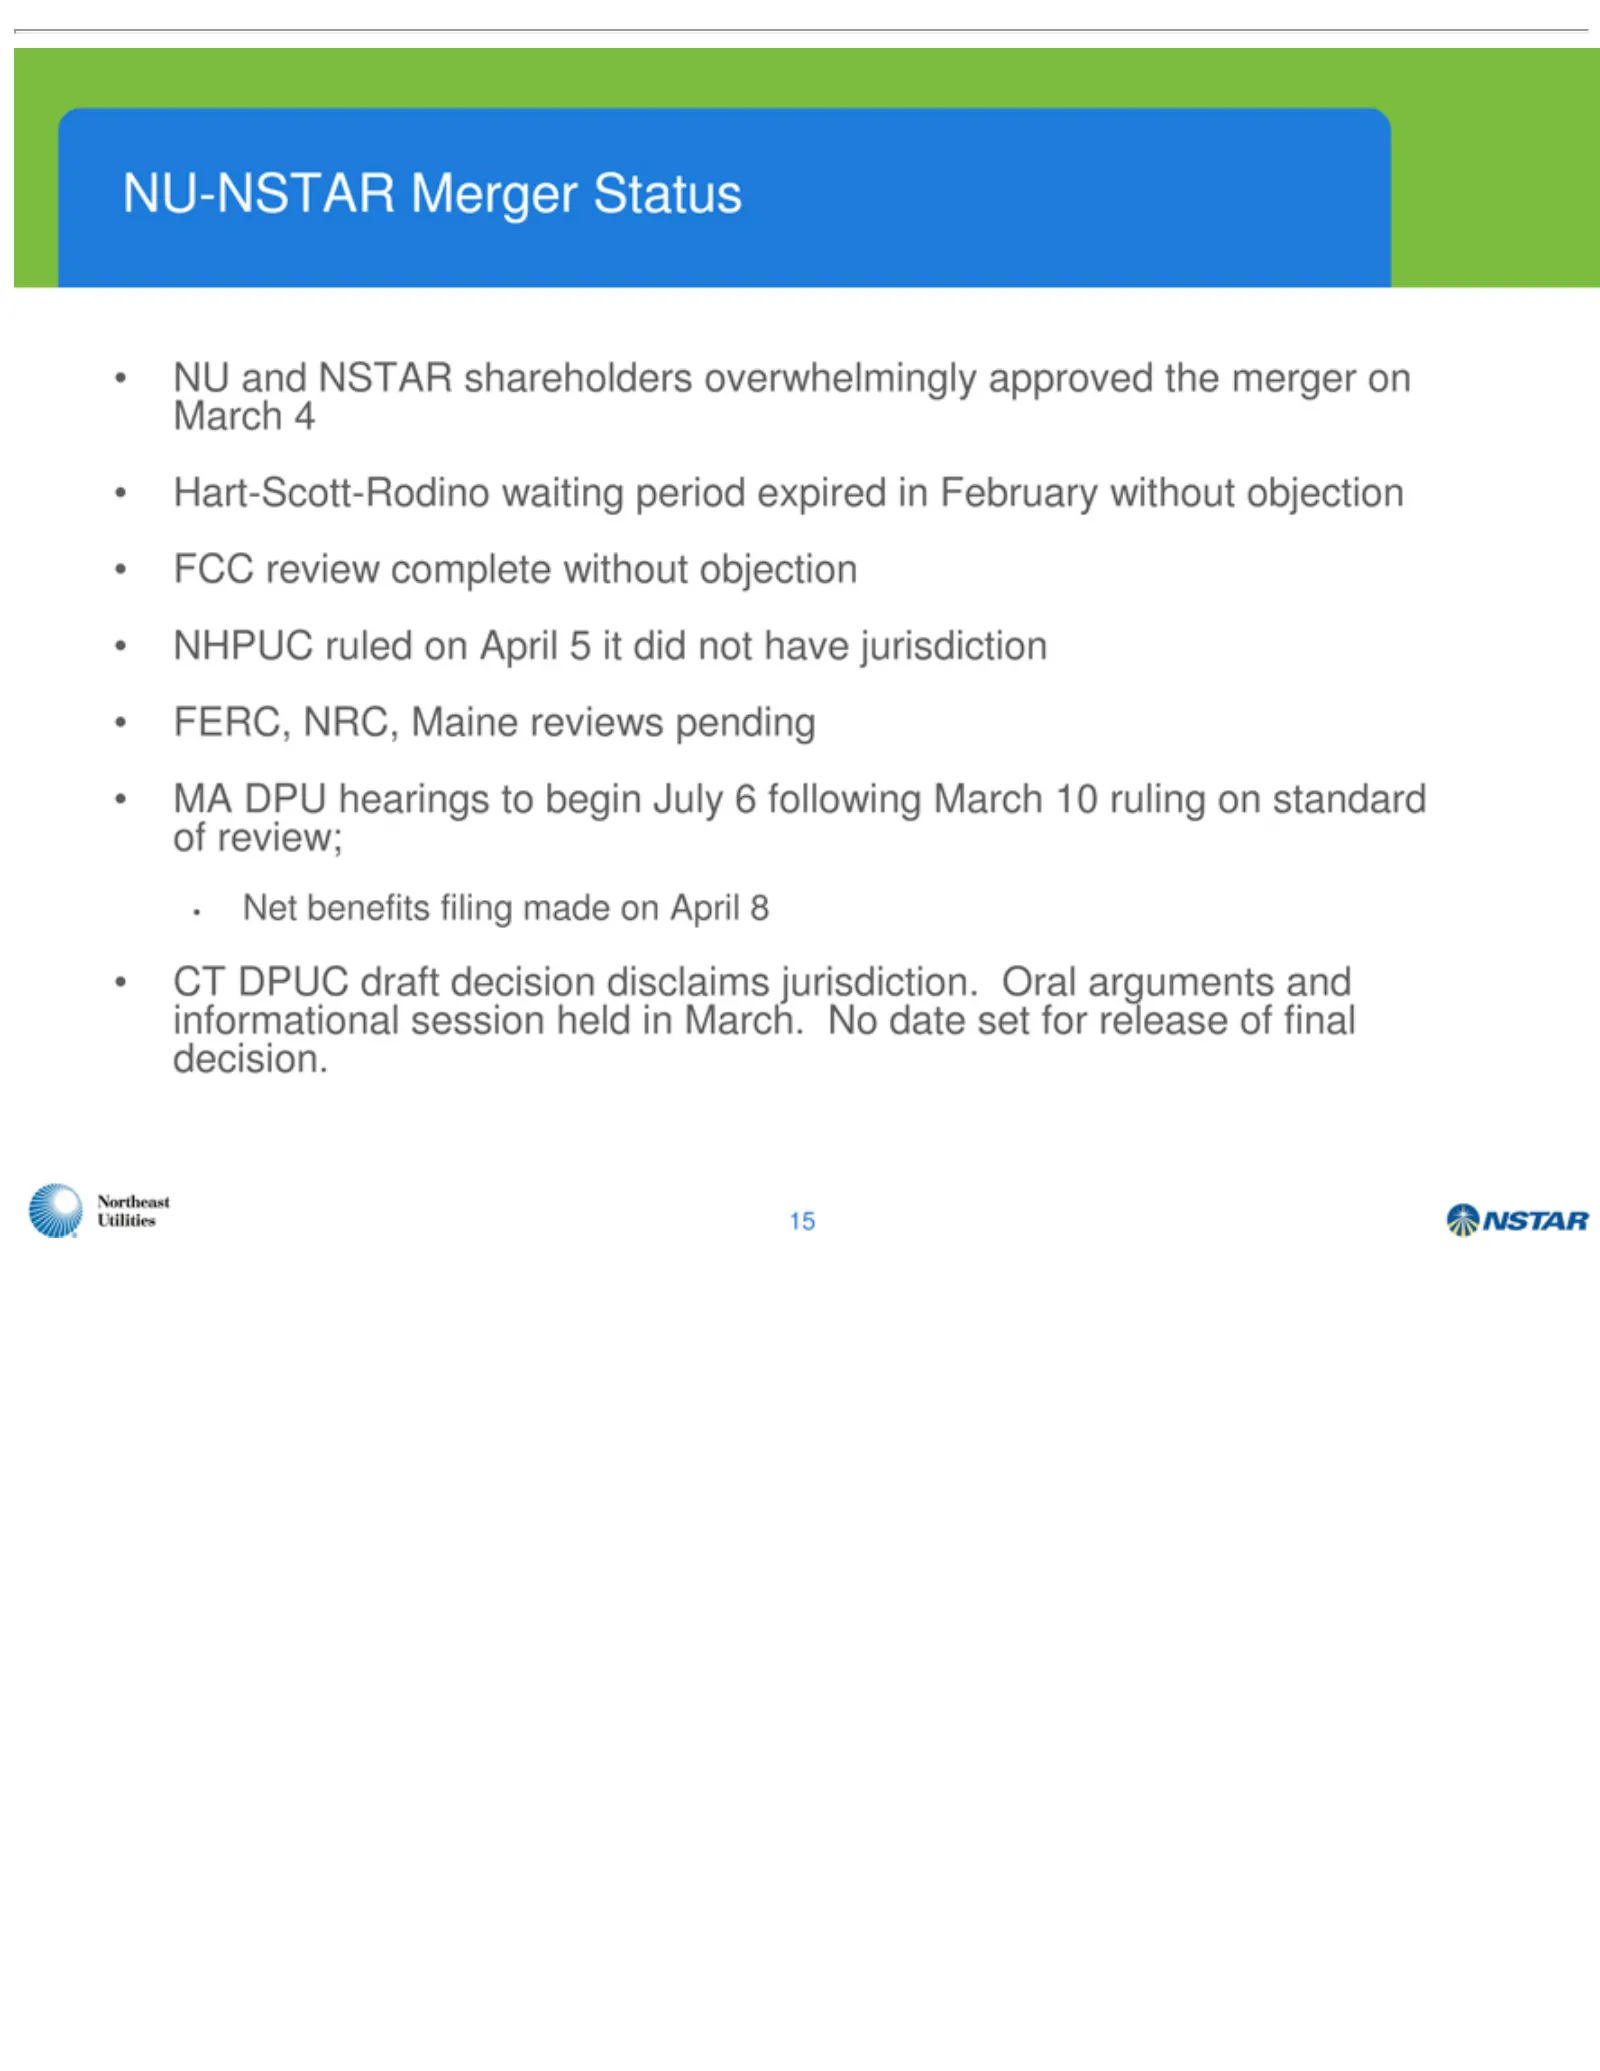
NU-NSTAR NU Hart-Scott-Rodino FCC NHPUC FERC, MA Net CT 15 DPUC benefits March DPU review NRC, ruled hearings draft and filing complete Merger Maine on 4decision NSTAR April made waiting toreviews Status begin without 5on disclaims itshareholders period did April July pending objection not 68expired
Slide 17: Appendix
Appendix
Slide 18: GAAP / Non-GAAP EPS Reconciliation
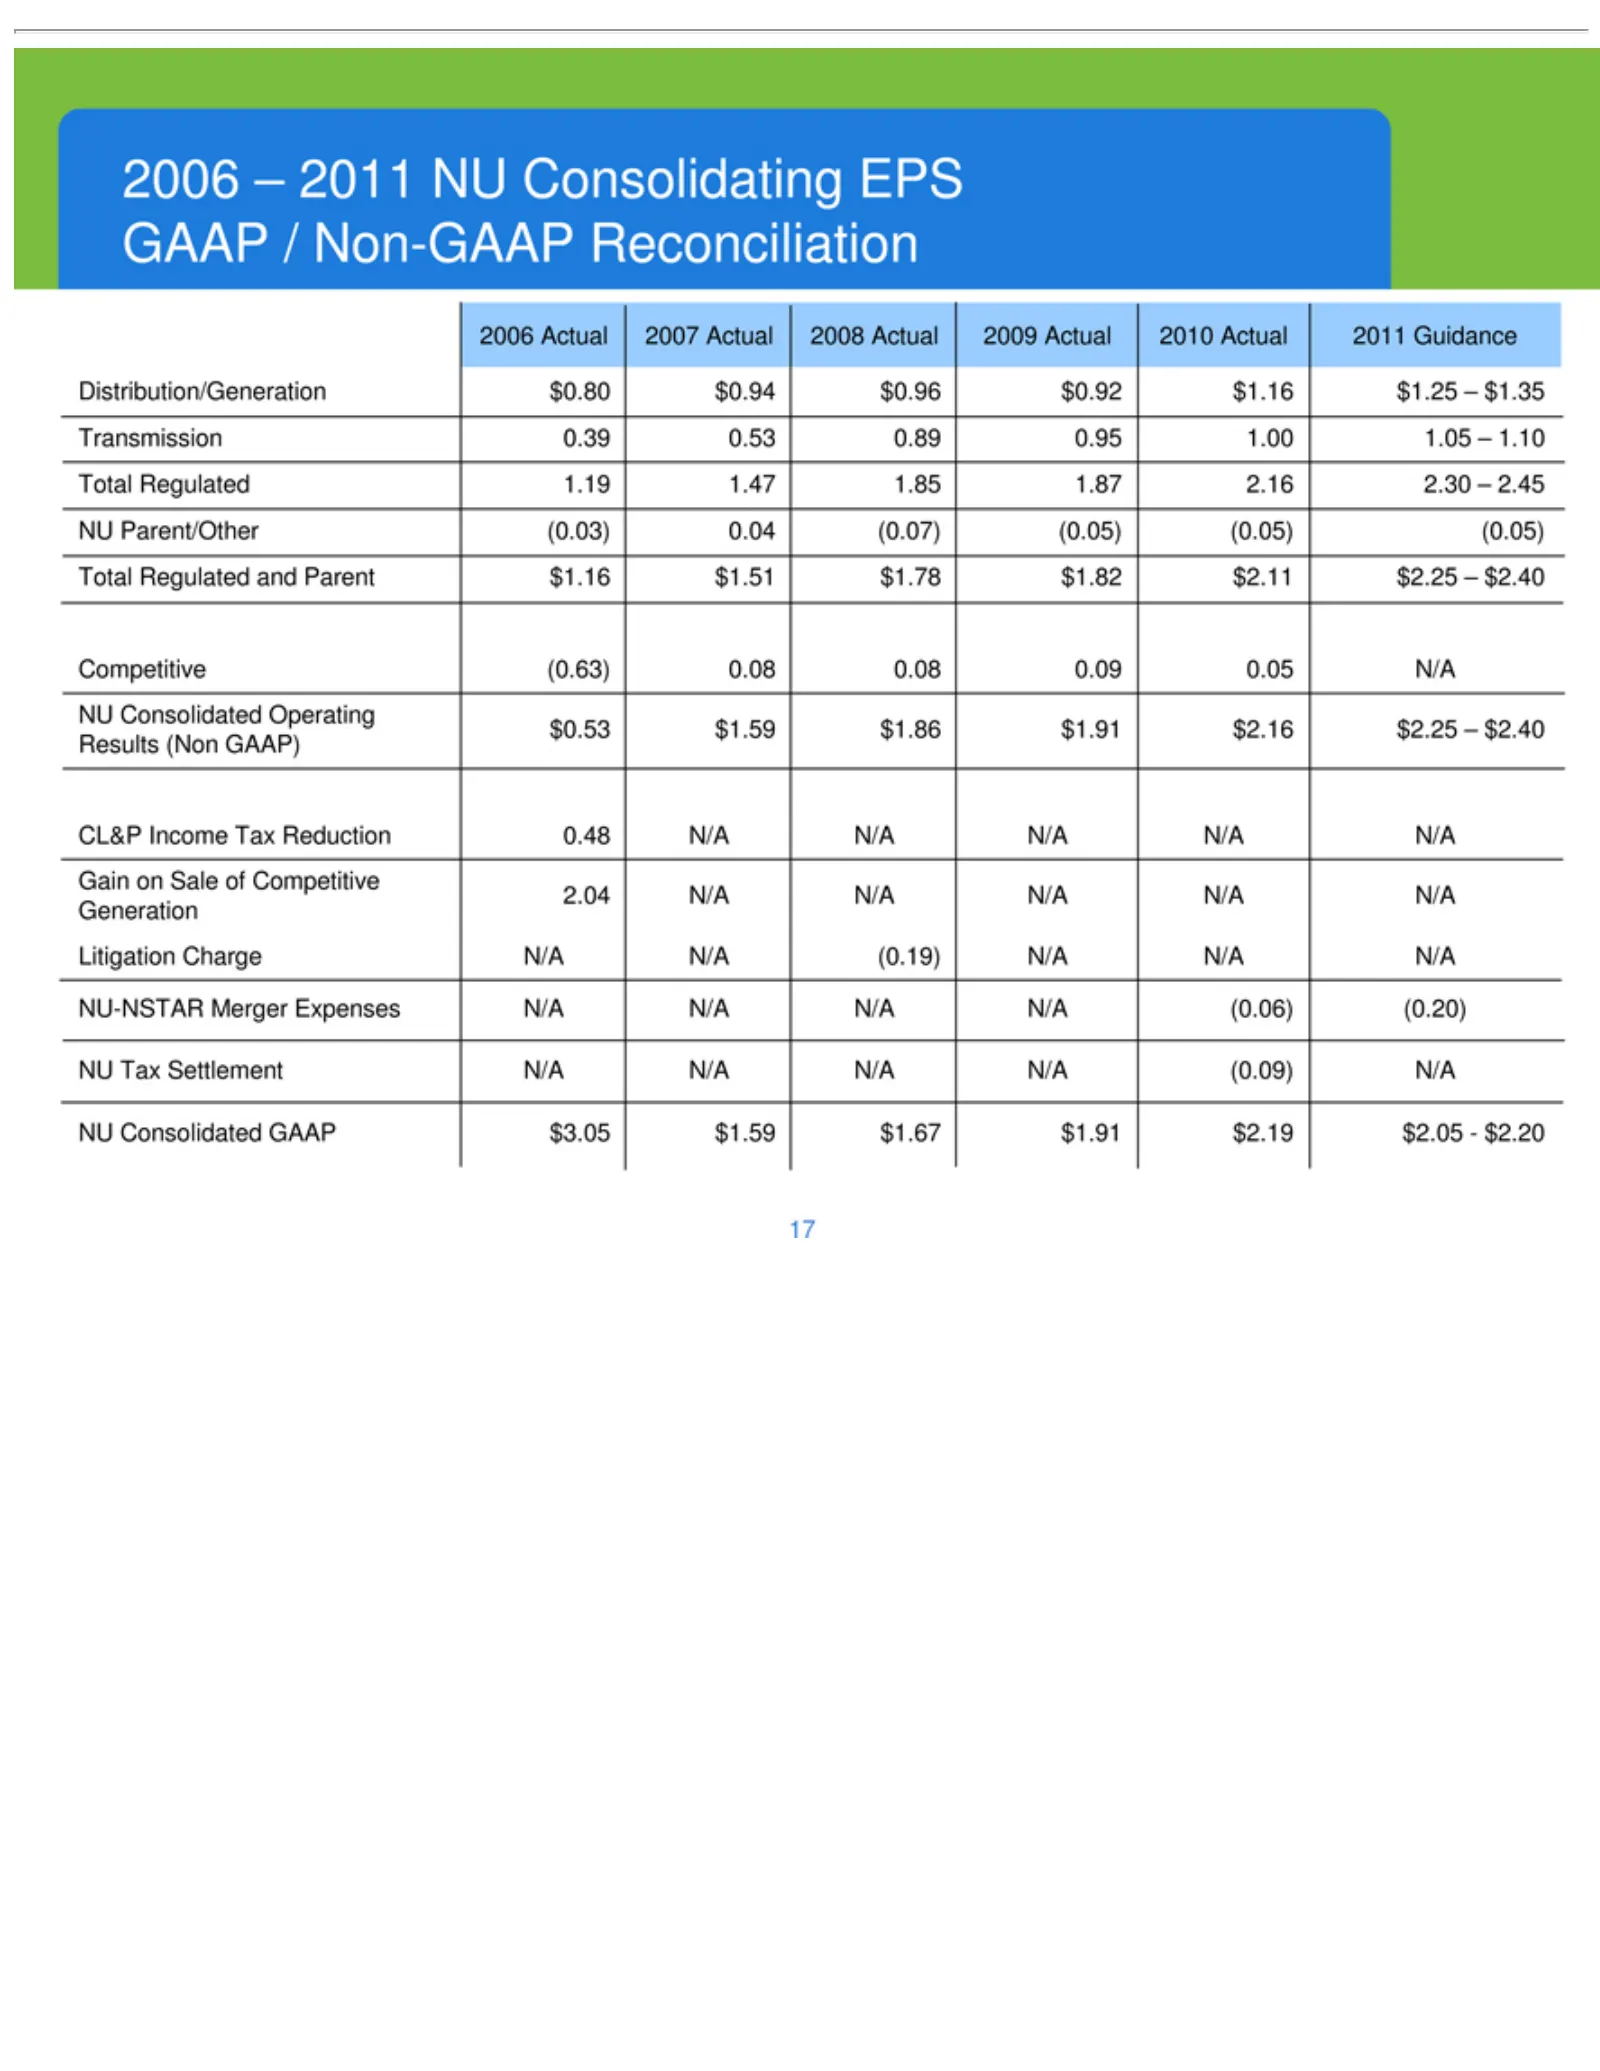
2006Tax Distribution/Generation Transmission Total Competitive CL&P Gain Litigation NU 17 Parent/Other Consolidated on Actual –Regulated Income 2011 Settlement Sale Charge 2007 (0.63) NU of 0.39 Tax Competitive 1.19 and Consolidating (0.03) Operating GAAP Actual N/A 0.53 Reduction 0.08 N/A Parent 1.
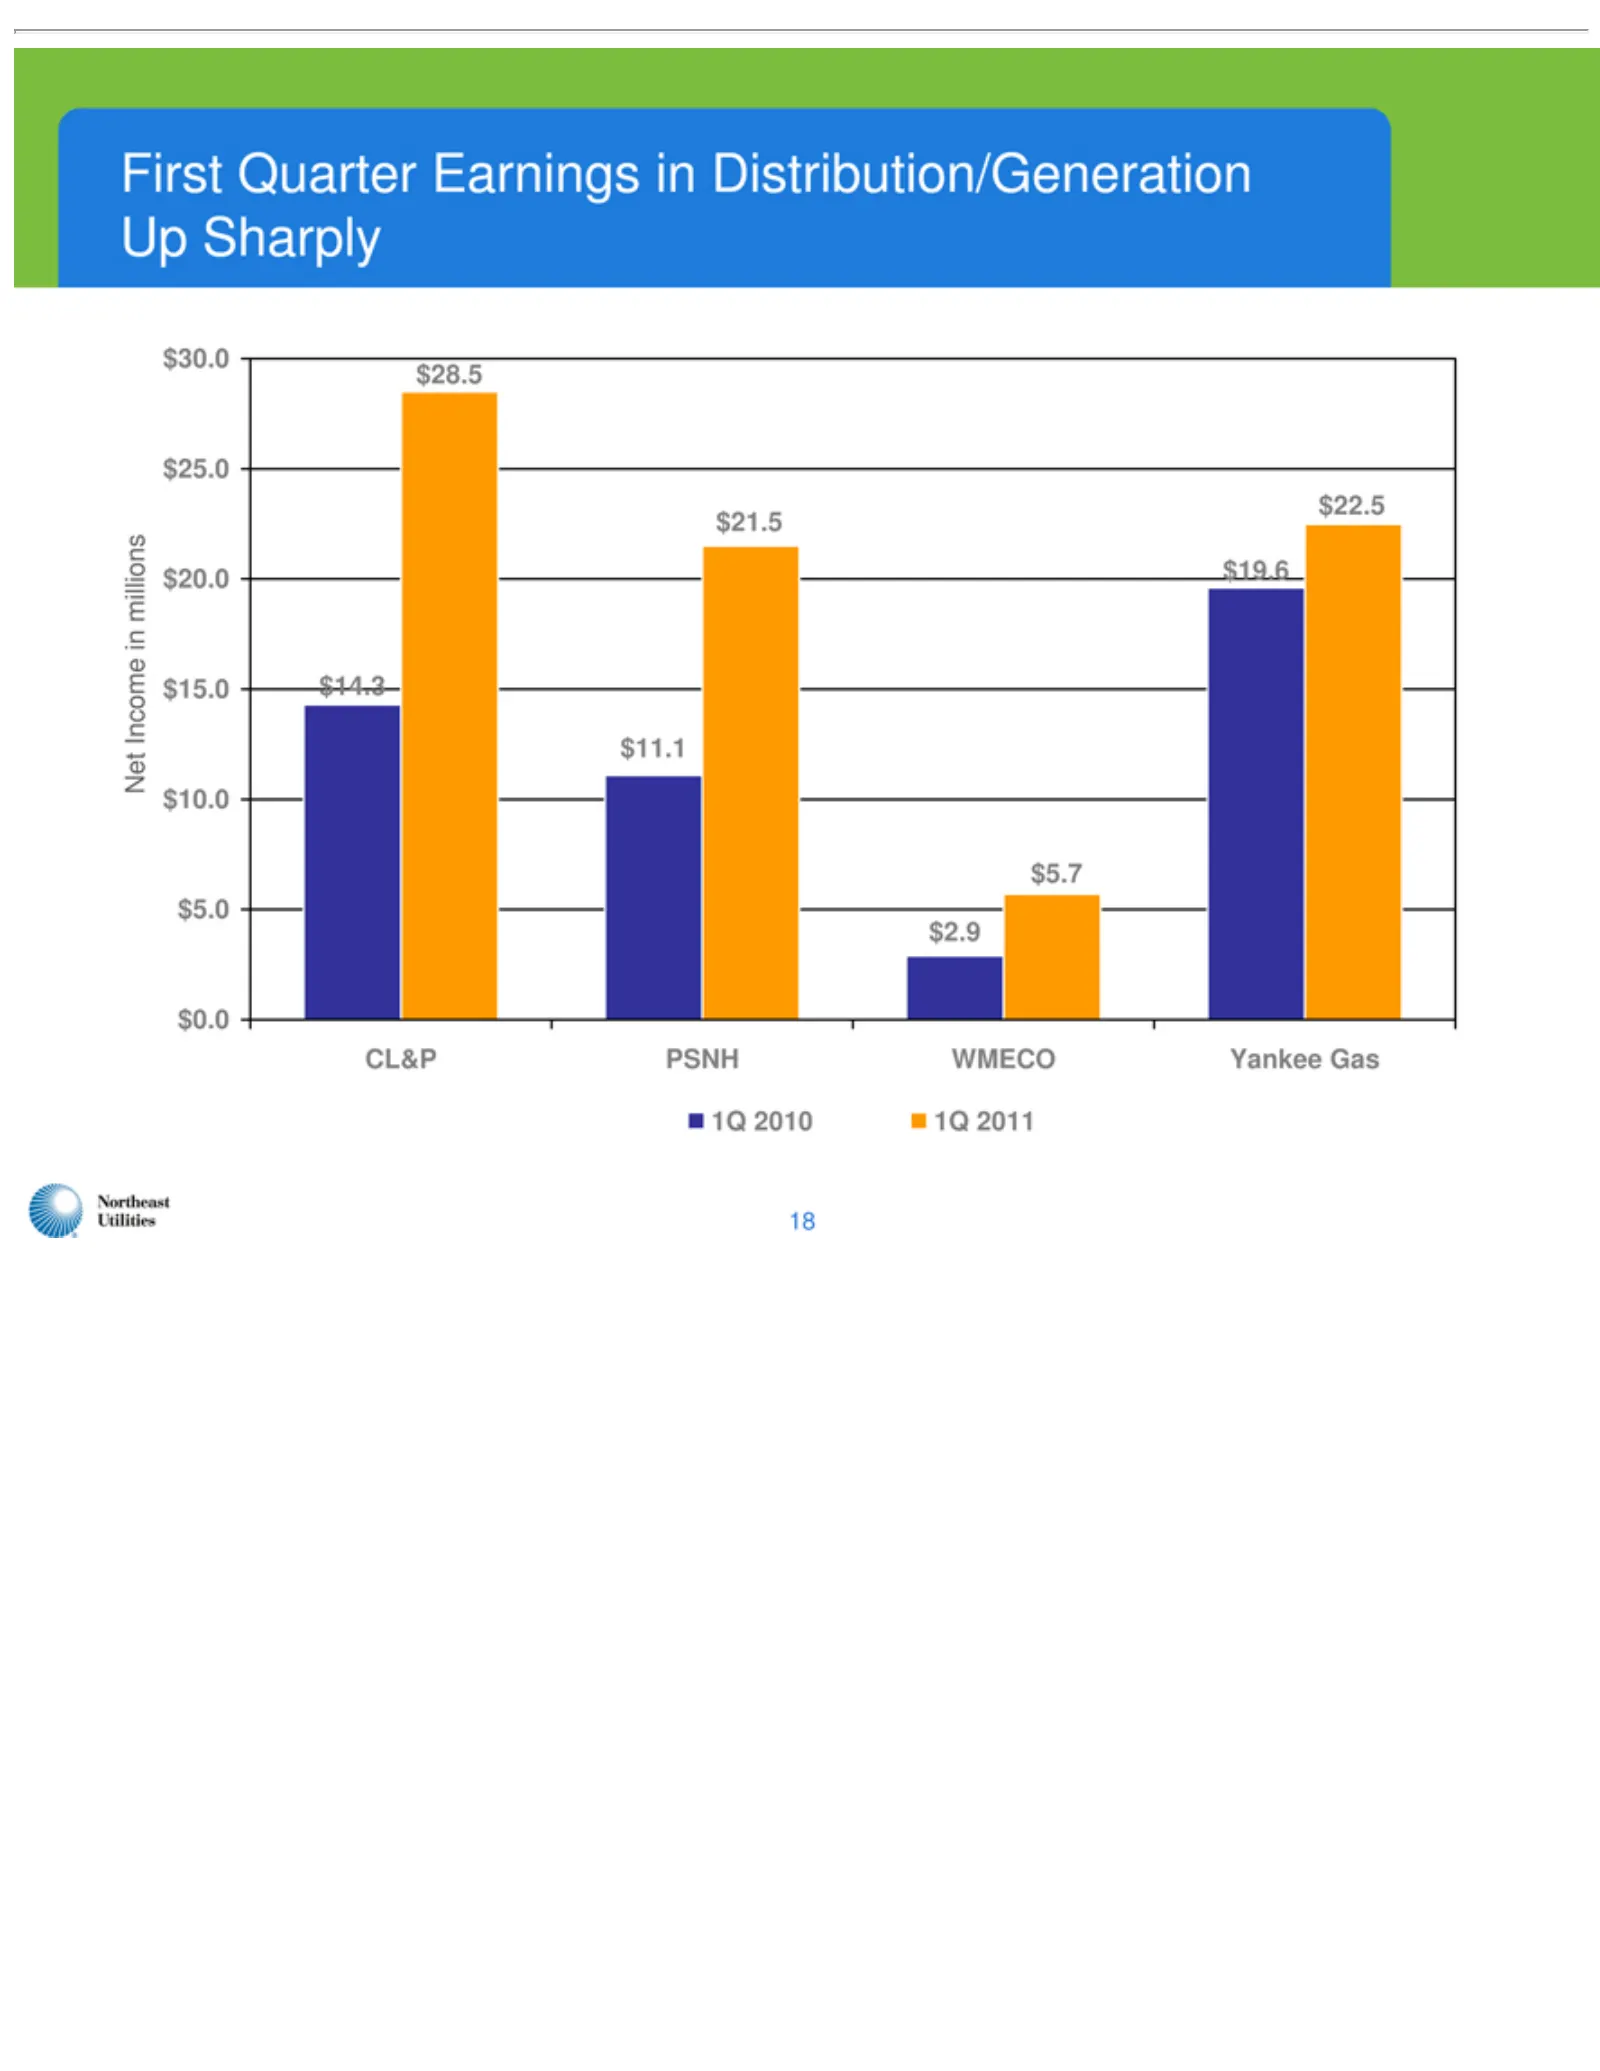
Slide 19: First Quarter Distribution/Generation Earnings Up Sharply
First2010 Net $30.0 CL&P $22.5 $19.6 $5.7 $2.9 $21.5 $11.1 $28.5 $14.3 1Q 18 Income Quarter $25.0 PSNH 1Qin $20.0 2011 Earnings WMECO millions $15.0 inYankee $10.0 Distribution/Generation $5.0 Gas $0.0 Up Sharply
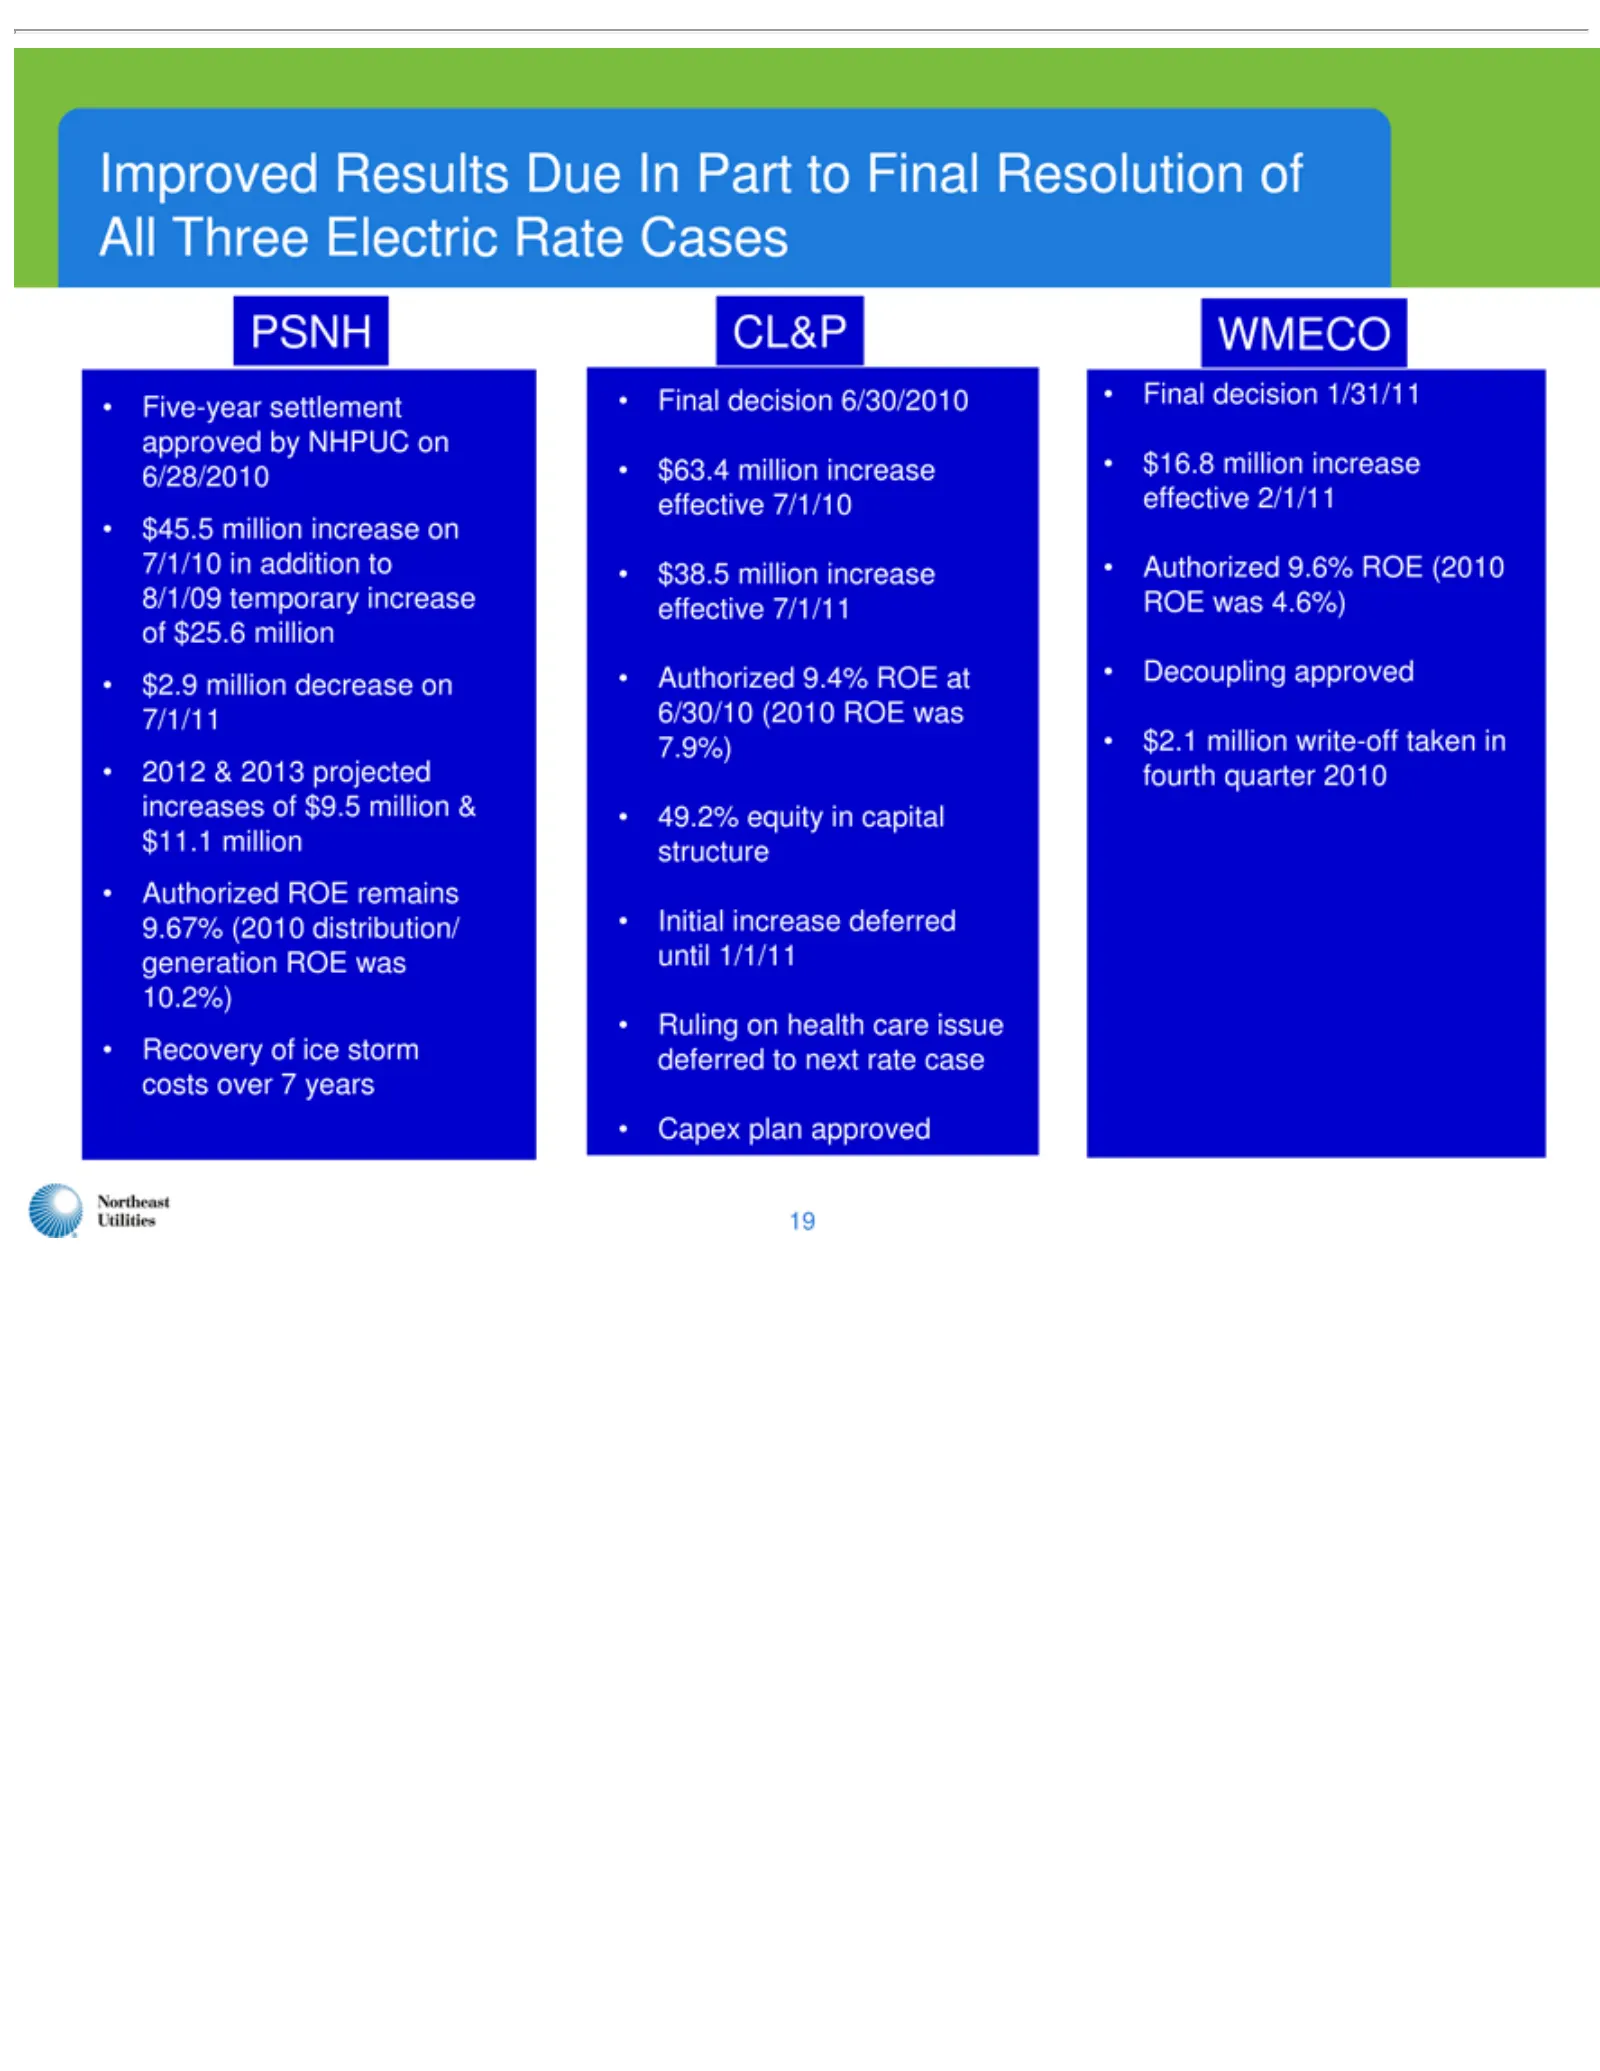
Slide 20: Improved Results and Rate Case Outcomes
Improved PSNH CL&P •WMECO 19 Authorized Five-year $45.5 $2.9 2012 Recovery $63.4 $38.5 49.2% Initial Ruling Capex Final $16.8 Decoupling $2.1 million & decision million increase plan equity on 2013 Results settlement of health ROE 9.4% 9.6% approved approved decrease write-off ice projected in incre
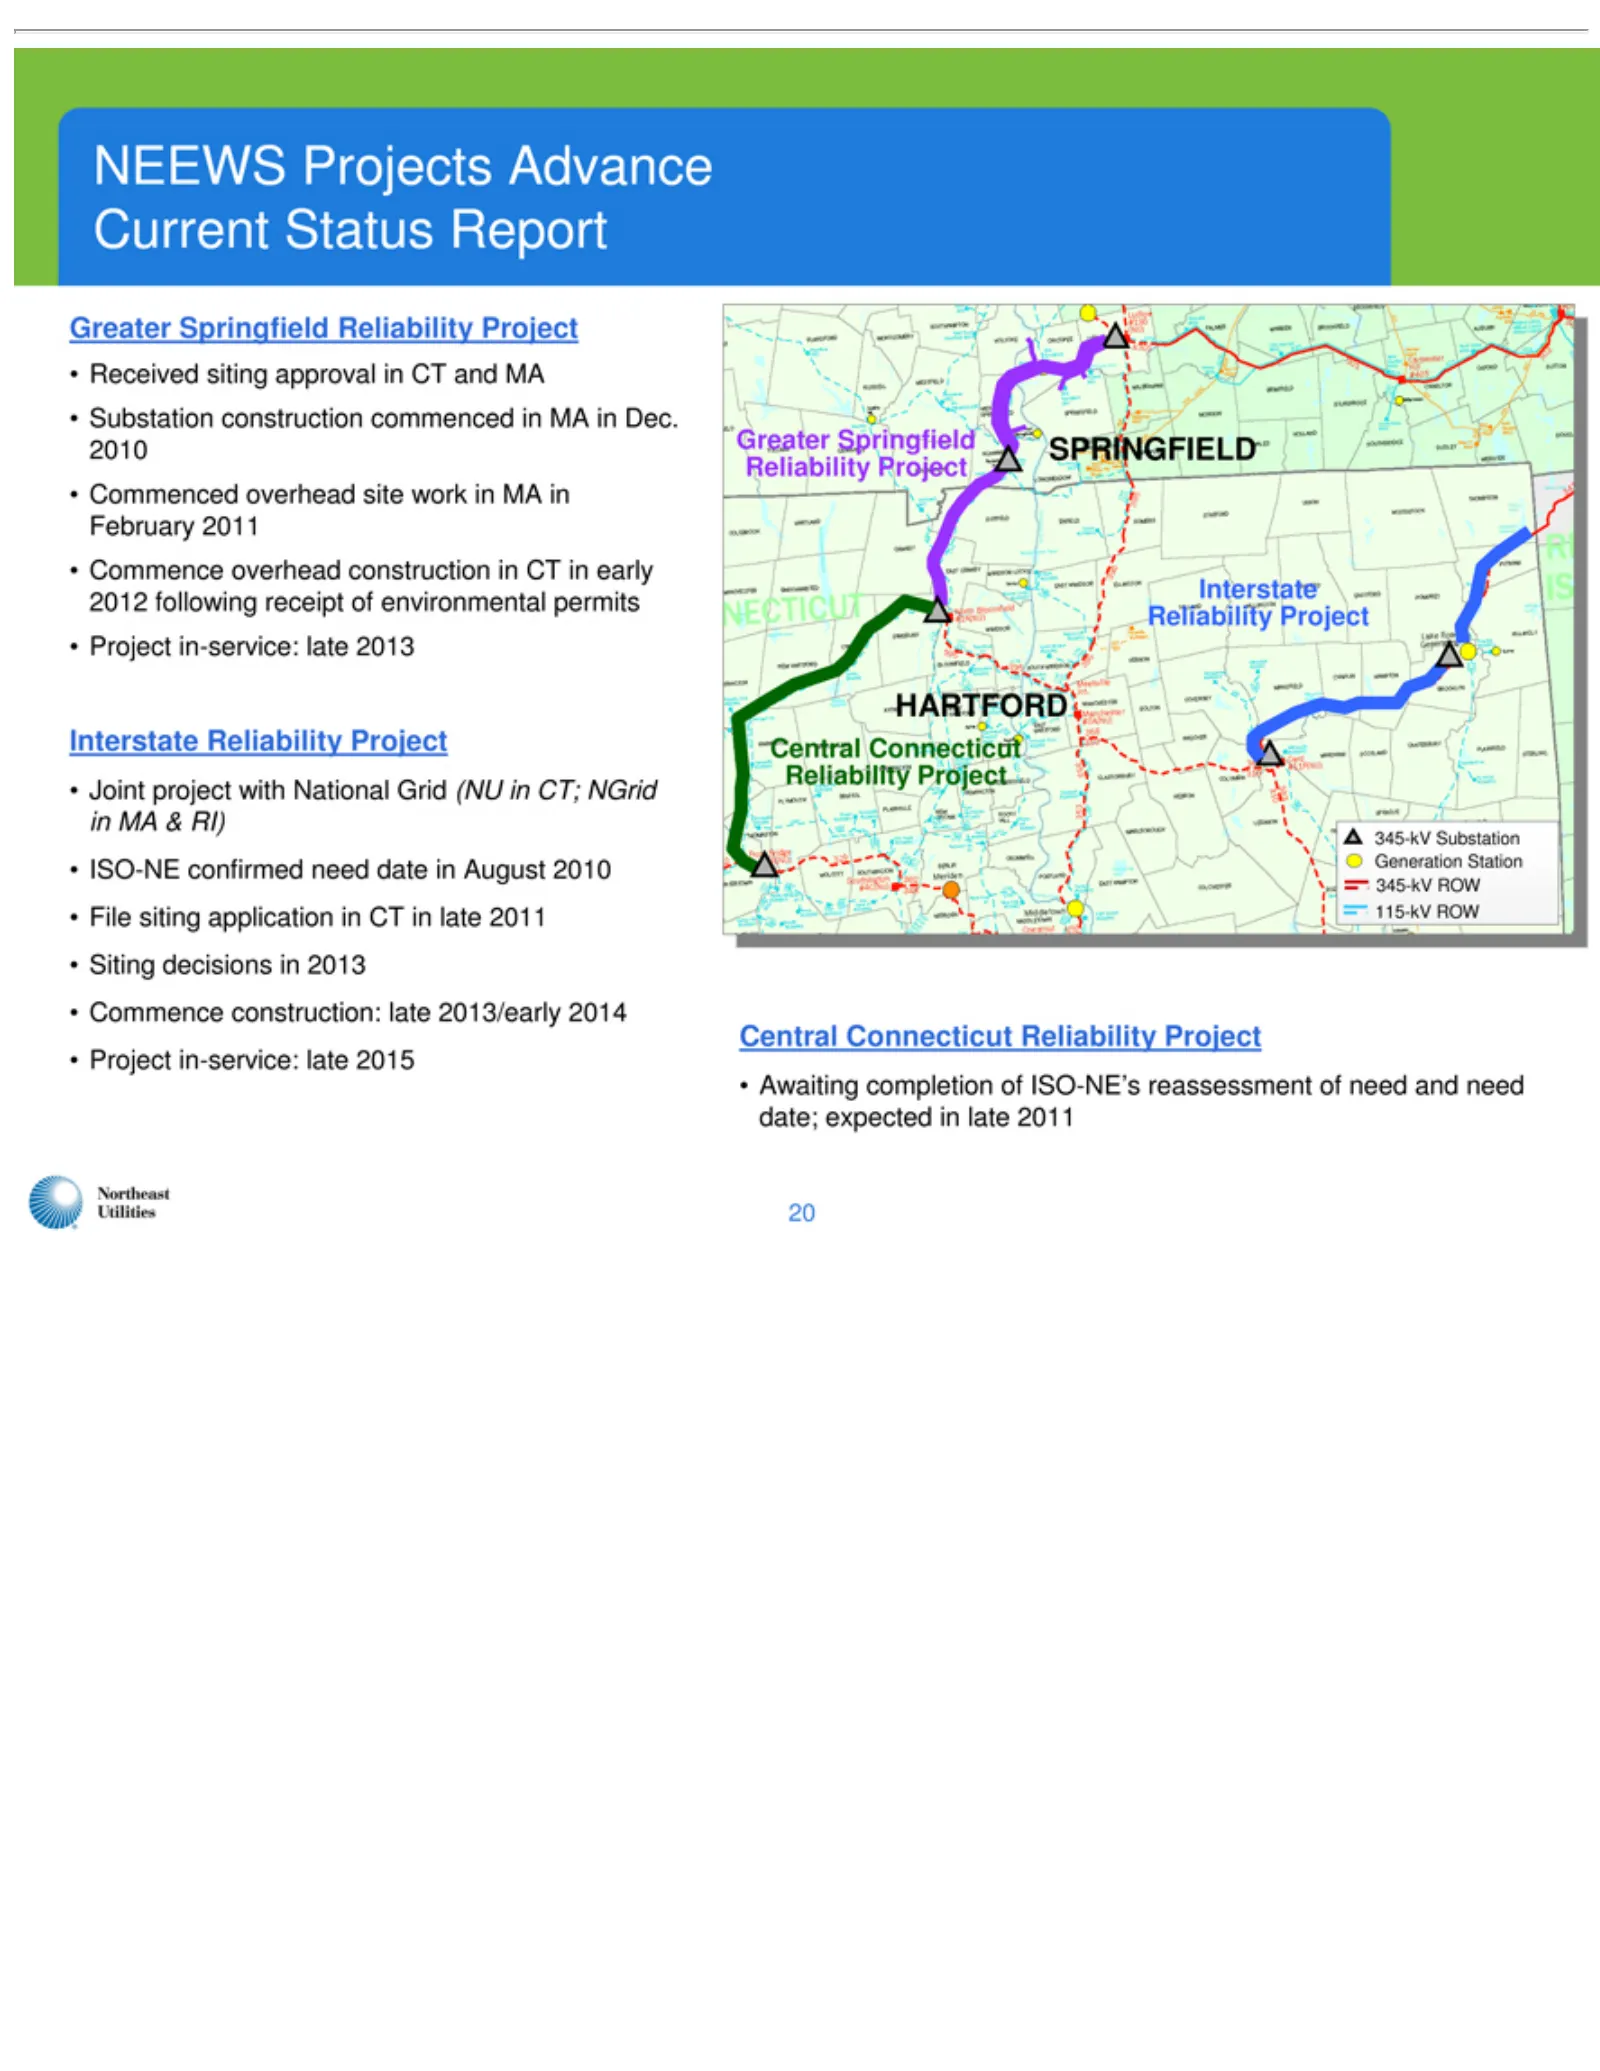
Slide 21: NEEWS Project Status
•NEEWS Greater Interstate SPRINGFIELD Central HARTFORD 345-kV 20 Awaiting Received Substation Commenced Joint ISO-NE File Siting Commence Project siting project Connecticut decisions Springfield Substation in-service: Projects Reliability confirmed completion siting application construction overhead
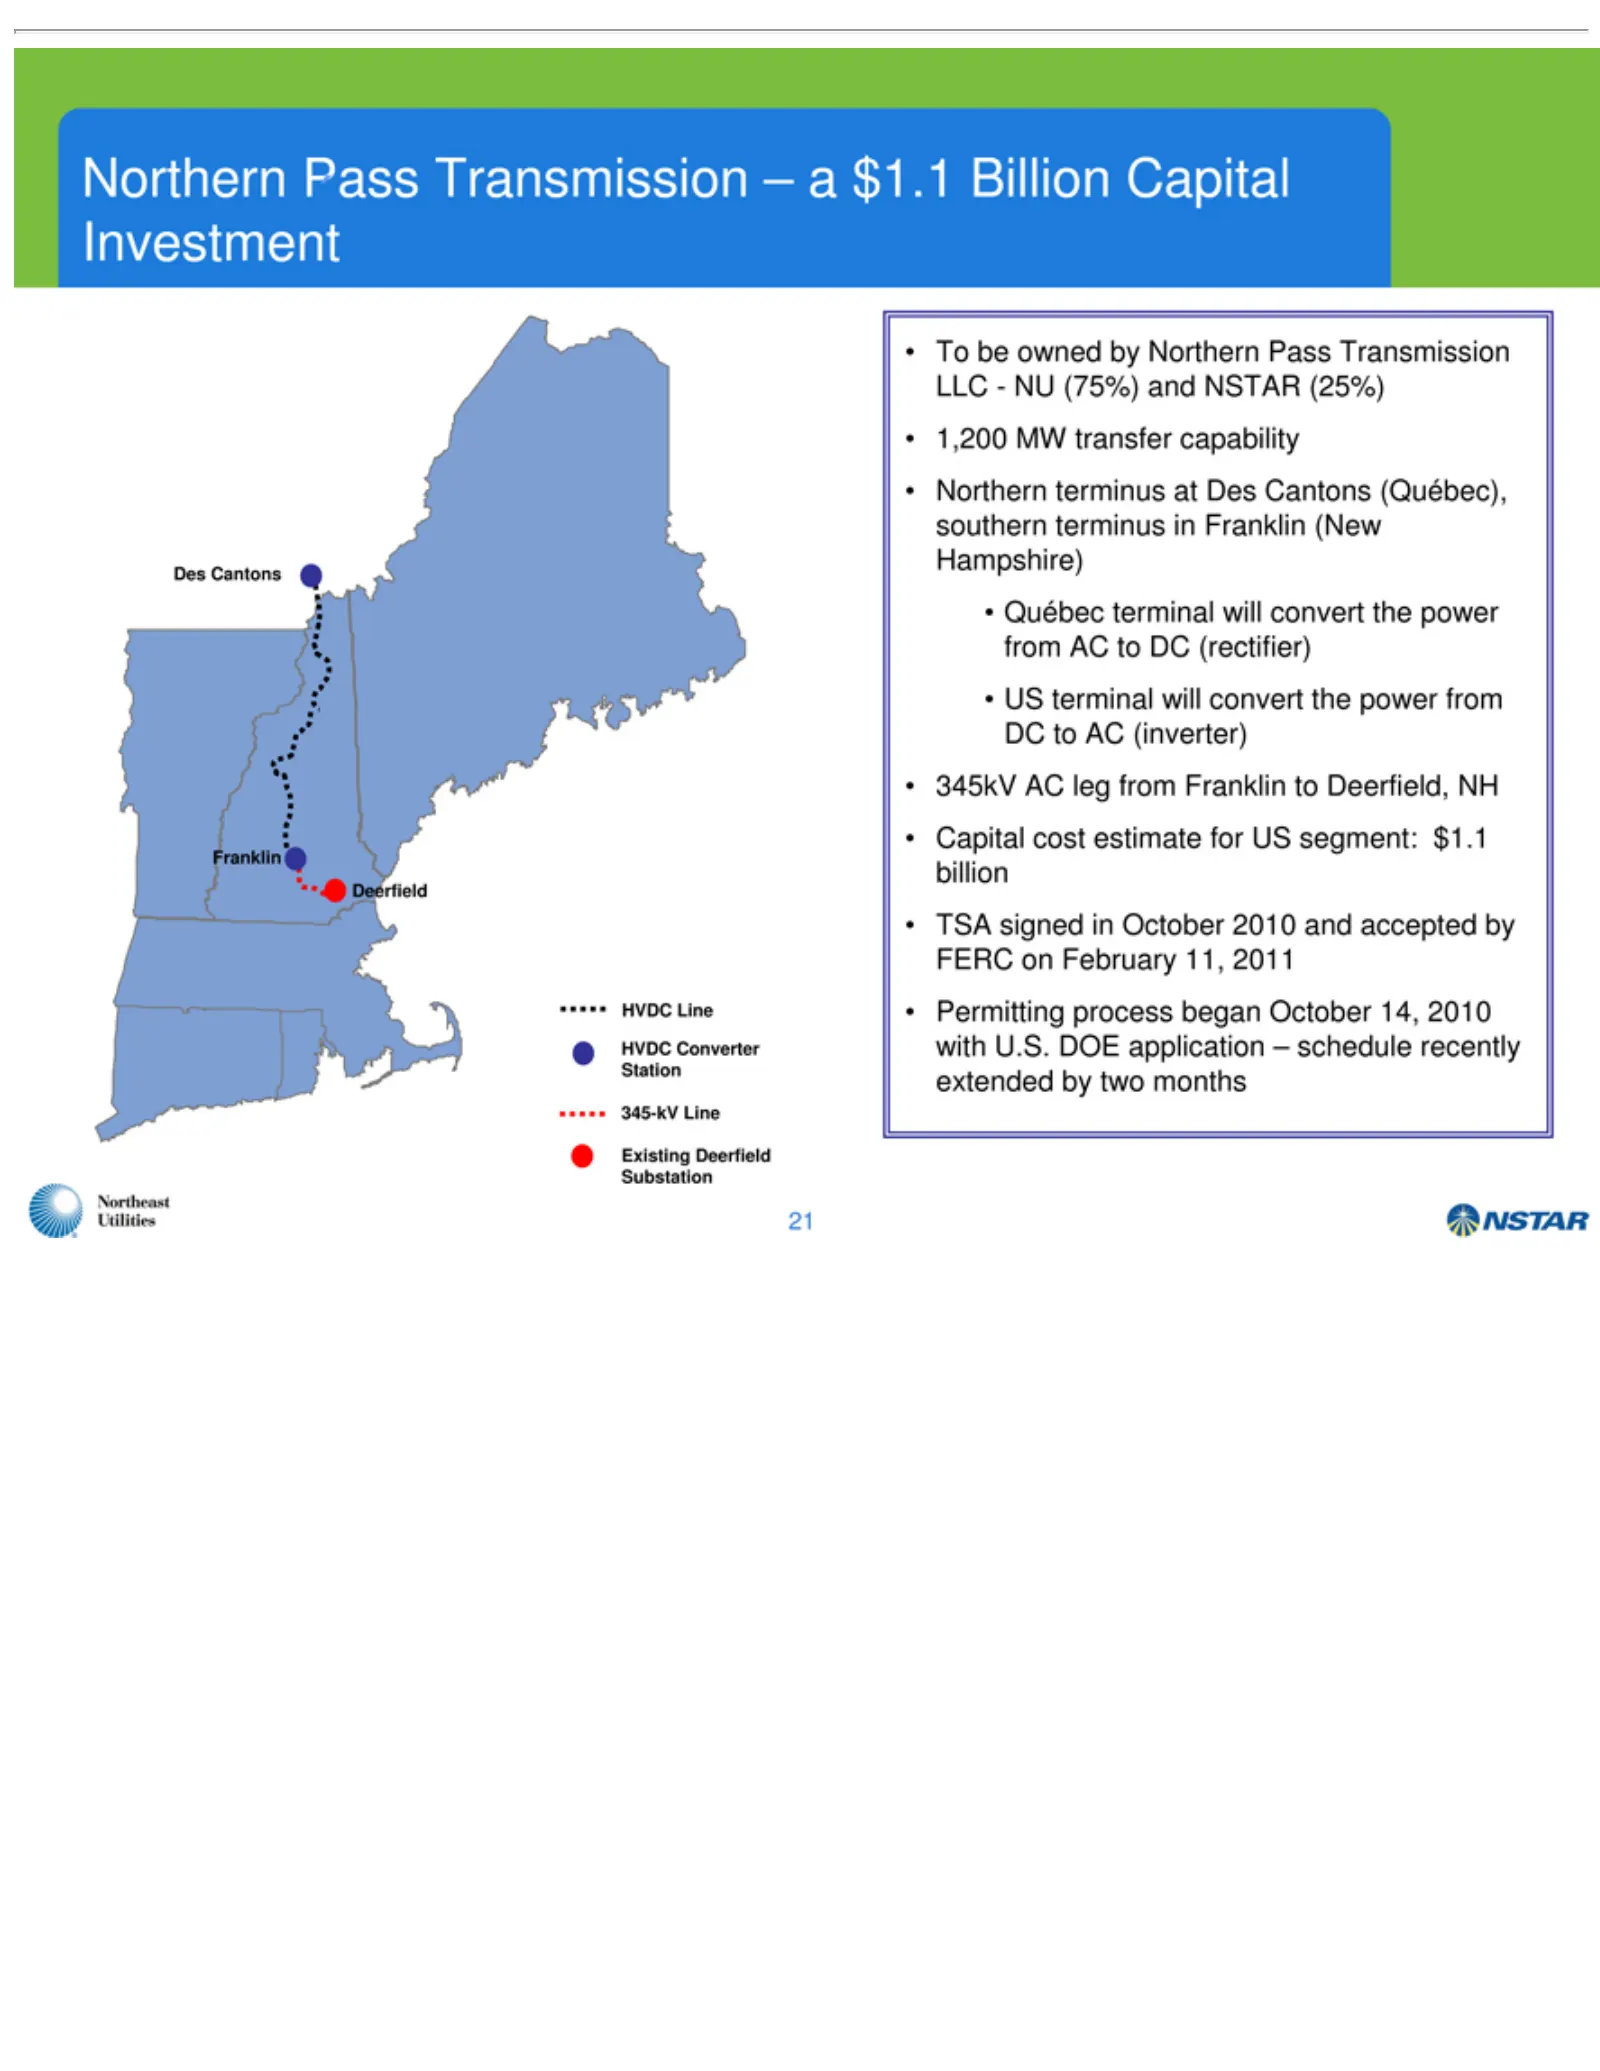
Slide 22: Northern Pass HVDC Transmission Line
•Northern HVDC 345-kV Existing Des 21 Deerfield Franklin To TSA 1,200 Northern Québec US 345kV Capital Permitting Cantons be terminal signed owned Line Converter MW Line AC Deerfield cost Pass terminal terminus process leg transfer in estimate will ´by Transmission October from Northern Station will
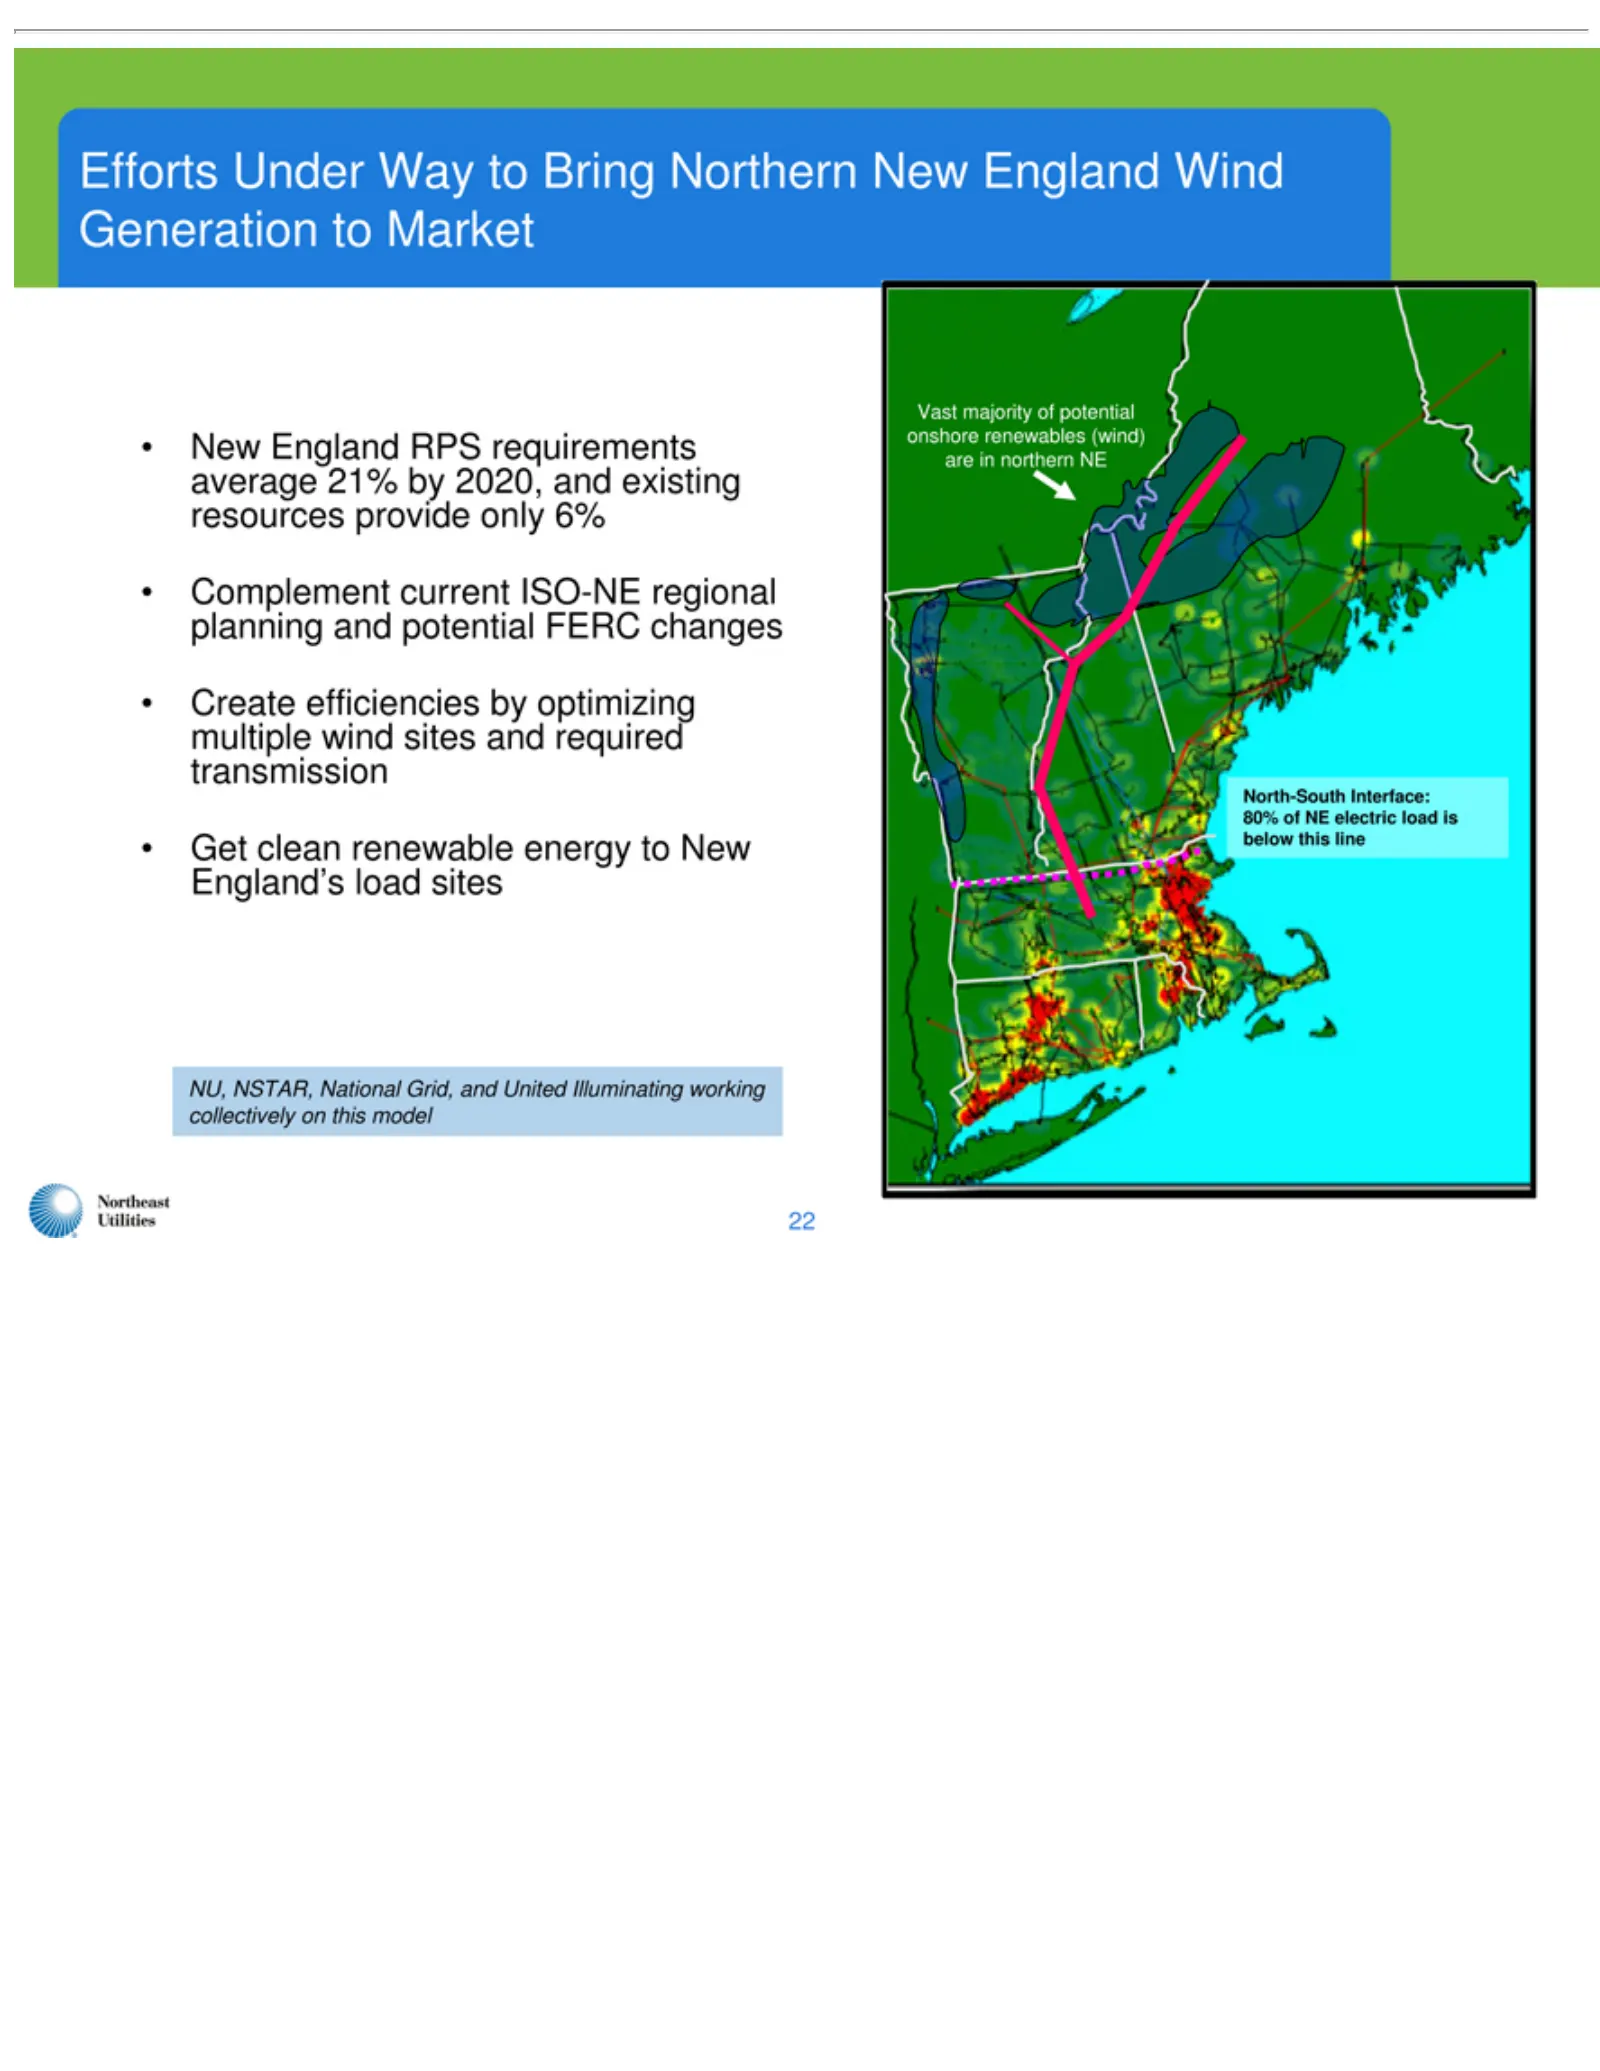
Slide 23: New Efforts Complement Renewable Development
Efforts New Complement Create Get NU, Vast North-South 22 England’s NSTAR, majority England efficiencies UnderInterface: current of National RPS Way clean potential by requirements torenewable ISO-NE Bring optimizing 80% Grid, onshore Northern of and regional NE load average United multiple renewabl
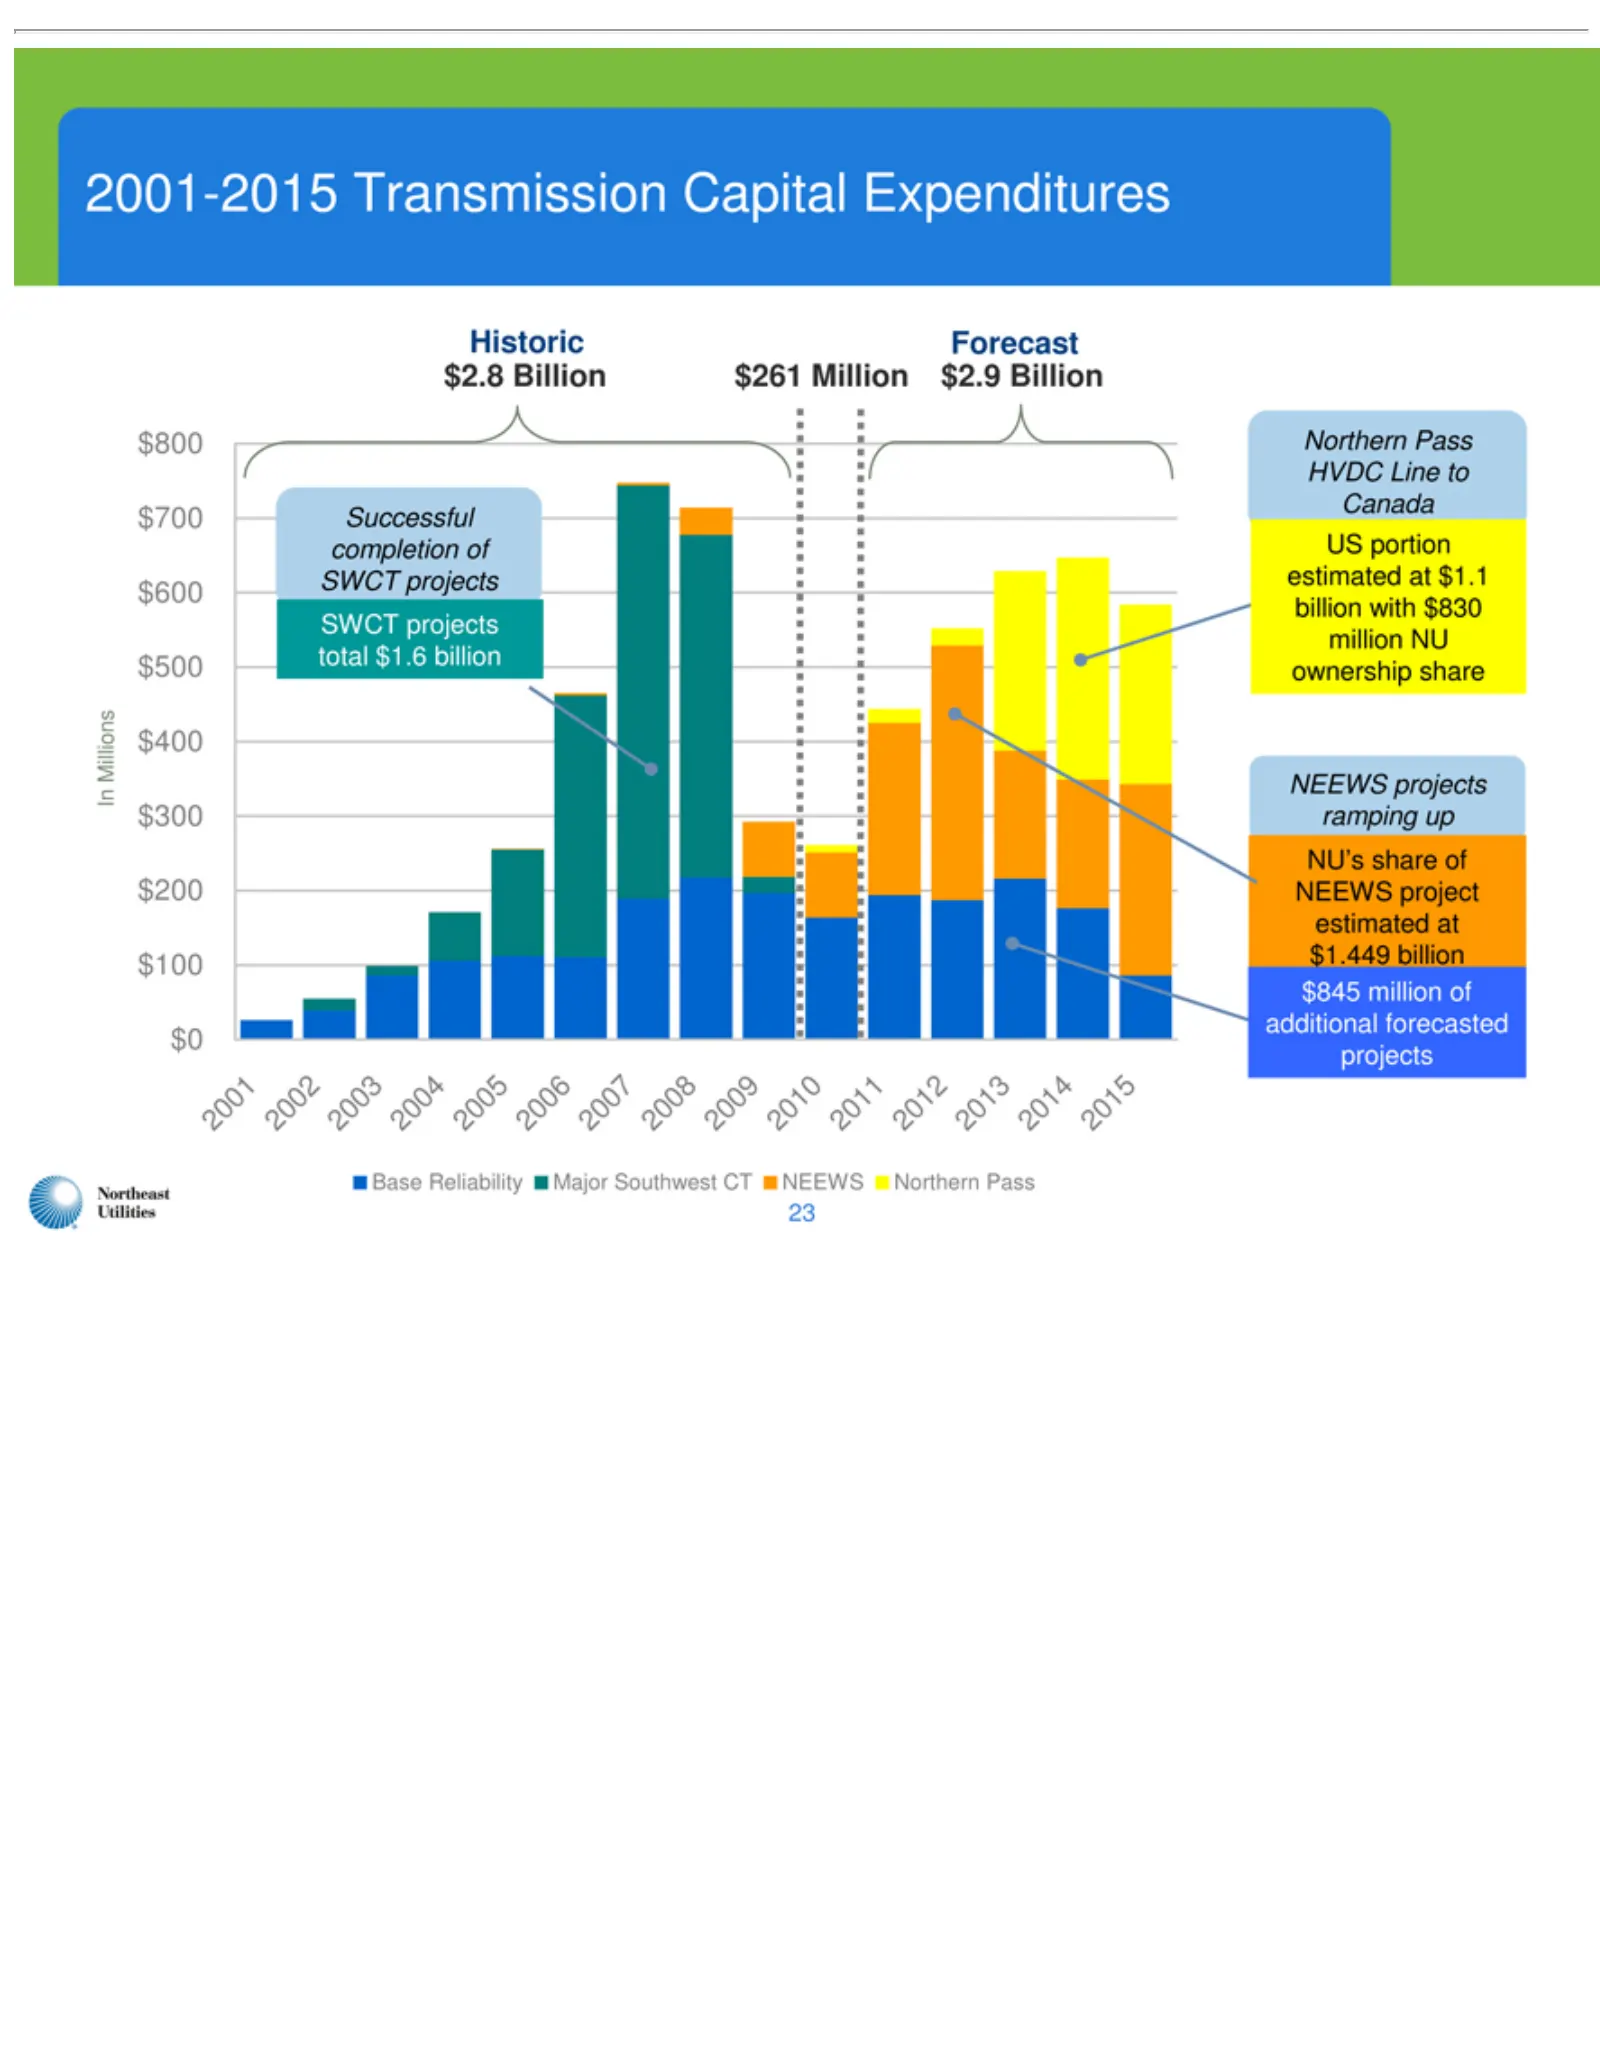
Slide 24: Historic and Forecast Transmission Capital Expenditures
2001-2015 In $800 $2.8 Historic $261 $2.9 Forecast Successful SWCT Northern US NEEWS NU’s $1.449 20 Base 23 Millions 01 portion Billion Reliability $700 Million share 20 billion projects projects 02 Pass $600 completion Transmission estimated of 20NEEWS $845 HVDC 03 total Major $500 ramping 20millio
Source: SEC EDGAR · 425 filed May 11, 2011
More decks from Nstar
 Merger or Acquisition (February 2012)38 slides · Feb 29, 2012
 EEI Financial Conference 201151 slides · Nov 7, 2011
 EEI Financial Conference 201149 slides · Nov 7, 2011
 Barclays CEO Energy-Power Conference 201132 slides · Sep 8, 2011
 Williams Capital East Coast Conference 201137 slides · Aug 10, 2011
 Merger or Acquisition (March 2011)44 slides · Mar 10, 2011