Fibra MTY · BIVA:FMTY/14
Fibra MTY — Q3 2022 Earnings Presentation
16 slides from Fibra MTY's earnings presentation, October 2022
Slide 1: 3Q22 Quarterly Results Update
Sistema de Entrenamiento 3Q22 en Update Quartely Results Ciberseguridad Trust F/2157 – FMTY14 October,2022
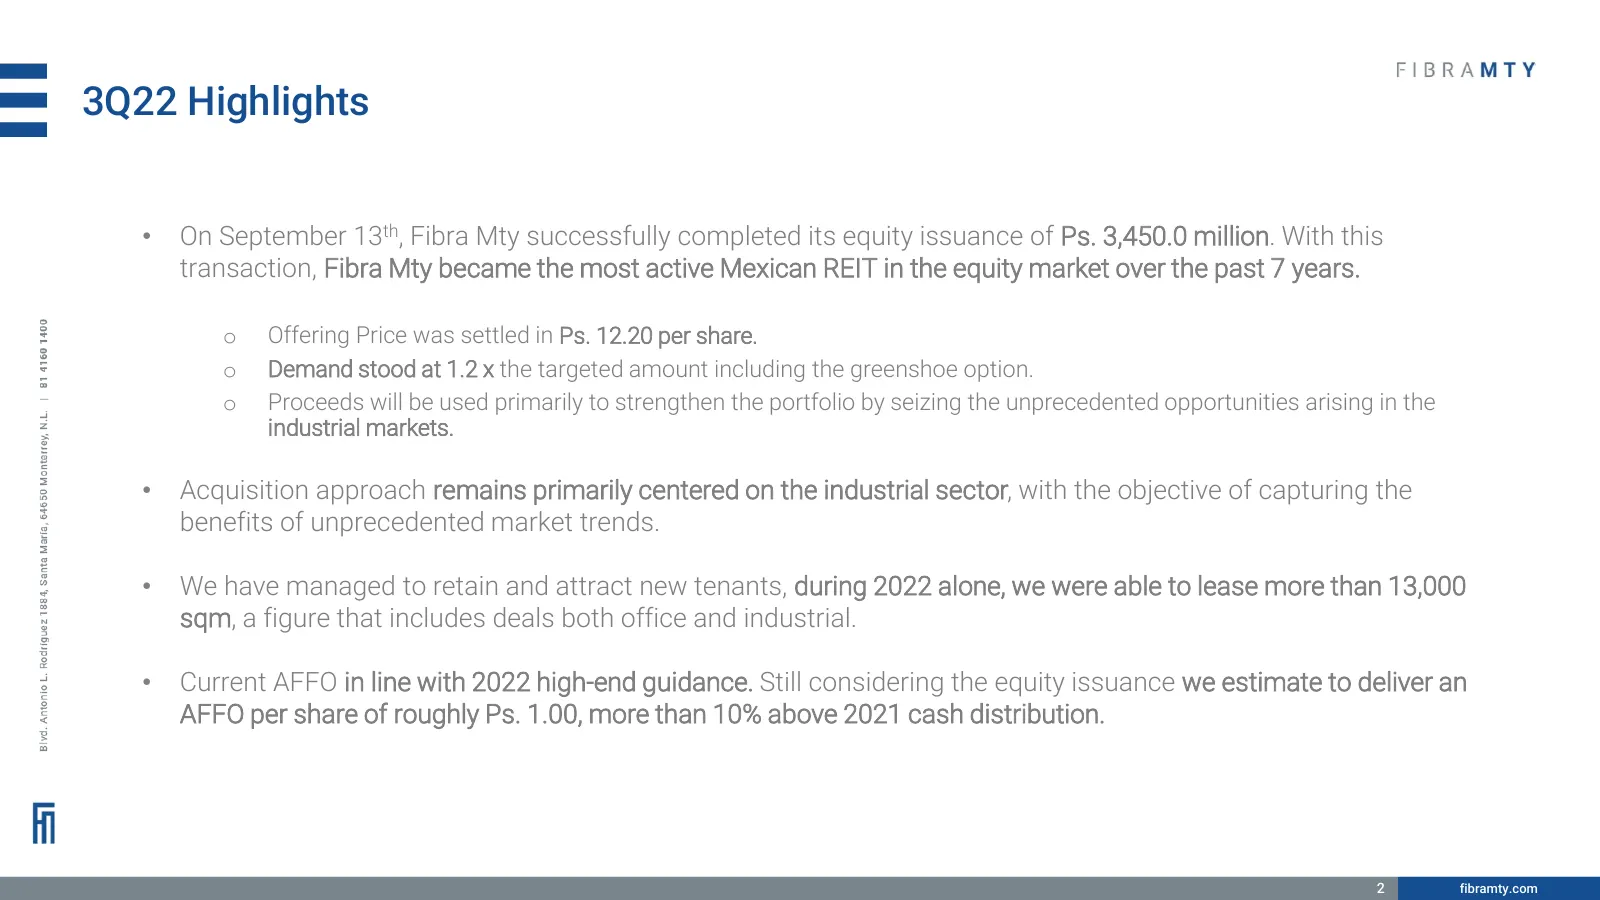
Slide 2: 3Q22 Highlights
3Q22 Highlights • On September 13th, Fibra Mty successfully completed its equity issuance of Ps. 3,450.0 million. With this transaction, Fibra Mty became the most active Mexican REIT in the equity market over the past 7 years. o Offering Price was settled in Ps. 12.20 per share. o Demand stood at 1.
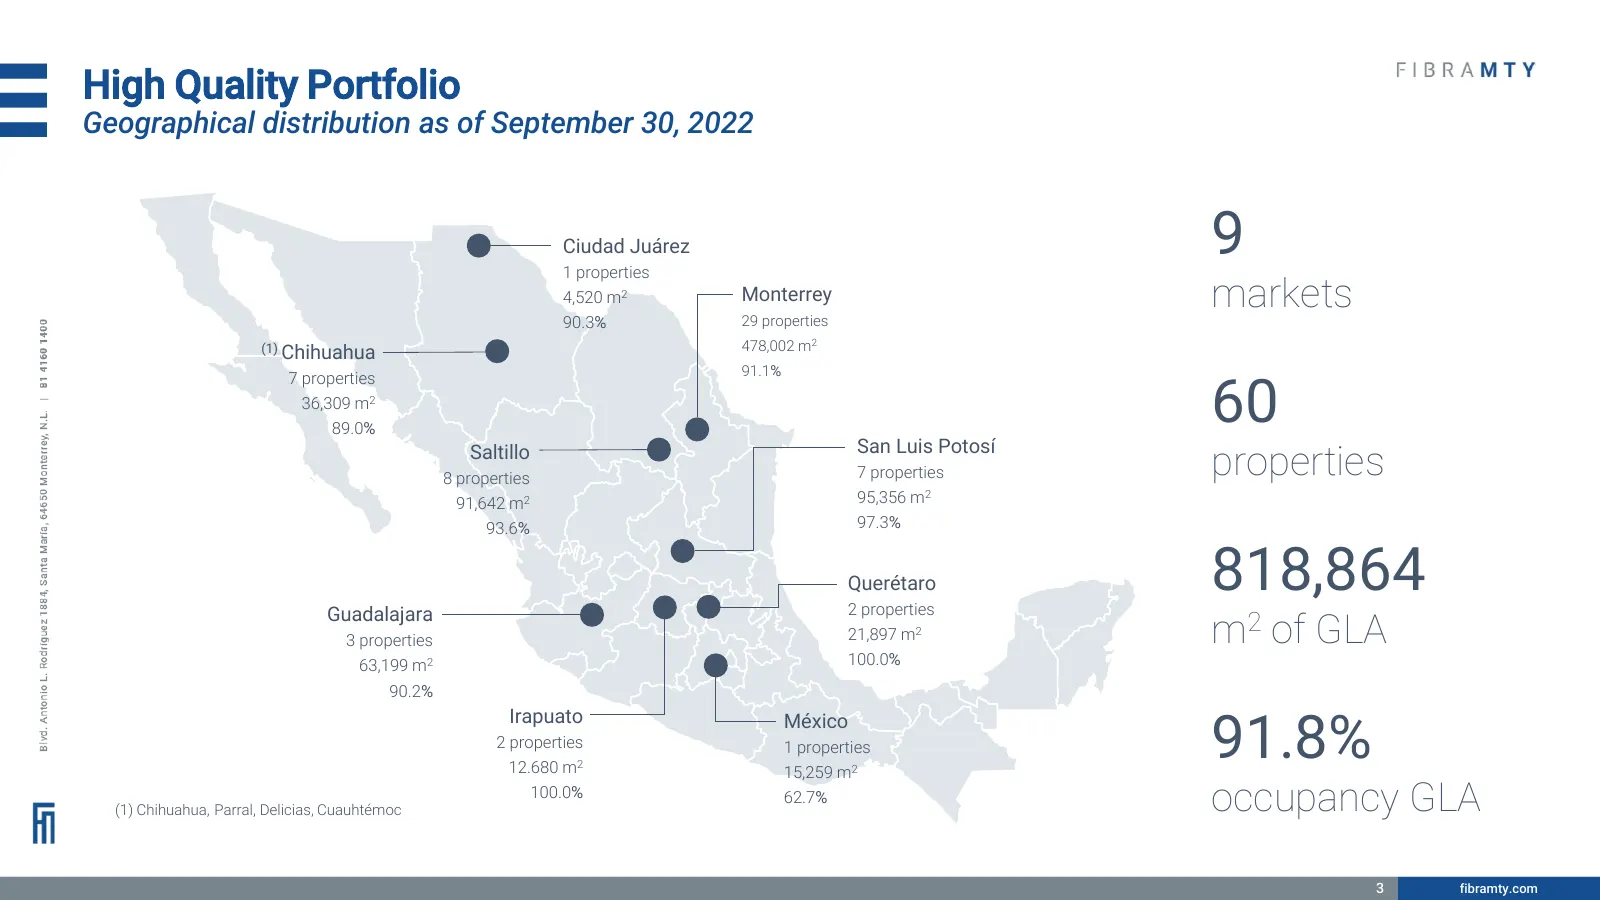
Slide 3: High Quality Portfolio
High Quality Portfolio Geographical distribution as of September 30, 2022 Ciudad Juárez 1 properties 9 4,520 m2 Monterrey 29 properties markets 90.3% (1) Chihuahua 478,002 m2 91.1% 60 7 properties 36,309 m2 89.0% San Luis Potosí Saltillo 8 properties 7 properties properties 91,642 m2 95,356 m2 93.6%
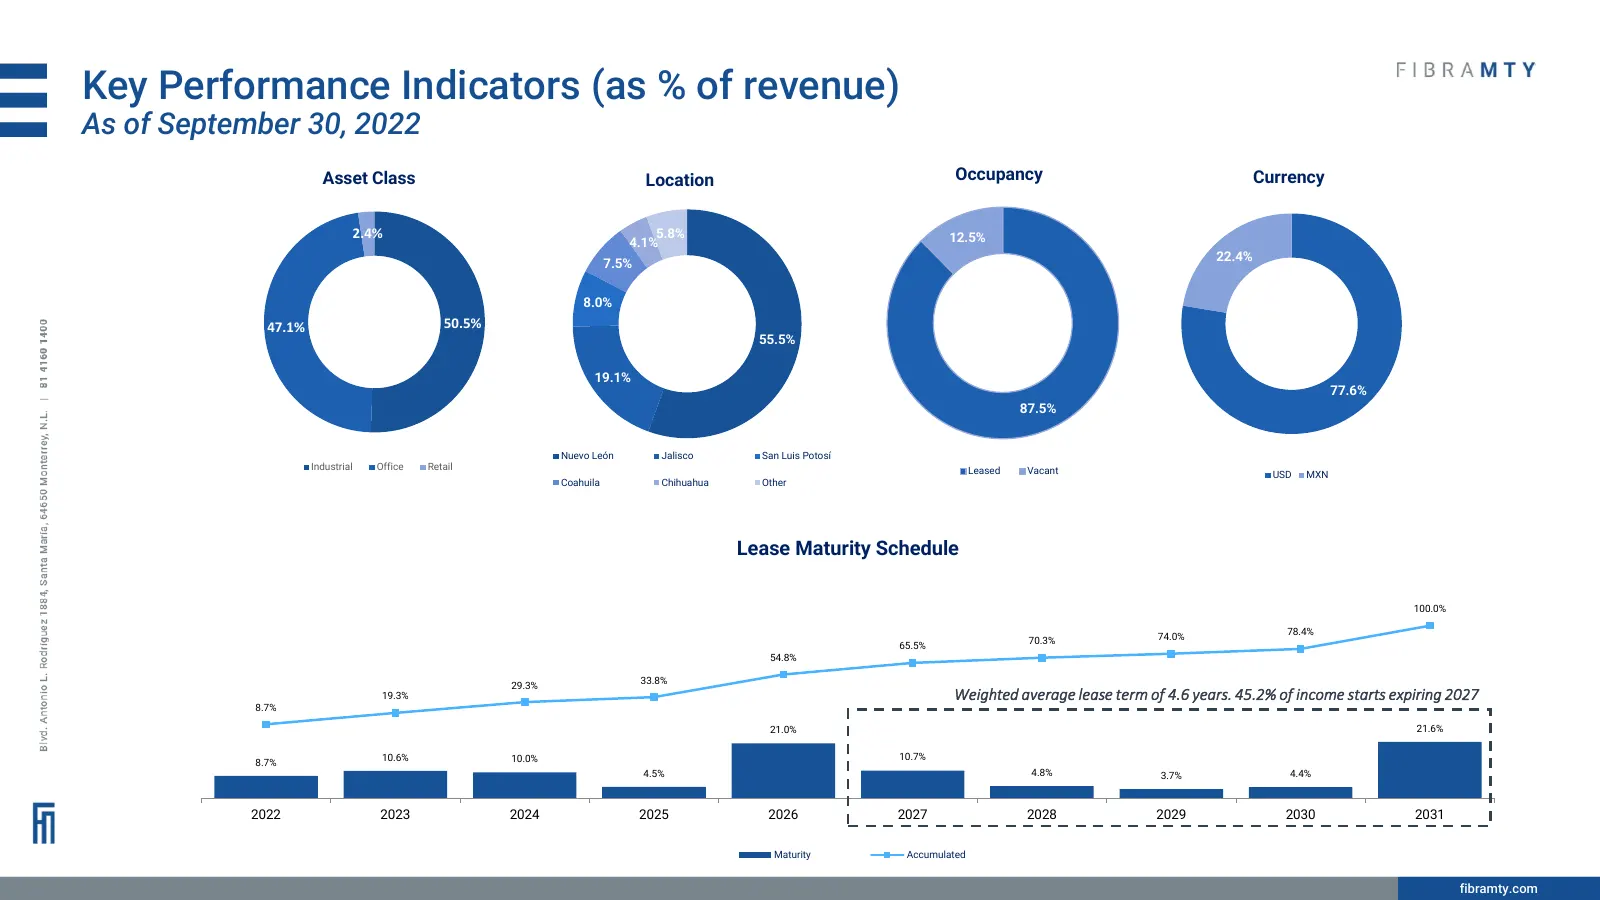
Slide 4: Key Performance Indicators (as % of revenue)
Key Performance Indicators (as % of revenue) As of September 30, 2022 Asset Class Location Occupancy Currency 2.4% 5.8% 12.5% 4.1% 22.4% 7.5% 8.0% 47.1% 50.5% 55.5% 19.1% 77.6% 87.5% Nuevo León Jalisco San Luis Potosí 4 Industrial Office Retail Leased Vacant USD MXN Coahuila Chihuahua Other Lease Ma
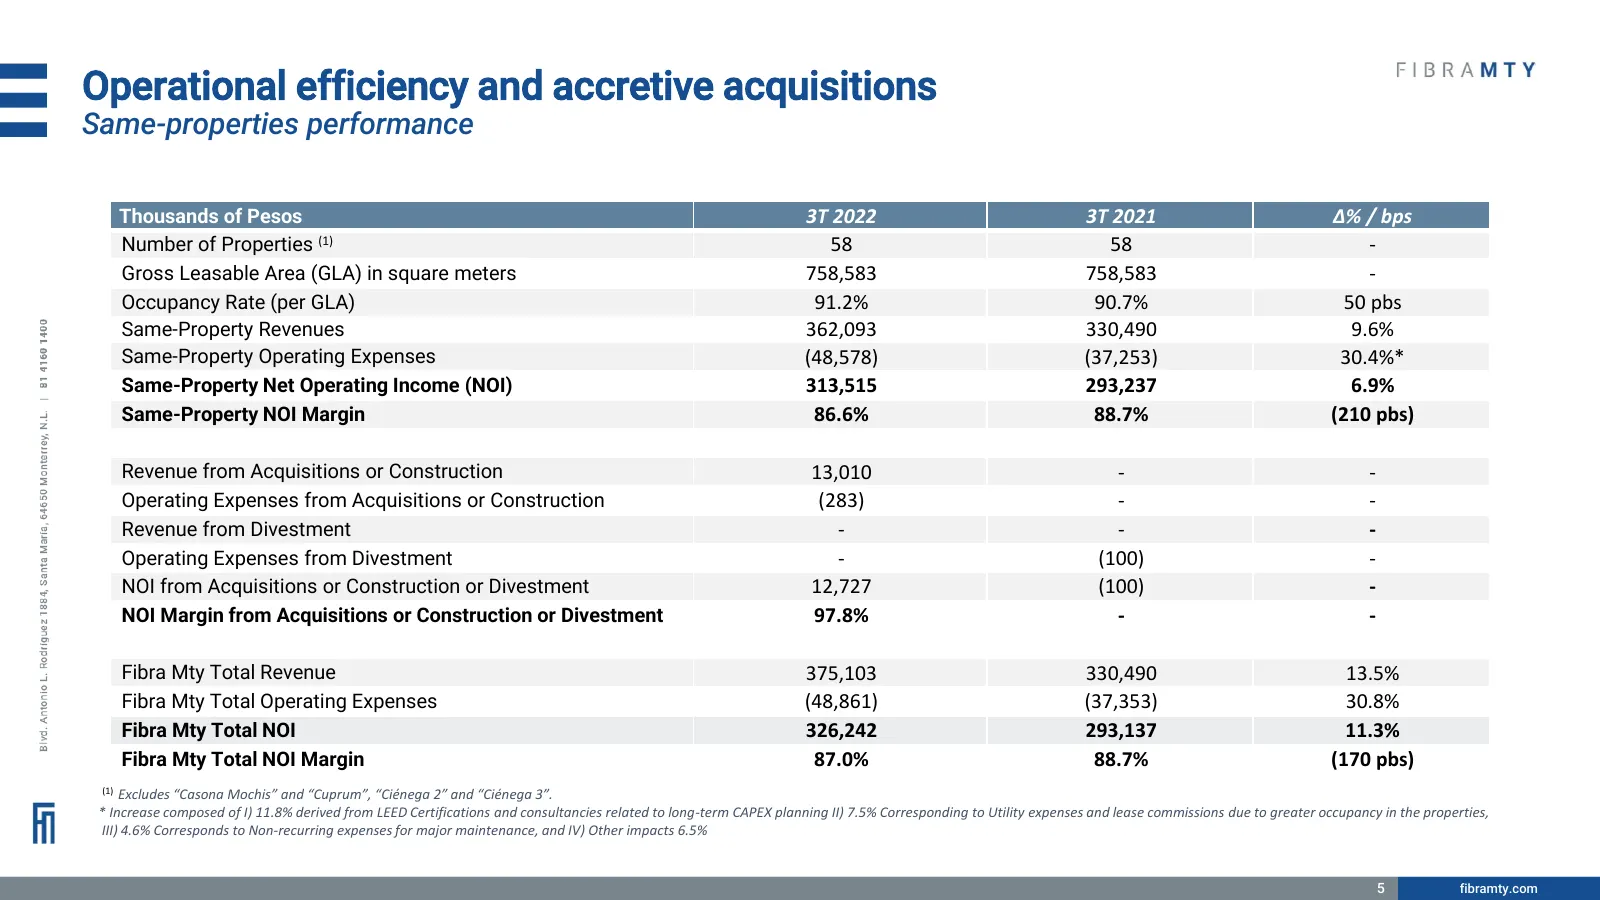
Slide 5: Operational efficiency and accretive acquisitions
Operational efficiency and accretive acquisitions Same-properties performance Thousands of Pesos 3T 2022 3T 2021 Δ% / bps Number of Properties (1) 58 58 - Gross Leasable Area (GLA) in square meters 758,583 758,583 - Occupancy Rate (per GLA) 91.2% 90.7% 50 pbs Same-Property Revenues 362,093 330,490 9
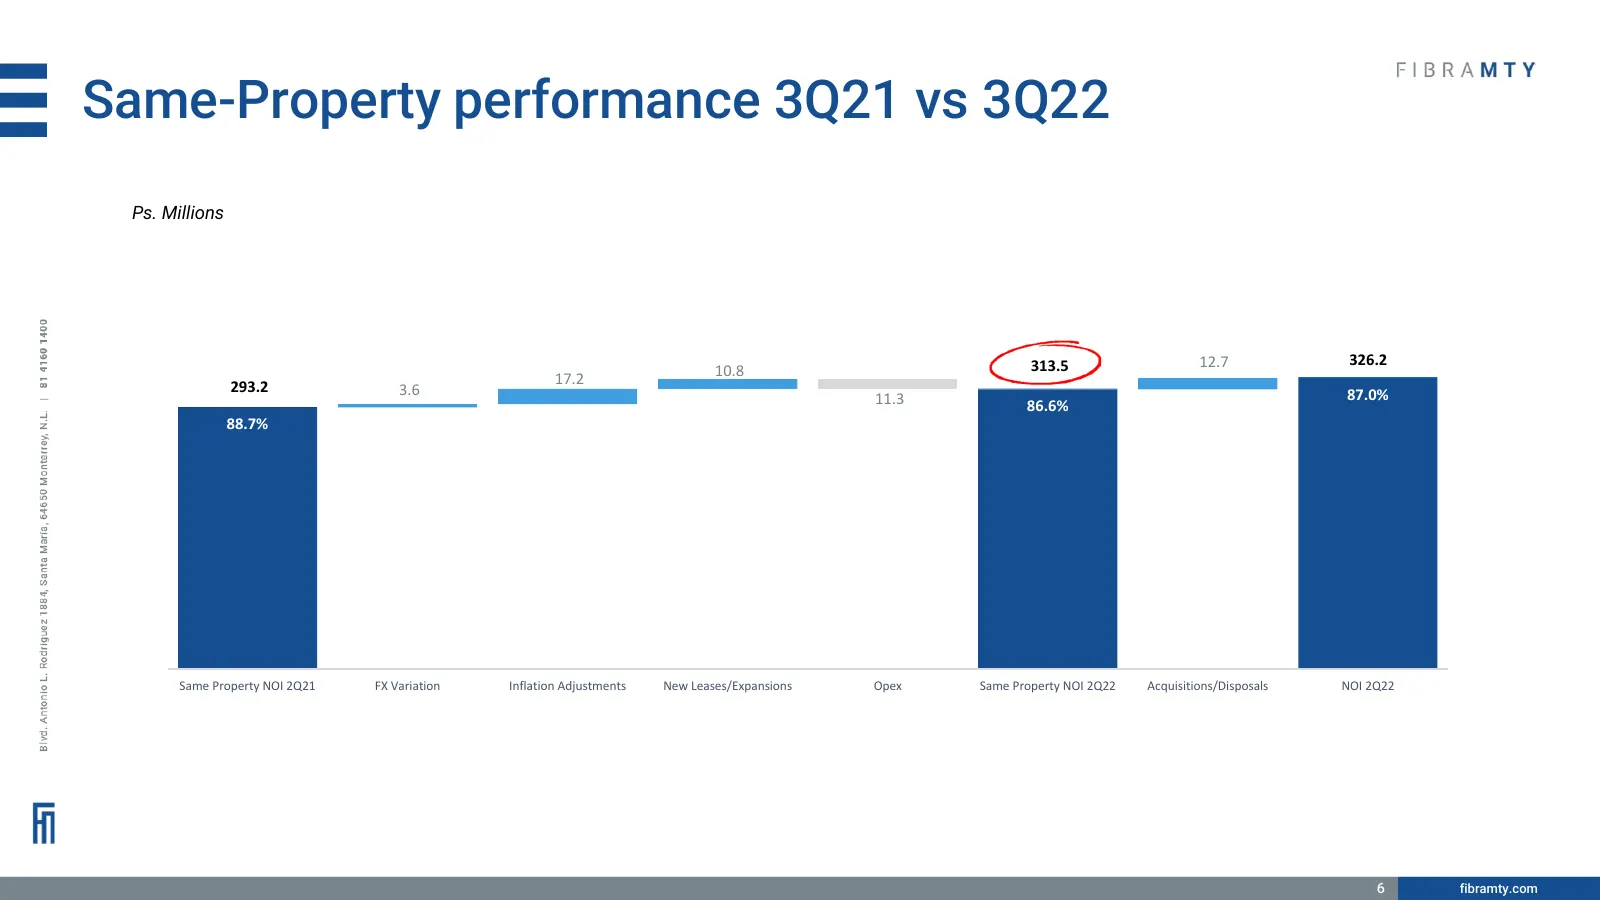
Slide 6: Same-Property performance 3Q21 vs 3Q22
Same-Property performance 3Q21 vs 3Q22 Ps. Millions 313.5 12.7 326.2 17.2 10.8 293.2 3.6 11.3 87.0% 86.6% 88.7% Same Property NOI 2Q21 FX Variation Inflation Adjustments New Leases/Expansions Opex Same Property NOI 2Q22 Acquisitions/Disposals NOI 2Q22 6 fibramty.com
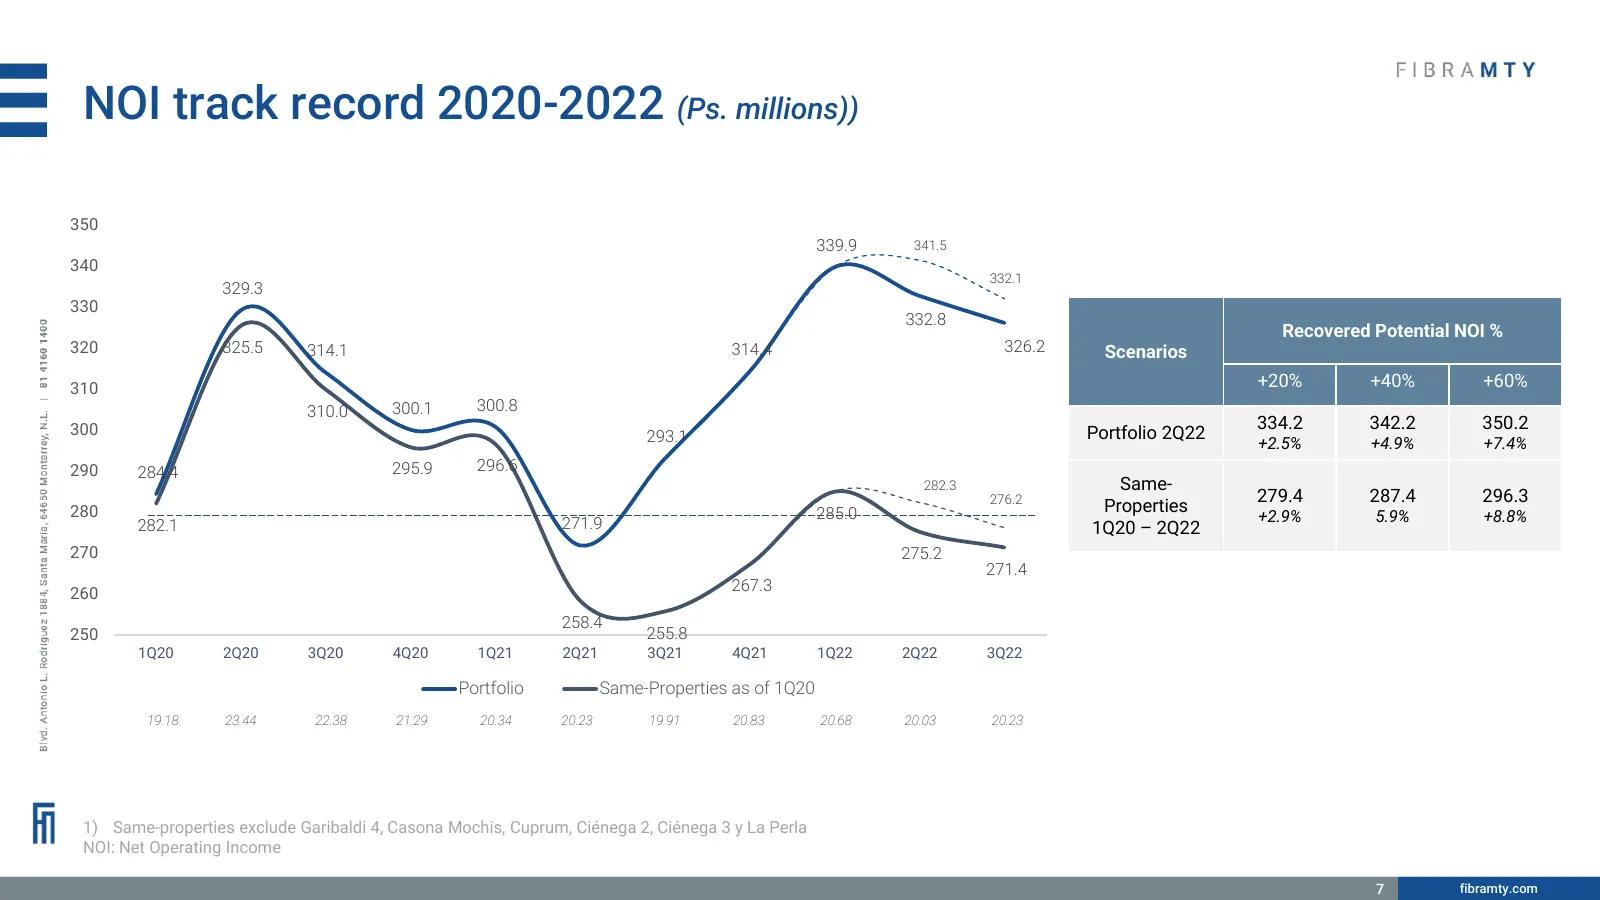
Slide 7: NOI track record 2020-2022
NOI track record 2020-2022 (Ps. millions)) 350 339.9 341.5 340 332.1 329.3 330 332.8 Recovered Potential NOI % 320 325.5 314.1 314.4 326.2 Scenarios 310 +20% +40% +60% 310.0 300.1 300.8 300 334.2 342.2 350.2 293.1 Portfolio 2Q22 +2.5% +4.9% +7.4% 290 284.4 295.9 296.6 282.3 Same- 276.2 279.4 287.4 2
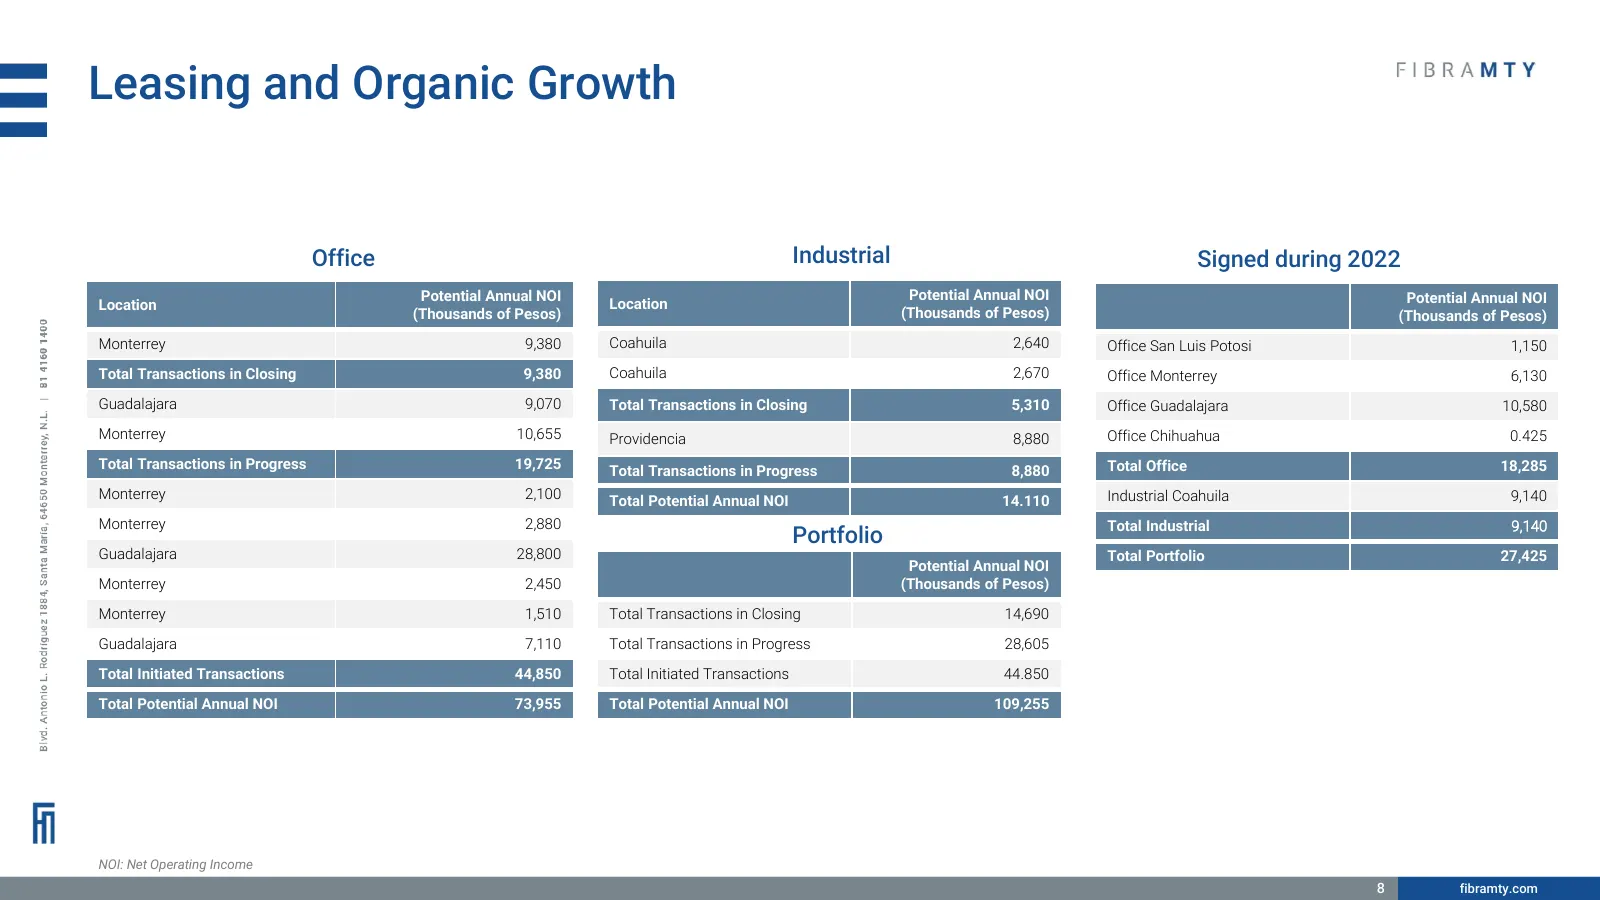
Slide 8: Leasing and Organic Growth
Leasing and Organic Growth Office Industrial Signed during 2022 Potential Annual NOI Potential Annual NOI Potential Annual NOI Location Location (Thousands of Pesos) (Thousands of Pesos) (Thousands of Pesos) Monterrey 9,380 Coahuila 2,640 Office San Luis Potosi 1,150 Total Transactions in Closing 9,
Slide 9: Acquisitions
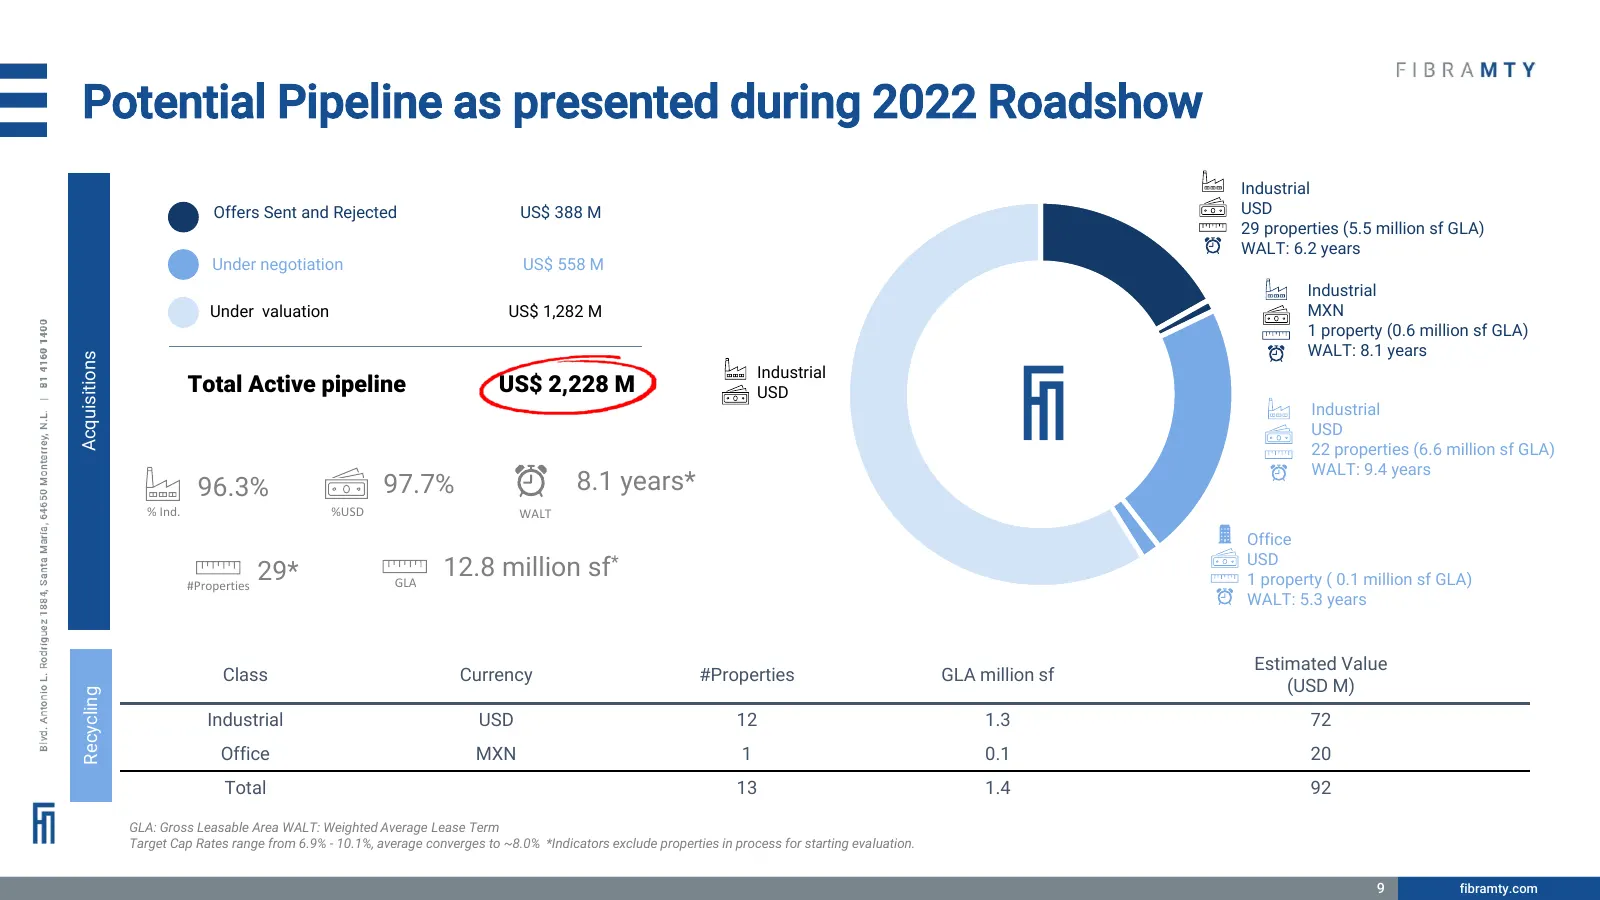
Potential Pipeline as presented during 2022 Roadshow Industrial Offers Sent and Rejected US$ 388 M USD 29 properties (5.5 million sf GLA) WALT: 6.2 years Under negotiation US$ 558 M Industrial Under valuation US$ 1,282 M MXN 1 property (0.6 million sf GLA) WALT: 8.1 years Acquisitions Industrial Tot
Slide 10: Ps. 3.45 Billion Follow On Summary
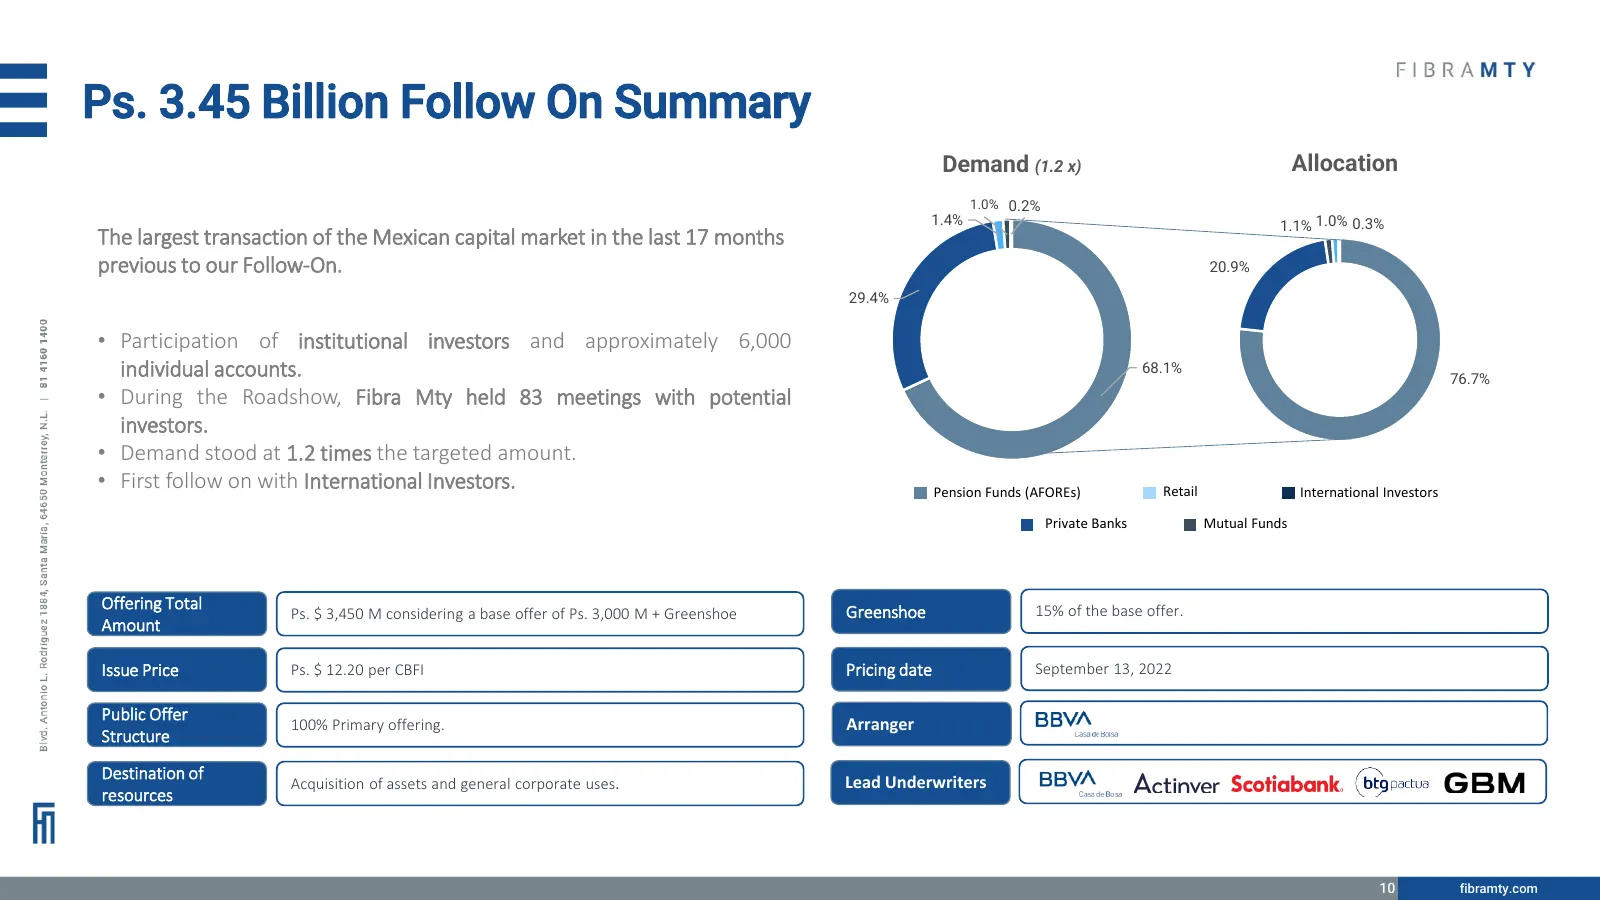
Ps. 3.45 Billion Follow On Summary Demand (1.2 x) Allocation 1.0% 0.2% 1.4% 1.1% 1.0% 0.3% The largest transaction of the Mexican capital market in the last 17 months previous to our Follow-On. 20.9% 29.4% • Participation of institutional investors and approximately 6,000 individual accounts. 68.1%
Slide 11: Marketability Index
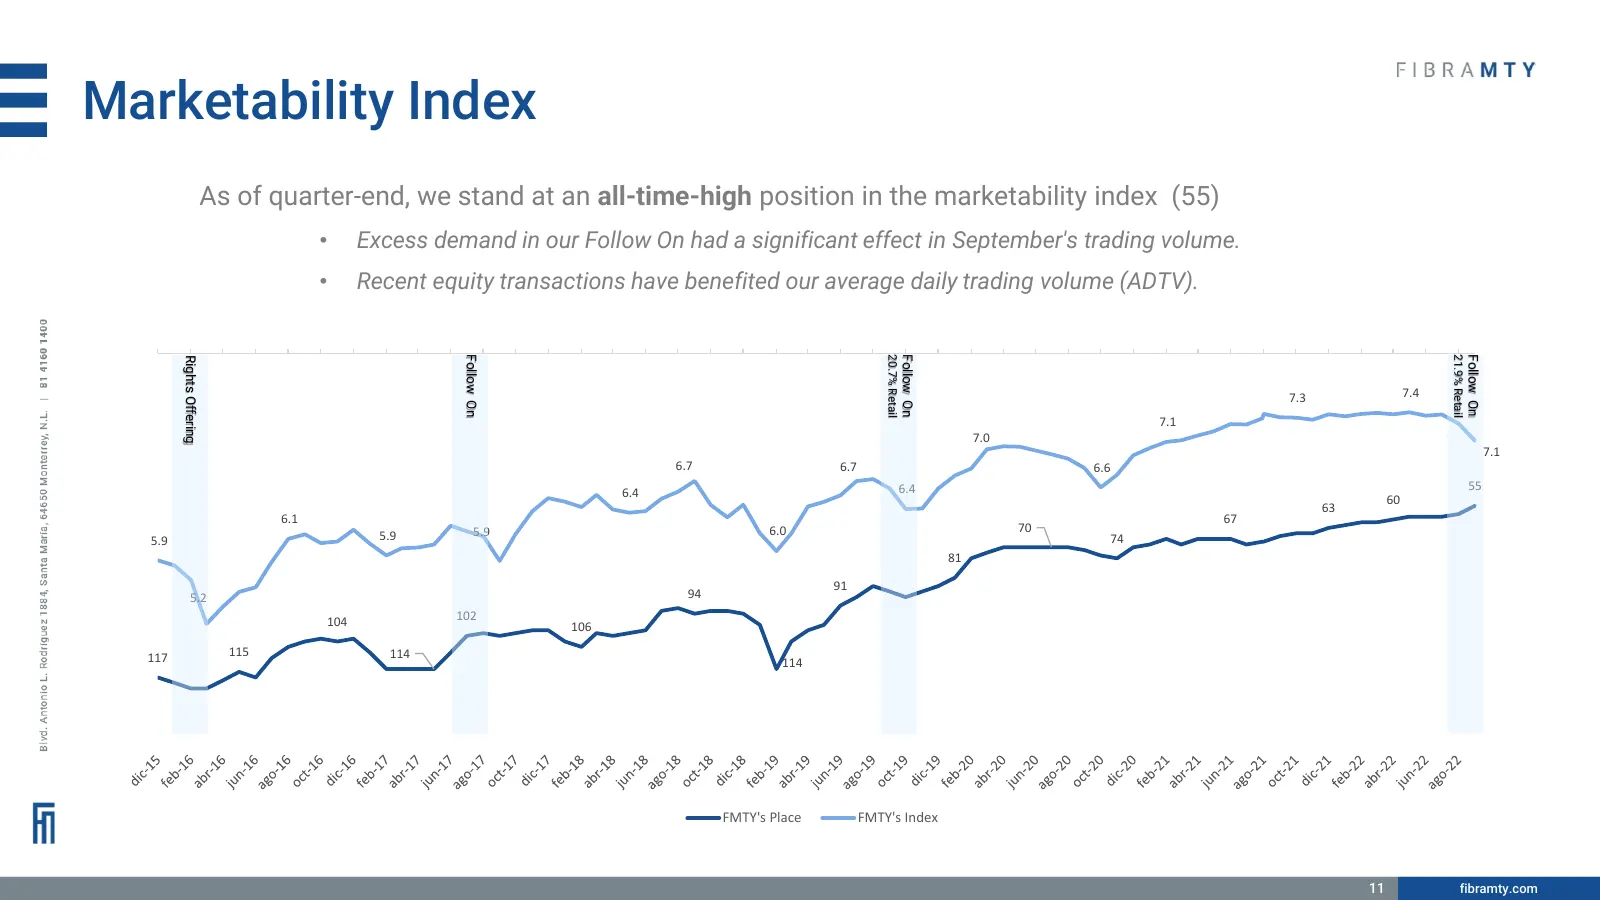
Marketability Index As of quarter-end, we stand at an all-time-high position in the marketability index (55) • Excess demand in our Follow On had a significant effect in September's trading volume. • Recent equity transactions have benefited our average daily trading volume (ADTV). 0 8.0 21.9% Retai
Slide 12: 3Q22 Cash Flow Results vs 3Q21
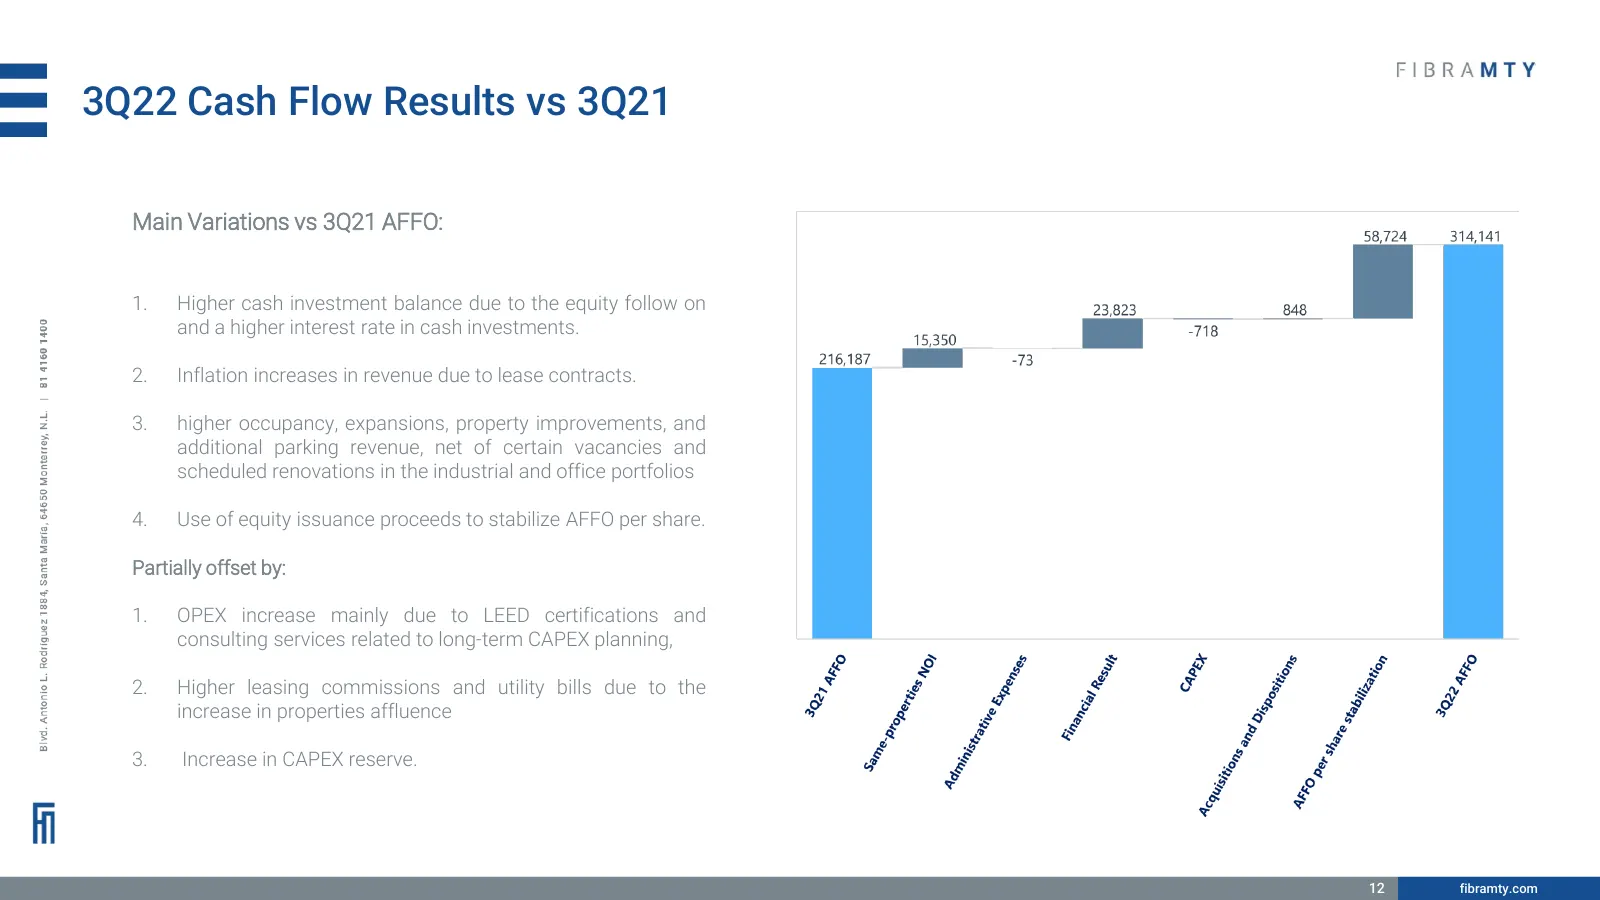
3Q22 Cash Flow Results vs 3Q21 Main Variations vs 3Q21 AFFO: 1. Higher cash investment balance due to the equity follow on and a higher interest rate in cash investments. 2. Inflation increases in revenue due to lease contracts. 3. higher occupancy, expansions, property improvements, and additional
Slide 13: 3Q22 Cash Flow Results vs 2Q22
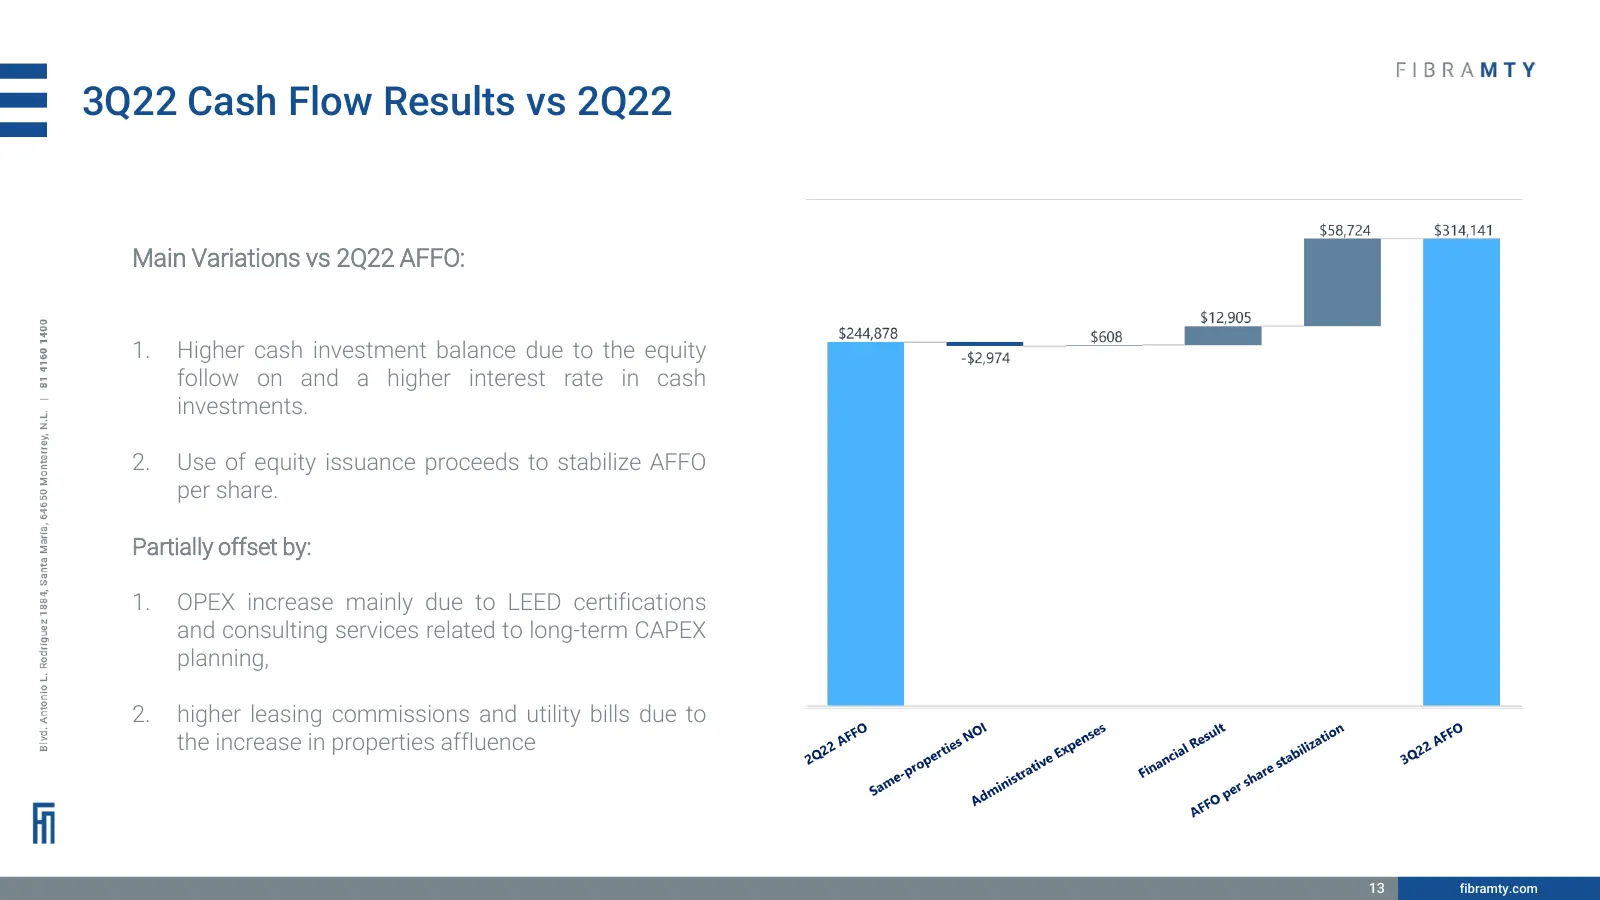
3Q22 Cash Flow Results vs 2Q22 Main Variations vs 2Q22 AFFO: 1. Higher cash investment balance due to the equity follow on and a higher interest rate in cash investments. 2. Use of equity issuance proceeds to stabilize AFFO per share. Partially offset by: 1. OPEX increase mainly due to LEED certific
Slide 14: Solid Balance Sheet
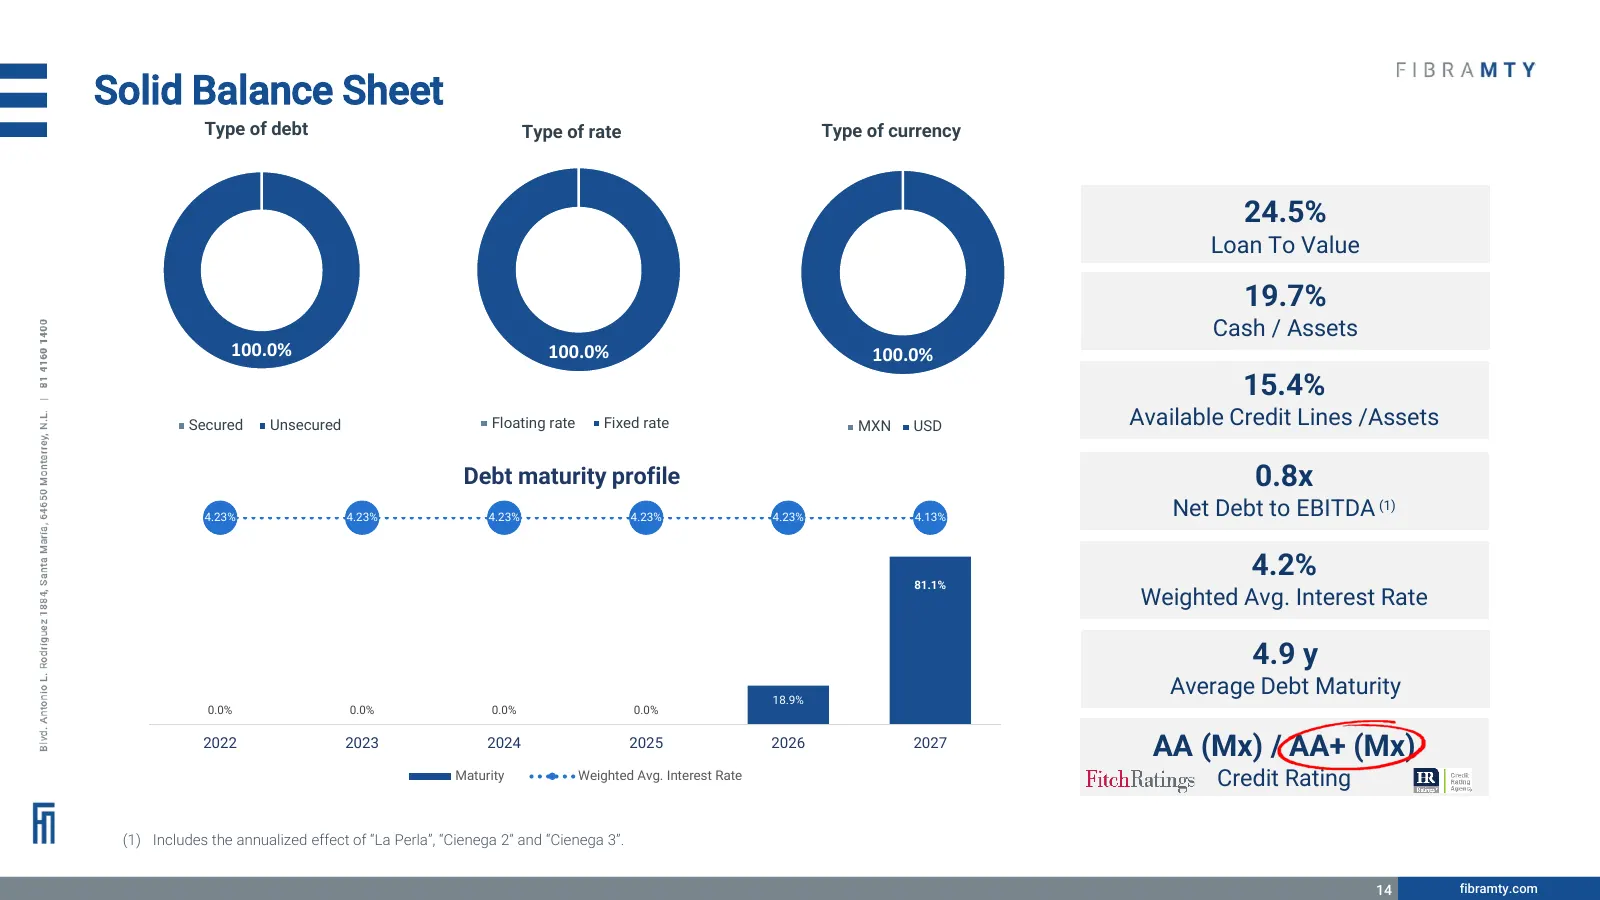
Solid Balance Sheet Type of debt Type of rate Type of currency 24.5% Loan To Value 19.7% Cash / Assets 100.0% 100.0% 100.0% 15.4% Secured Unsecured Floating rate Fixed rate MXN USD Available Credit Lines /Assets Debt maturity profile 0.8x 4.23% 4.23% 4.23% 4.23% 4.23% 4.13% Net Debt to EBITDA (1) 81
Slide 15: Selected Financial Information
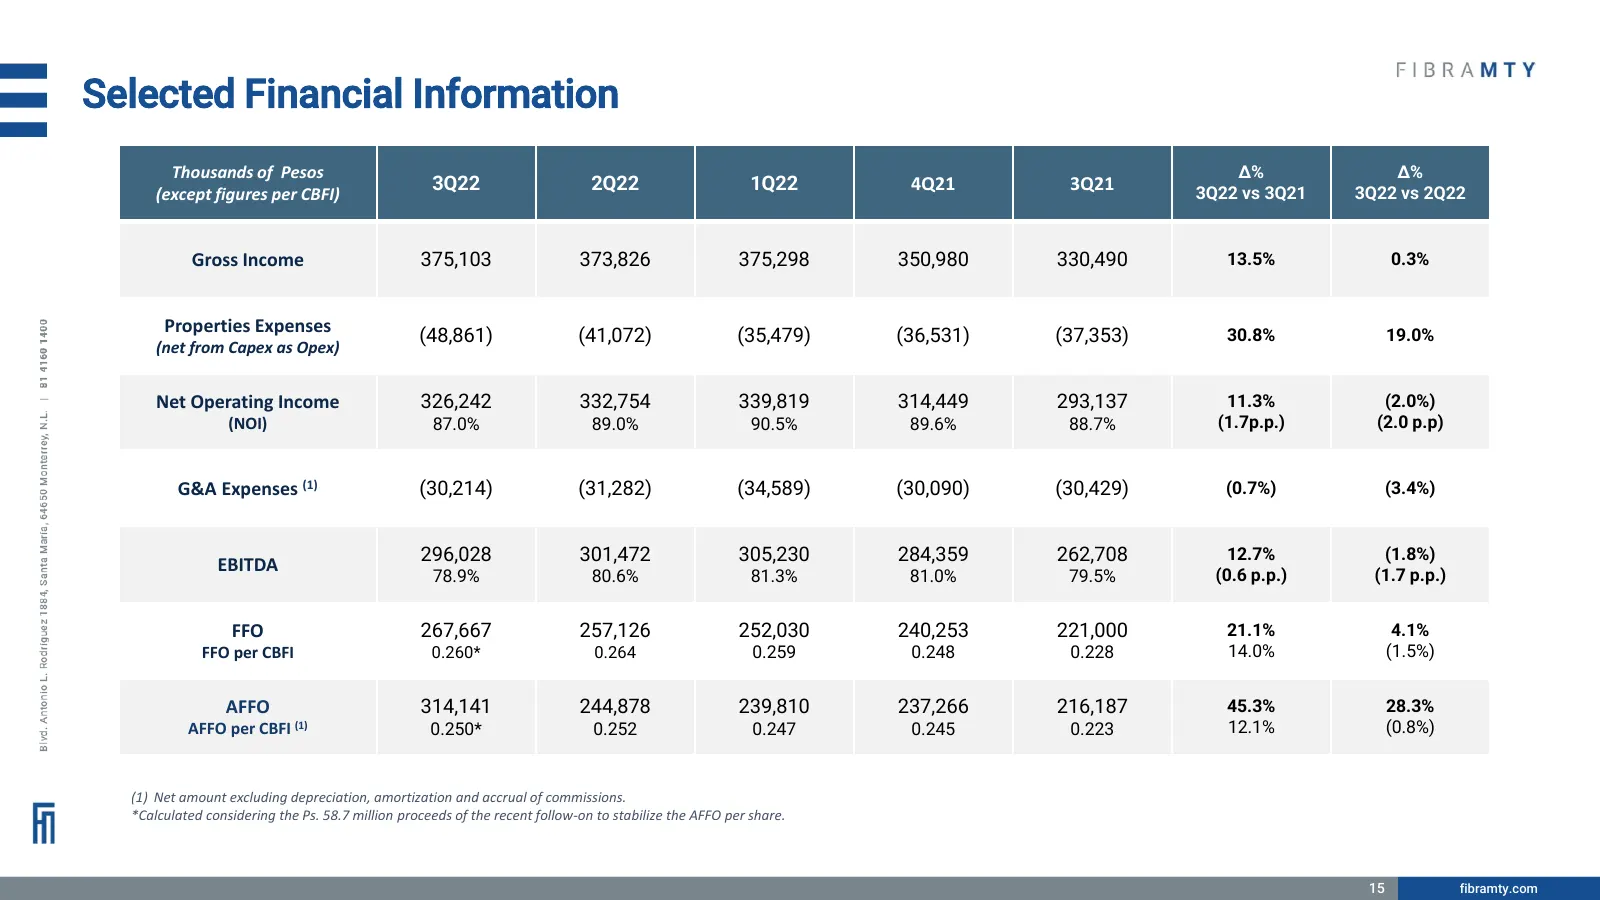
Selected Financial Information Thousands of Pesos Δ% Δ% 3Q22 2Q22 1Q22 4Q21 3Q21 3Q22 vs 3Q21 3Q22 vs 2Q22 (except figures per CBFI) Gross Income 375,103 373,826 375,298 350,980 330,490 13.5% 0.3% Properties Expenses (48,861) (41,072) (35,479) (36,531) (37,353) 30.8% 19.0% (net from Capex as Opex) N
Slide 16: Contact
Sistema de Entrenamiento en Ciberseguridad Contact: Cesar Rubalcava, CFA, CAIA Investor Relations crubalcava@fibramty.com
Source: Internet Archive copy of investorcloud.s3.amazonaws.com
More decks from Fibra MTY
 Q3 2024 Earnings Presentation24 slides · October 2024
 Q1 2024 Earnings Presentation18 slides · April 2024
 Q4 2023 Earnings Presentation16 slides · February 2024
 Q3 2023 Earnings Presentation16 slides · October 2023
 Q2 2023 Earnings Presentation17 slides · July 2023
 Q1 2023 Earnings Presentation16 slides · April 2023