Fibra MTY · BIVA:FMTY/14
Fibra MTY — Q1 2024 Earnings Presentation
18 slides from Fibra MTY's earnings presentation, April 2024
Slide 1: 1Q24 Quarterly Results Update
Sistema de Entrenamiento 1Q24 en Update Quarterly Results Ciberseguridad Trust F/2157 – FMTY14 April 2024
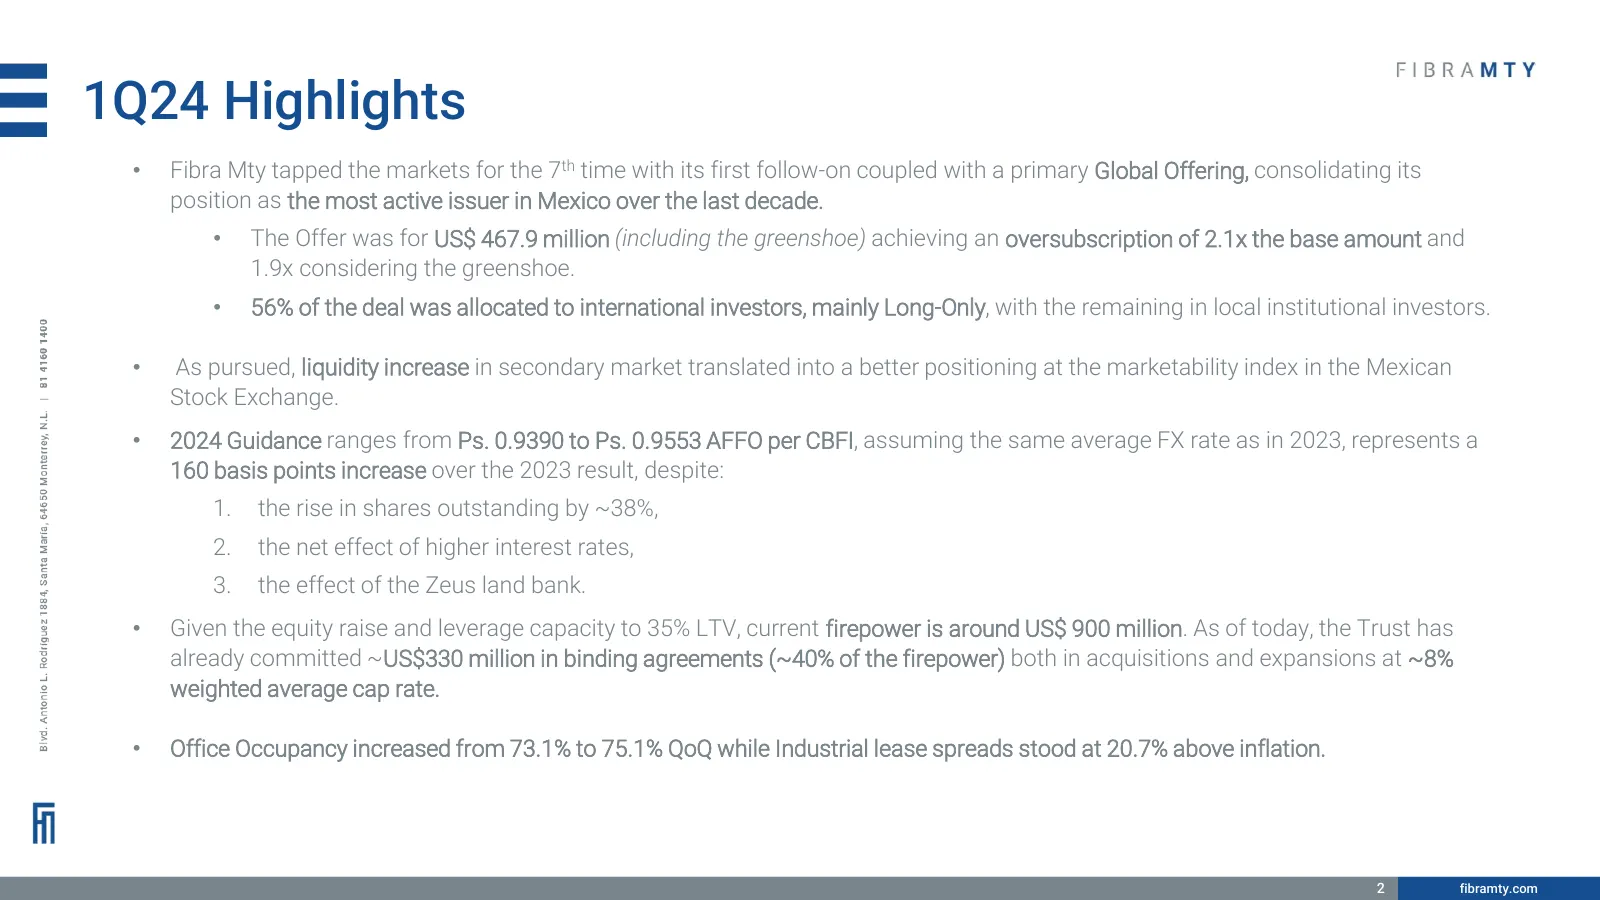
Slide 2: 1Q24 Highlights
1Q24 Highlights • Fibra Mty tapped the markets for the 7th time with its first follow-on coupled with a primary Global Offering, consolidating its position as the most active issuer in Mexico over the last decade. • The Offer was for US$ 467.9 million (including the greenshoe) achieving an oversubsc
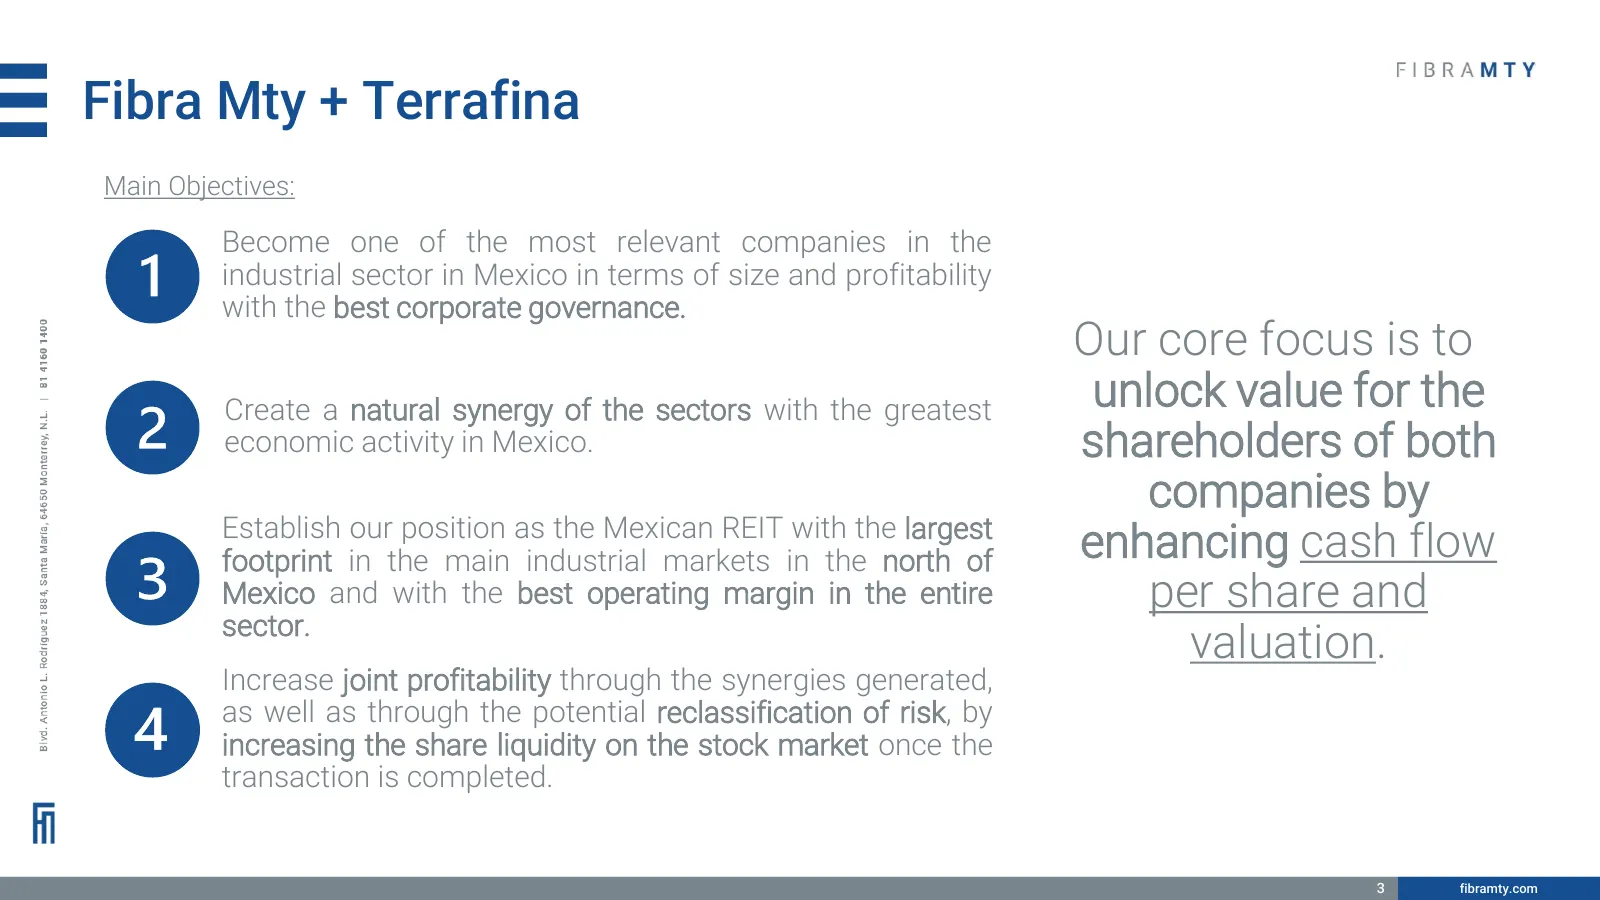
Slide 3: Fibra Mty + Terrafina
Fibra Mty + Terrafina Main Objectives: Become one of the most relevant companies in the industrial sector in Mexico in terms of size and profitability with the best corporate governance. Our core focus is to Create a natural synergy of the sectors with the greatest unlock value for the economic acti
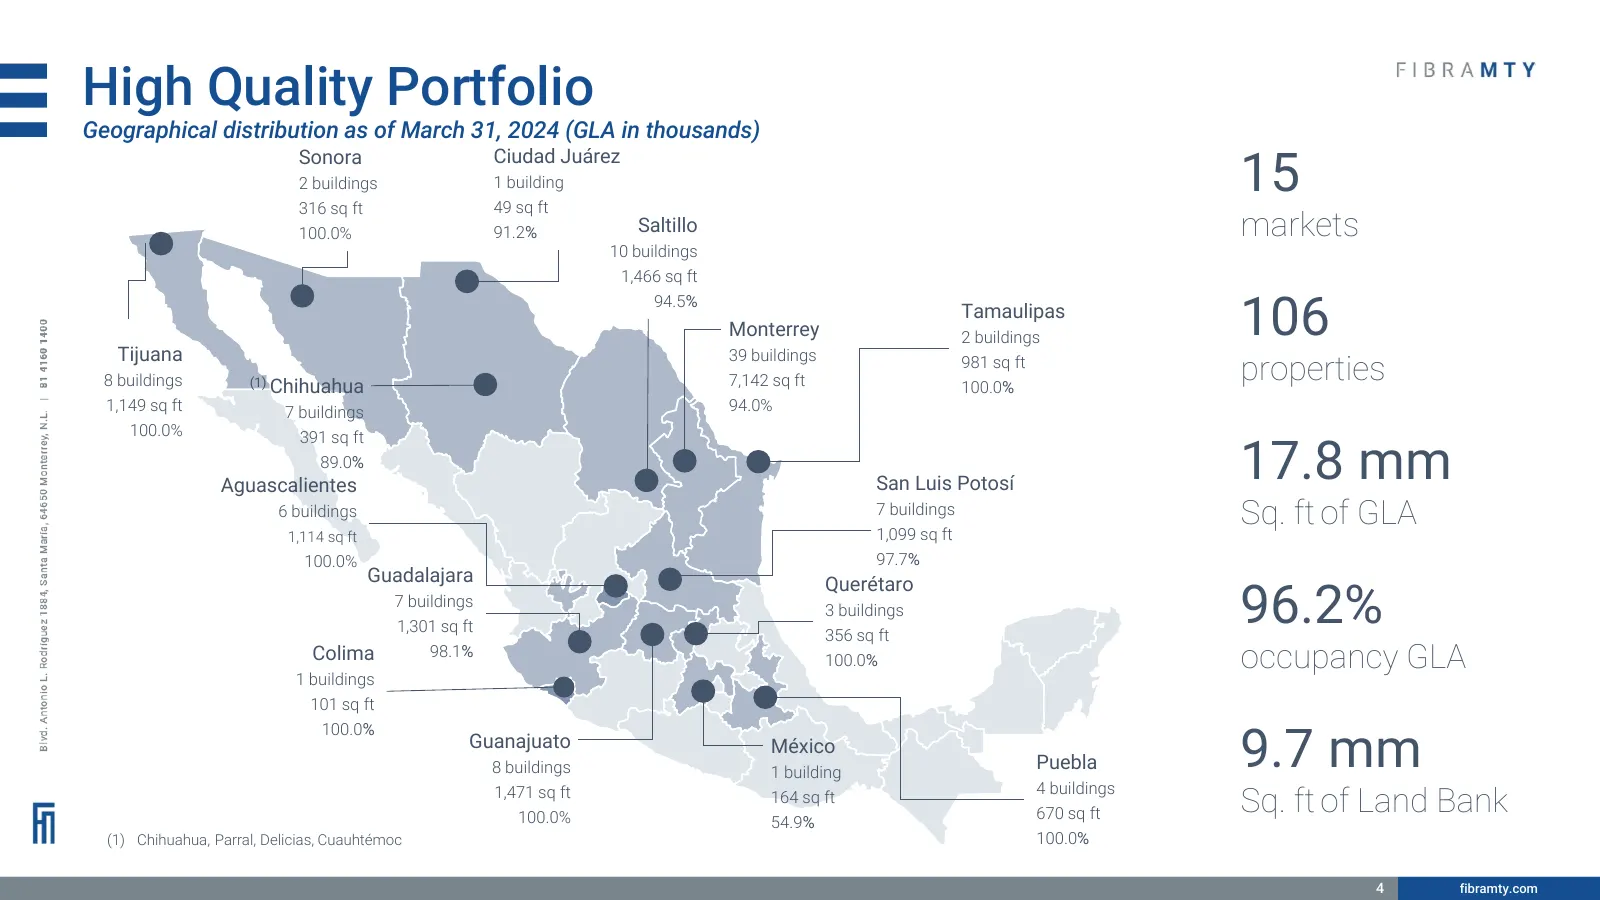
Slide 4: High Quality Portfolio
High Quality Portfolio Geographical distribution as of March 31, 2024 (GLA in thousands) 15 Sonora Ciudad Juárez 2 buildings 1 building 316 sq ft 49 sq ft 100.0% 91.2% Saltillo markets 10 buildings 1,466 sq ft 106 94.5% Tamaulipas Monterrey 2 buildings Tijuana 39 buildings 8 buildings (1) Chihuahua
Slide 5: Key Performance Indicators (as % of revenue)
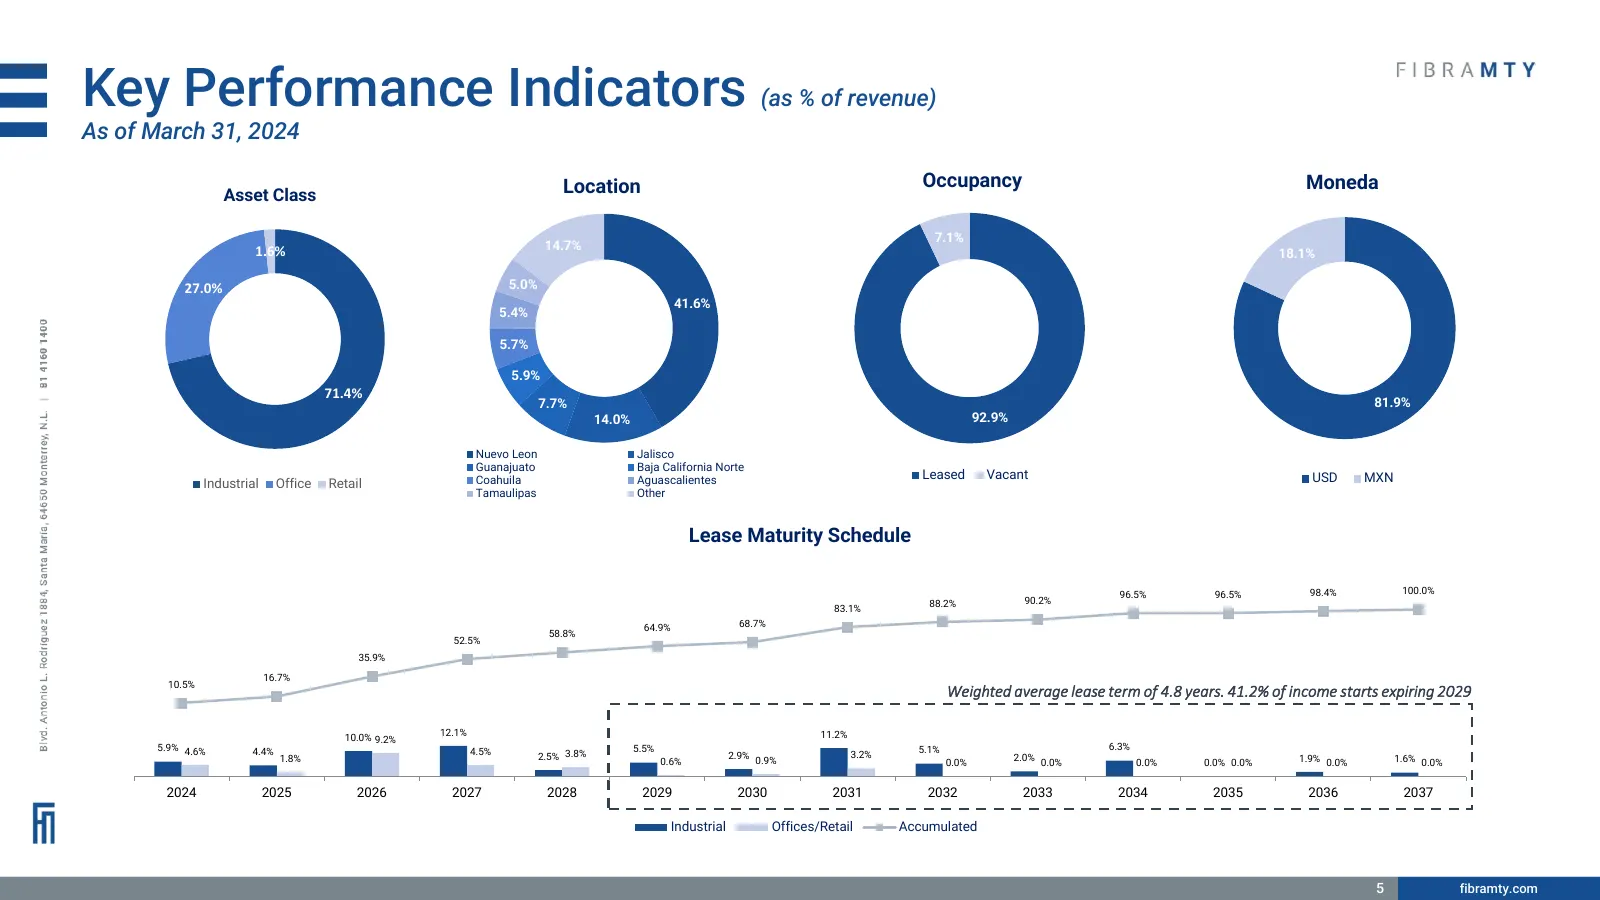
Key Performance Indicators (as % of revenue) As of March 31, 2024 Location Occupancy Moneda Asset Class 7.1% 1.6% 14.7% 18.1% 27.0% 5.0% 41.6% 5.4% 5.7% 5.9% 71.4% 7.7% 81.9% 14.0% 92.9% Nuevo Leon Jalisco Guanajuato Baja California Norte Coahuila Aguascalientes Leased Vacant USD MXN Industrial Offi
Slide 6: Operational efficiency and accretive acquisitions
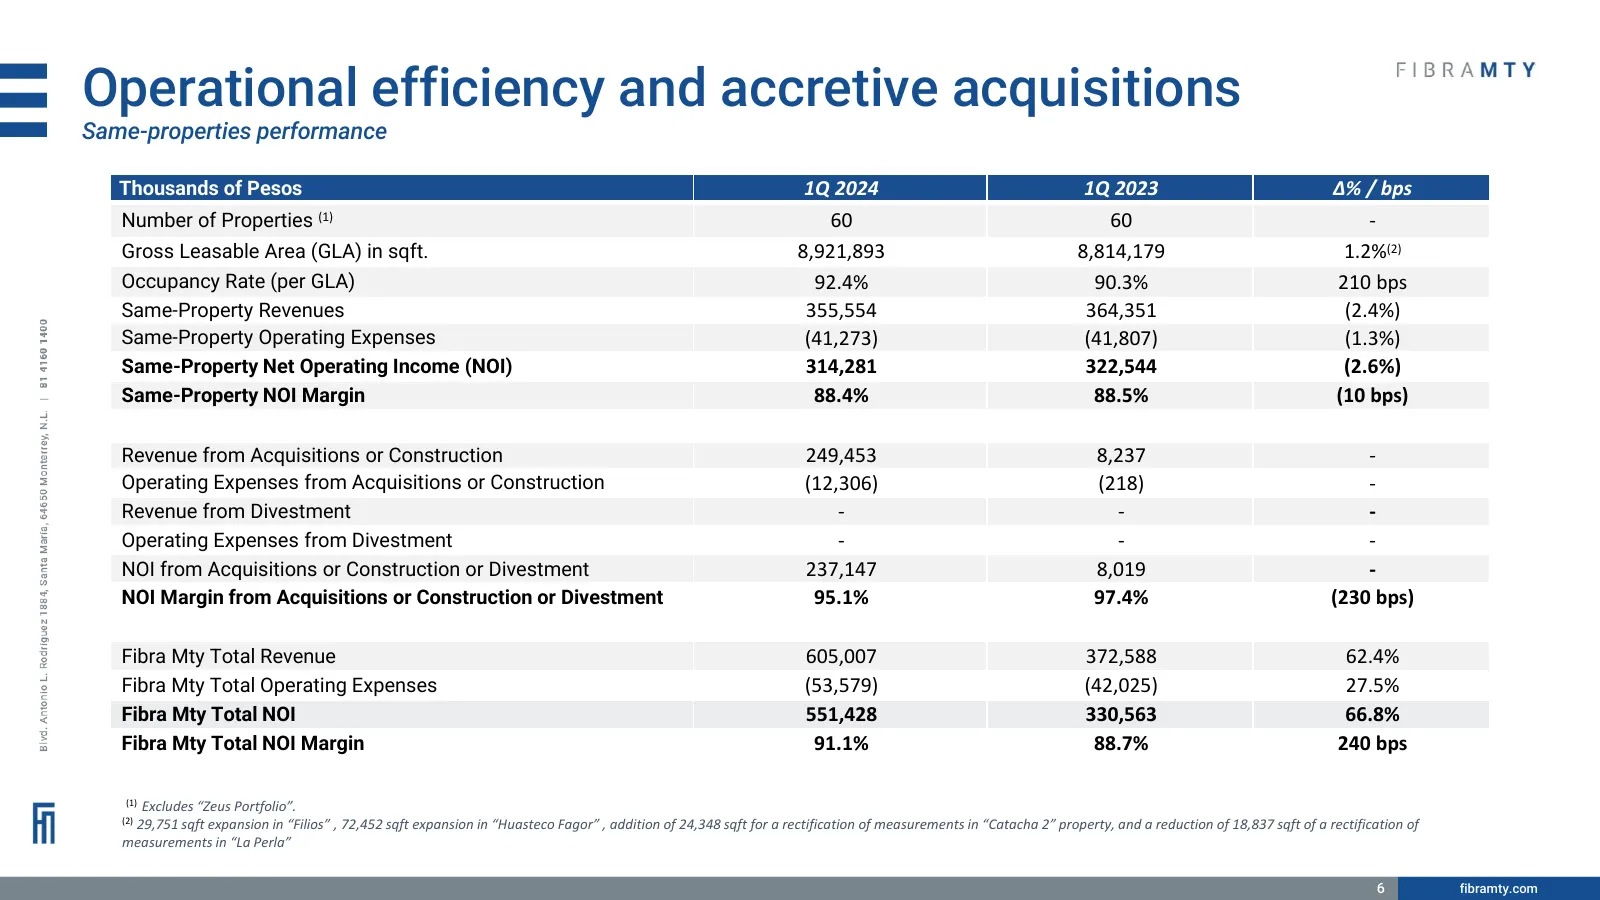
Operational efficiency and accretive acquisitions Same-properties performance Thousands of Pesos 1Q 2024 1Q 2023 Δ% / bps Number of Properties (1) 60 60 - Gross Leasable Area (GLA) in sqft. 8,921,893 8,814,179 1.2%(2) Occupancy Rate (per GLA) 92.4% 90.3% 210 bps Same-Property Revenues 355,554 364,35
Slide 7: Property performance 1Q24 vs 1Q23
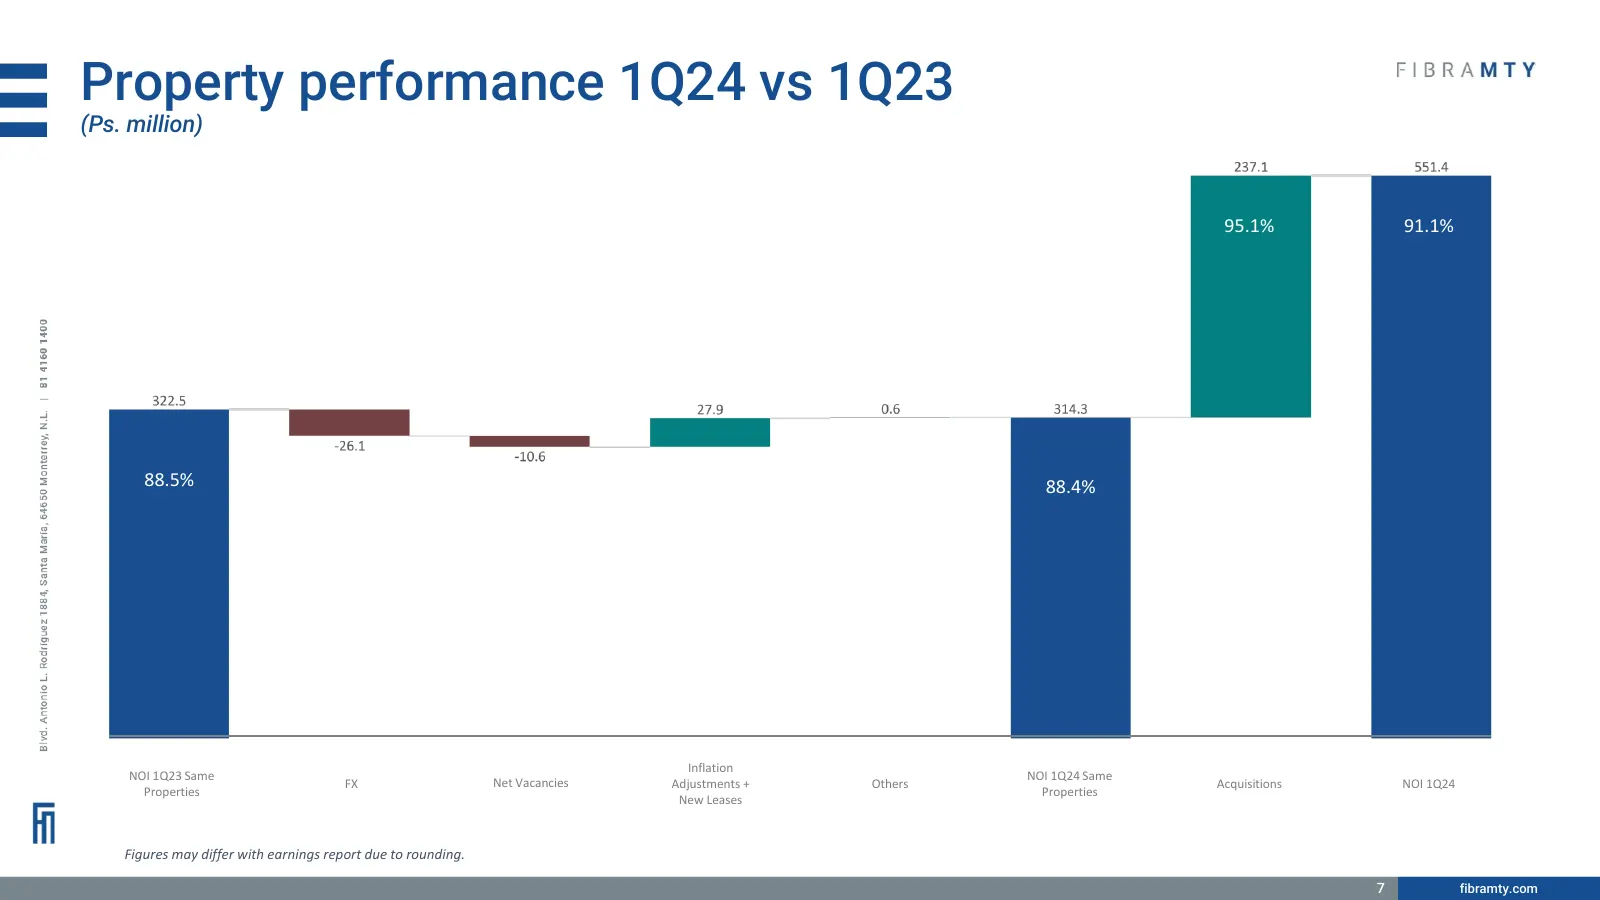
Property performance 1Q24 vs 1Q23 (Ps. million) 95.1% 91.1% 88.5% 88.4% Inflation NOI 1Q23 Same NOI 1Q24 Same FX Net Vacancies Adjustments + Others Acquisitions NOI 1Q24 Properties Properties New Leases Figures may differ with earnings report due to rounding. 7 fibramty.com
Slide 8: Investment Properties 1Q24 vs 1Q23
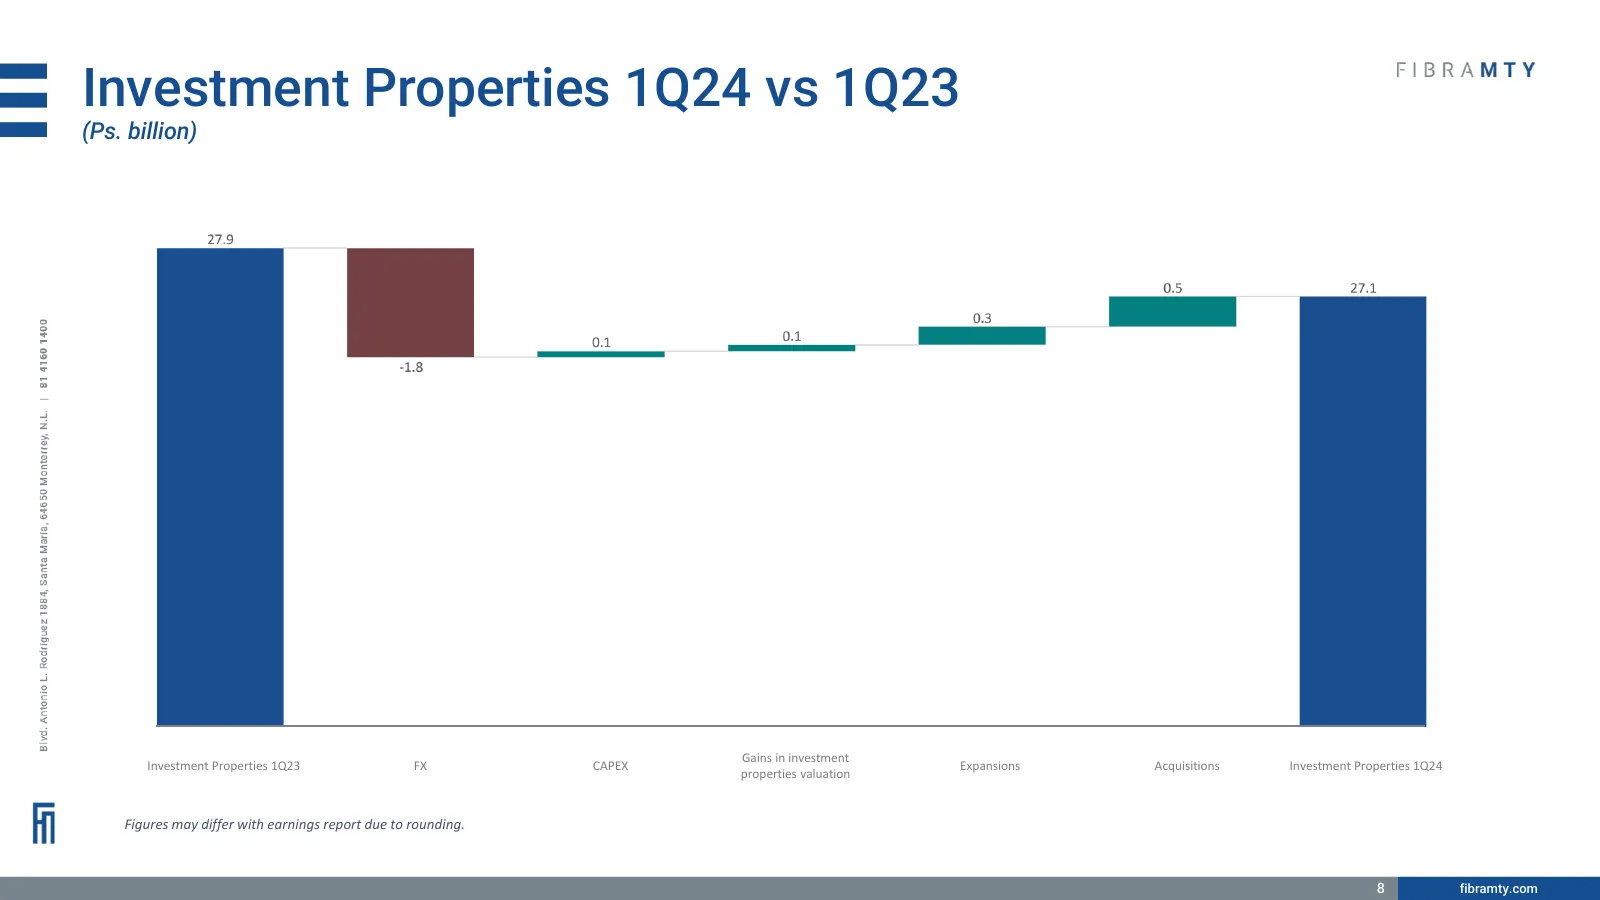
Investment Properties 1Q24 vs 1Q23 (Ps. billion) Gains in investment Investment Properties 1Q23 FX CAPEX Expansions Acquisitions Investment Properties 1Q24 properties valuation Figures may differ with earnings report due to rounding. 8 fibramty.com
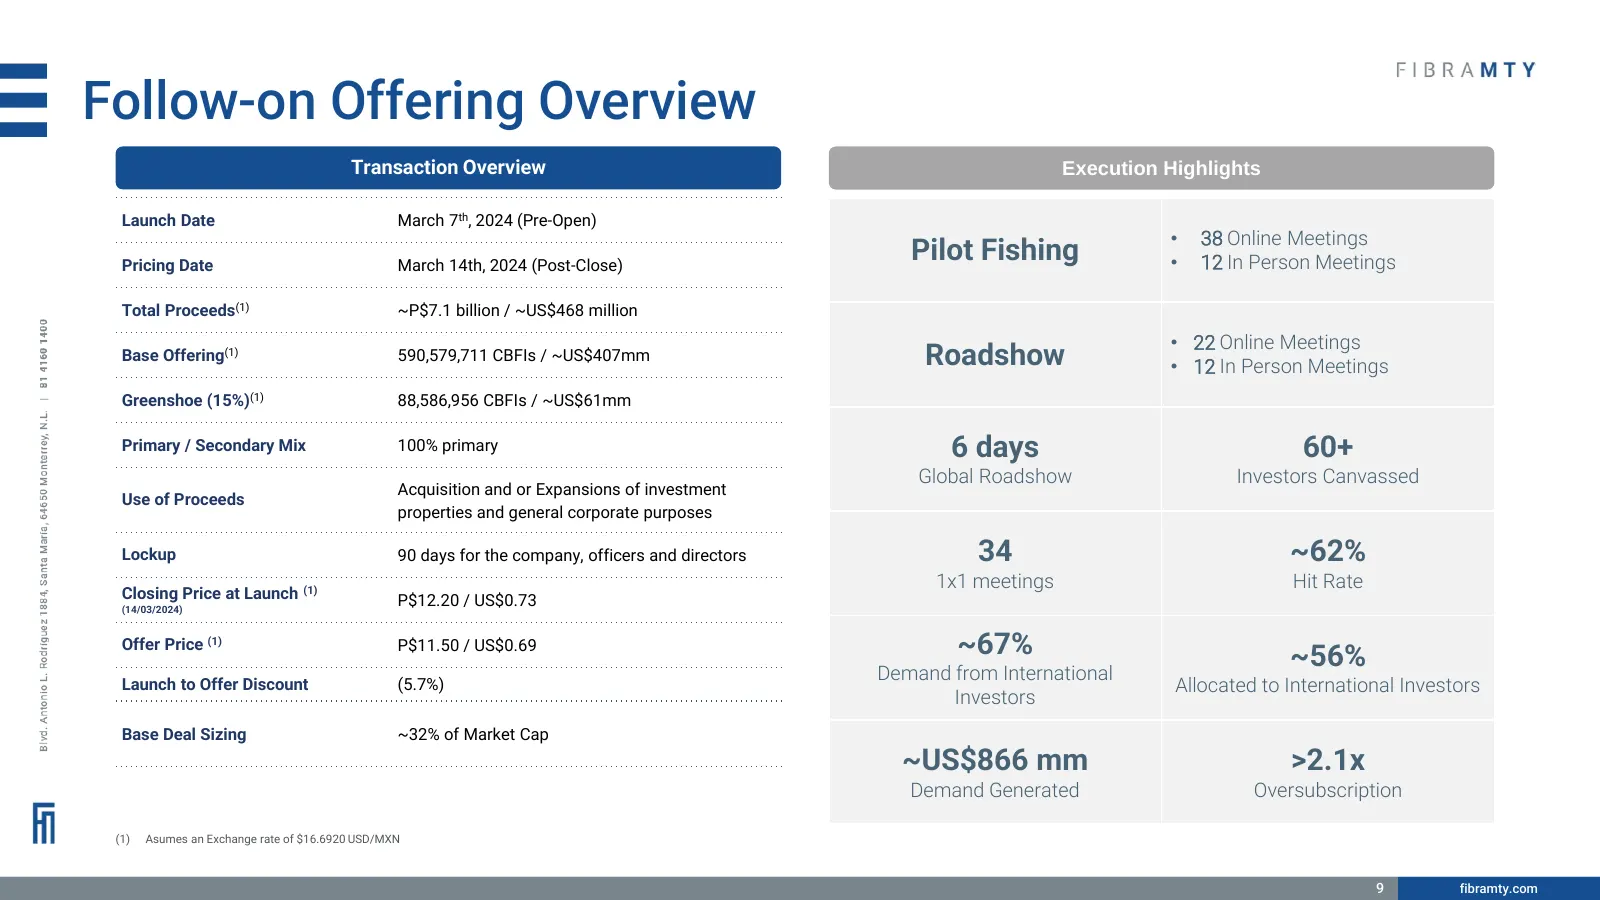
Slide 9: Follow-on Offering Overview
Follow-on Offering Overview Transaction Overview Execution Highlights Launch Date March 7th, 2024 (Pre-Open) • 38 Online Meetings Pricing Date March 14th, 2024 (Post-Close) Pilot Fishing • 12 In Person Meetings Total Proceeds(1) ~P$7.1 billion / ~US$468 million • 22 Online Meetings Base Offering(1)
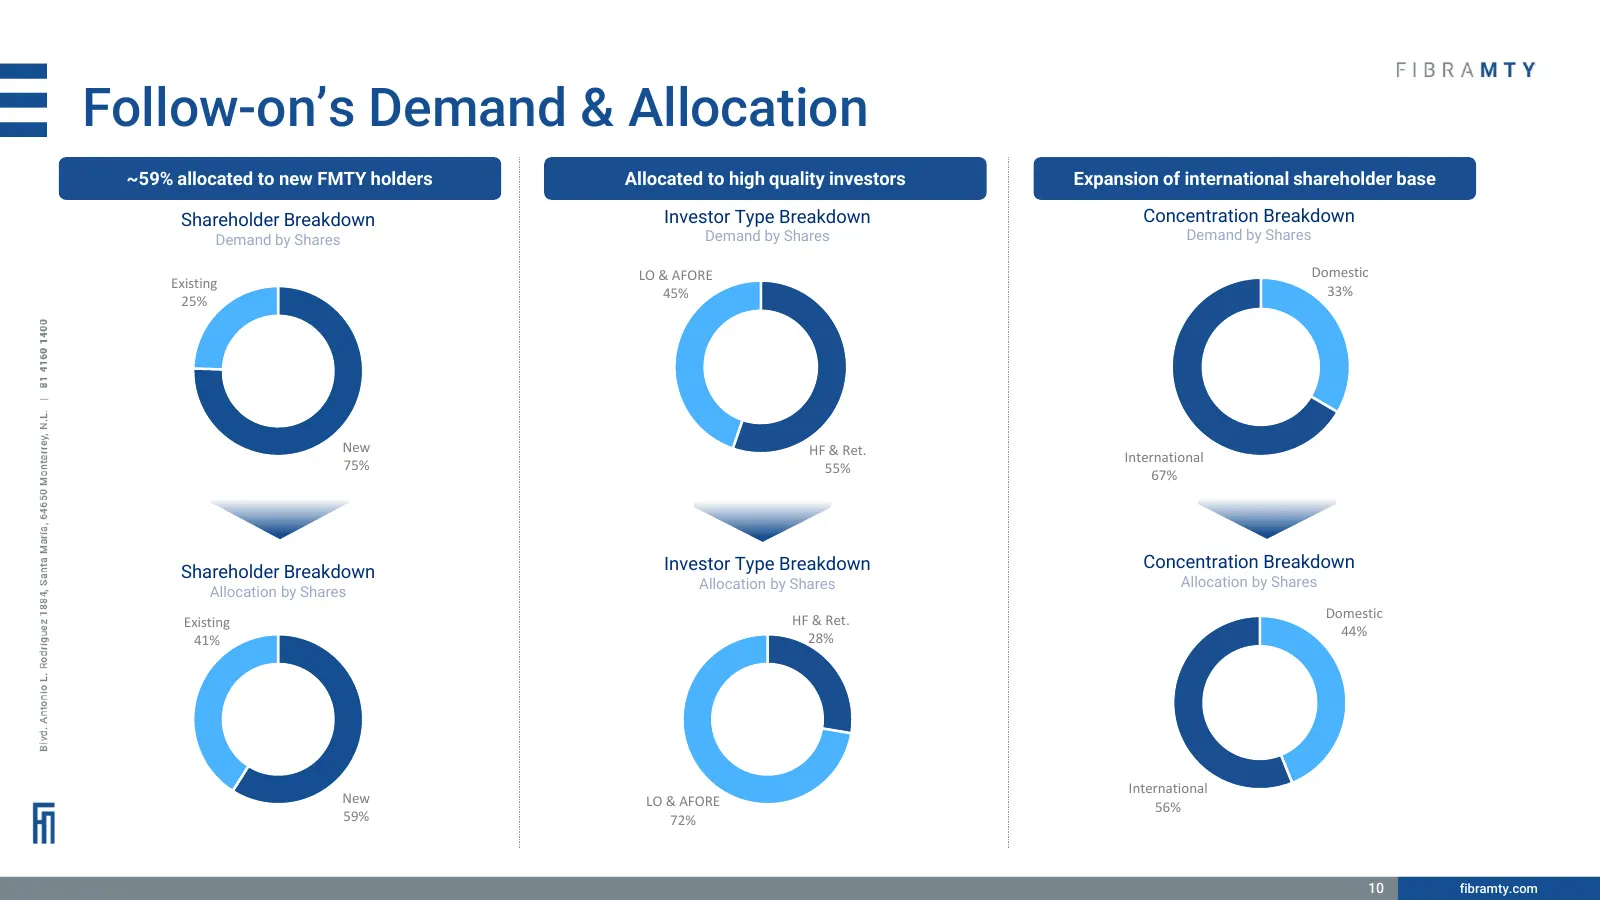
Slide 10: Follow-on's Demand & Allocation
Follow-on’s Demand & Allocation ~59% allocated to new FMTY holders Allocated to high quality investors Expansion of international shareholder base Shareholder Breakdown Investor Type Breakdown Concentration Breakdown Demand by Shares Demand by Shares Demand by Shares LO & AFORE Domestic Existing 45%
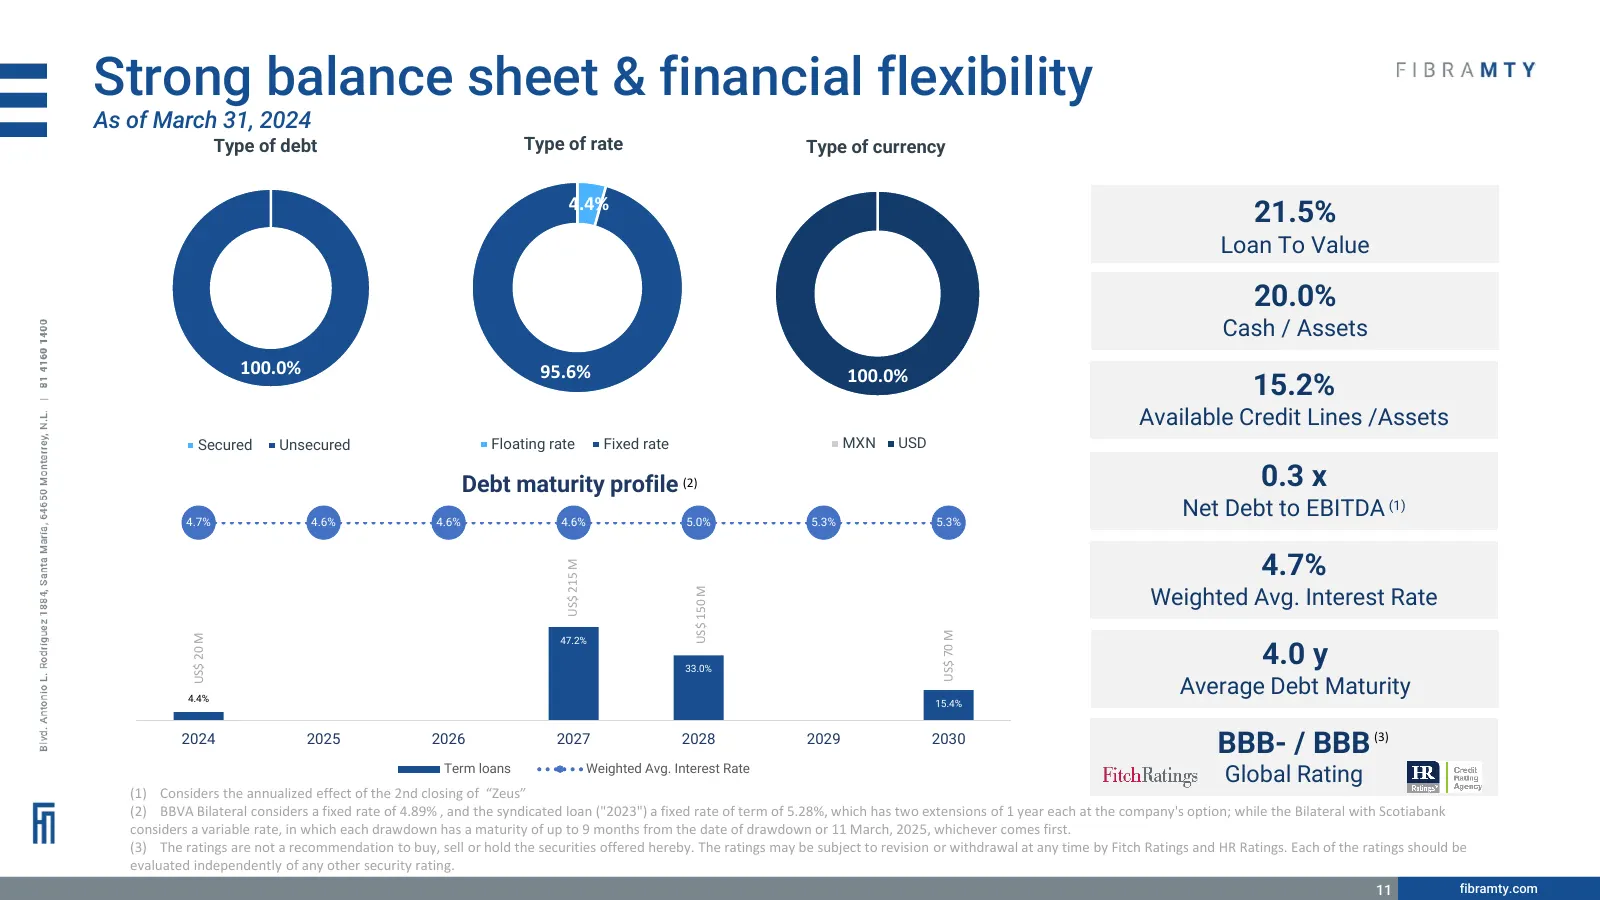
Slide 11: Strong balance sheet & financial flexibility
Strong balance sheet & financial flexibility As of March 31, 2024 Type of debt Type of rate Type of currency 4.4% 21.5% Loan To Value 20.0% Cash / Assets 100.0% 95.6% 100.0% 15.2% Available Credit Lines /Assets Secured Unsecured Floating rate Fixed rate MXN USD Debt maturity profile (2) 0.3 x 4.7% 4
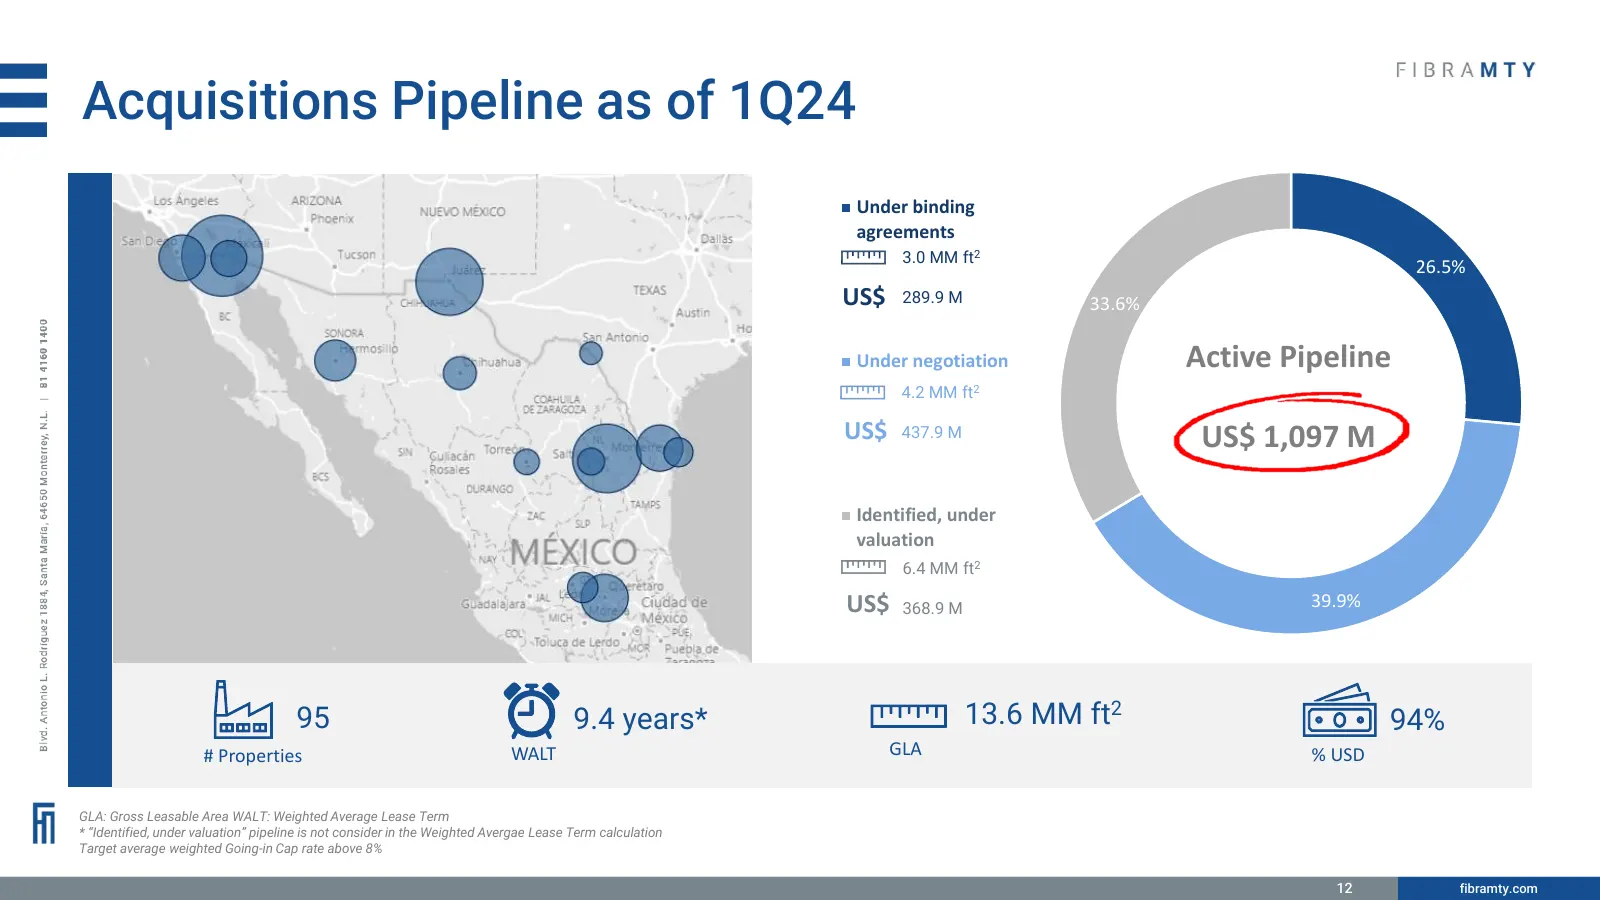
Slide 12: Acquisitions Pipeline as of 1Q24
Acquisitions Pipeline as of 1Q24 Under binding agreements 3.0 MM ft2 26.5% US$ 289.9 M 33.6% Under negotiation Active Pipeline 4.2 MM ft2 US$ 437.9 M US$ 1,097 M Identified, under valuation 6.4 MM ft2 US$ 368.9 M 39.9% 95 9.4 years* 13.6 MM ft2 94% # Properties WALT GLA % USD GLA: Gross Leasable Are
Slide 13: Signed and undergoing Industrial expansions
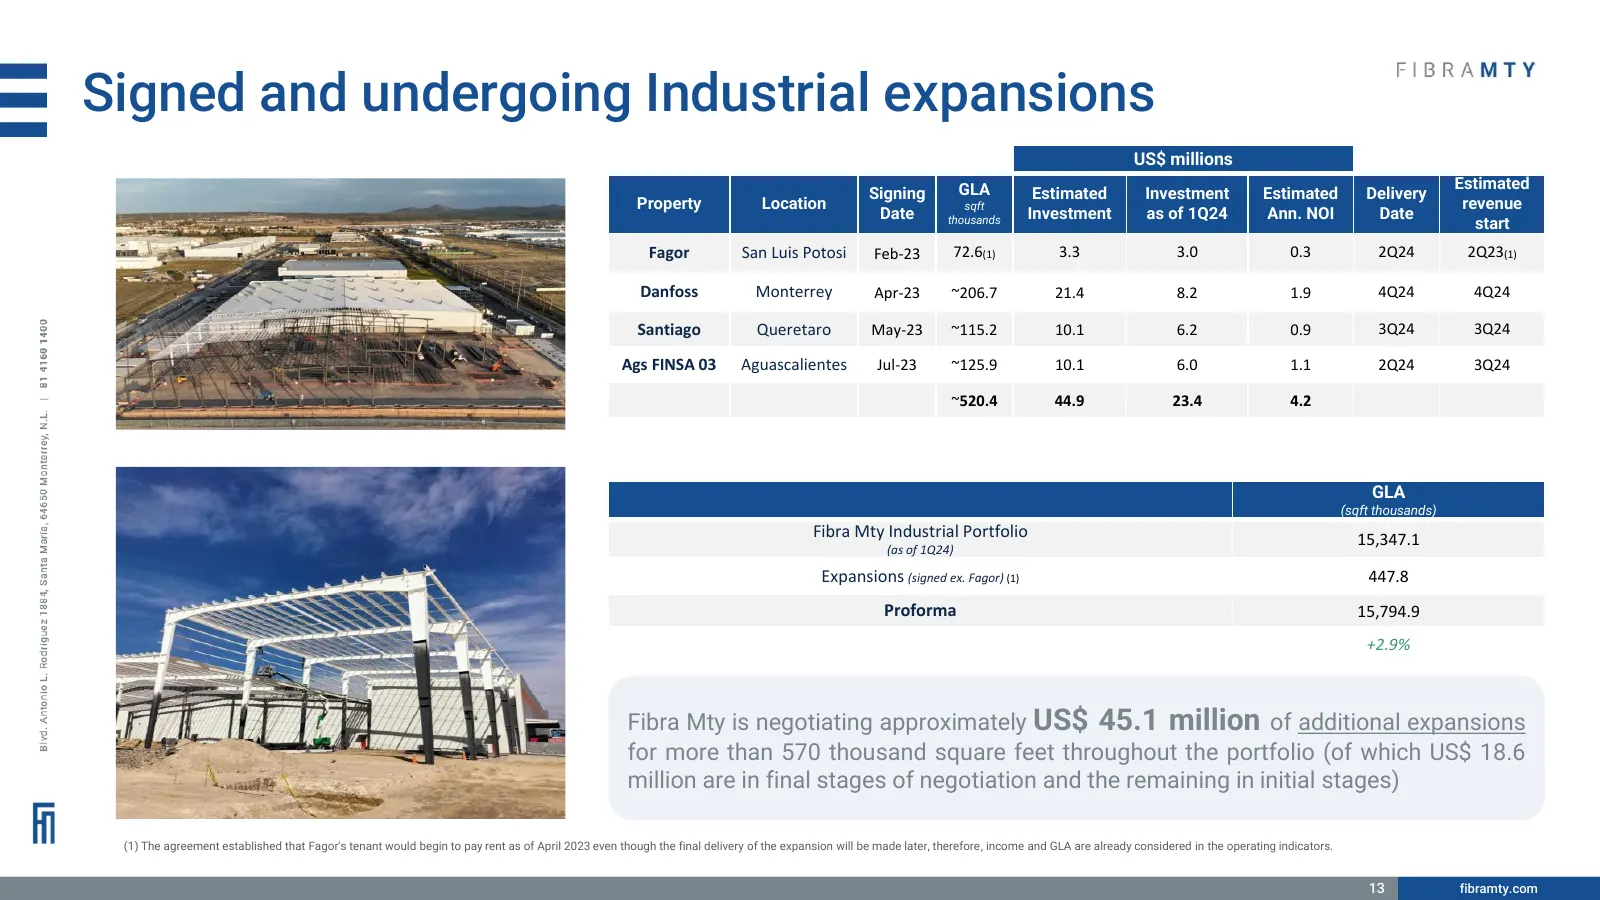
Signed and undergoing Industrial expansions US$ millions GLA Estimated Signing Estimated Investment Estimated Delivery Property Location sqft revenue Date thousands Investment as of 1Q24 Ann. NOI Date start Fagor San Luis Potosi Feb-23 72.6(1) 3.3 3.0 0.3 2Q24 2Q23(1) Danfoss Monterrey Apr-23 ~206.7
Slide 14: Office Segment
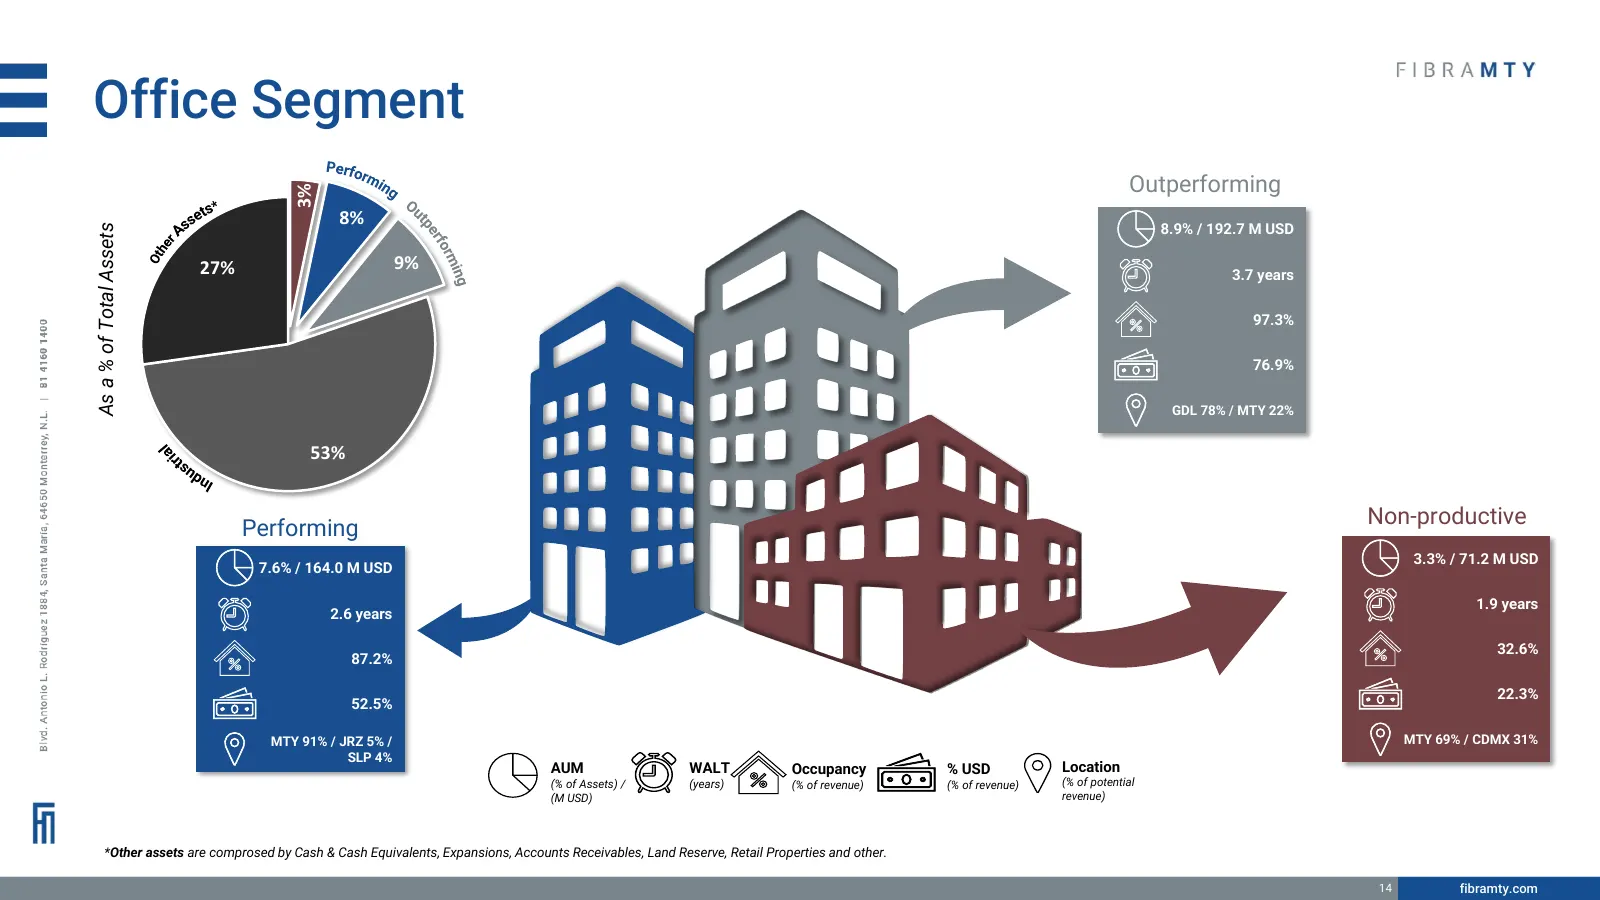
Office Segment Perfo rm ing Outperforming 3% Ou ts* se 8% As tp 8.9% / 192.7 M USD As a % of Total Assets er r for he Ot 9% min 27% 3.7 years g 97.3% 76.9% GDL 78% / MTY 22% l 53% ia tr dus In Non-productive Performing 3.3% / 71.2 M USD 7.6% / 164.0 M USD 1.9 years 2.6 years 32.6% 87.2% 22.3% 52.5%
Slide 15: 1Q24 Cash Flow Results vs 1Q23
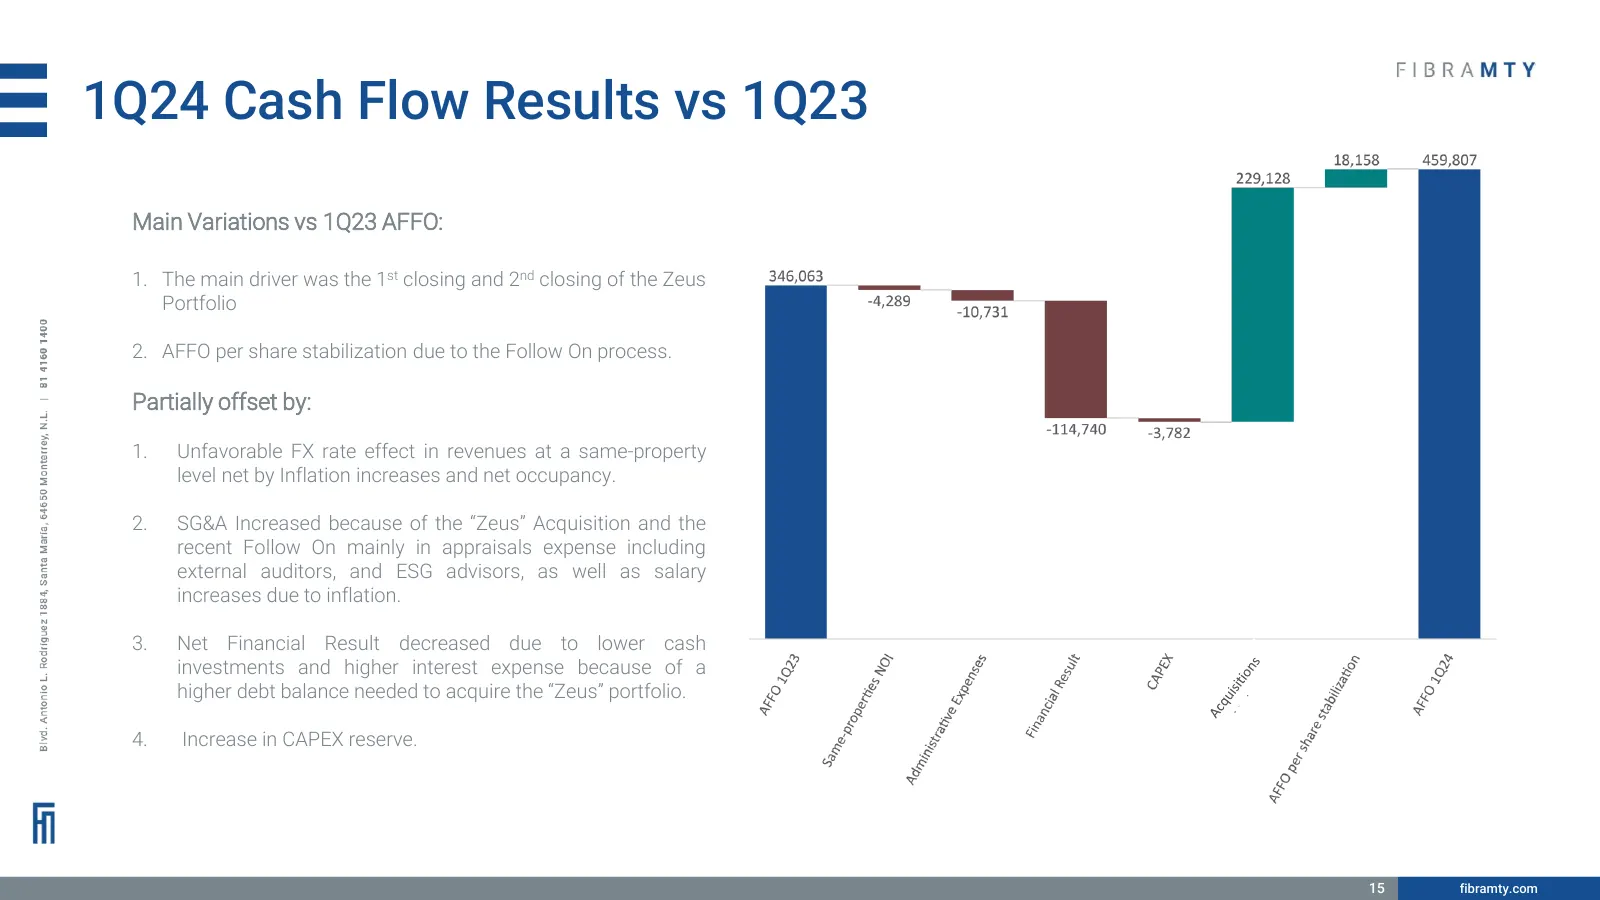
1Q24 Cash Flow Results vs 1Q23 Main Variations vs 1Q23 AFFO: 1. The main driver was the 1st closing and 2nd closing of the Zeus Portfolio 2. AFFO per share stabilization due to the Follow On process. Partially offset by: 1. Unfavorable FX rate effect in revenues at a same-property level net by Infla
Slide 16: 2024 Guidance
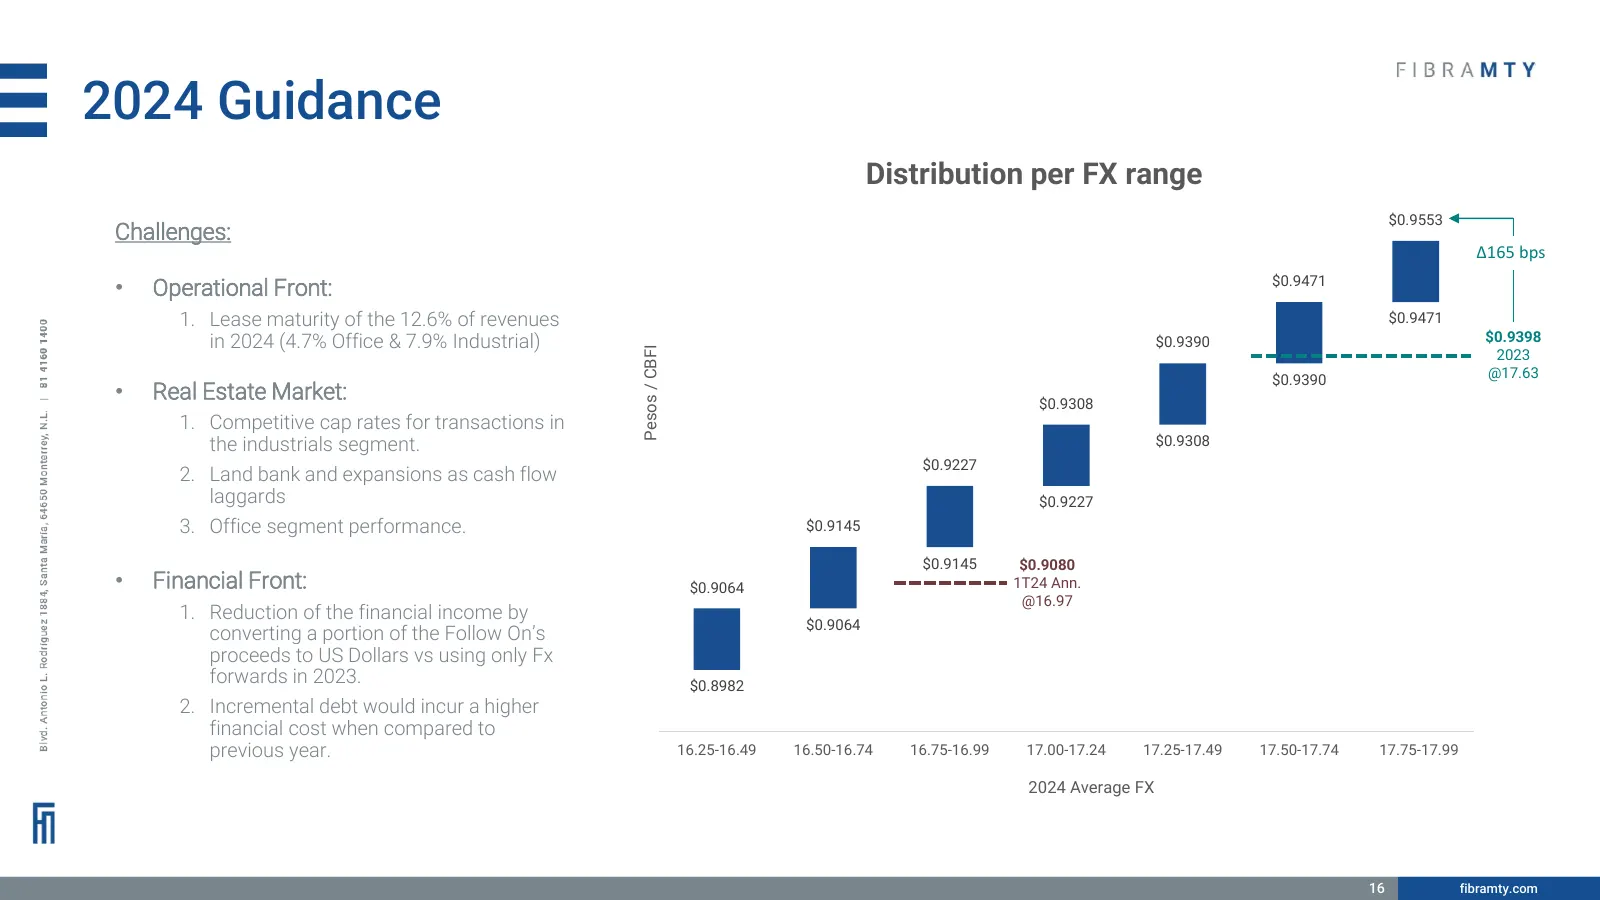
2024 Guidance Distribution per FX range $0.96 $0.9553 Challenges: Δ165 bps $0.95 $0.9471 • Operational Front: 1. Lease maturity of the 12.6% of revenues $0.9471 in 2024 (4.7% Office & 7.9% Industrial) $0.9390 $0.9398 Pesos / CBFI $0.94 2023 $0.9390 @17.63 • Real Estate Market: $0.9308 1. Competitive
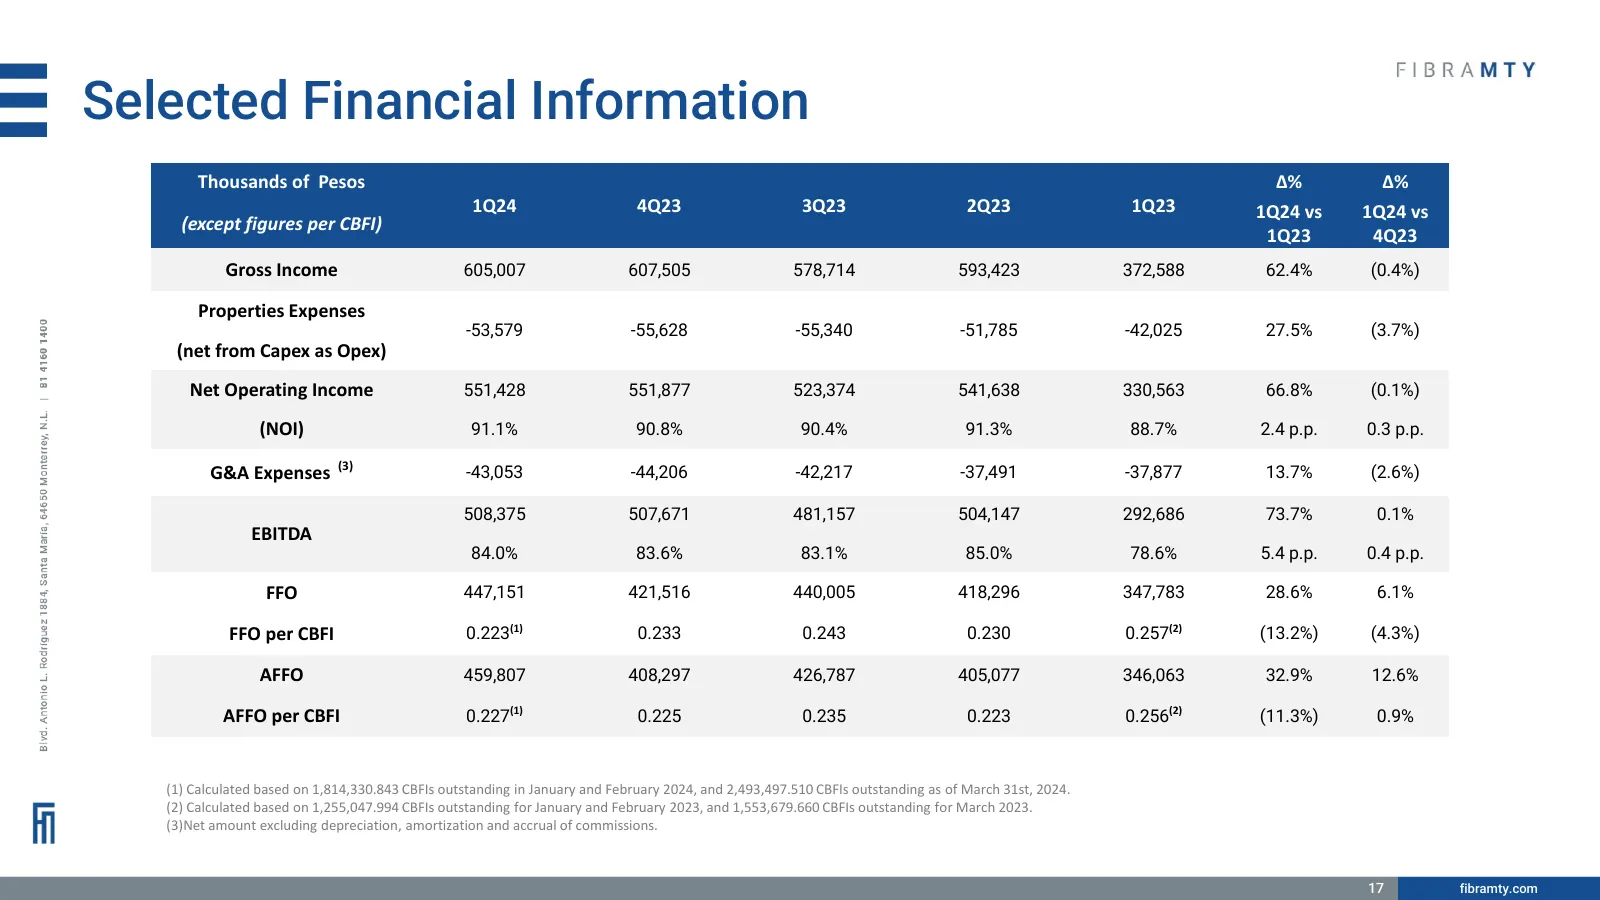
Slide 17: Selected Financial Information
Selected Financial Information Thousands of Pesos Δ% Δ% 1Q24 4Q23 3Q23 2Q23 1Q23 1Q24 vs 1Q24 vs (except figures per CBFI) 1Q23 4Q23 Gross Income 605,007 607,505 578,714 593,423 372,588 62.4% (0.4%) Properties Expenses -53,579 -55,628 -55,340 -51,785 -42,025 27.5% (3.7%) (net from Capex as Opex) Net

Slide 18: Contact
Sistema de Entrenamiento en Ciberseguridad Contact: Cesar Rubalcava, CFA, CAIA Investor Relations crubalcava@fibramty.com
Source: Internet Archive copy of investorcloud.s3.amazonaws.com
More decks from Fibra MTY
 Q3 2024 Earnings Presentation24 slides · October 2024
 Q4 2023 Earnings Presentation16 slides · February 2024
 Q3 2023 Earnings Presentation16 slides · October 2023
 Q2 2023 Earnings Presentation17 slides · July 2023
 Q1 2023 Earnings Presentation16 slides · April 2023
 Q4 2022 Earnings Presentation20 slides · February 2023