Fibra MTY · BIVA:FMTY/14
Fibra MTY — Q3 2023 Earnings Presentation
16 slides from Fibra MTY's earnings presentation, October 2023
Slide 1: 3Q23 Quarterly Results
Sistema de Entrenamiento 3Q23 en Update Quarterly Results Ciberseguridad Trust F/2157 – FMTY14 October, 2023
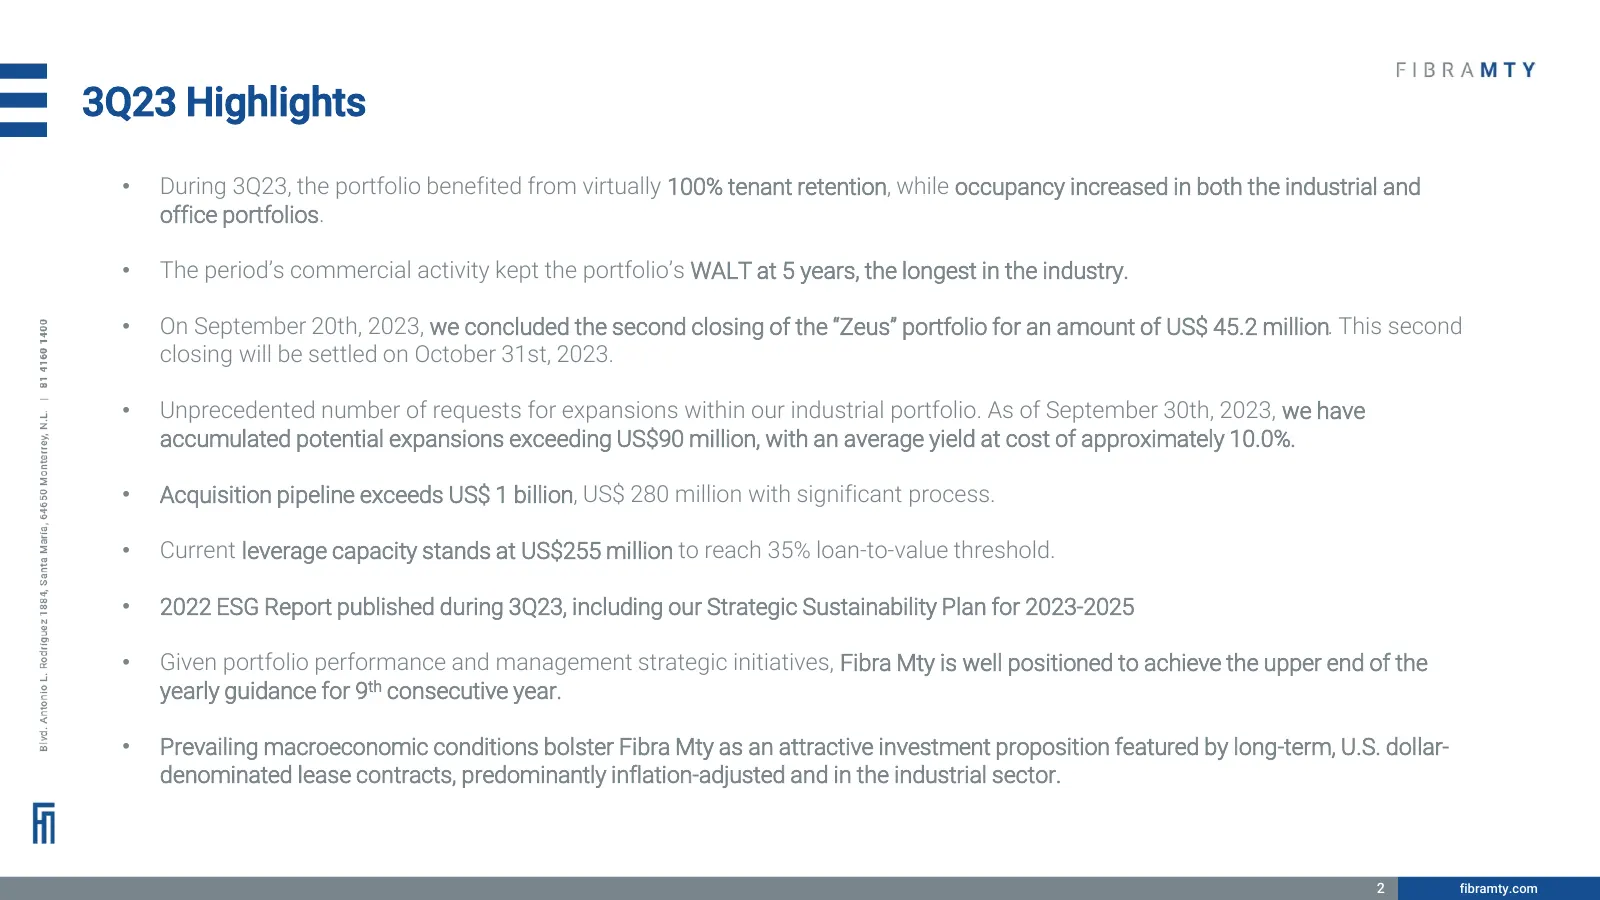
Slide 2: 3Q23 Highlights
3Q23 Highlights • During 3Q23, the portfolio benefited from virtually 100% tenant retention, while occupancy increased in both the industrial and office portfolios. • The period’s commercial activity kept the portfolio’s WALT at 5 years, the longest in the industry. • On September 20th, 2023, we con
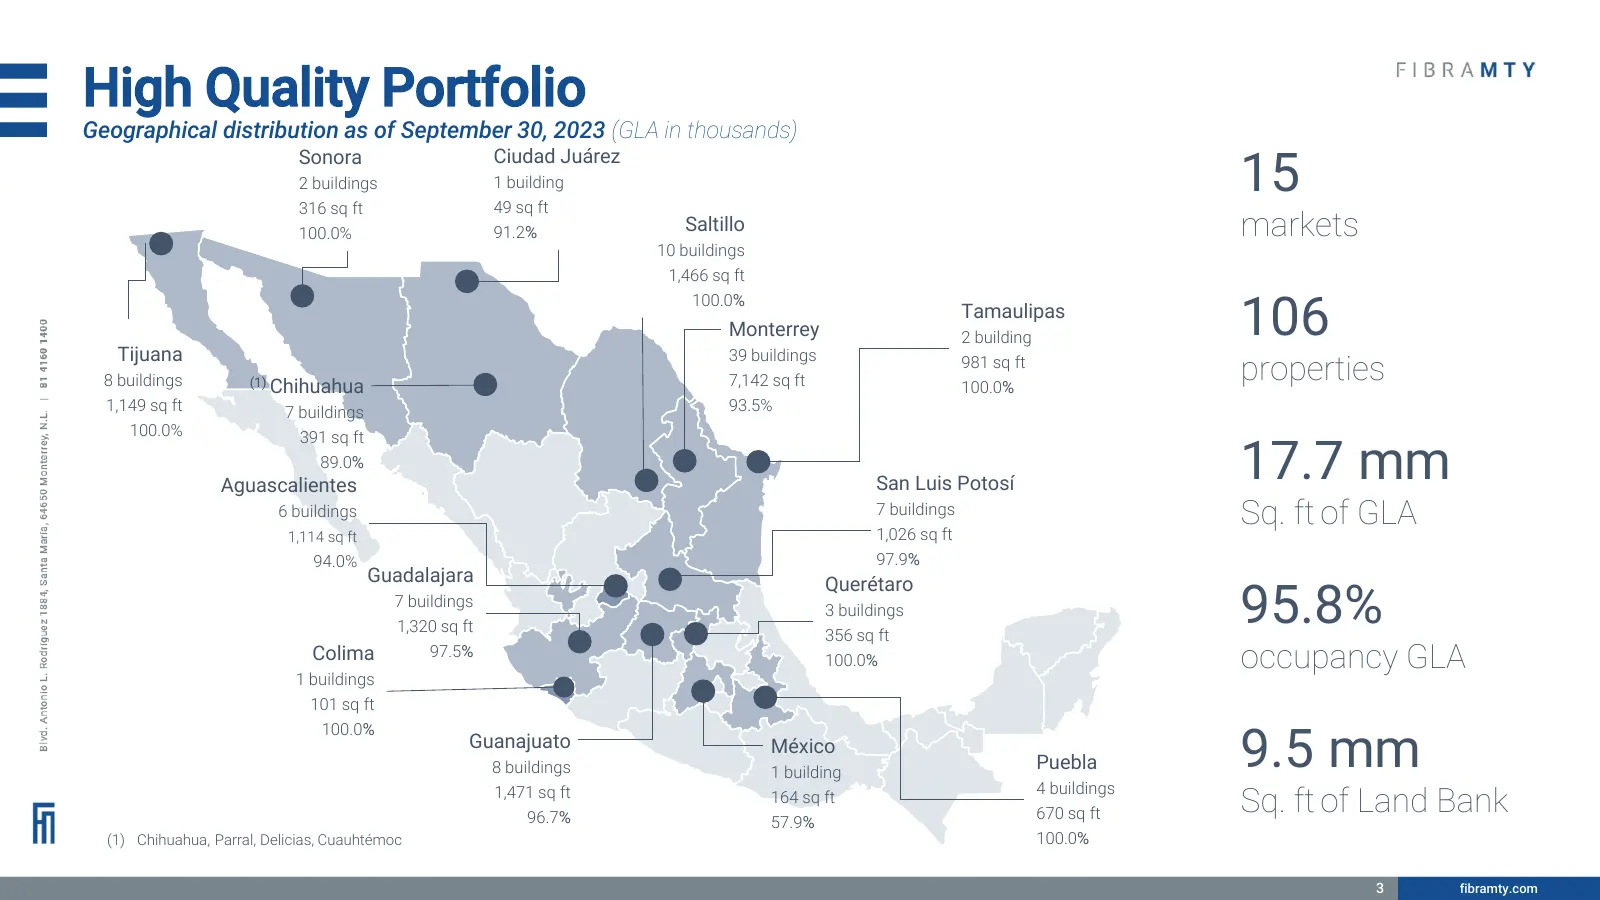
Slide 3: High Quality Portfolio
High Quality Portfolio Geographical distribution as of September 30, 2023 (GLA in thousands) 15 Sonora Ciudad Juárez 2 buildings 1 building 316 sq ft 49 sq ft 100.0% 91.2% Saltillo markets 10 buildings 1,466 sq ft 106 100.0% Tamaulipas Monterrey 2 building Tijuana 39 buildings 8 buildings (1) Chihua
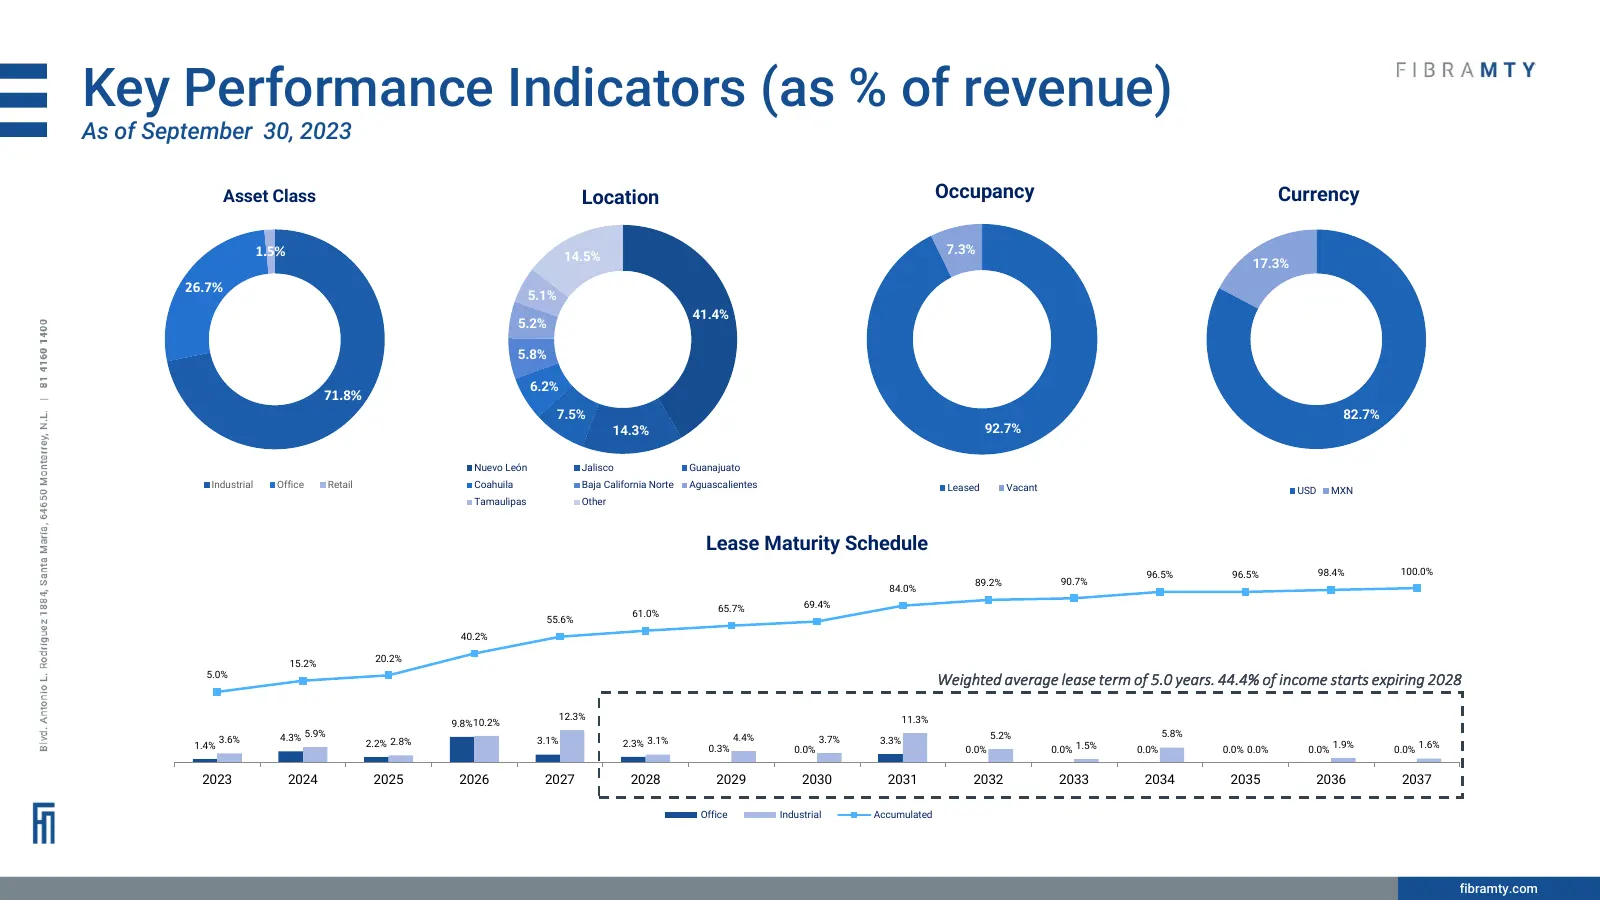
Slide 4: Key Performance Indicators (as % of revenue)
Key Performance Indicators (as % of revenue) As of September 30, 2023 Asset Class Location Occupancy Currency 1.5% 7.3% 14.5% 17.3% 26.7% 5.1% 41.4% 5.2% 5.8% 6.2% 71.8% 7.5% 82.7% 14.3% 92.7% Nuevo León Jalisco Guanajuato Industrial Office Retail Coahuila Baja California Norte Aguascalientes Leased
Slide 5: Operational efficiency and accretive acquisitions
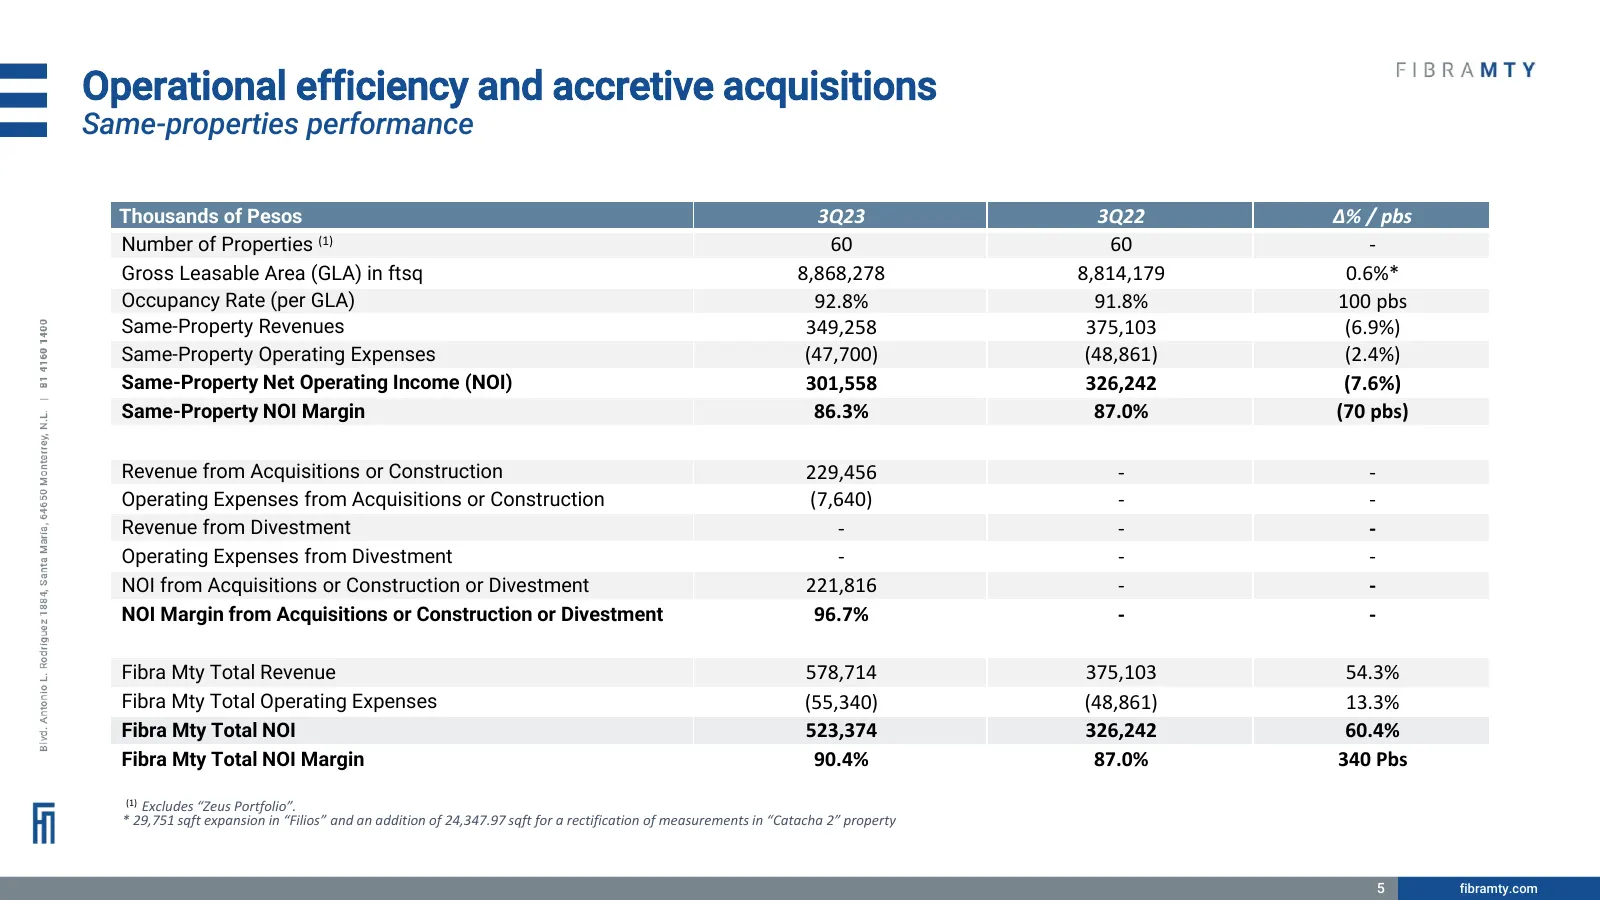
Operational efficiency and accretive acquisitions Same-properties performance Thousands of Pesos 3Q23 3Q22 Δ% / pbs Number of Properties (1) 60 60 - Gross Leasable Area (GLA) in ftsq 8,868,278 8,814,179 0.6%* Occupancy Rate (per GLA) 92.8% 91.8% 100 pbs Same-Property Revenues 349,258 375,103 (6.9%)
Slide 6: Property performance 3Q23 vs 3Q22
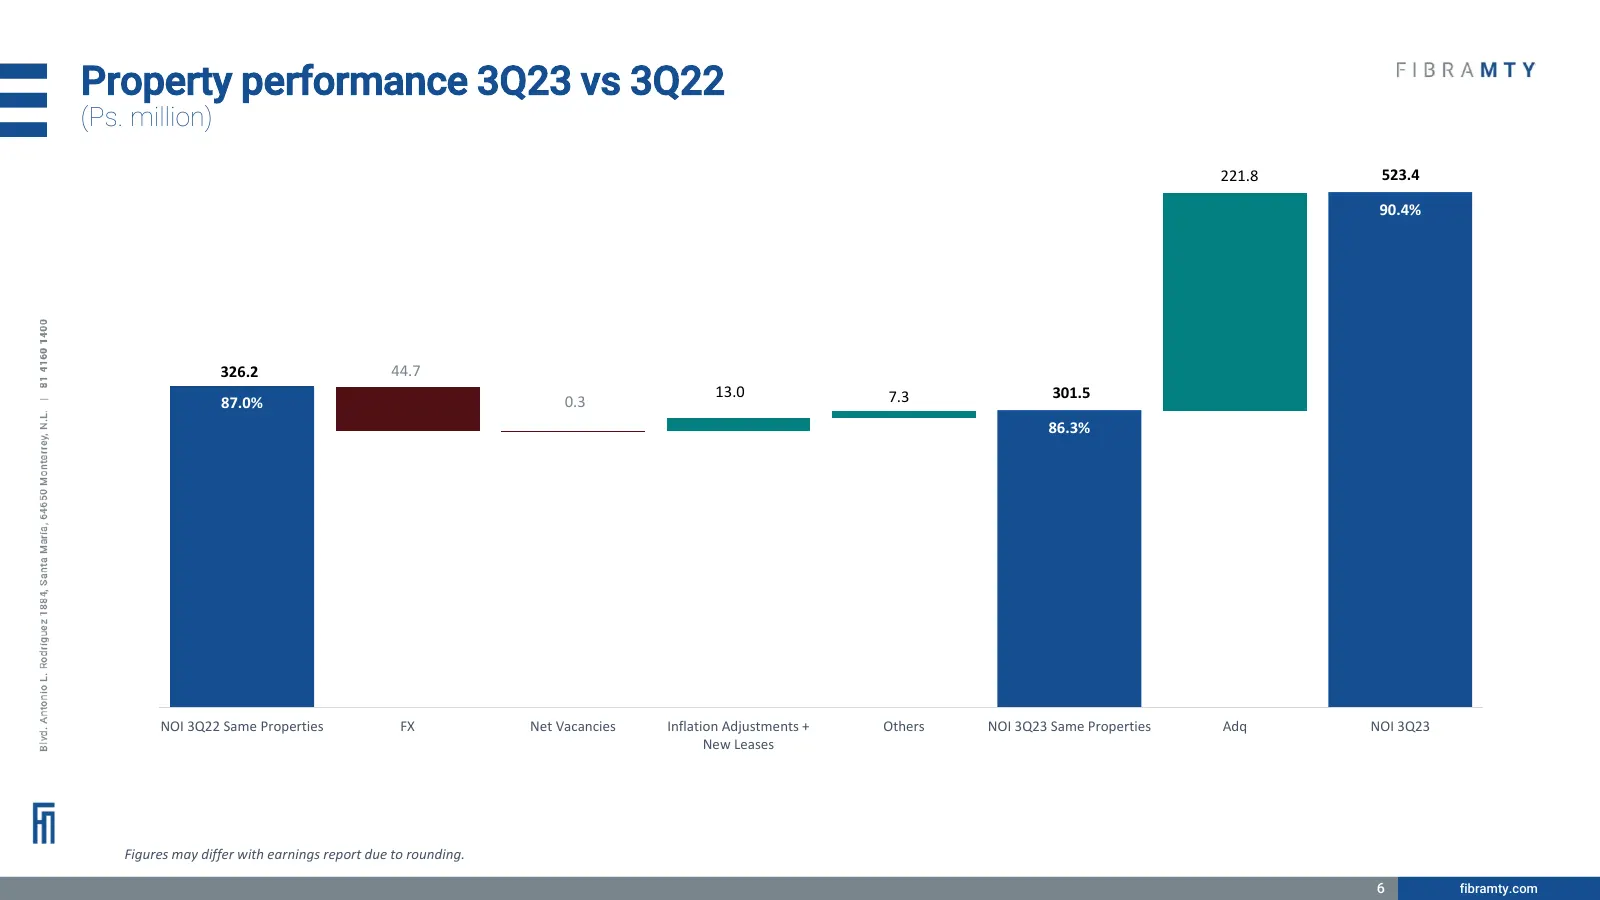
Property performance 3Q23 vs 3Q22 (Ps. million) 221.8 523.4 90.4% 326.2 44.7 13.0 7.3 301.5 87.0% 0.3 86.3% NOI 3Q22 Same Properties FX Net Vacancies Inflation Adjustments + Others NOI 3Q23 Same Properties Adq NOI 3Q23 New Leases Figures may differ with earnings report due to rounding. 6 fibramty.co
Slide 7: Investment Properties 3Q23 vs 3Q22
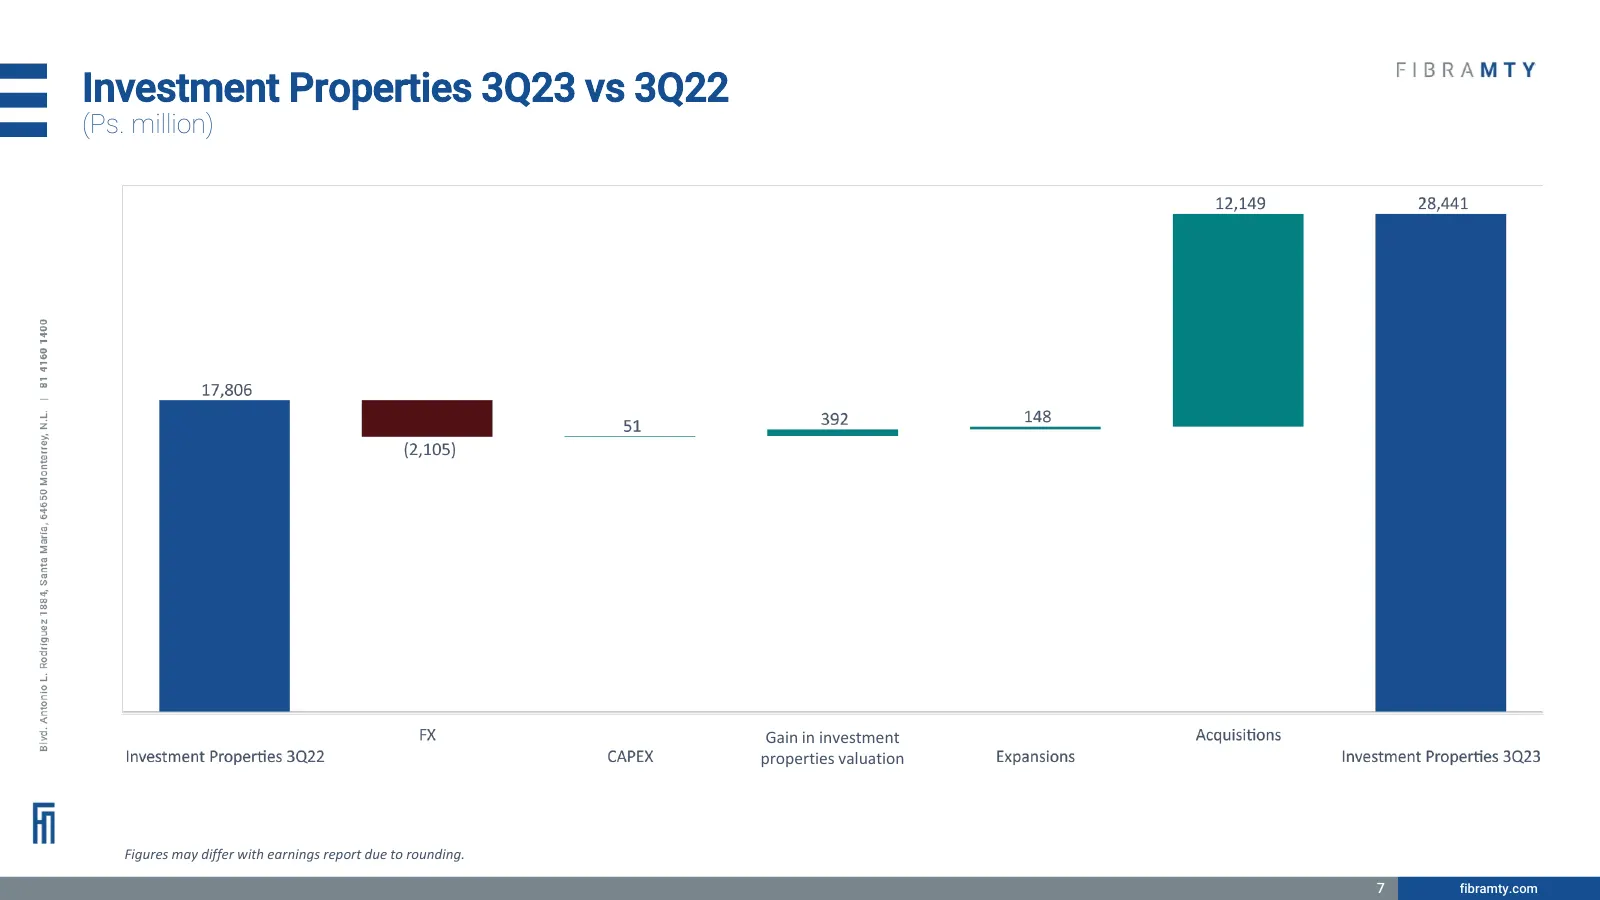
Investment Properties 3Q23 vs 3Q22 (Ps. million) Gain in investment properties valuation Figures may differ with earnings report due to rounding. 7 fibramty.com
Slide 8: Zeus transition into Fibra Mty's portfolio
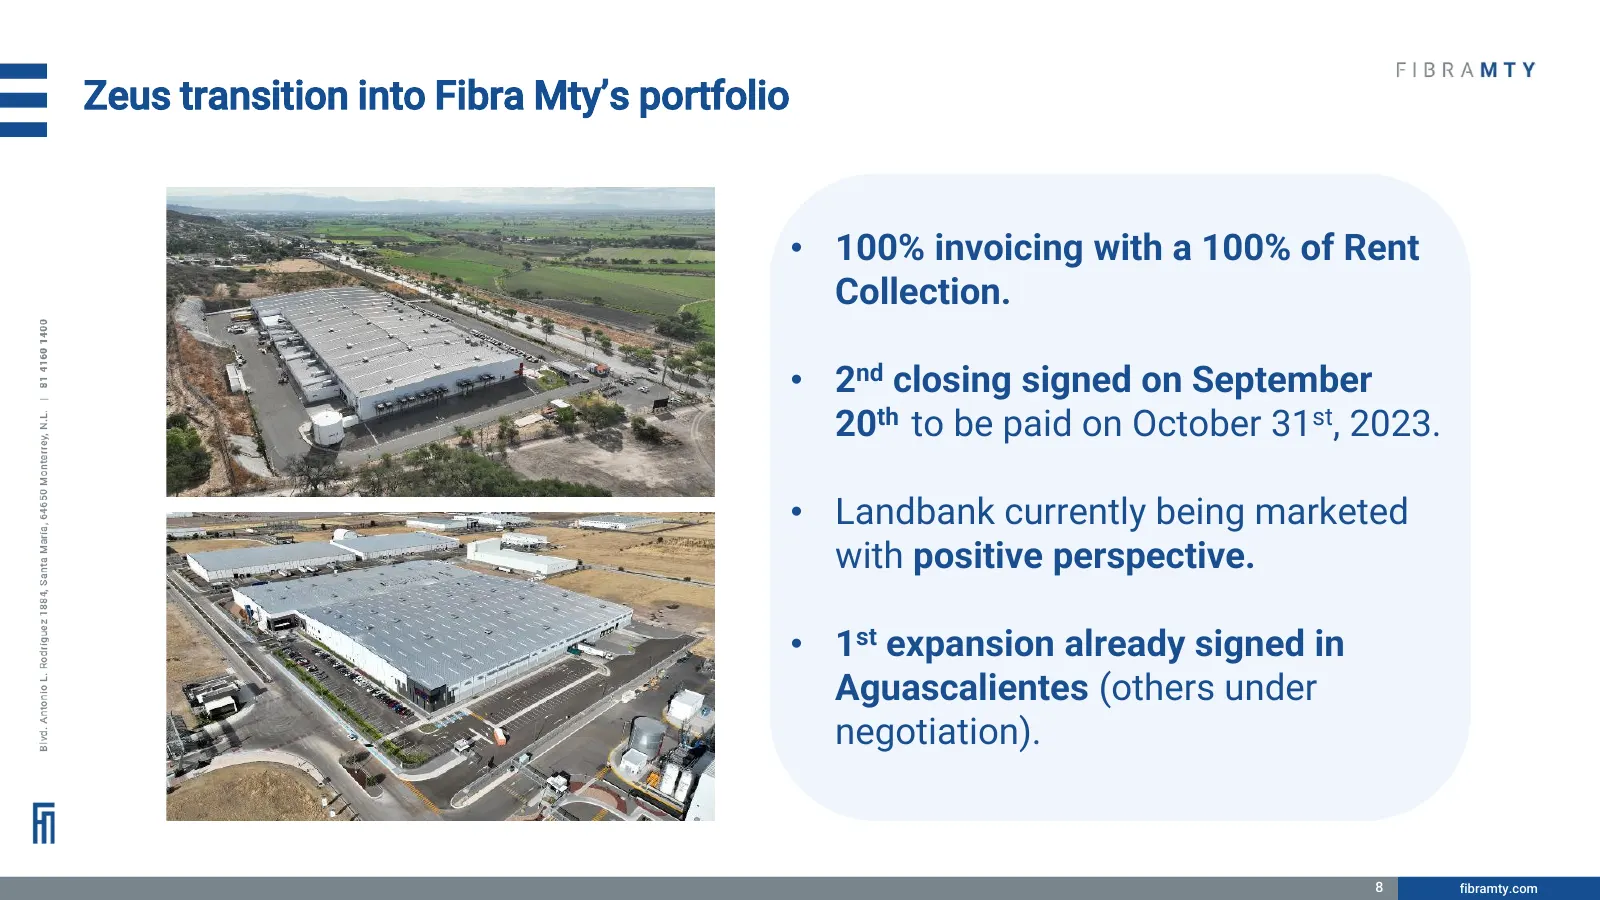
Zeus transition into Fibra Mty’s portfolio • 100% invoicing with a 100% of Rent Collection. • 2nd closing signed on September 20th to be paid on October 31st, 2023. • Landbank currently being marketed with positive perspective. • 1st expansion already signed in Aguascalientes (others under negotiati
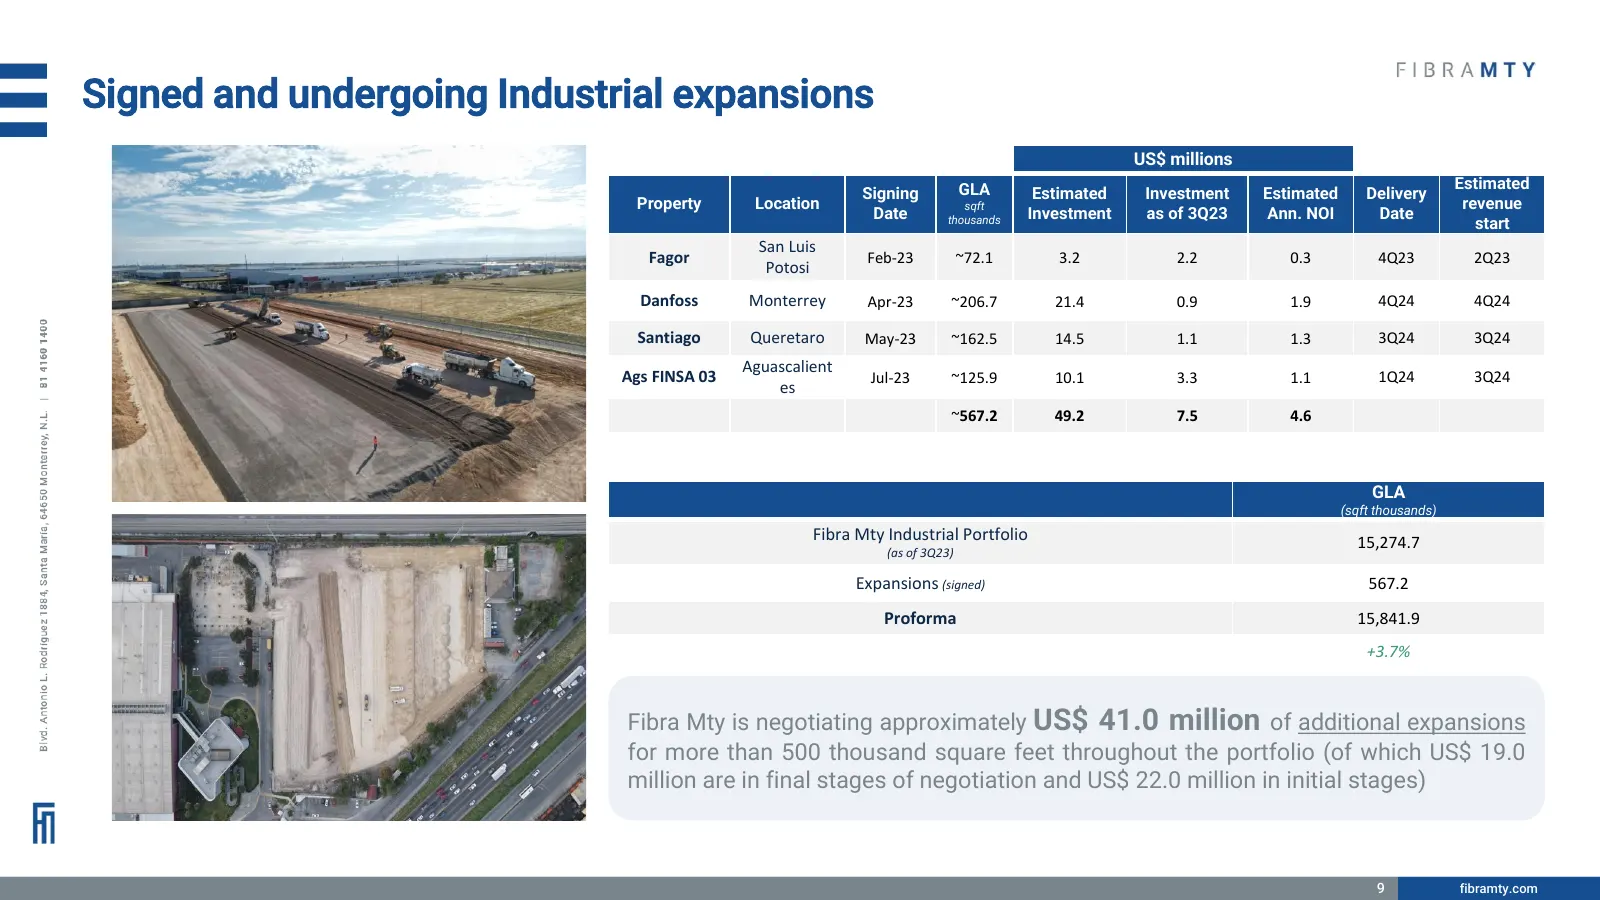
Slide 9: Signed and undergoing Industrial expansions
Signed and undergoing Industrial expansions US$ millions GLA Estimated Signing Estimated Investment Estimated Delivery Property Location sqft revenue Date thousands Investment as of 3Q23 Ann. NOI Date start San Luis Fagor Feb-23 ~72.1 3.2 2.2 0.3 4Q23 2Q23 Potosi Danfoss Monterrey Apr-23 ~206.7 21.4
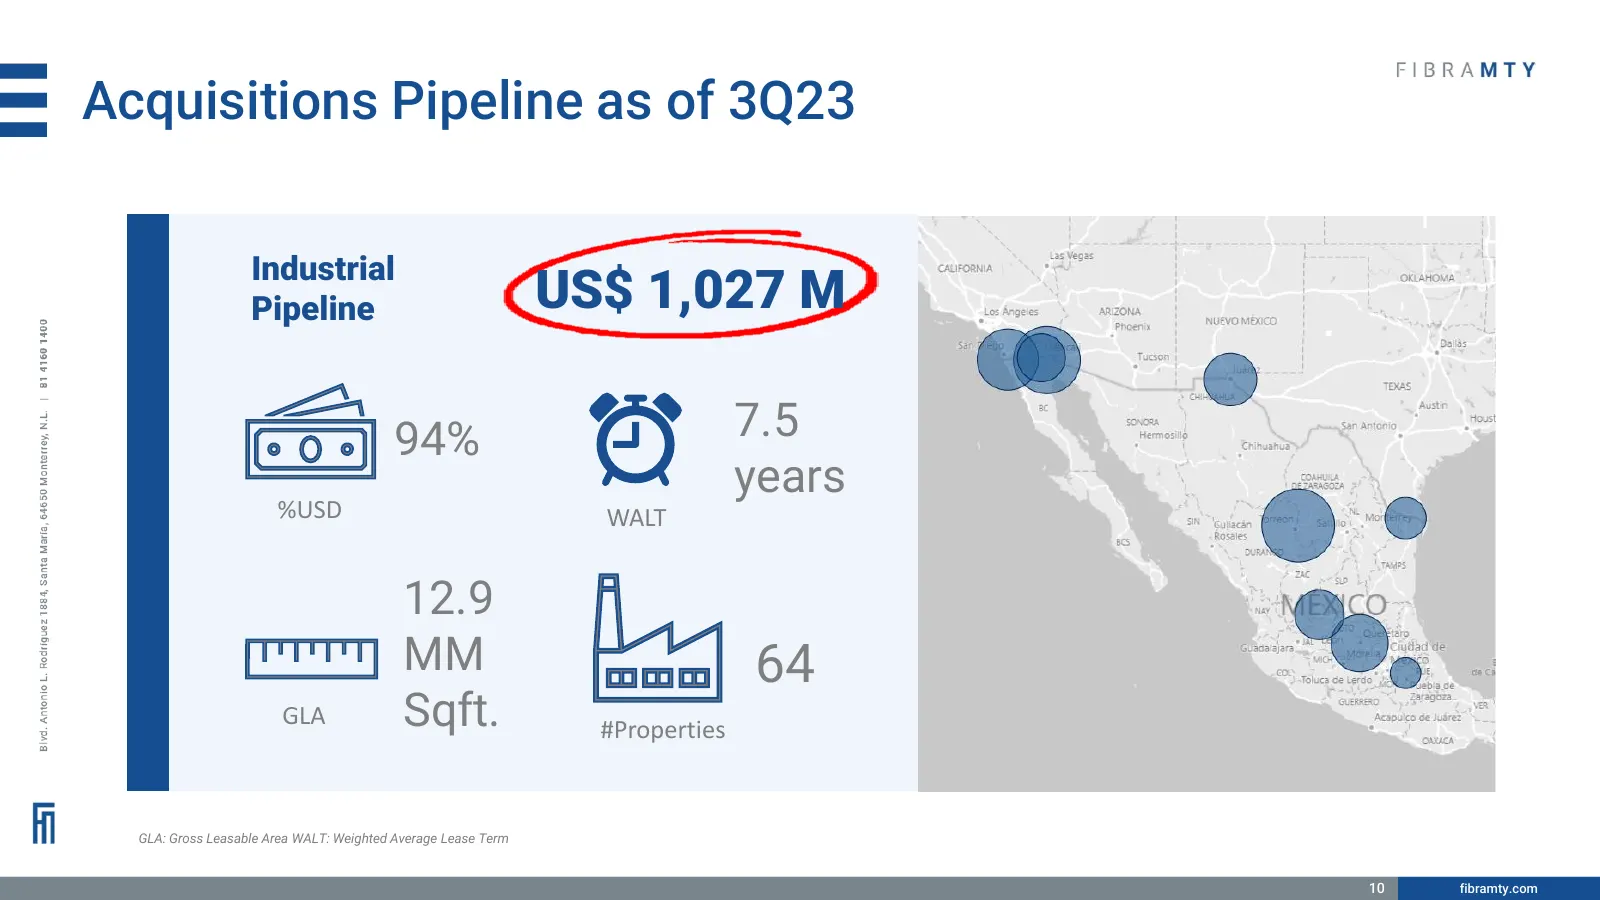
Slide 10: Acquisitions Pipeline as of 3Q23
Acquisitions Pipeline as of 3Q23 Industrial Pipeline US$ 1,027 M 94% 7.5 years %USD WALT 12.9 MM 64 GLA Sqft. #Properties GLA: Gross Leasable Area WALT: Weighted Average Lease Term 10 fibramty.com
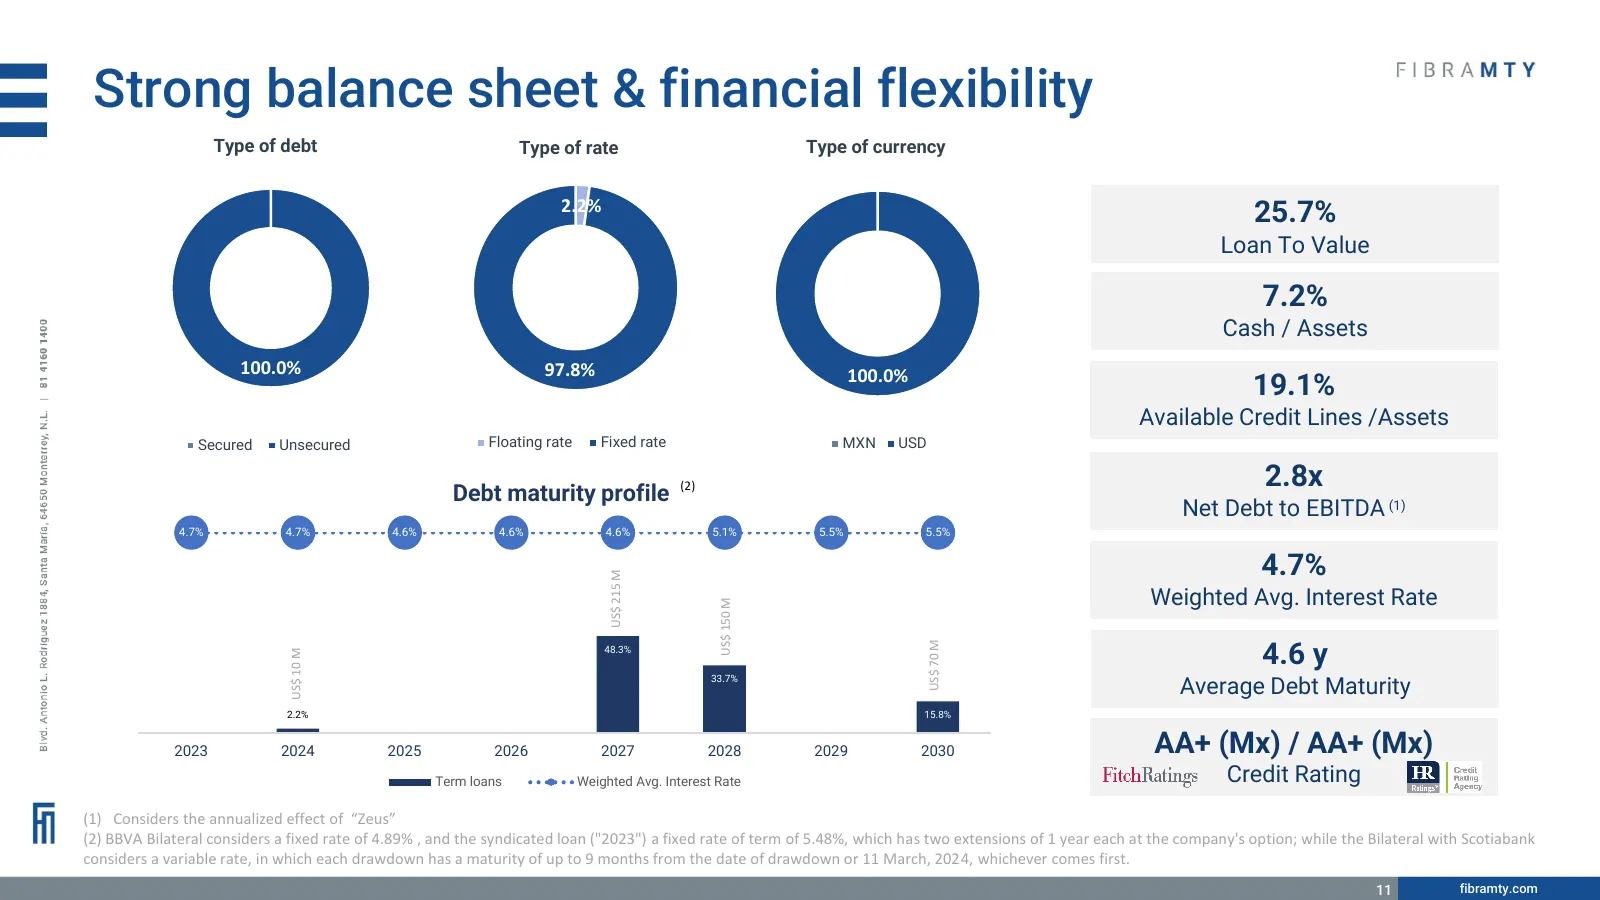
Slide 11: Strong balance sheet & financial flexibility
Strong balance sheet & financial flexibility Type of debt Type of rate Type of currency 2.2% 25.7% Loan To Value 7.2% Cash / Assets 100.0% 97.8% 100.0% 19.1% Available Credit Lines /Assets Secured Unsecured Floating rate Fixed rate MXN USD Debt maturity profile (2) 2.8x Net Debt to EBITDA (1) 4.7% 4
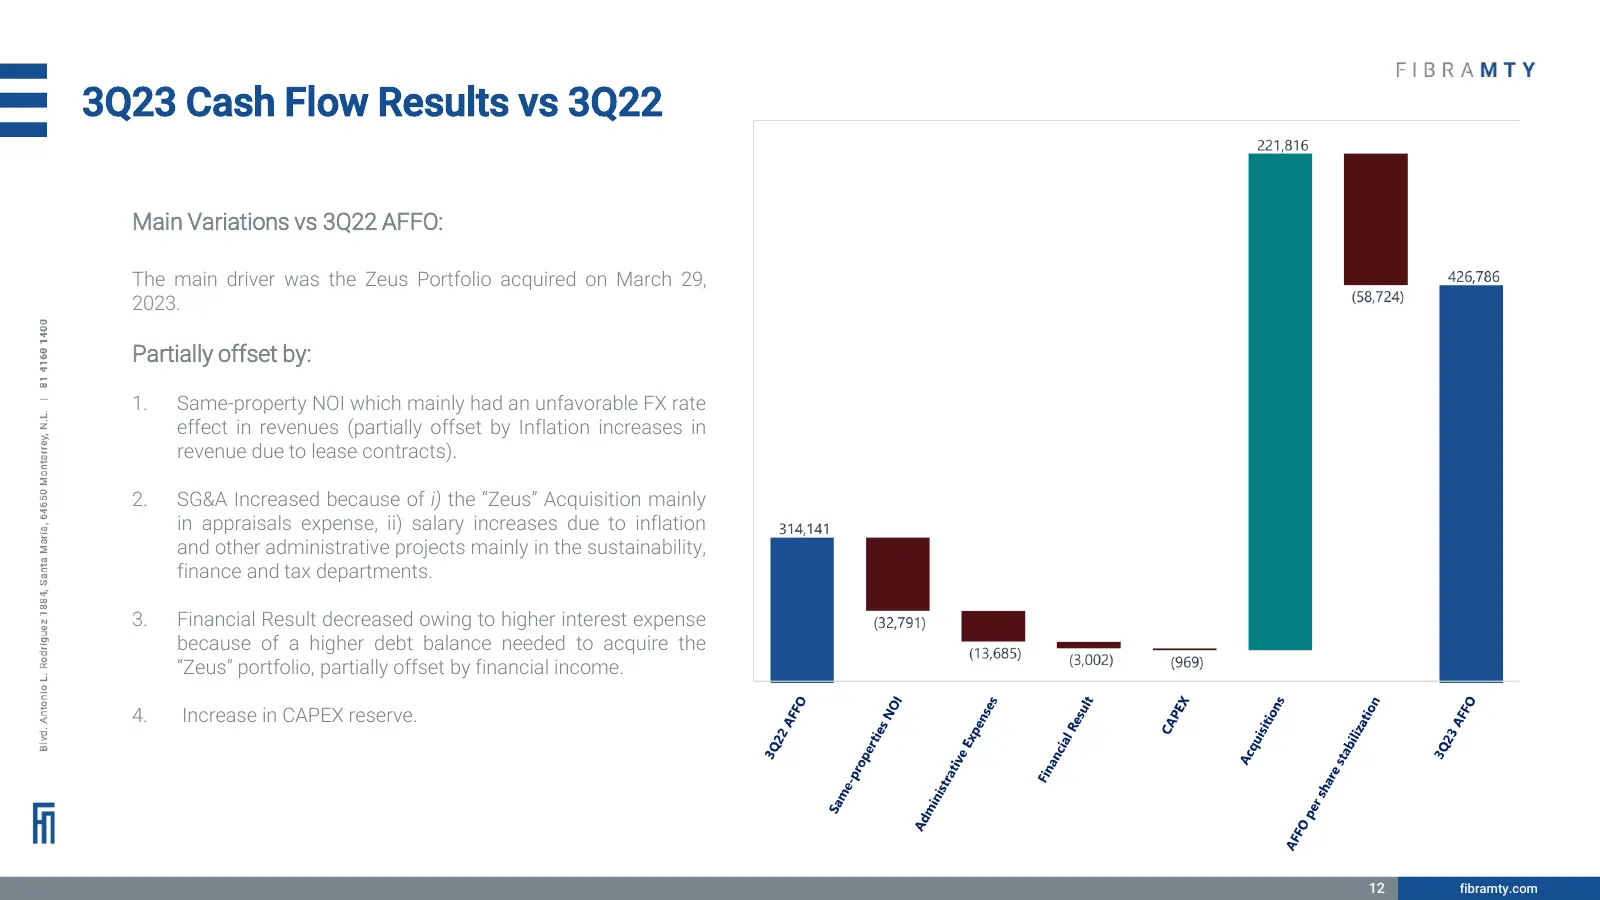
Slide 12: 3Q23 Cash Flow Results vs 3Q22
3Q23 Cash Flow Results vs 3Q22 Main Variations vs 3Q22 AFFO: The main driver was the Zeus Portfolio acquired on March 29, 2023. Partially offset by: 1. Same-property NOI which mainly had an unfavorable FX rate effect in revenues (partially offset by Inflation increases in revenue due to lease contra
Slide 13: 3Q23 Cash Flow Results vs 2Q23
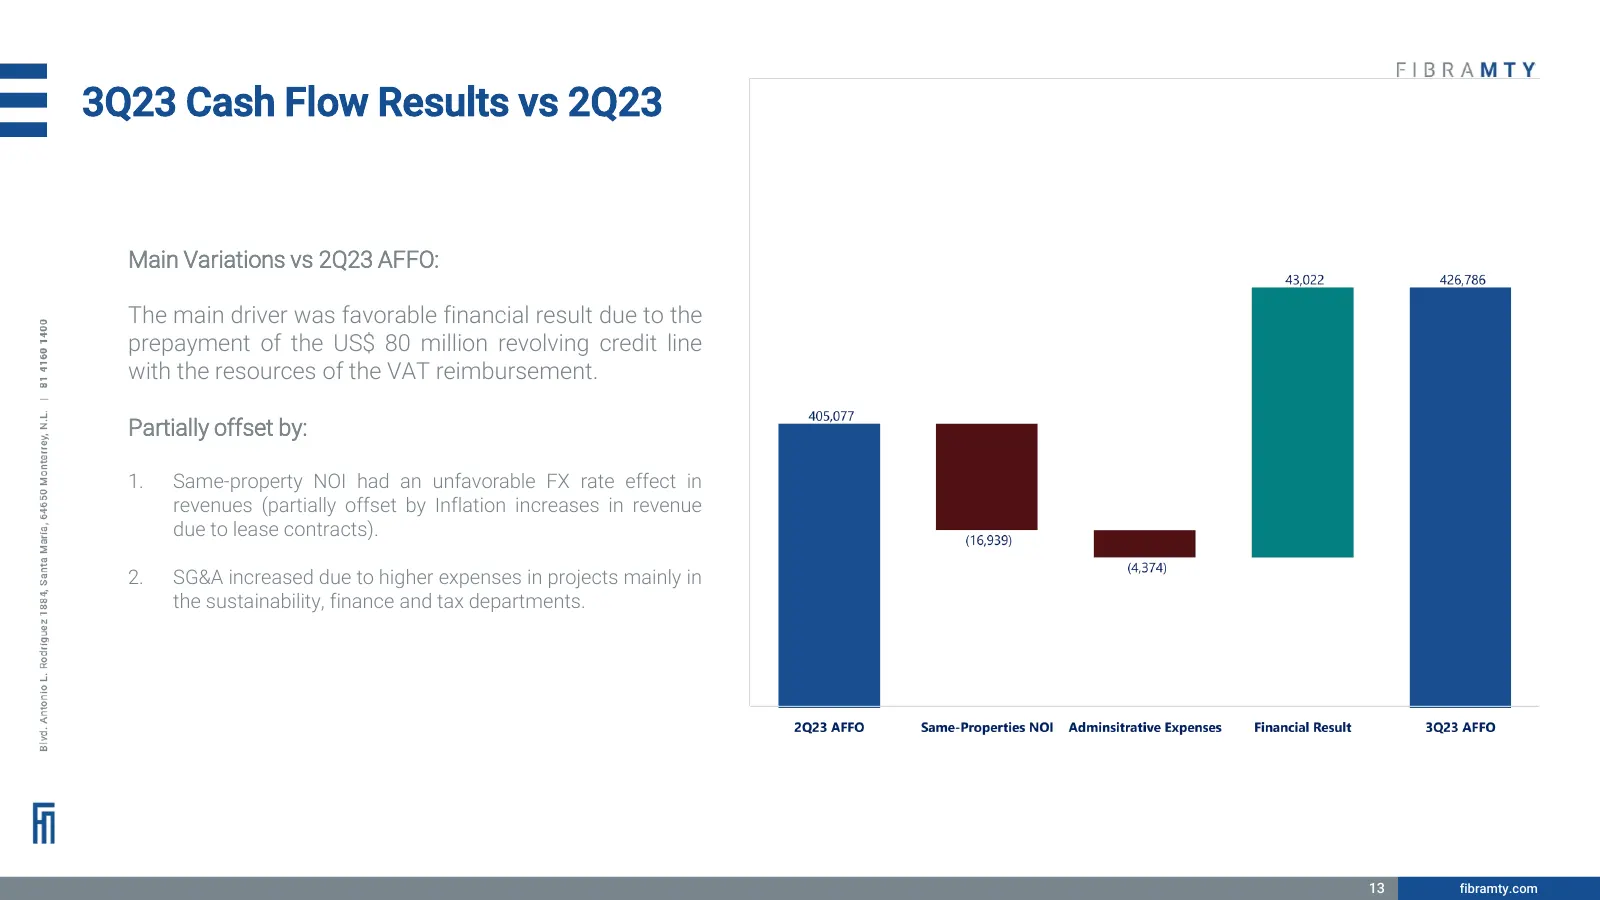
3Q23 Cash Flow Results vs 2Q23 Main Variations vs 2Q23 AFFO: The main driver was favorable financial result due to the prepayment of the US$ 80 million revolving credit line with the resources of the VAT reimbursement. Partially offset by: 1. Same-property NOI had an unfavorable FX rate effect in re
Slide 14: Selected Financial Information
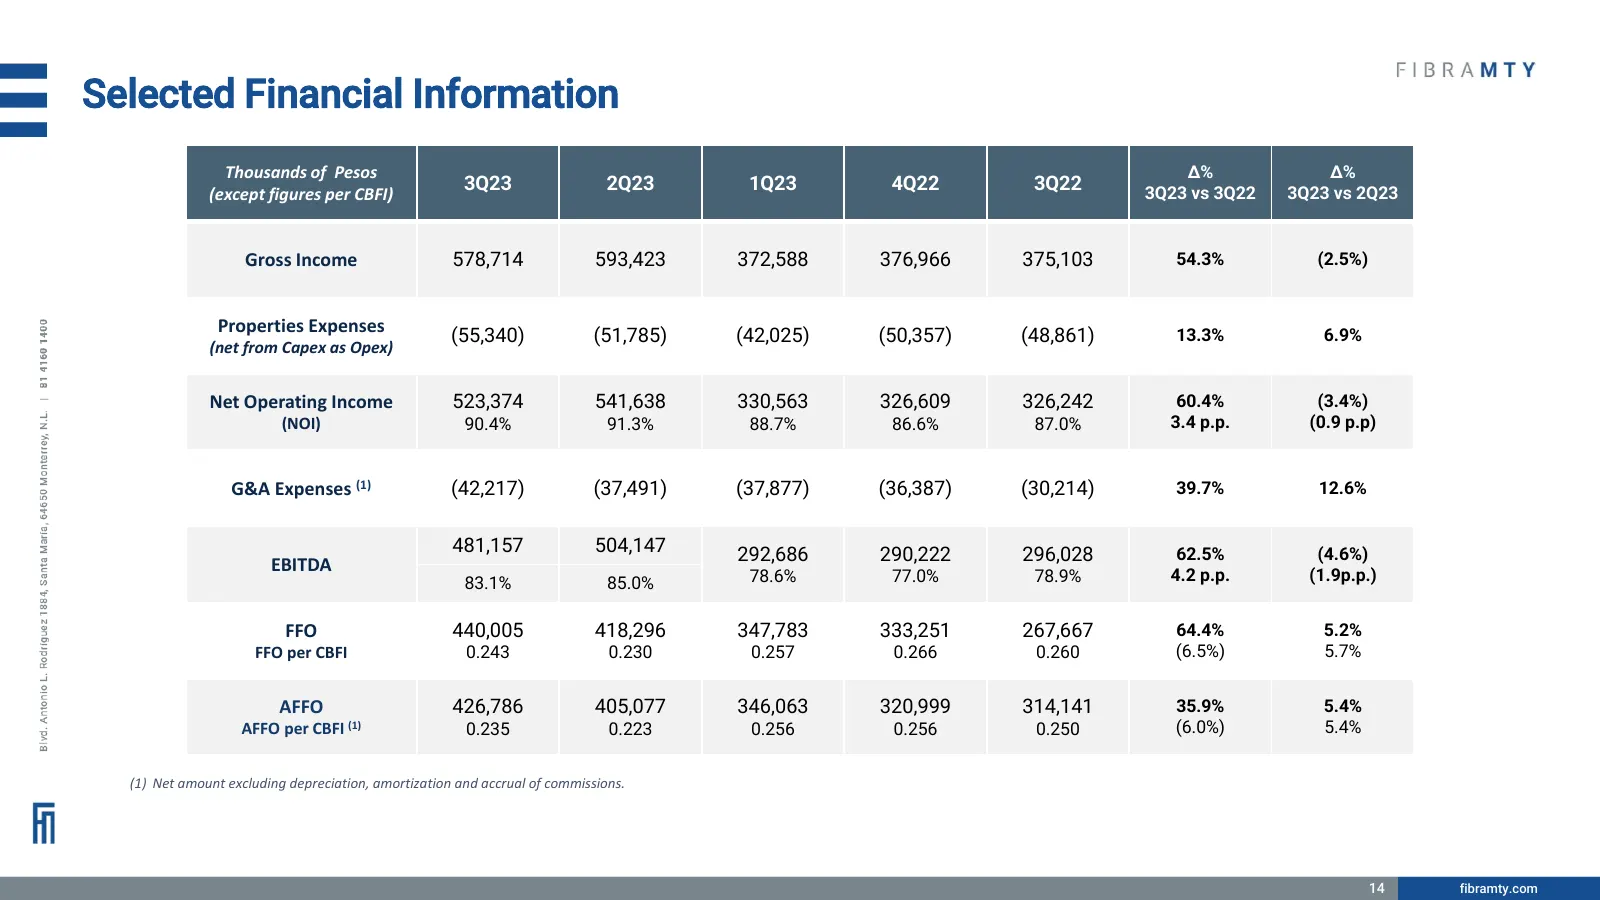
Selected Financial Information Thousands of Pesos Δ% Δ% 3Q23 2Q23 1Q23 4Q22 3Q22 3Q23 vs 3Q22 3Q23 vs 2Q23 (except figures per CBFI) Gross Income 578,714 593,423 372,588 376,966 375,103 54.3% (2.5%) Properties Expenses (55,340) (51,785) (42,025) (50,357) (48,861) 13.3% 6.9% (net from Capex as Opex)
Slide 15: Industrial, USD-denominated, Inflation linked Revenues with long WALT
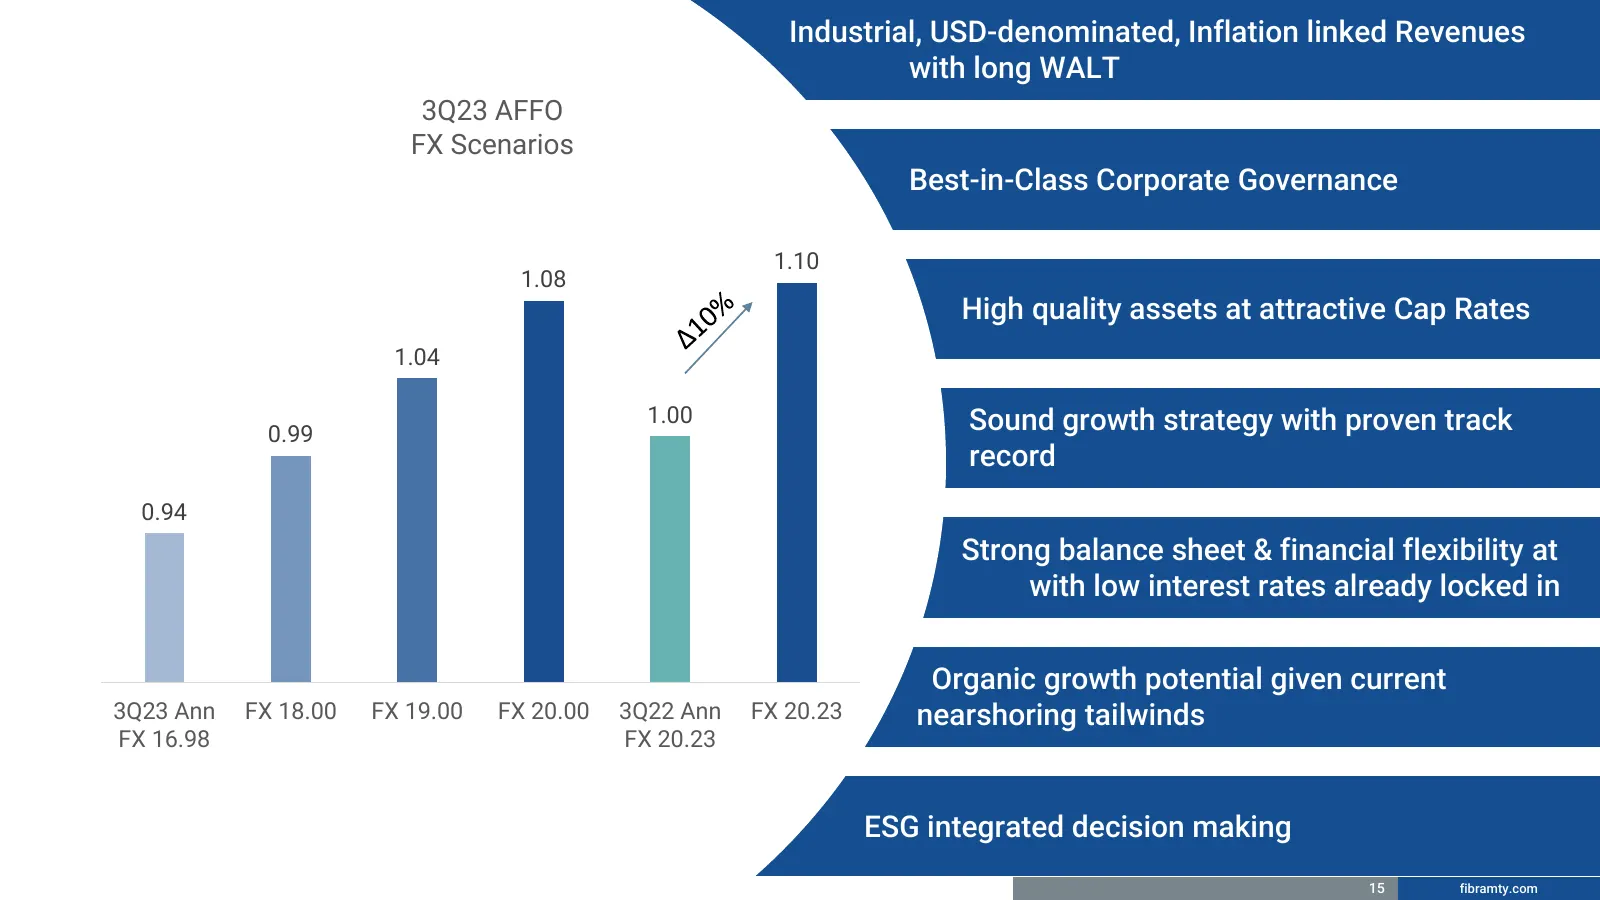
Industrial, USD-denominated, Inflation linked Revenues with long WALT 3Q23 AFFO FX Scenarios Best-in-Class Corporate Governance 1.10 1.08 High quality assets at attractive Cap Rates 1.04 1.00 Sound growth strategy with proven track 0.99 record 0.94 Strong balance sheet & financial flexibility at wit

Slide 16: Contact
Sistema de Entrenamiento en Ciberseguridad Contact: Cesar Rubalcava, CFA, CAIA Investor Relations crubalcava@fibramty.com
Source: Internet Archive copy of investorcloud.s3.amazonaws.com
More decks from Fibra MTY
 Q3 2024 Earnings Presentation24 slides · October 2024
 Q1 2024 Earnings Presentation18 slides · April 2024
 Q4 2023 Earnings Presentation16 slides · February 2024
 Q2 2023 Earnings Presentation17 slides · July 2023
 Q1 2023 Earnings Presentation16 slides · April 2023
 Q4 2022 Earnings Presentation20 slides · February 2023