Fibra MTY · BIVA:FMTY/14
Fibra MTY — Q1 2023 Earnings Presentation
16 slides from Fibra MTY's earnings presentation, April 2023
Slide 1: 1Q23 Quarterly Results Update
Sistema de 1Q23 Quarterly Results Entrenamiento en Update Ciberseguridad Trust F/2157 – FMTY14 April, 2023
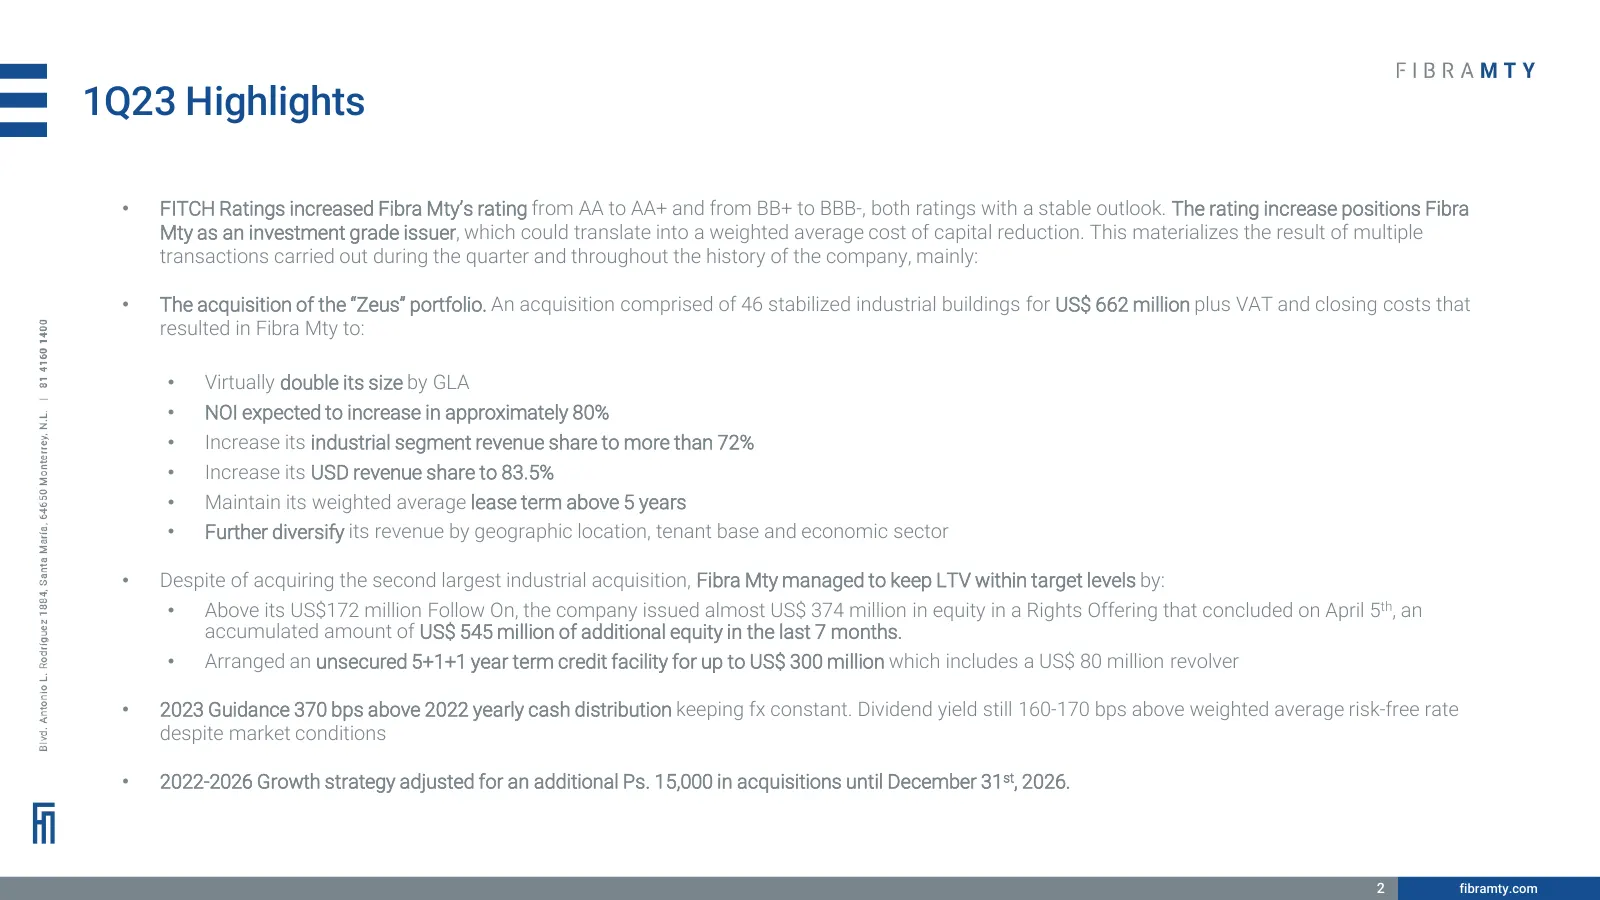
Slide 2: 1Q23 Highlights
1Q23 Highlights • FITCH Ratings increased Fibra Mty’s rating from AA to AA+ and from BB+ to BBB-, both ratings with a stable outlook. The rating increase positions Fibra Mty as an investment grade issuer, which could translate into a weighted average cost of capital reduction. This materializes the
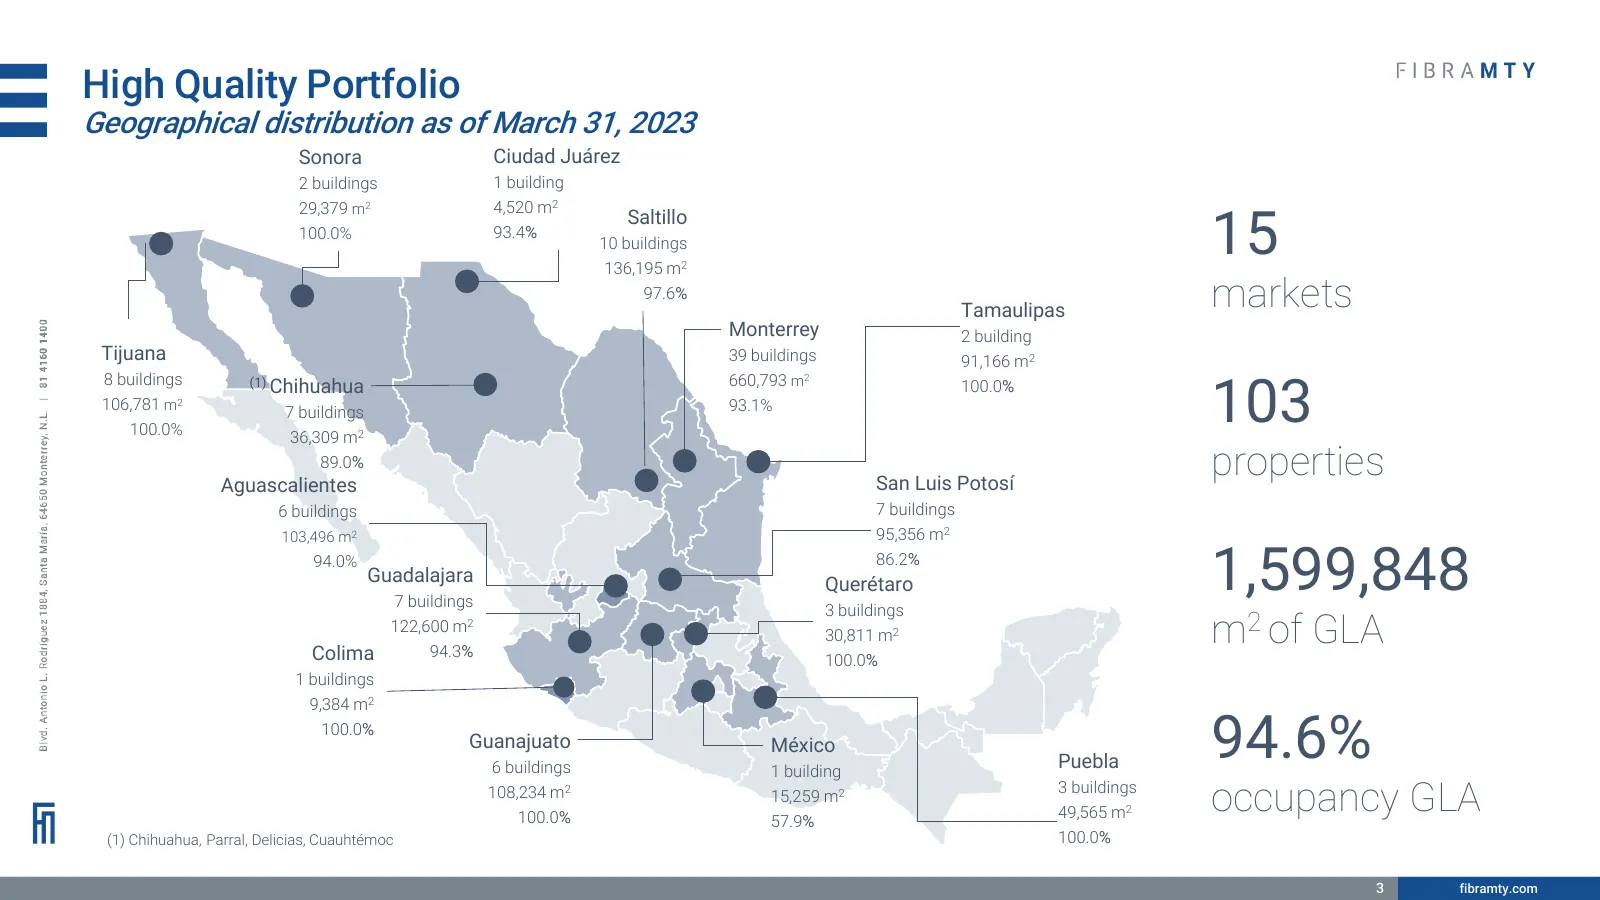
Slide 3: High Quality Portfolio
High Quality Portfolio Geographical distribution as of March 31, 2023 Sonora Ciudad Juárez 2 buildings 1 building 15 29,379 m2 4,520 m2 Saltillo 100.0% 93.4% 10 buildings 136,195 m2 97.6% Tamaulipas markets Monterrey 2 building Tijuana 39 buildings 91,166 m2 103 8 buildings (1) Chihuahua 660,793 m2
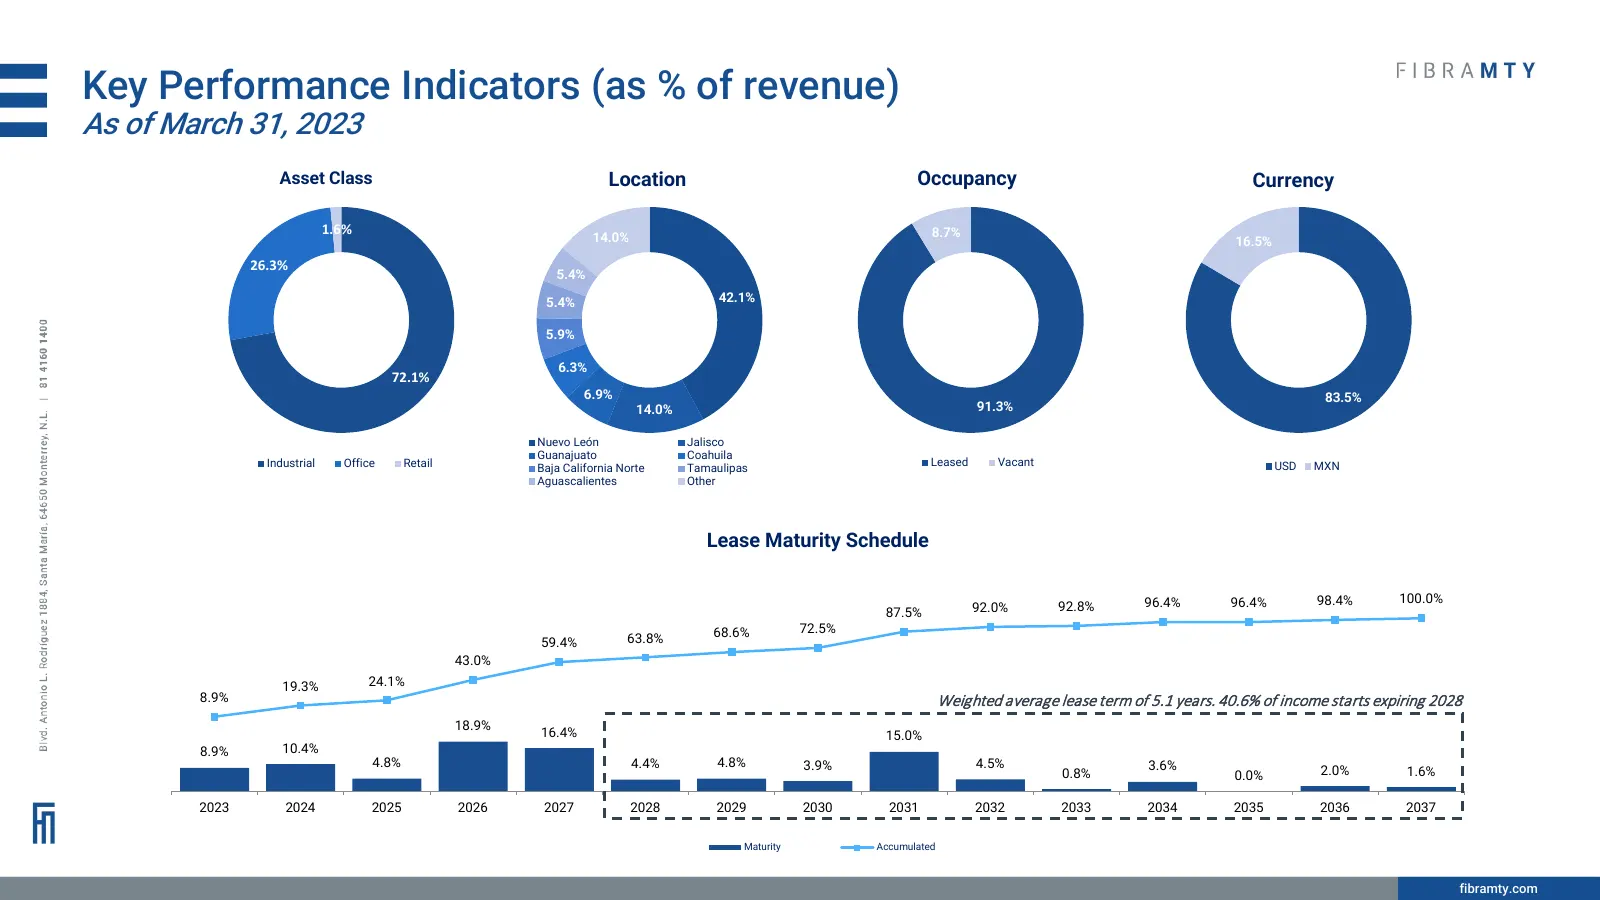
Slide 4: Key Performance Indicators (as % of revenue)
Key Performance Indicators (as % of revenue) As of March 31, 2023 Asset Class Location Occupancy Currency 1.6% 8.7% 14.0% 16.5% 26.3% 5.4% 5.4% 42.1% 5.9% 6.3% 72.1% 6.9% 83.5% 14.0% 91.3% Nuevo León Jalisco Guanajuato Coahuila Leased Vacant 4 Industrial Office Retail Baja California Norte Tamaulipa
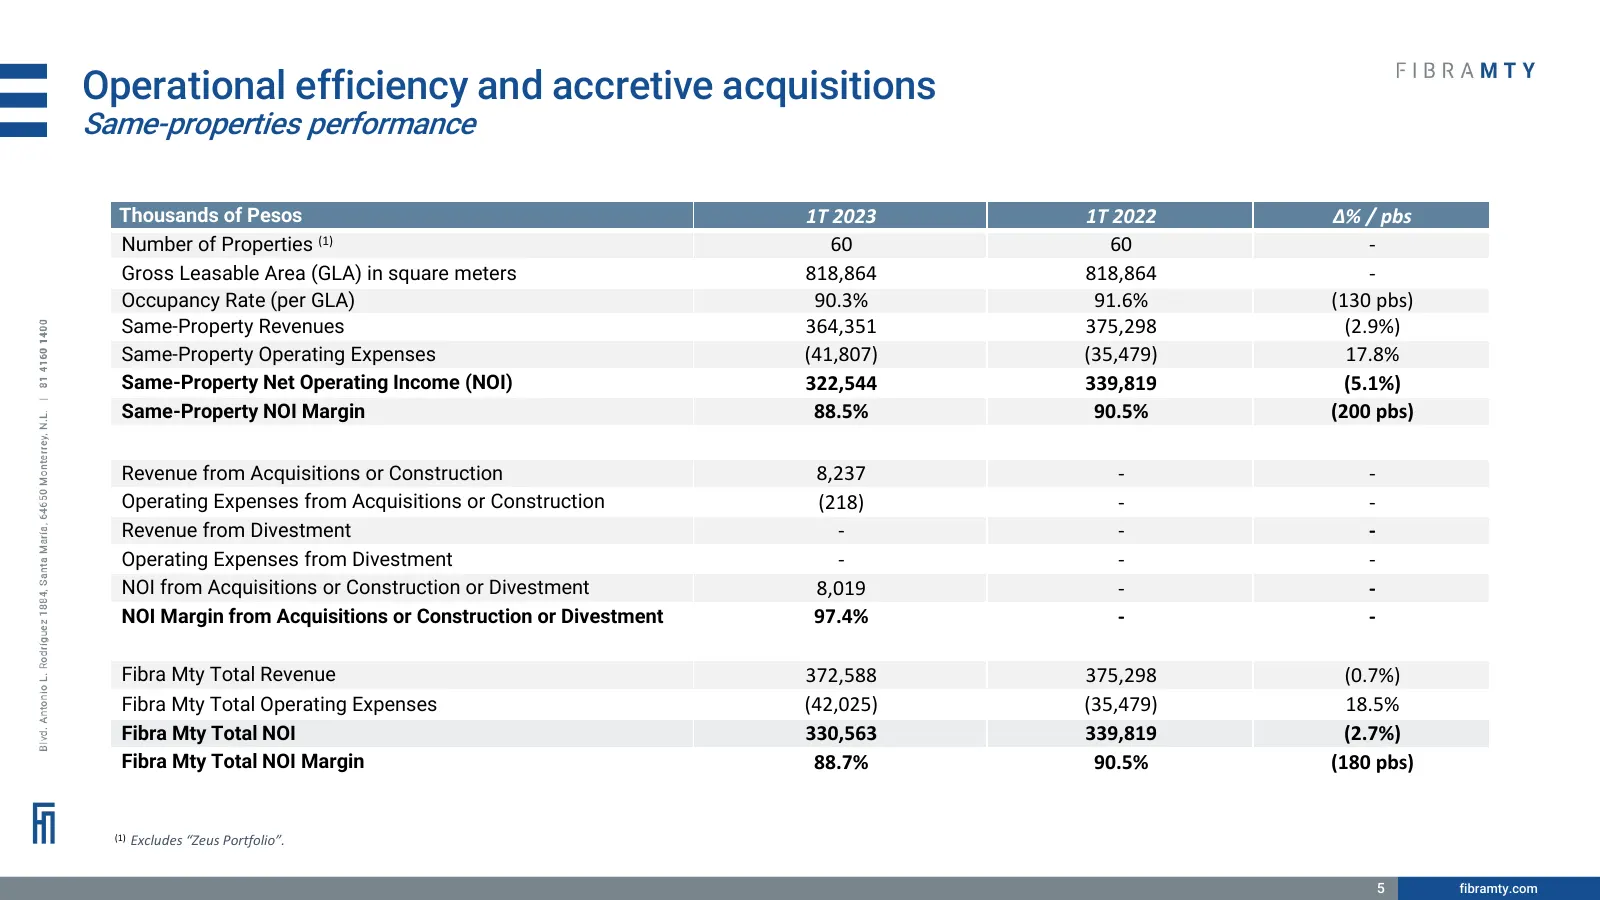
Slide 5: Operational efficiency and accretive acquisitions
Operational efficiency and accretive acquisitions Same-properties performance Thousands of Pesos 1T 2023 1T 2022 Δ% / pbs Number of Properties (1) 60 60 - Gross Leasable Area (GLA) in square meters 818,864 818,864 - Occupancy Rate (per GLA) 90.3% 91.6% (130 pbs) Same-Property Revenues 364,351 375,29
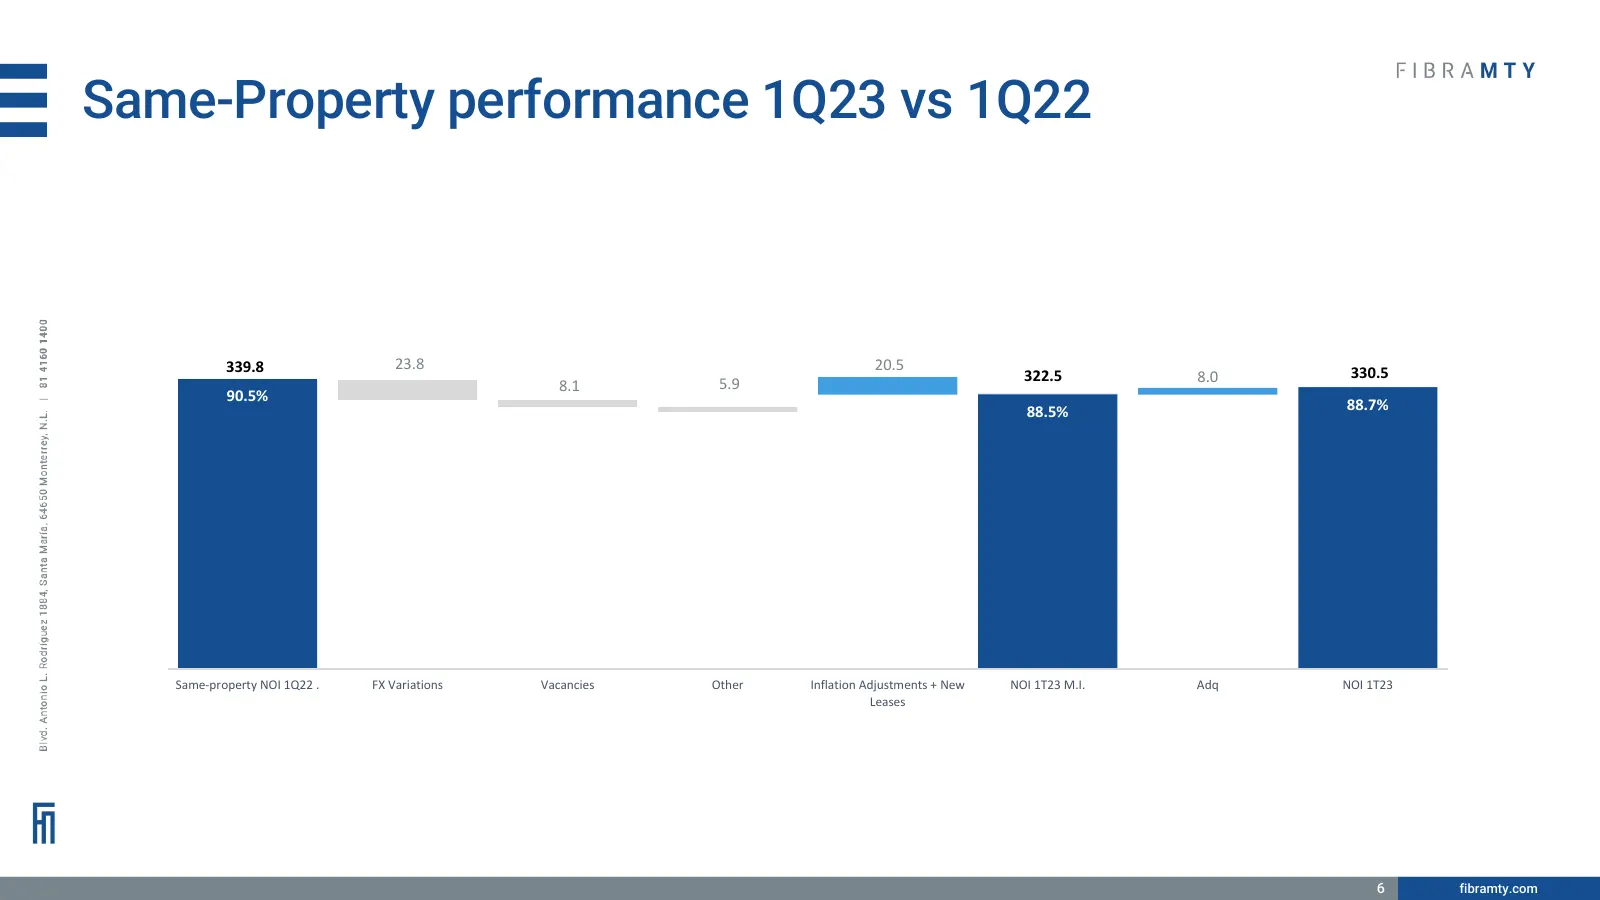
Slide 6: Same-Property performance 1Q23 vs 1Q22
Same-Property performance 1Q23 vs 1Q22 339.8 23.8 20.5 322.5 8.0 330.5 8.1 5.9 90.5% 88.5% 88.7% Same-property NOI 1Q22 . FX Variations Vacancies Other Inflation Adjustments + New NOI 1T23 M.I. Adq NOI 1T23 Leases 6 fibramty.com
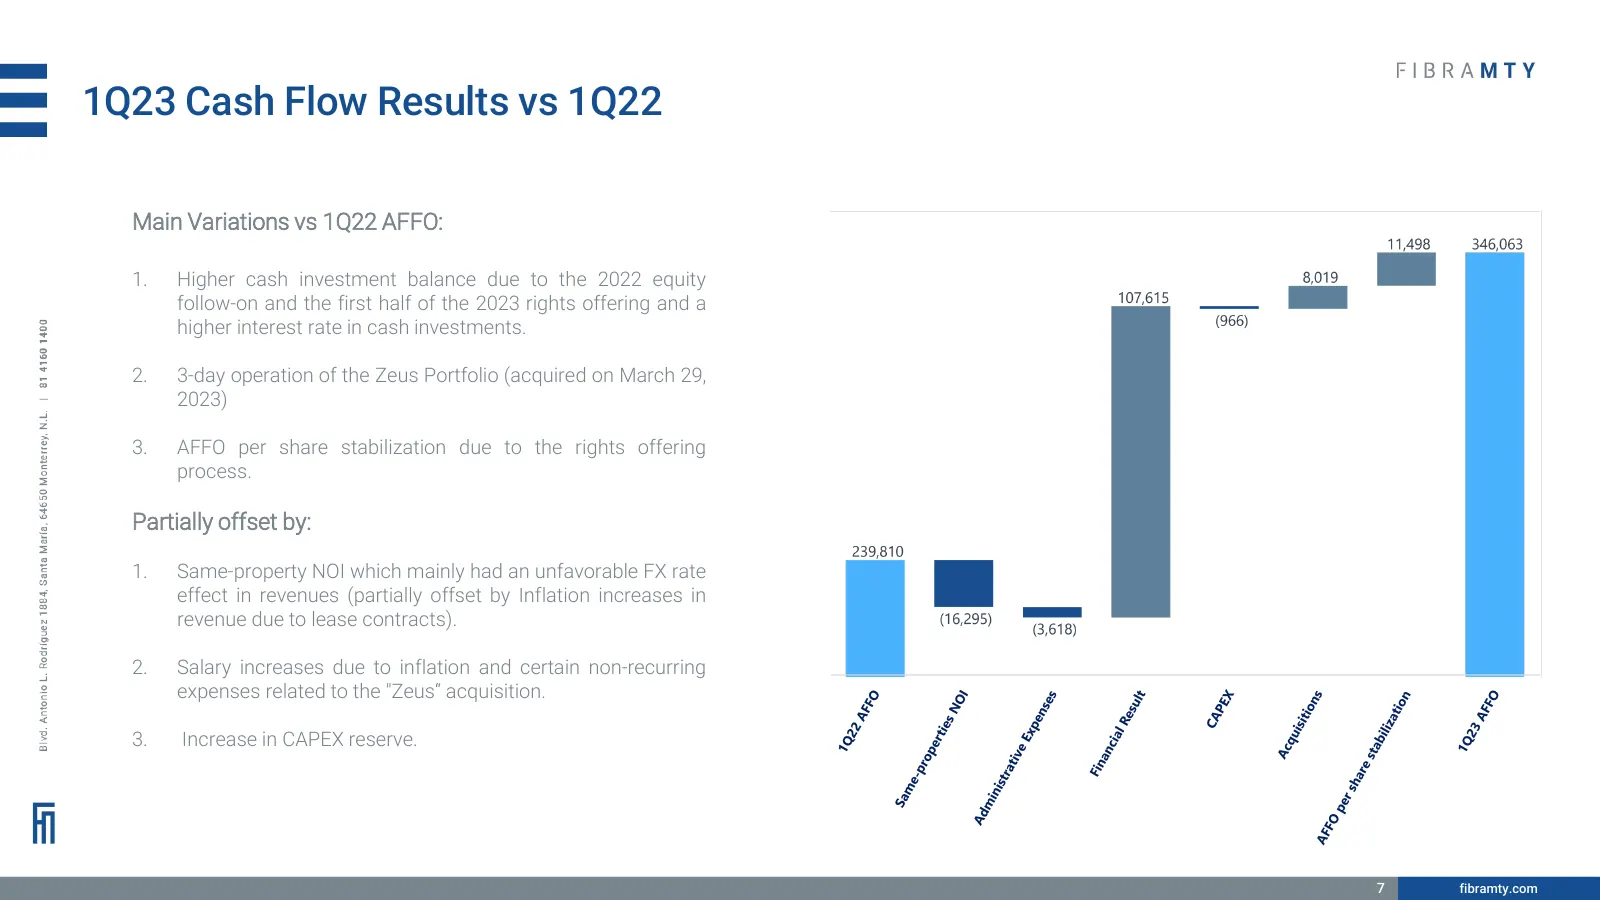
Slide 7: 1Q23 Cash Flow Results vs 1Q22
1Q23 Cash Flow Results vs 1Q22 Main Variations vs 1Q22 AFFO: 1. Higher cash investment balance due to the 2022 equity follow-on and the first half of the 2023 rights offering and a higher interest rate in cash investments. 2. 3-day operation of the Zeus Portfolio (acquired on March 29, 2023) 3. AFFO
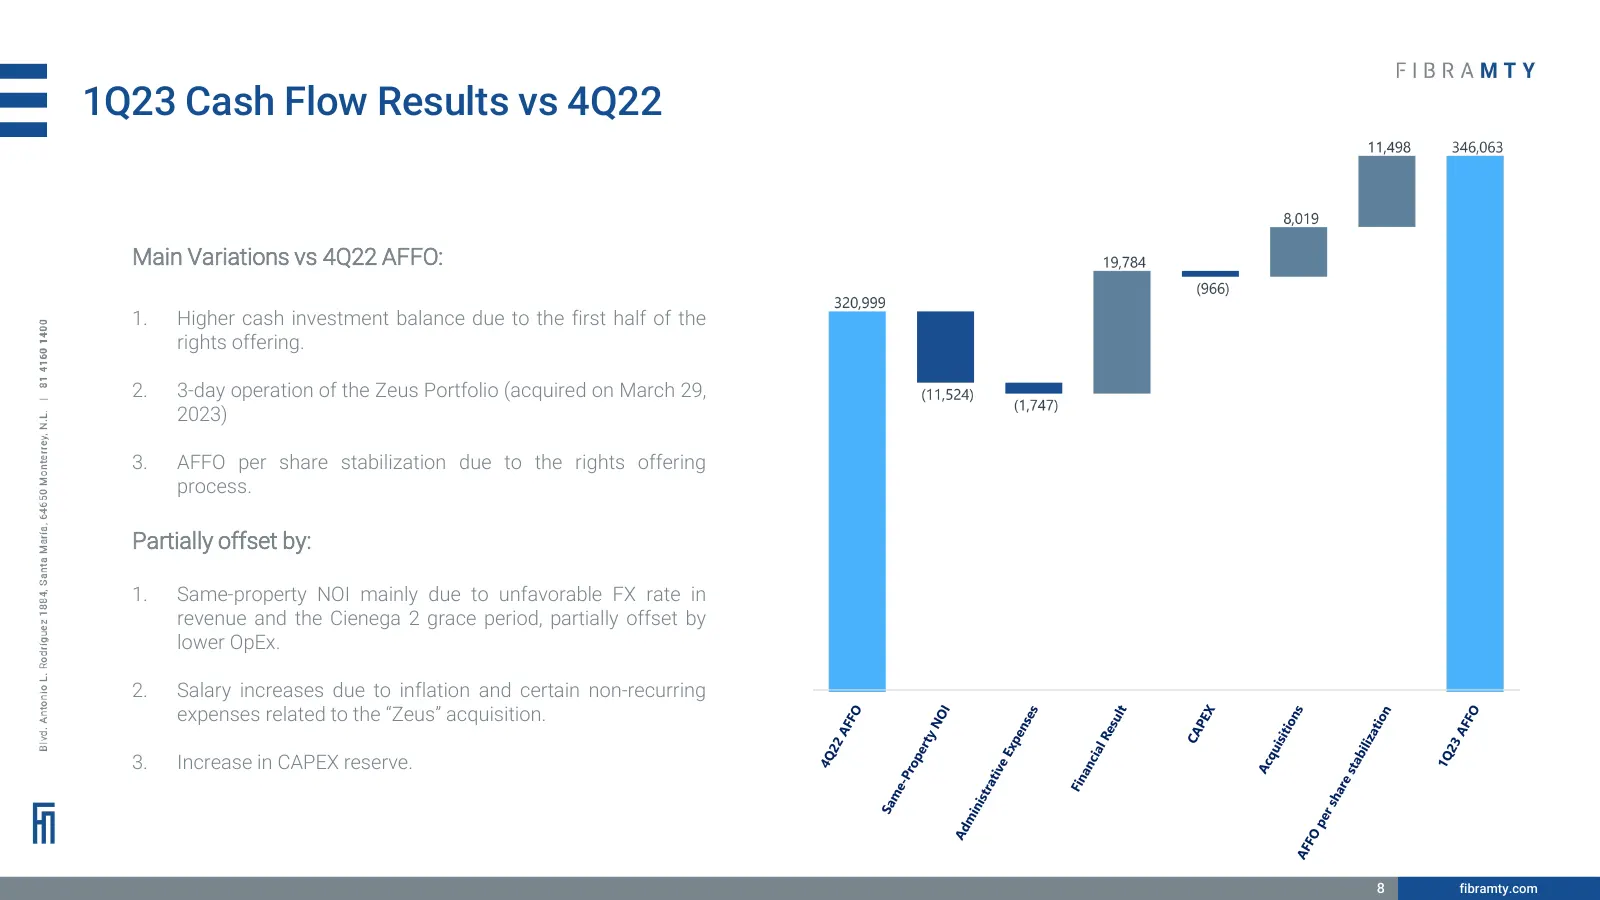
Slide 8: 1Q23 Cash Flow Results vs 4Q22
1Q23 Cash Flow Results vs 4Q22 Main Variations vs 4Q22 AFFO: 1. Higher cash investment balance due to the first half of the rights offering. 2. 3-day operation of the Zeus Portfolio (acquired on March 29, 2023) 3. AFFO per share stabilization due to the rights offering process. Partially offset by:
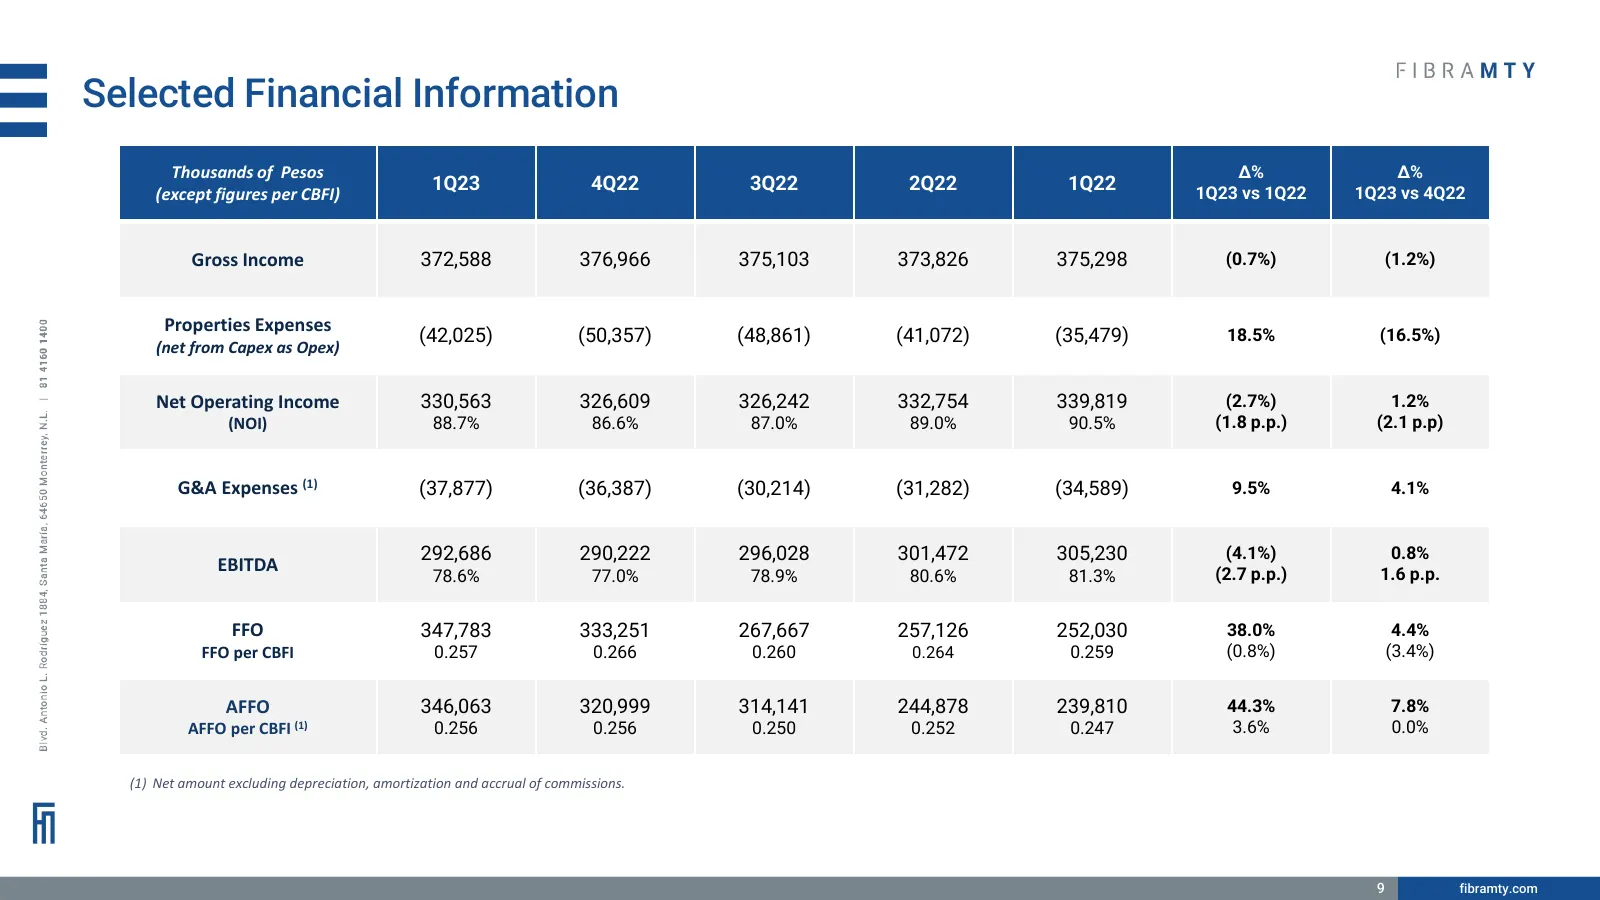
Slide 9: Selected Financial Information
Selected Financial Information Thousands of Pesos Δ% Δ% 1Q23 4Q22 3Q22 2Q22 1Q22 1Q23 vs 1Q22 1Q23 vs 4Q22 (except figures per CBFI) Gross Income 372,588 376,966 375,103 373,826 375,298 (0.7%) (1.2%) Properties Expenses (42,025) (50,357) (48,861) (41,072) (35,479) 18.5% (16.5%) (net from Capex as Op
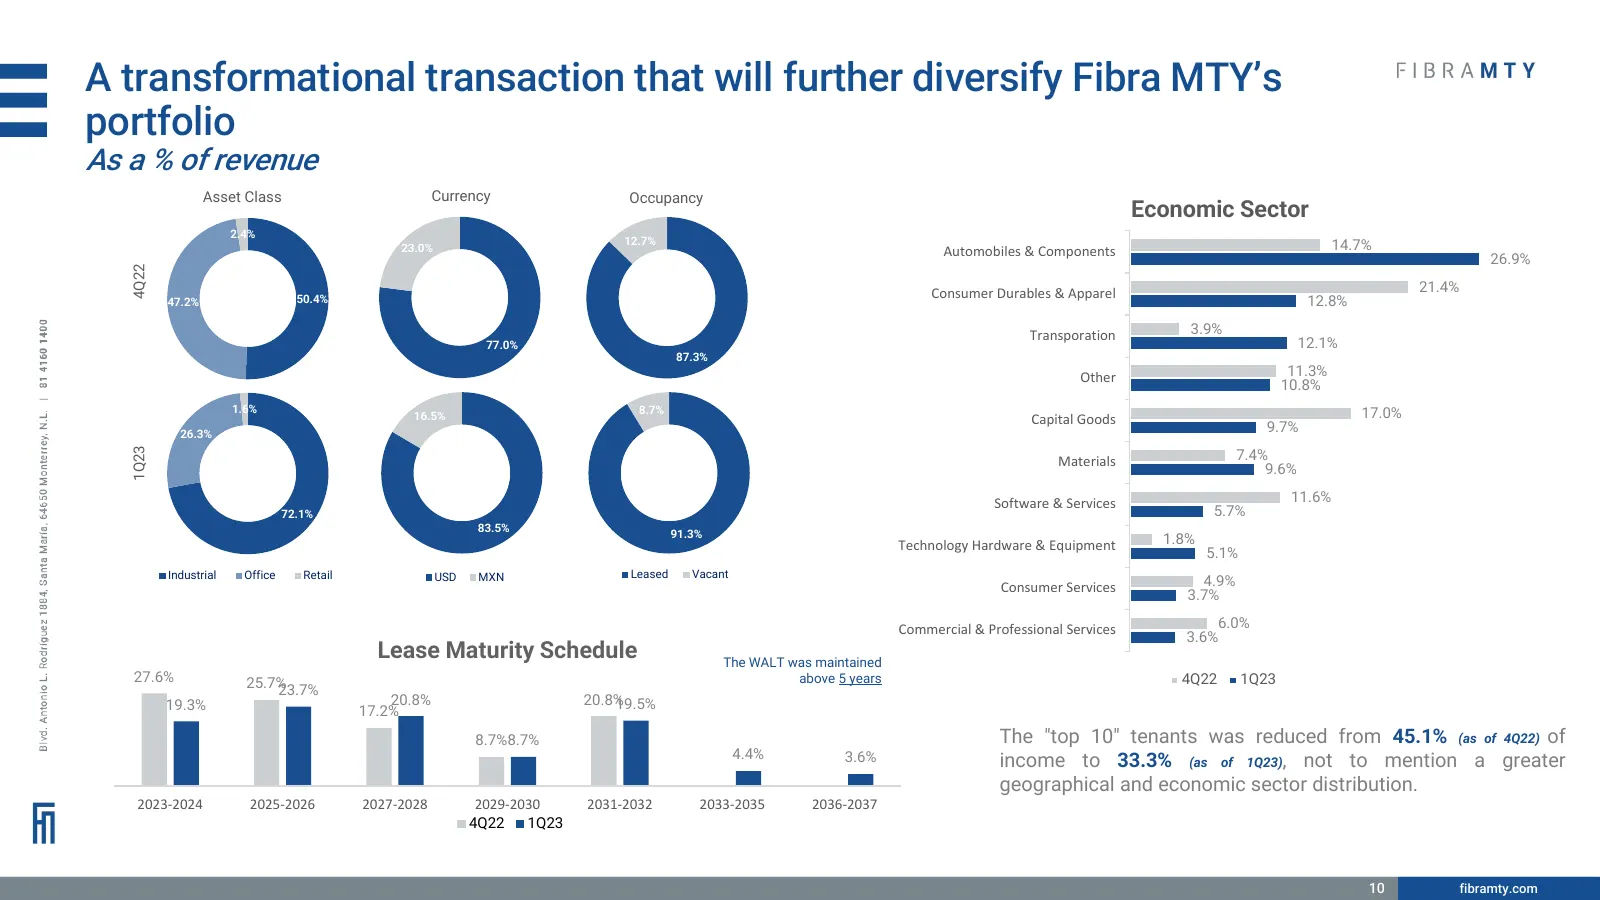
Slide 10: A transformational transaction that will further diversify Fibra MTY's portfolio
A transformational transaction that will further diversify Fibra MTY’s portfolio As a % of revenue Asset Class Currency Occupancy Economic Sector 2.4% 12.7% 14.7% 23.0% Automobiles & Components 26.9% 4Q22 Consumer Durables & Apparel 21.4% 47.2% 50.4% 12.8% Transporation 3.9% 77.0% 12.1% 87.3% Other
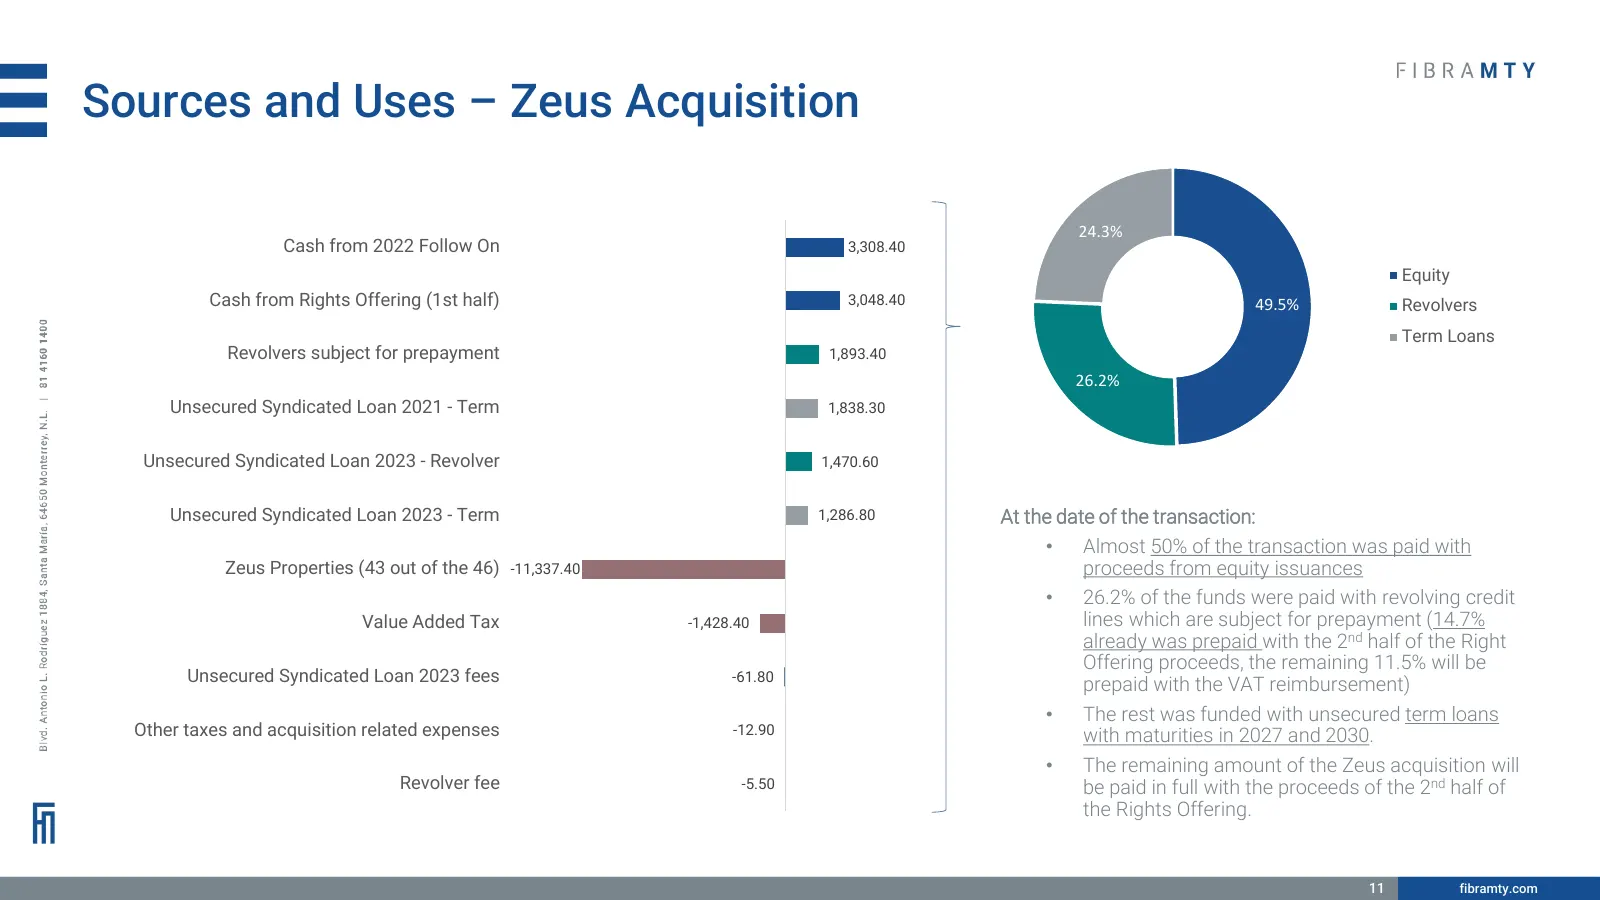
Slide 11: Sources and Uses – Zeus Acquisition
Sources and Uses – Zeus Acquisition 24.3% Cash from 2022 Follow On 3,308.40 Equity Cash from Rights Offering (1st half) 3,048.40 49.5% Revolvers Term Loans Revolvers subject for prepayment 1,893.40 26.2% Unsecured Syndicated Loan 2021 - Term 1,838.30 Unsecured Syndicated Loan 2023 - Revolver 1,470.6
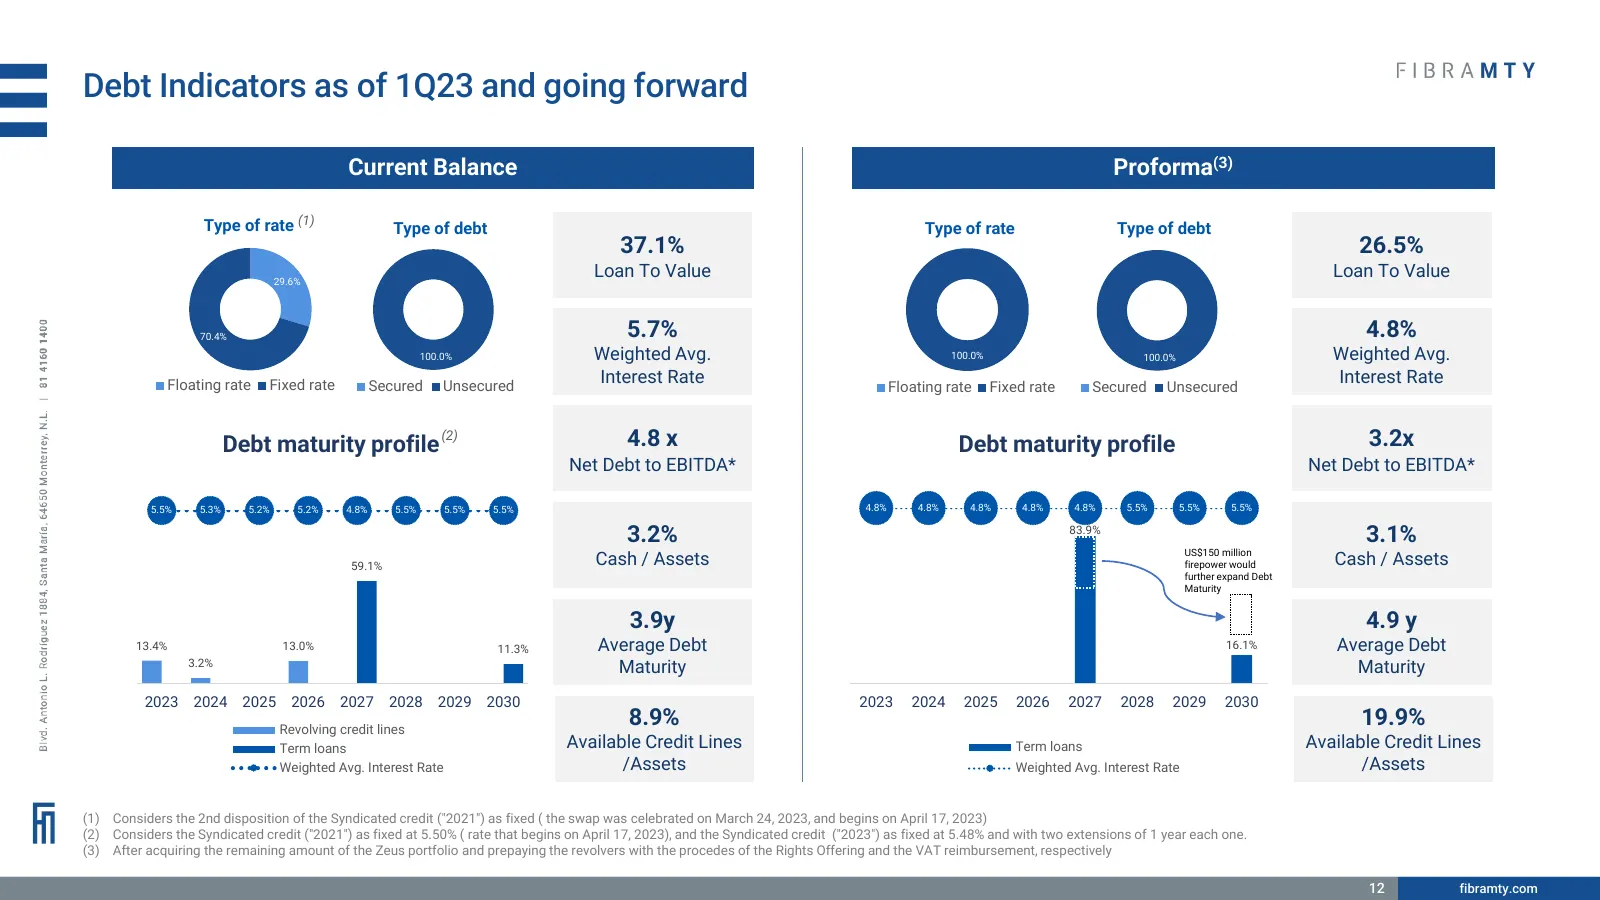
Slide 12: Debt Indicators as of 1Q23 and going forward
Debt Indicators as of 1Q23 and going forward Current Balance Proforma(3) Type of rate (1) Type of debt Type of rate Type of debt 37.1% 26.5% 29.6% Loan To Value Loan To Value 70.4% 5.7% 4.8% 100.0% Weighted Avg. 100.0% 100.0% Weighted Avg. Floating rate Fixed rate Secured Unsecured Interest Rate Sec
Slide 13: Market Cap size above US$ 1.2 billion
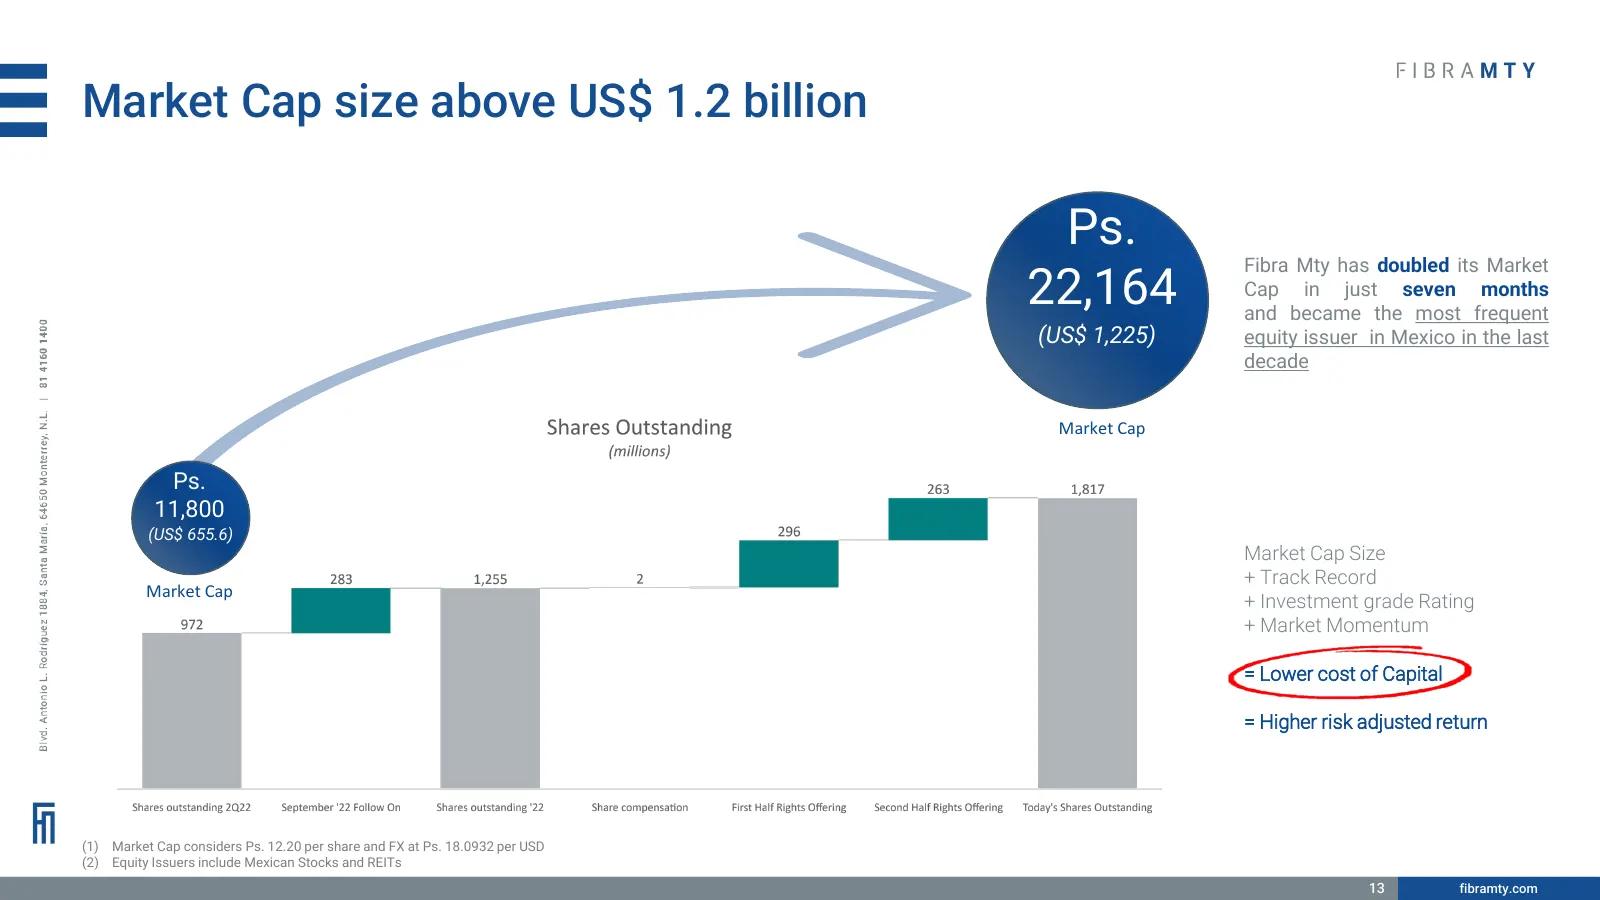
Market Cap size above US$ 1.2 billion Ps. Fibra Mty has doubled its Market 22,164 Cap in just seven months and became the most frequent (US$ 1,225) equity issuer in Mexico in the last decade Market Cap Ps. 11,800 (US$ 655.6) Market Cap Size + Track Record Market Cap + Investment grade Rating + Marke
Slide 14: 2023 guidance
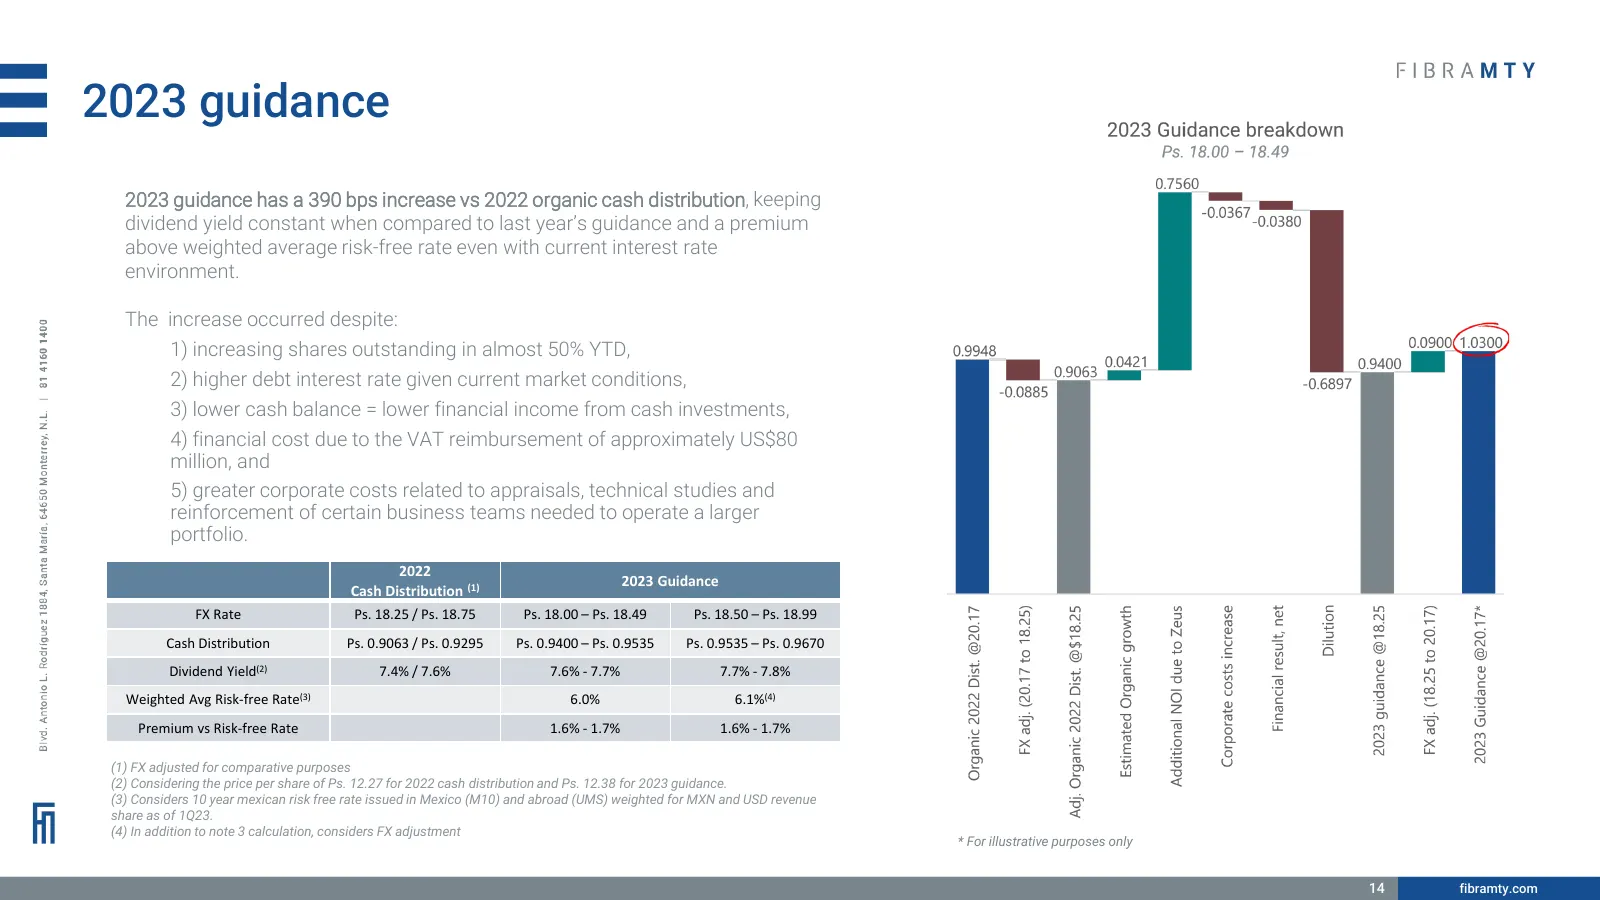
2023 guidance 2023 guidance has a 390 bps increase vs 2022 organic cash distribution, keeping dividend yield constant when compared to last year’s guidance and a premium above weighted average risk-free rate even with current interest rate environment. The increase occurred despite: 1) increasing sh
Slide 15: Fibra Mty completed 76% of its 2022-2026 growth strategy
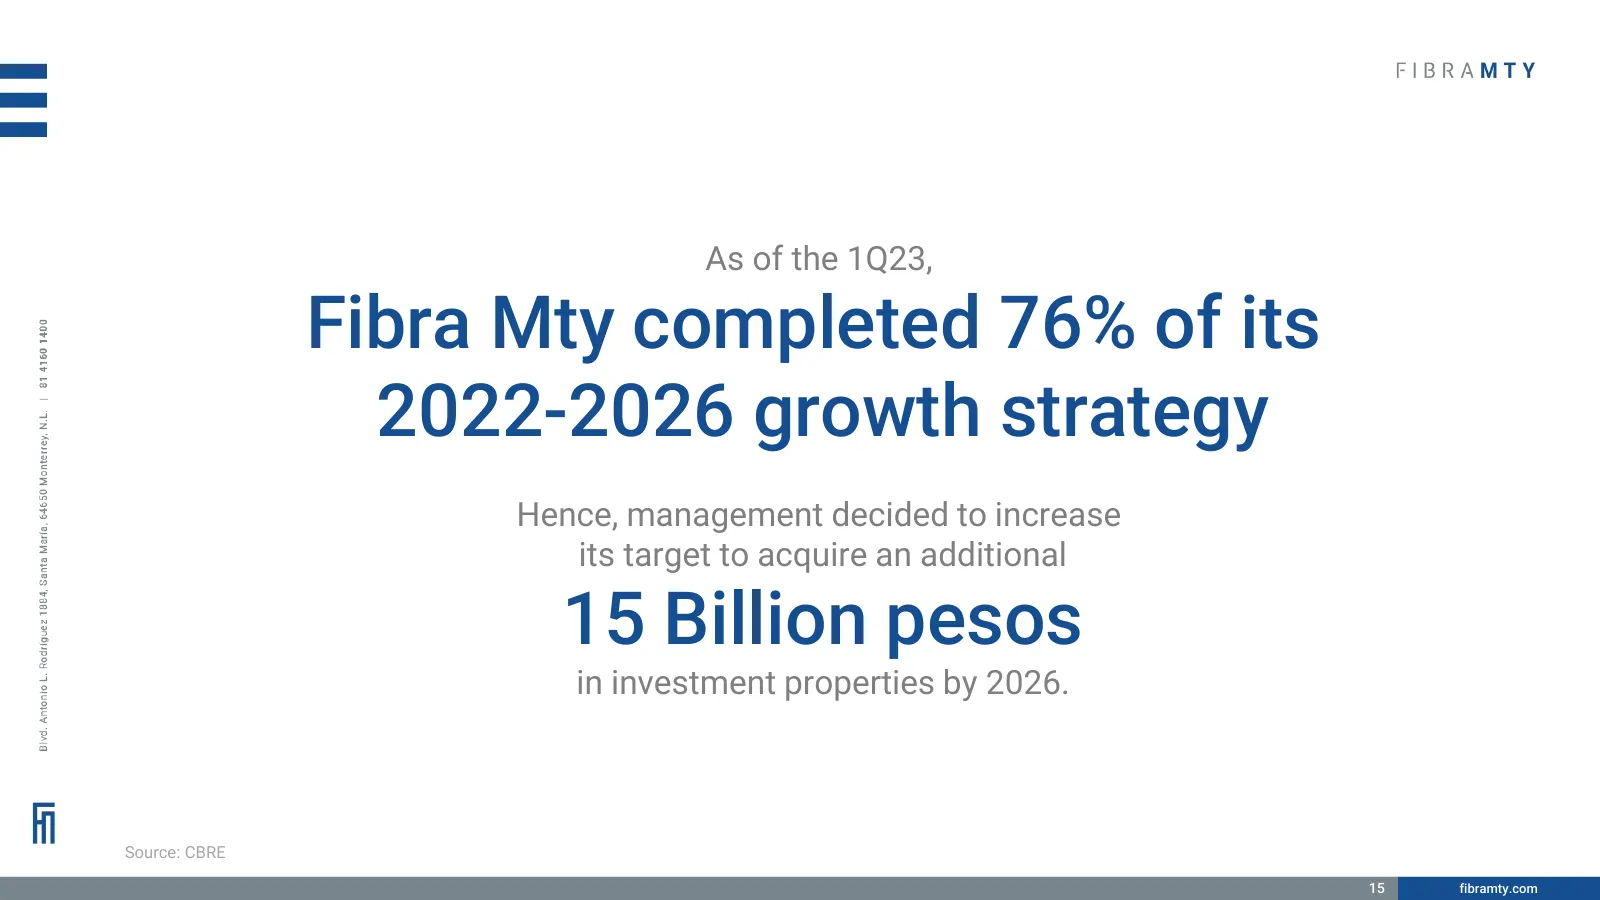
As of the 1Q23, Fibra Mty completed 76% of its 2022-2026 growth strategy Hence, management decided to increase its target to acquire an additional 15 Billion pesos in investment properties by 2026. Source: CBRE 15 fibramty.com

Slide 16: Contact
Sistema de Entrenamiento en Ciberseguridad Contact: Cesar Rubalcava, CFA, CAIA Investor Relations crubalcava@fibramty.com
Source: Internet Archive copy of investorcloud.s3.amazonaws.com
More decks from Fibra MTY
 Q3 2024 Earnings Presentation24 slides · October 2024
 Q1 2024 Earnings Presentation18 slides · April 2024
 Q4 2023 Earnings Presentation16 slides · February 2024
 Q3 2023 Earnings Presentation16 slides · October 2023
 Q2 2023 Earnings Presentation17 slides · July 2023
 Q4 2022 Earnings Presentation20 slides · February 2023