Inland Real Estate — Shareholder Meeting (June 2008)
17 slides from Inland Real Estate's shareholder meeting presentation, Jun 11, 2008
Slide 1: Annual Shareholders Meeting
Annual Shareholders Meeting NYSE: IRC June 11, 2008
Slide 2: Forward-Looking Statements
2 FORWARD-LOOKING STATEMENTS • These presentation materials contain forward-looking statements. Forward-looking statements are statements that are not historical, including statements regarding management's intentions, beliefs, expectations, representations, plans or predictions of the future, and a
Slide 3: IRC Snapshot Profile
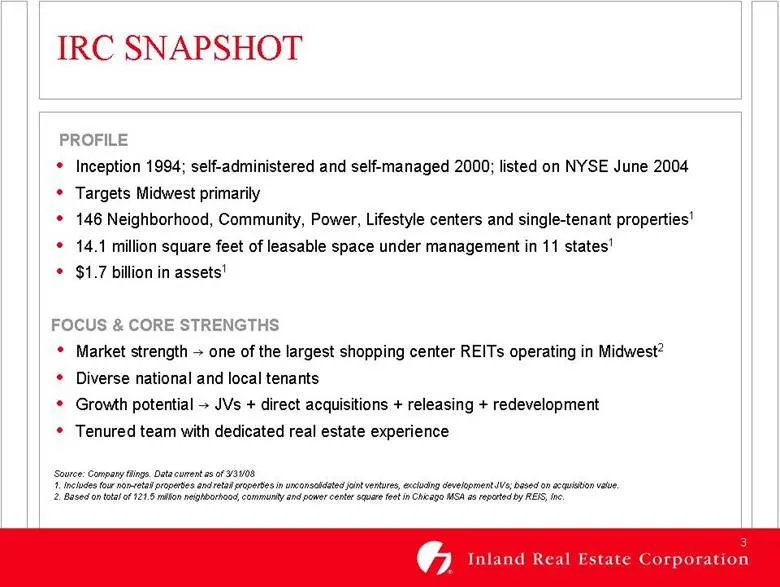
3 IRC SNAPSHOT PROFILE • Inception 1994; self-administered and self-managed 2000; listed on NYSE June 2004 • Targets Midwest primarily • 146 Neighborhood, Community, Power, Lifestyle centers and single-tenant properties1 • 14.1 million square feet of leasable space under management in 11 states1 • $
Slide 4: IRC Retail Portfolio
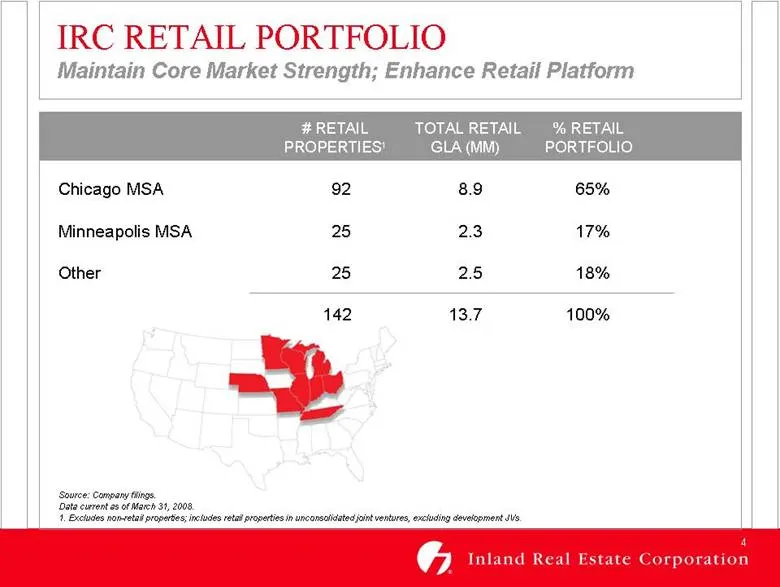
4 IRC RETAIL PORTFOLIO Maintain Core Market Strength; Enhance Retail Platform Chicago MSA 92 8.9 65% Minneapolis MSA 25 2.3 17% Other 25 2.5 18% 142 13.7 100% # RETAIL TOTAL RETAIL % RETAIL PROPERTIES1 GLA (MM) PORTFOLIO Source: Company filings. Data current as of March 31, 2008. 1. Excludes non-ret
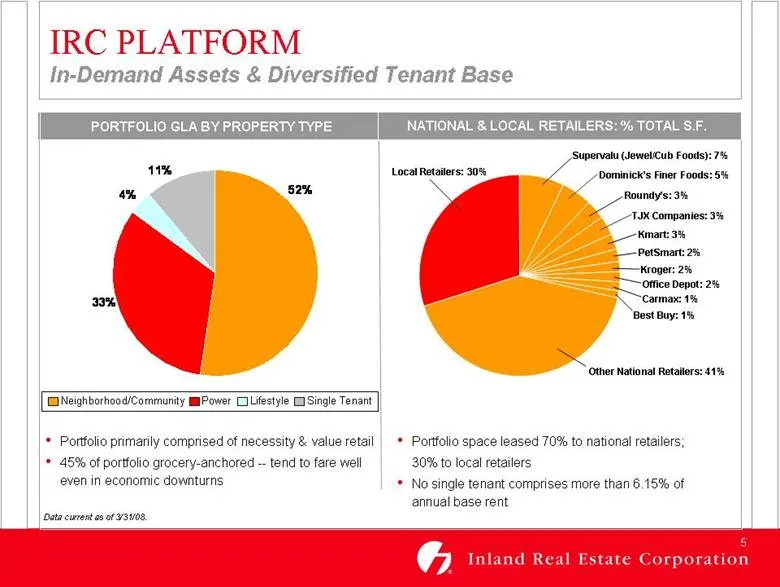
Slide 5: IRC Platform: In-Demand Assets & Diversified Tenant Base
5 11% 52% 33% 4% PORTFOLIO GLA BY PROPERTY TYPE NATIONAL & LOCAL RETAILERS: % TOTAL S.F. IRC PLATFORM In-Demand Assets & Diversified Tenant Base • Portfolio space leased 70% to national retailers; 30% to local retailers • No single tenant comprises more than 6.15% of annual base rent Data current as
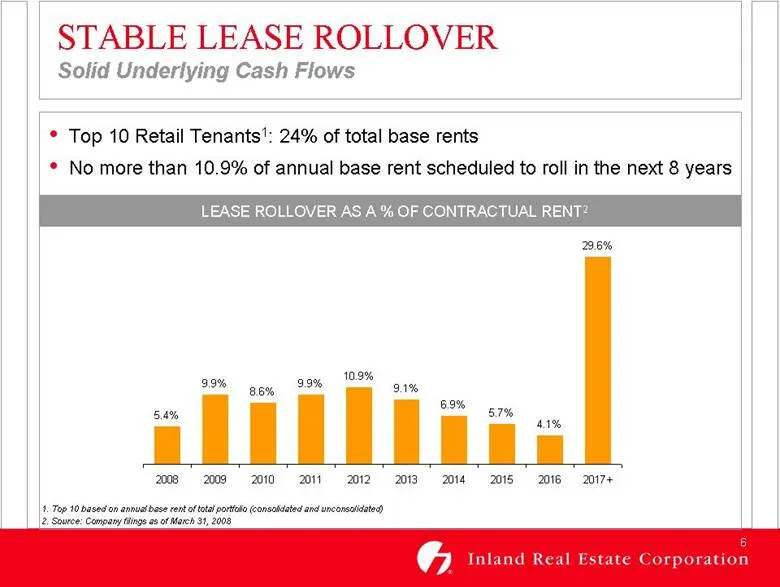
Slide 6: Stable Lease Rollover
6 STABLE LEASE ROLLOVER Solid Underlying Cash Flows • Top 10 Retail Tenants1: 24% of total base rents • No more than 10.9% of annual base rent scheduled to roll in the next 8 years LEASE ROLLOVER AS A % OF CONTRACTUAL RENT2 1. Top 10 based on annual base rent of total portfolio (consolidated and unc
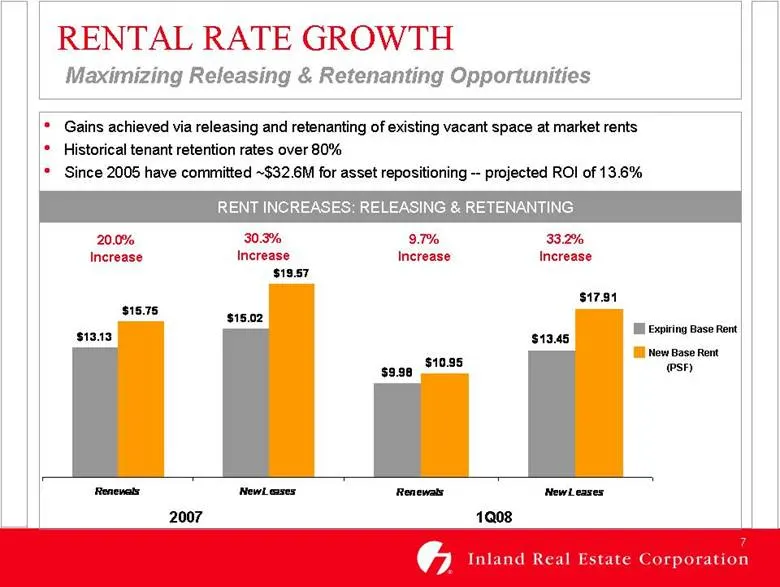
Slide 7: Rental Rate Growth
7 RENTAL RATE GROWTH Maximizing Releasing & Retenanting Opportunities • Gains achieved via releasing and retenanting of existing vacant space at market rents • Historical tenant retention rates over 80% • Since 2005 have committed ~$32.6M for asset repositioning -- projected ROI of 13.6% RENT RELEAS
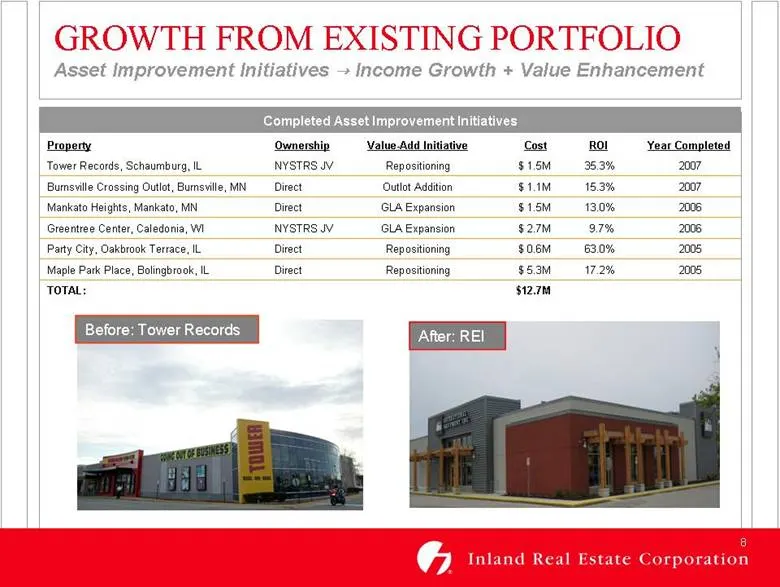
Slide 8: Growth from Existing Portfolio: Completed Asset Improvement Initiatives
8 2007 35.3% $ 1.5M Repositioning NYSTRS JV Tower Records, Schaumburg, IL Completed Asset Improvement Initiatives $12.7M $ 5.3M $ 0.6M $ 2.7M $ 1.5M $ 1.1M Cost Direct Direct NYSTRS JV Direct Direct Ownership TOTAL: 2005 17.2% Repositioning Maple Park Place, Bolingbrook, IL 2005 63.0% Repositioning
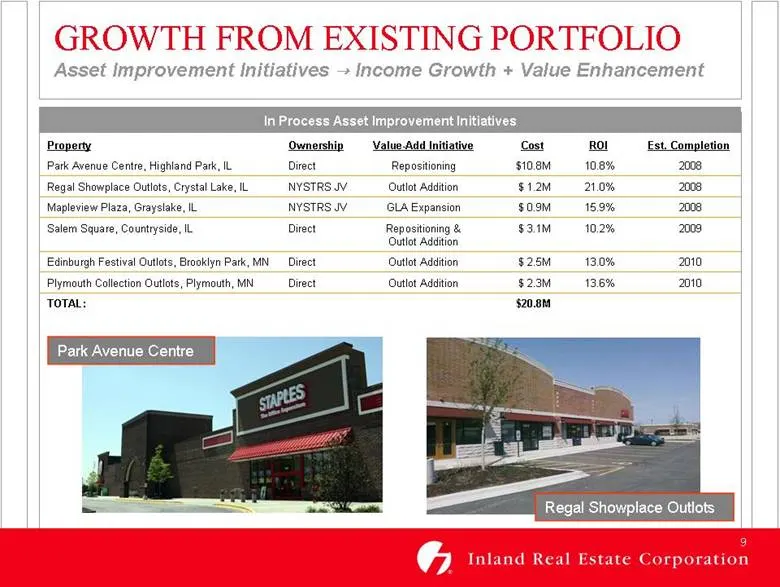
Slide 9: Growth from Existing Portfolio: Asset Improvement Initiatives In Process
9 2008 10.8% $10.8M Repositioning Direct Park Avenue Centre, Highland Park, IL In Process Asset Improvement Initiatives $20.8M $ 2.3M $ 2.5M $ 3.1M $ 0.9M $ 1.2M Cost Direct Direct Direct NYSTRS JV NYSTRS JV Ownership TOTAL: 2010 13.6% Outlot Addition Plymouth Collection Outlots, Plymouth, MN 2010 1
Slide 10: Joint Ventures Build Value
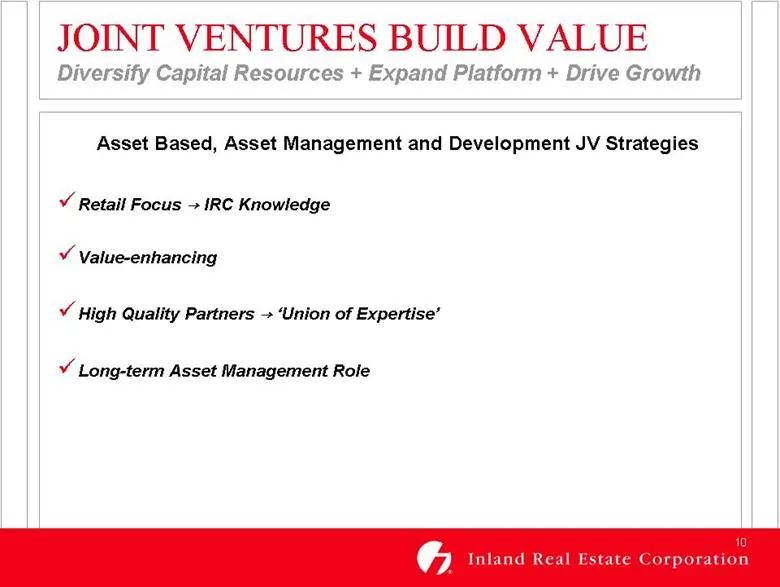
10 JOINT VENTURES BUILD VALUE Diversify Capital Resources + Expand Platform + Drive Growth Asset Based, Asset Management and Development JV Strategies Retail Focus .IRC Knowledge Value-enhancing High Quality Partners .‘Union of Expertise’ Long-term Asset Management Role
Slide 11: Joint Ventures Build Value: Asset-Based Joint Venture
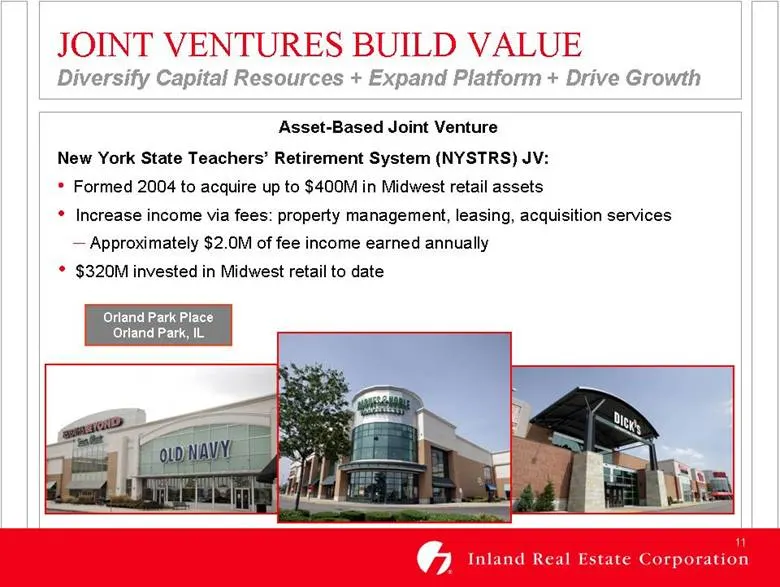
11 JOINT VENTURES BUILD VALUE Diversify Capital Resources + Expand Platform + Drive Growth Asset-Based Joint Venture New York State Teachers’ Retirement System (NYSTRS) JV: • Formed 2004 to acquire up to $400M in Midwest retail assets • Increase income via fees: property management, leasing, acquisi
Slide 12: Joint Ventures Build Value: Asset Management Joint Venture
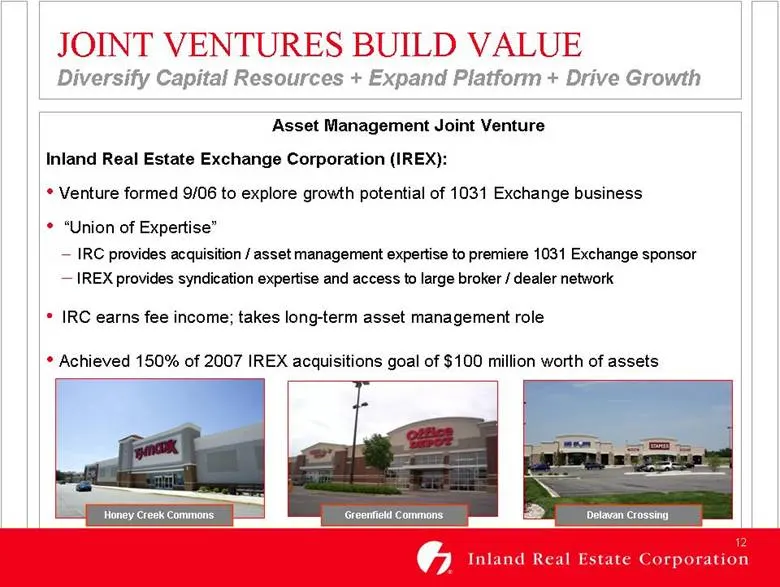
12 JOINT VENTURES BUILD VALUE Diversify Capital Resources + Expand Platform + Drive Growth Asset Management Joint Venture Inland Real Estate Exchange Corporation (IREX): • Venture formed 9/06 to explore growth potential of 1031 Exchange business • “Union of Expertise” – IRC provides acquisition / as
Slide 13: Joint Ventures Build Value: Development Joint Ventures
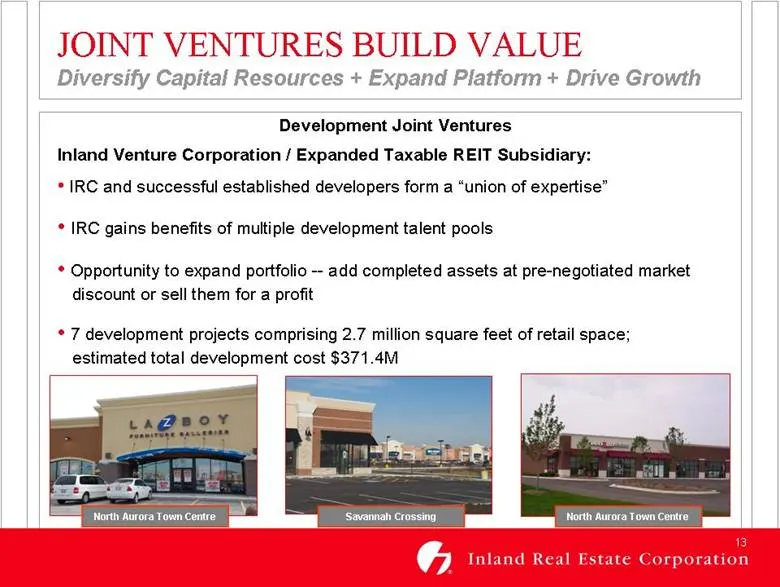
13 JOINT VENTURES BUILD VALUE Diversify Capital Resources + Expand Platform + Drive Growth Development Joint Ventures Inland Venture Corporation / Expanded Taxable REIT Subsidiary: • IRC and successful established developers form a “union of expertise” • IRC gains benefits of multiple development ta
Slide 14: IRC Financial Snapshot
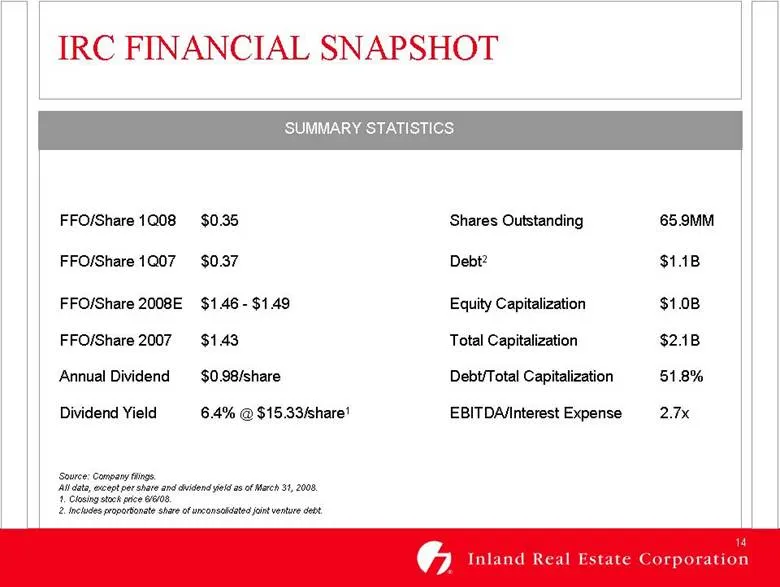
14 FFO/Share 1Q08 $0.35 Shares Outstanding 65.9MM FFO/Share 1Q07 $0.37 Debt2 $1.1B FFO/Share 2008E $1.46 - $1.49 Equity Capitalization $1.0B FFO/Share 2007 $1.43 Total Capitalization $2.1B Annual Dividend $0.98/share Debt/Total Capitalization 51.8% Dividend Yield 6.4% @ $15.33/share1 EBITDA/Interest
Slide 15: Financial Highlights
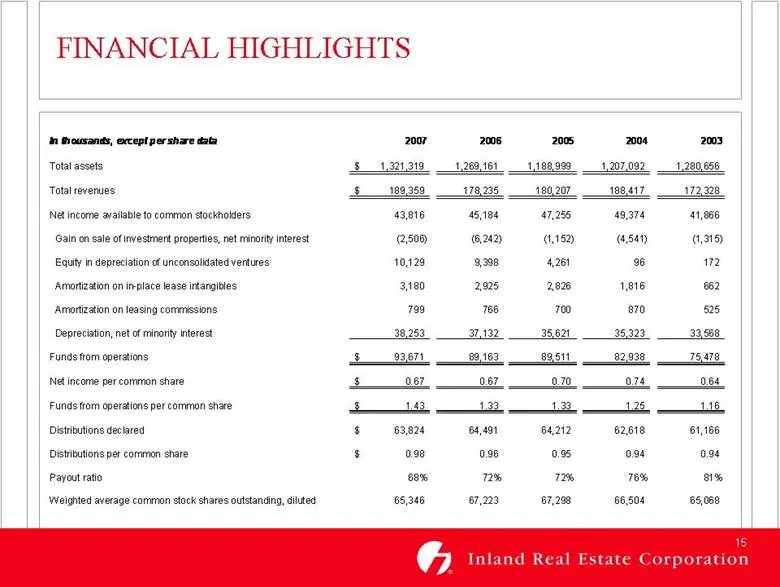
15 FINANCIAL HIGHLIGHTS In thousands, except per share data 2007 2006 2005 2004 2003 Total assets 1,321,319 $ 1,269,161 1,188,999 1,207,092 1,280,656 Total revenues 189,359 $ 178,235 180,207 188,417 172,328 Net income available to common stockholders 43,816 45,184 47,255 49,374 41,866 Gain on sale o
Slide 16: Total Return Performance
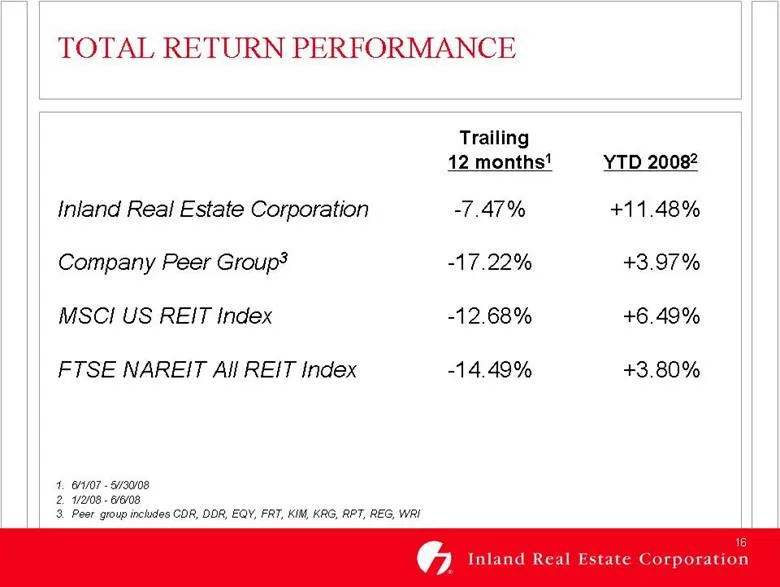
16 TOTAL RETURN PERFORMANCE Trailing 12 months1 YTD 20082 Inland Real Estate Corporation -7.47% +11.48% Company Peer Group3 -17.22% +3.97% MSCI US REIT Index -12.68% +6.49% FTSE NAREIT All REIT Index -14.49% +3.80% 1. 6/1/07 - 5//30/08 2. 1/2/08 - 6/6/08 3. Peer group includes CDR, DDR, EQY, FRT, KI
Slide 17: IRC Today
17 IRC TODAY Retail Focus Midwest Market Concentration Solid Performance & Core Operations Growth Potential . Joint Ventures + Redevelopment + Leasing / Releasing Tenured Team
Source: SEC EDGAR · 8-K filed Jun 11, 2008
More decks from Inland Real Estate Corp
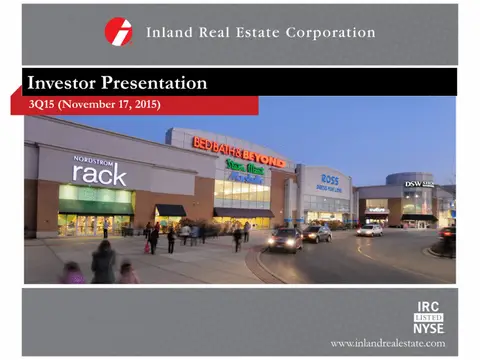 Investor Presentation (November 2015)30 slides · Nov 17, 2015
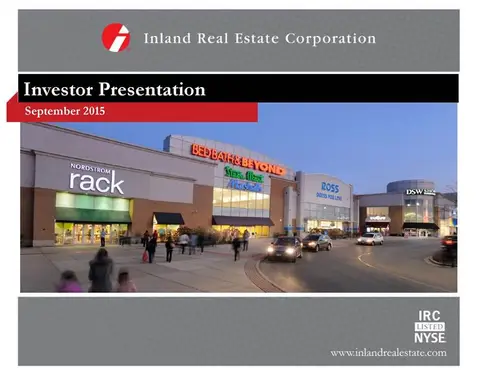 Investor Presentation (September 2015)29 slides · Sep 16, 2015
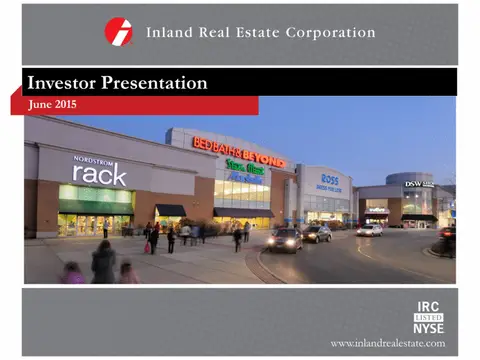 Investor Presentation (June 2015)29 slides · Jun 9, 2015
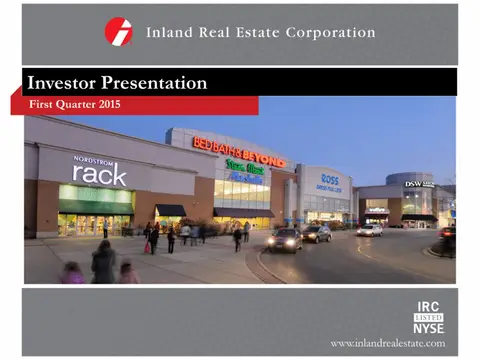 Investor Presentation (May 2015)26 slides · May 15, 2015
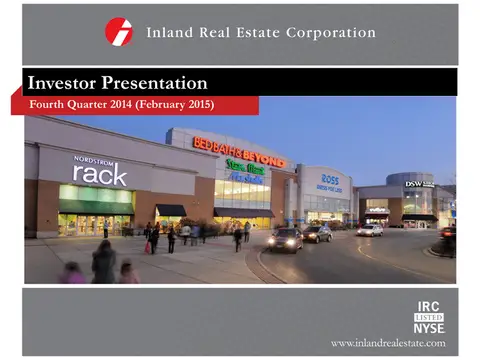 Investor Presentation (February 2015)26 slides · Feb 24, 2015
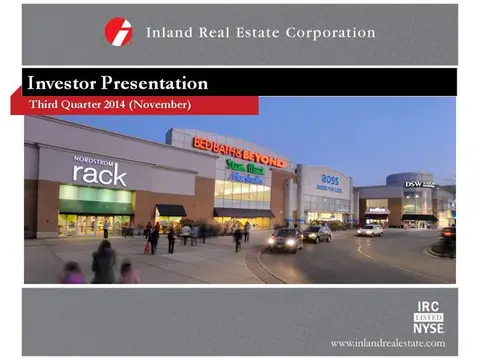 Investor Presentation (November 2014)26 slides · Nov 5, 2014