LaPorte Bancorp — Shareholder Meeting (May 2015)
15 slides from LaPorte Bancorp's shareholder meeting presentation, May 12, 2015
Slide 1: LaPorte Bancorp, Inc. Annual Shareholder Meeting
LaPorte Bancorp, Inc. LPSB Annual Shareholder Meeting May 12, 2015 Michele M. Thompson – President & Chief Financial Officer
Slide 2: Forward-Looking Statements
Forward-Looking Statements The presentation contains “forward-looking statements” within the meaning of Section 27A of the Securities Act of 1933, as amended and Section 21E of the Securities Exchange Act of 1934, as amended. We intend such forward-looking statements to be covered by the safe harbor
Slide 3: Forward-Looking Statements (continued)
Forward-Looking Statements (continued) The following factors, among others, could cause actual results to differ materially from the anticipated results or other expectations express in the forward-looking statements: ► changes in prevailing real estate values and loan demand both nationally and wit
Slide 4: Franchise Overview
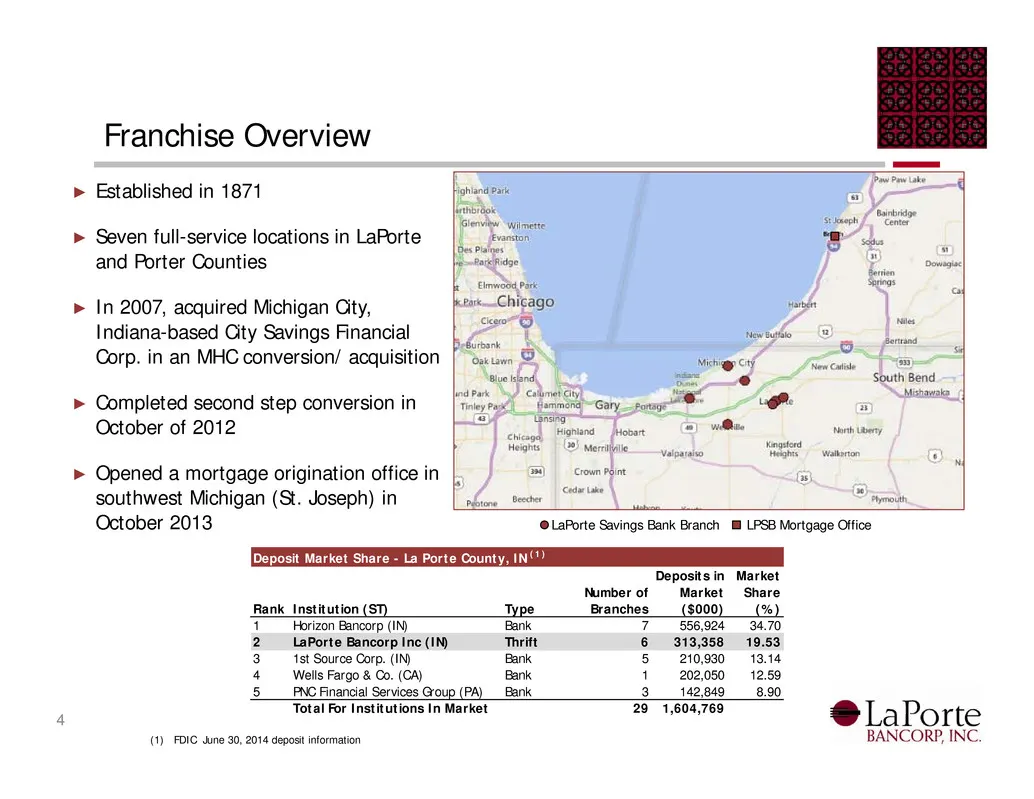
Franchise Overview ► Established in 1871 ► Seven full-service locations in LaPorte and Porter Counties ► In 2007, acquired Michigan City, Indiana-based City Savings Financial Corp. in an MHC conversion/ acquisition ► Completed second step conversion in October of 2012 ► Opened a mortgage origination
Slide 5: Loan Composition
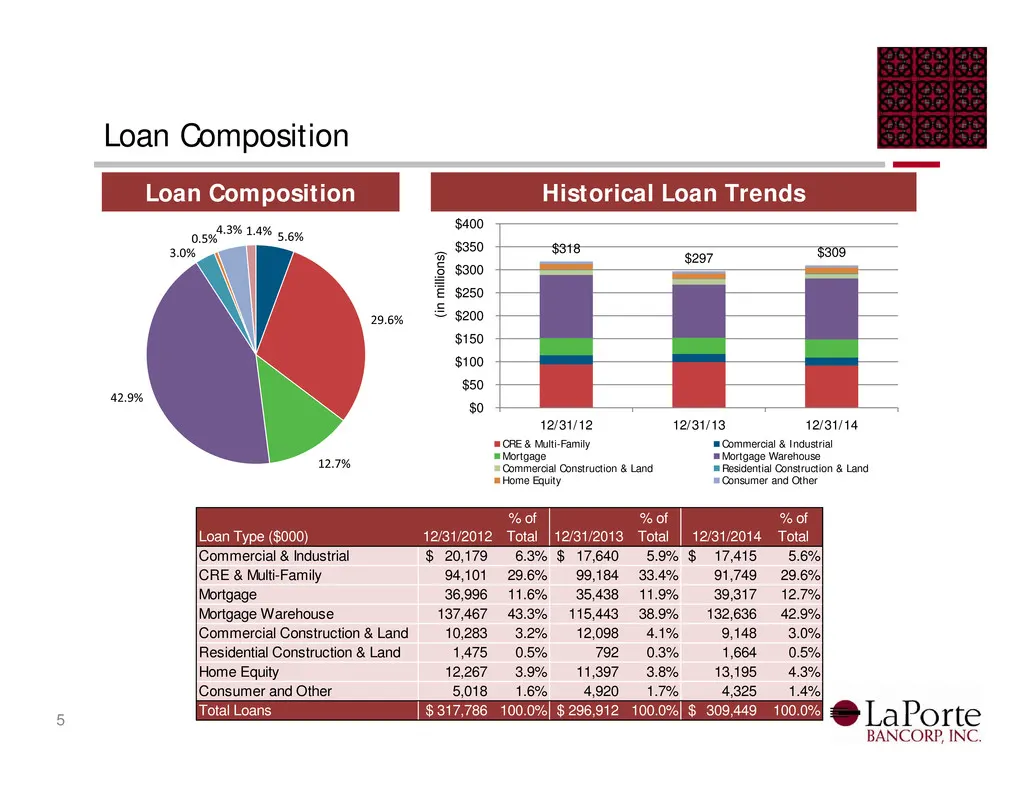
Loan Composition 5 Historical Loan TrendsLoan Composition Loan Type ($000) 12/31/2012 12/31/2013 12/31/2014 Commercial & Industrial 20,179$ 6.3% 17,640$ 5.9% 17,415$ 5.6% CRE & Multi-Family 94,101 29.6% 99,184 33.4% 91,749 29.6% Mortgage 36,996 11.6% 35,438 11.9% 39,317 12.7% Mortgage Warehouse 137,
Slide 6: Deposit Composition
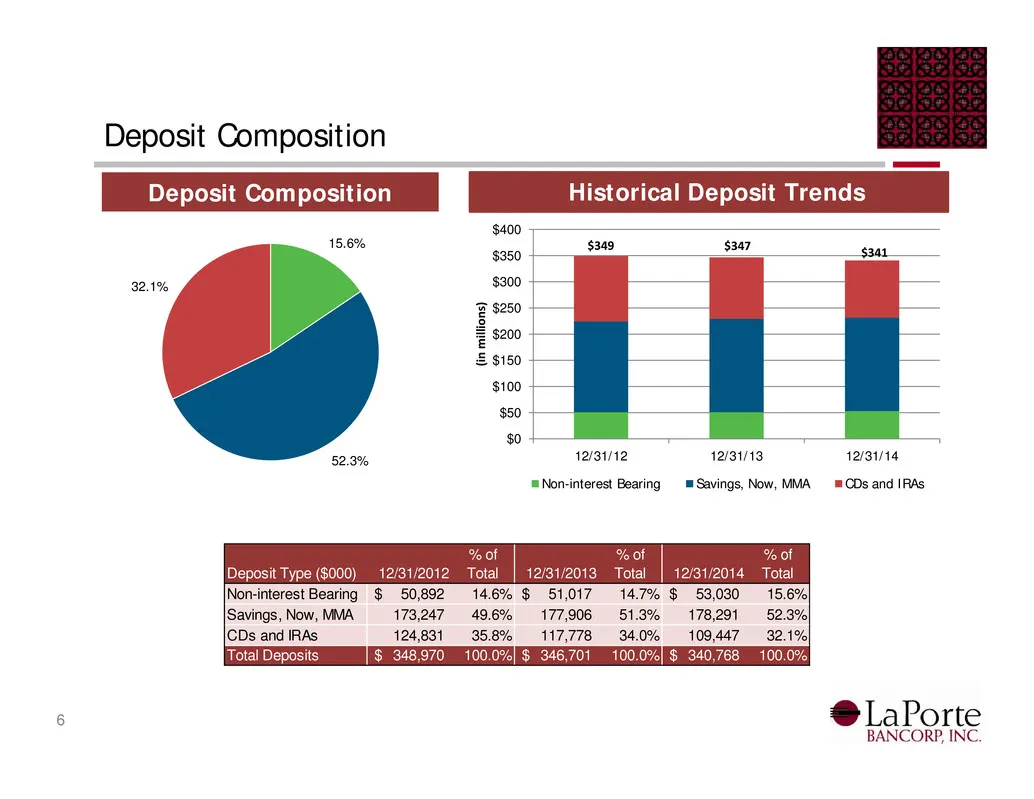
Deposit Composition 6 Historical Deposit TrendsDeposit Composition 15.6% 52.3% 32.1% $349 $347 $341 $0 $50 $100 $150 $200 $250 $300 $350 $400 12/31/12 12/31/13 12/31/14 ( i n m i l l i o n s ) Non-interest Bearing Savings, Now, MMA CDs and IRAs Deposit Type ($000) 12/31/2012 12/31/2013 12/31/2014 No
Slide 7: Asset Quality Profile
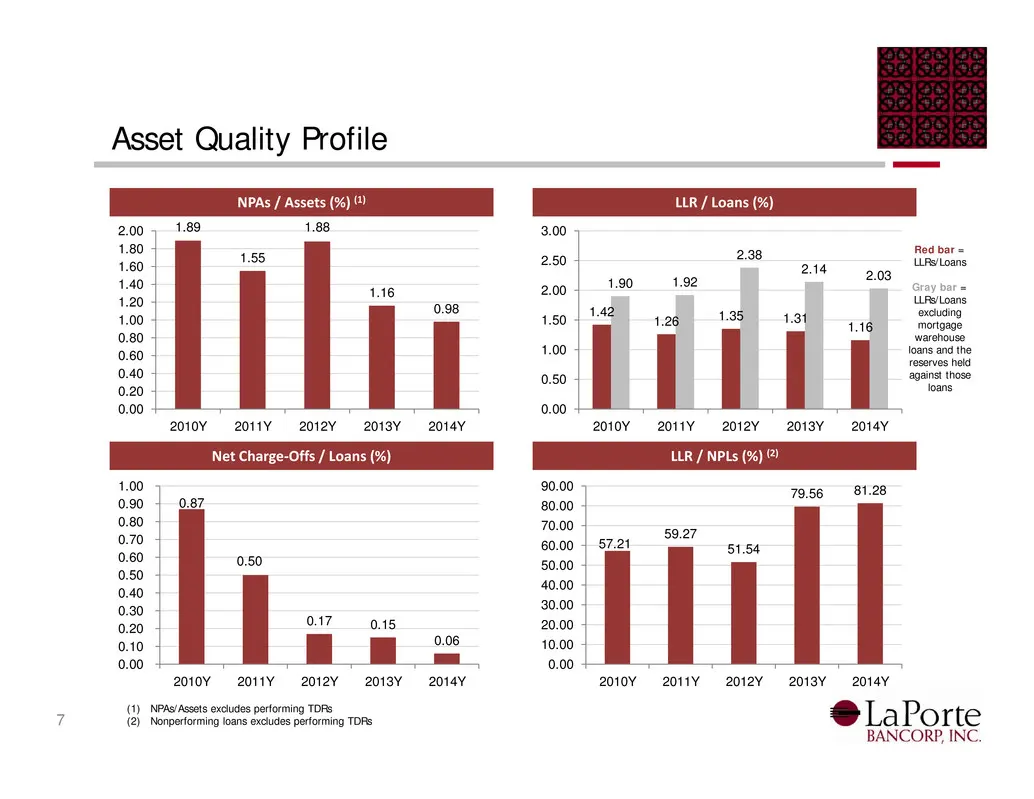
Asset Quality Profile NPAs / Assets (%) (1) LLR / Loans (%) LLR / NPLs (%) (2)Net Charge‐Offs / Loans (%) (1) NPAs/Assets excludes performing TDRs (2) Nonperforming loans excludes performing TDRs7 Red bar = LLRs/Loans Gray bar = LLRs/Loans excluding mortgage warehouse loans and the reserves held aga
Slide 8: Profitability
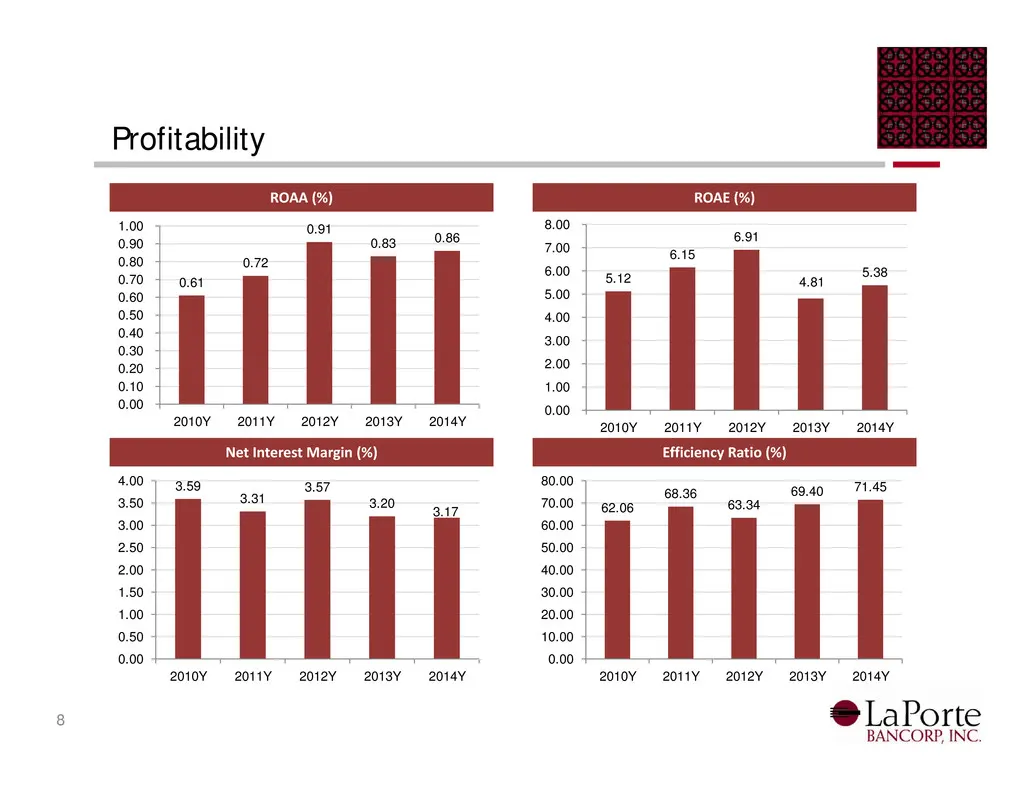
Profitability ROAA (%) ROAE (%) Efficiency Ratio (%)Net Interest Margin (%) 8 0.61 0.72 0.91 0.83 0.86 0.00 0.10 0.20 0.30 0.40 0.50 0.60 0.70 0.80 0.90 1.00 2010Y 2011Y 2012Y 2013Y 2014Y 5.12 6.15 6.91 4.81 5.38 0.00 1.00 2.00 3.00 4.00 5.00 6.00 7.00 8.00 2010Y 2011Y 2012Y 2013Y 2014Y 3.59 3.31 3.
Slide 9: Consistent Growth in Earnings Per Share
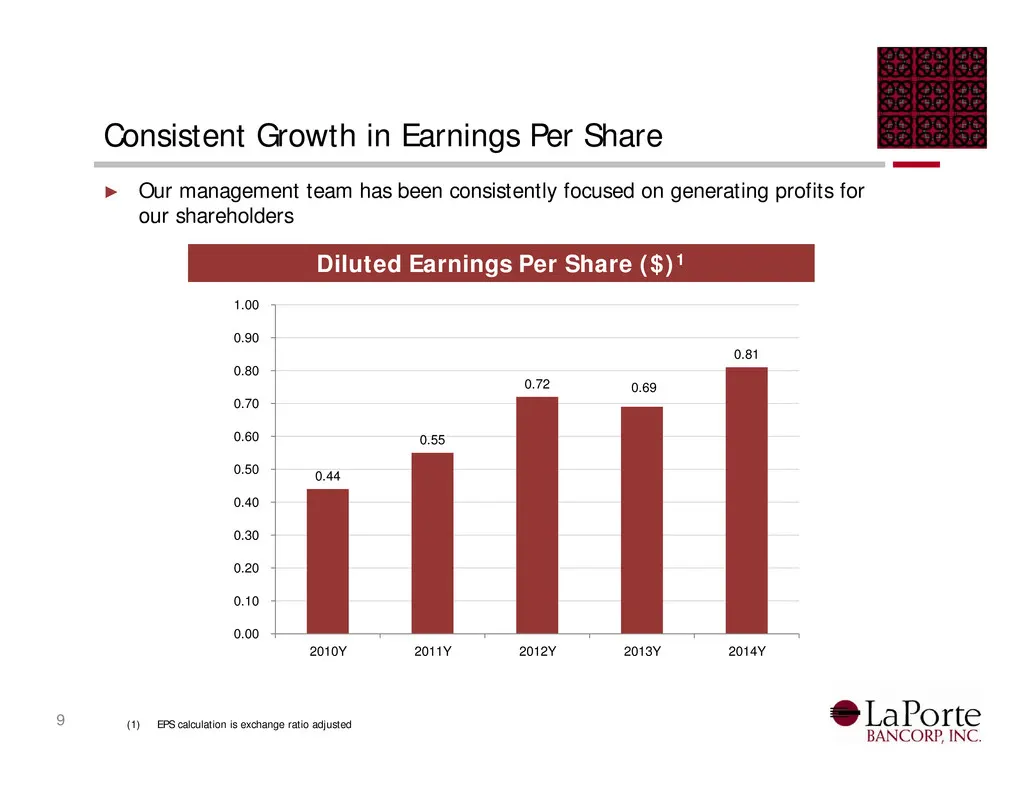
Consistent Growth in Earnings Per Share ► Our management team has been consistently focused on generating profits for our shareholders 9 Diluted Earnings Per Share ($)1 (1) EPS calculation is exchange ratio adjusted 0.44 0.55 0.72 0.69 0.81 0.00 0.10 0.20 0.30 0.40 0.50 0.60 0.70 0.80 0.90 1.00 2010
Slide 10: Strong Capital Position
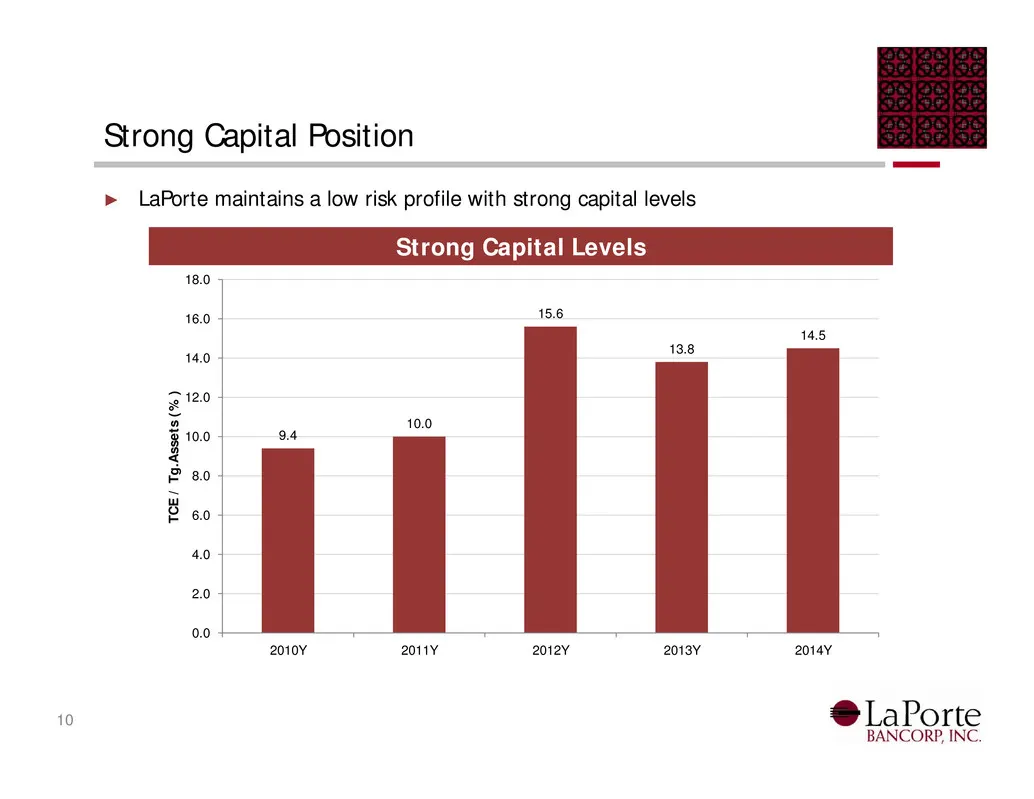
Strong Capital Position ► LaPorte maintains a low risk profile with strong capital levels 10 Strong Capital Levels 9.4 10.0 15.6 13.8 14.5 0.0 2.0 4.0 6.0 8.0 10.0 12.0 14.0 16.0 18.0 2010Y 2011Y 2012Y 2013Y 2014Y T C E / T g . A s s e t s ( % )
Slide 11: Capital Management
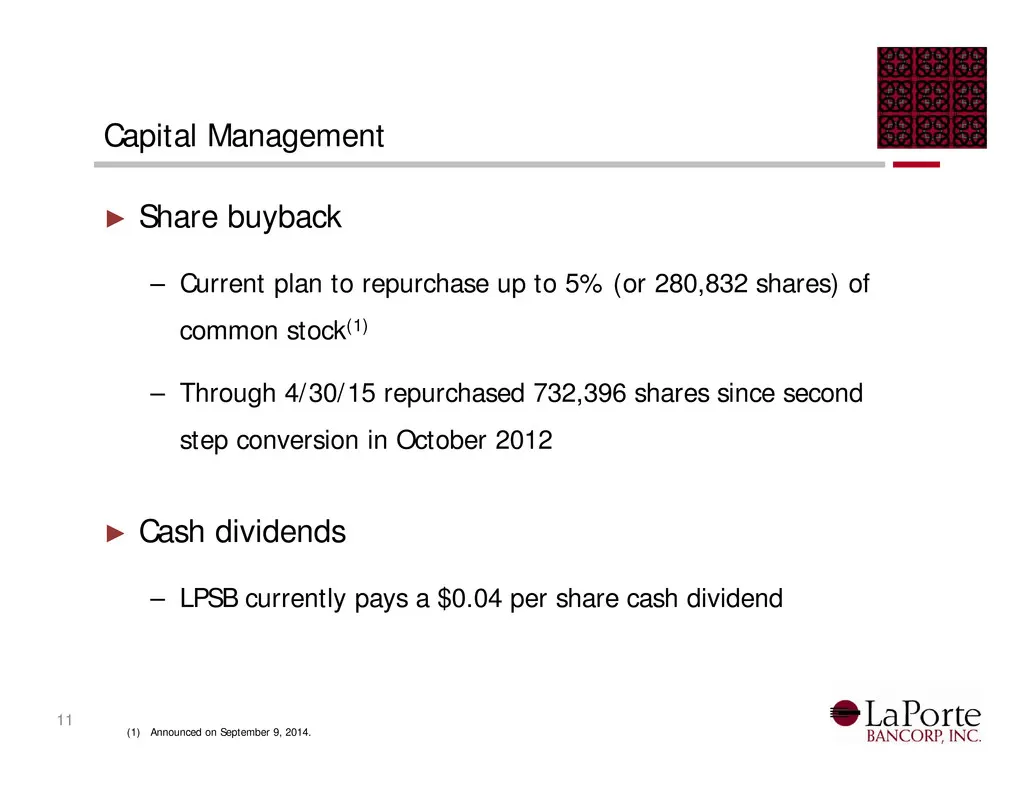
Capital Management ► Share buyback – Current plan to repurchase up to 5% (or 280,832 shares) of common stock(1) – Through 4/30/15 repurchased 732,396 shares since second step conversion in October 2012 ► Cash dividends – LPSB currently pays a $0.04 per share cash dividend 11 (1) Announced on Septemb
Slide 12: Tangible Book Value Per Share
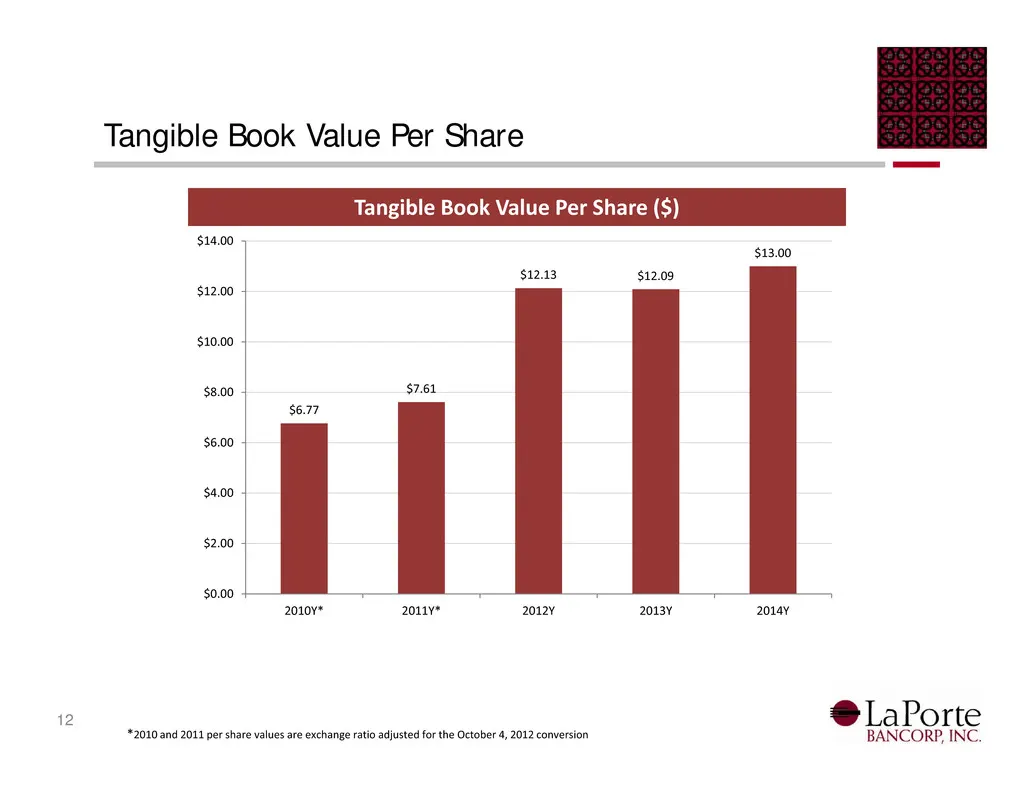
Tangible Book Value Per Share 12 Tangible Book Value Per Share ($) *2010 and 2011 per share values are exchange ratio adjusted for the October 4, 2012 conversion $6.77 $7.61 $12.13 $12.09 $13.00 $0.00 $2.00 $4.00 $6.00 $8.00 $10.00 $12.00 $14.00 2010Y* 2011Y* 2012Y 2013Y 2014Y
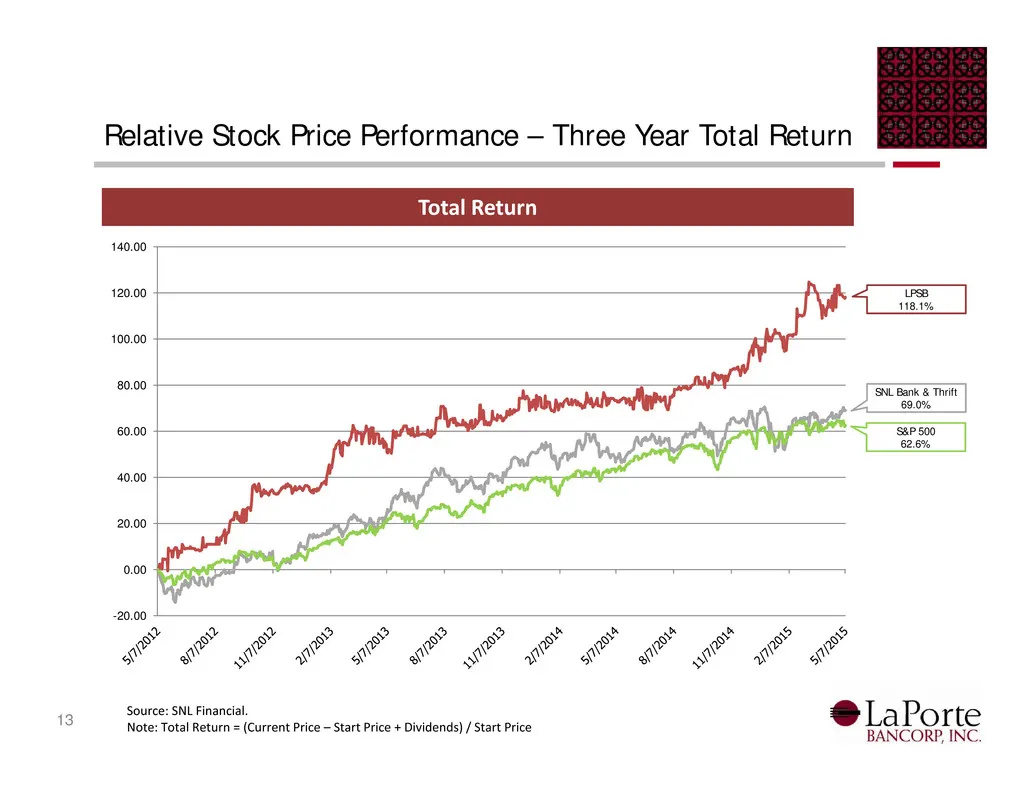
Slide 13: Relative Stock Price Performance – Three Year Total Return
Relative Stock Price Performance – Three Year Total Return 13 Total Return LPSB 118.1% SNL Bank & Thrift 69.0% S&P 500 62.6% -20.00 0.00 20.00 40.00 60.00 80.00 100.00 120.00 140.00 Source: SNL Financial. Note: Total Return = (Current Price – Start Price + Dividends) / Start Price
Slide 14: 2015 Strategic Focus Areas
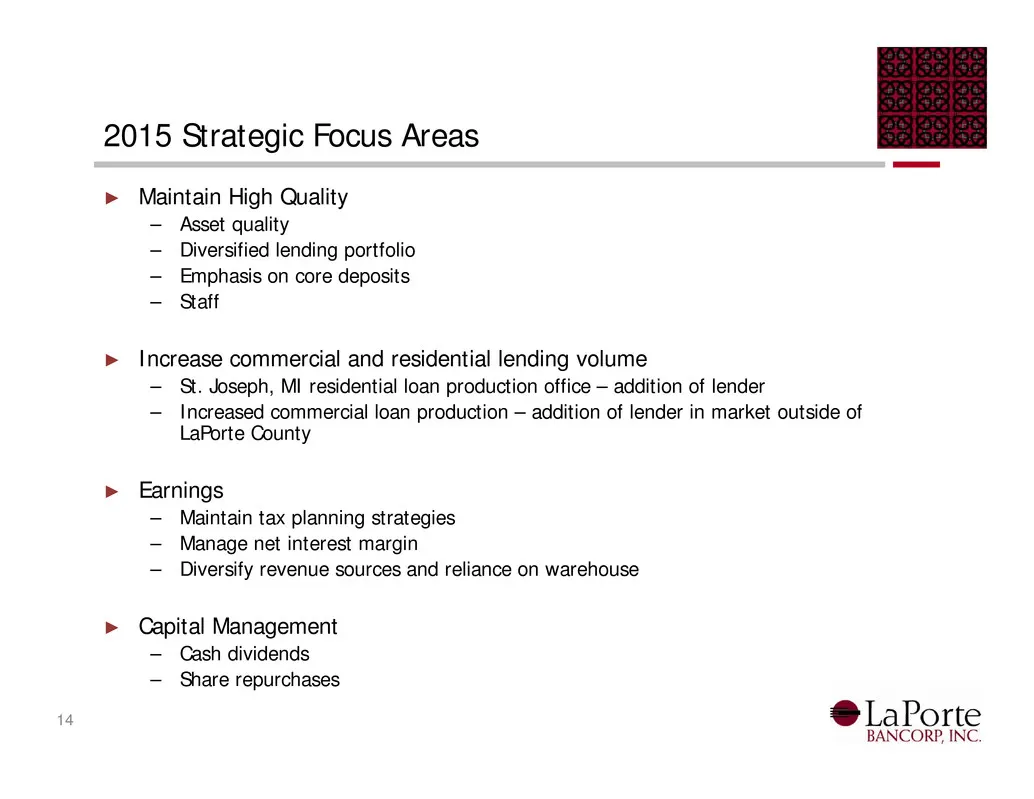
2015 Strategic Focus Areas ► Maintain High Quality – Asset quality – Diversified lending portfolio – Emphasis on core deposits – Staff ► Increase commercial and residential lending volume – St. Joseph, MI residential loan production office – addition of lender – Increased commercial loan production
Slide 15: Questions?
R570) * S230) — mraral ara eset eee el Leo Tah trast eras Era Tas AAT 4 125" era OST) t peat CO CON OL EM CS oS Questions? @LaP Ort BANCORP, INC
Source: SEC EDGAR · 8-K filed May 12, 2015
More decks from LaPorte Bancorp Inc
 Merger or Acquisition (May 2016)33 slides · May 5, 2016
 Merger or Acquisition (March 2016)16 slides · Mar 11, 2016
 Investor Presentation (February 2015)16 slides · Feb 12, 2015
 Shareholder Meeting (May 2014)16 slides · May 13, 2014
 Investor Presentation (December 2013)16 slides · Dec 16, 2013
 Shareholder Meeting (May 2013)15 slides · May 14, 2013