LaPorte Bancorp — Merger or Acquisition (May 2016)
33 slides from LaPorte Bancorp's merger presentation, May 5, 2016
Slide 1: A NASDAQ Traded Company - Symbol HBNC
A NASDAQ Traded Company - Symbol HBNC
Slide 2: Forward-Looking Statements
This presentation may contain forward-looking statements regarding the financial performance, business, and future operations of Horizon Bancorp and its affiliates (collectively, “Horizon”). For these statements, Horizon claims the protection of the safe harbor for forward-looking statements contain
Slide 3: Additional Information
Additional Information In connection with the proposed merger with Kosciusko Financial, Inc., holding company for Farmers State Bank (“Farmers”), Horizon has filed with the SEC a Registration Statement on Form S-4 that includes a proxy statement of Farmers and a prospectus of Horizon, as well as oth
Slide 4: Mark E. Secor, Executive Vice President Chief Financial Officer
Mark E. SecorExecutive Vice President Chief Financial Officer *
Slide 5: Horizon's Story
HORIZON — BAN BANK Horizon’s Story EX GEP TO NAL SvECR Val Coe
Slide 6: Indiana and Michigan… The Right Side of Chicago
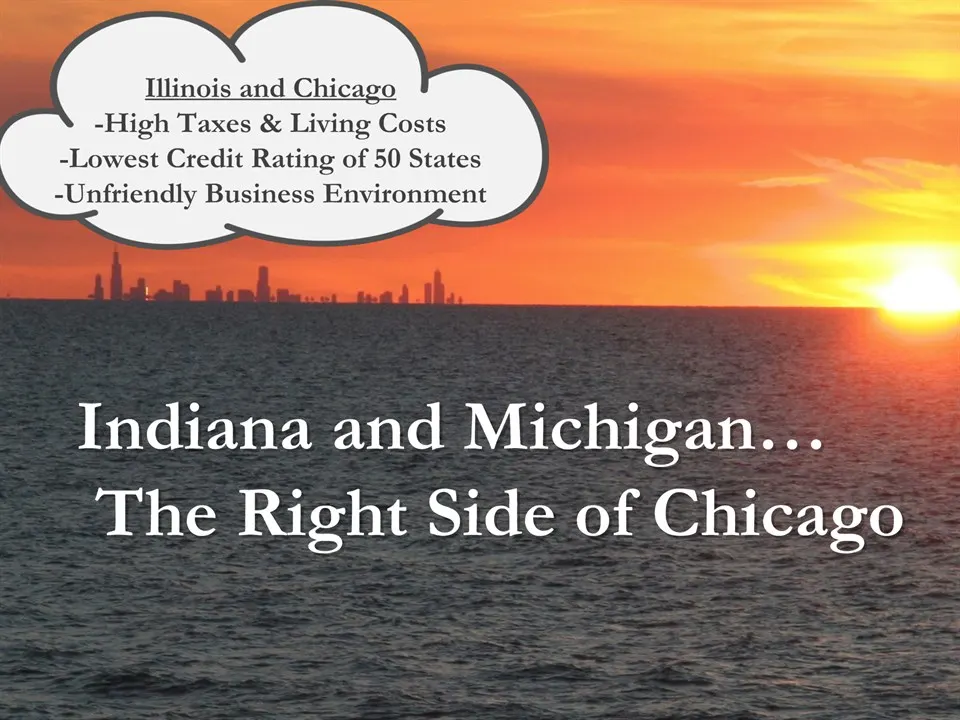
Indiana and Michigan… The Right Side of Chicago Illinois and Chicago-High Taxes & Living Costs-Lowest Credit Rating of 50 States-Unfriendly Business Environment
Slide 7: Corporate Profile
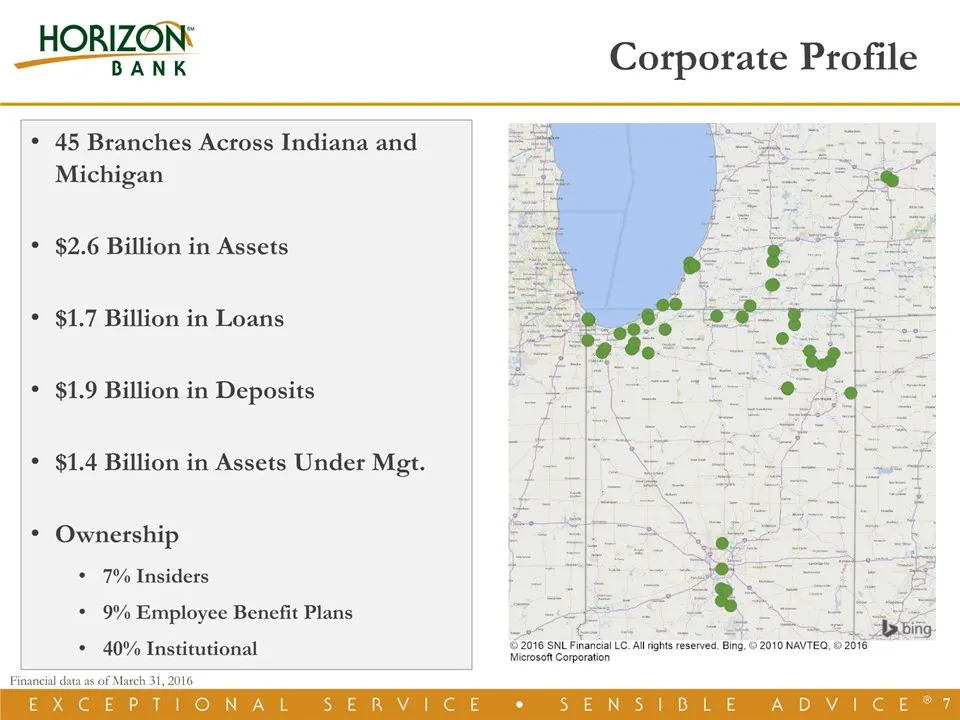
* Corporate Profile Financial data as of March 31, 2016 45 Branches Across Indiana and Michigan$2.6 Billion in Assets$1.7 Billion in Loans $1.9 Billion in Deposits$1.4 Billion in Assets Under Mgt.Ownership7% Insiders9% Employee Benefit Plans40% Institutional
Slide 8: Financial Highlights
HORIZON‘ _HORIZO! BANK Financial Highlights EX GEP TO NAL SvECR Val Coe
Slide 9: Strong Earnings Growth
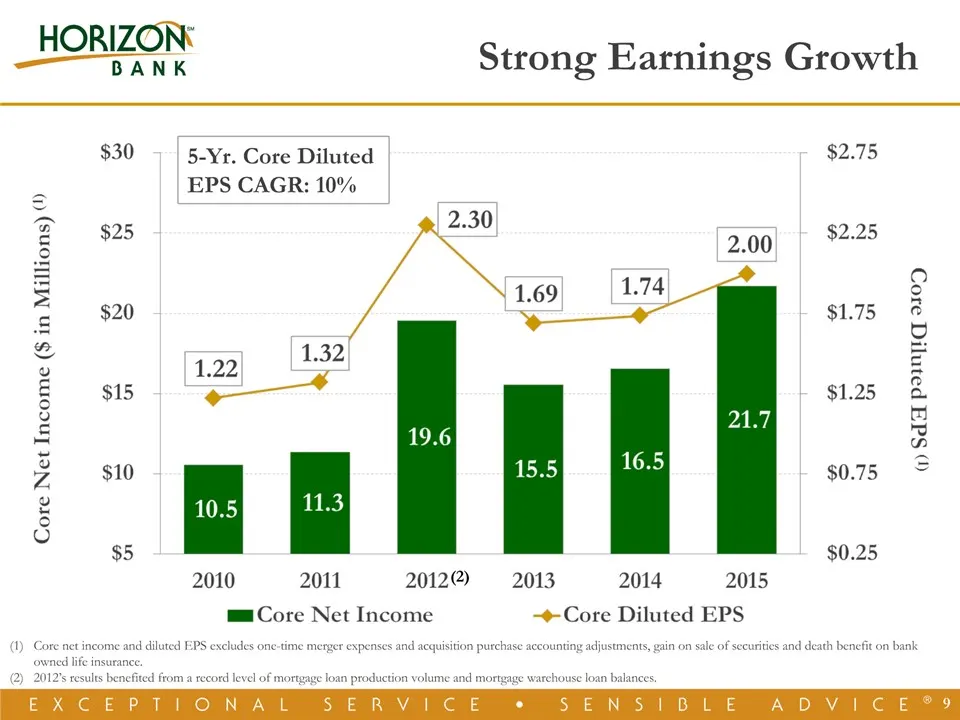
* Core net income and diluted EPS excludes one-time merger expenses and acquisition purchase accounting adjustments, gain on sale of securities and death benefit on bank owned life insurance.2012’s results benefited from a record level of mortgage loan production volume and mortgage warehouse loan b
Slide 10: Solid Start to 2016
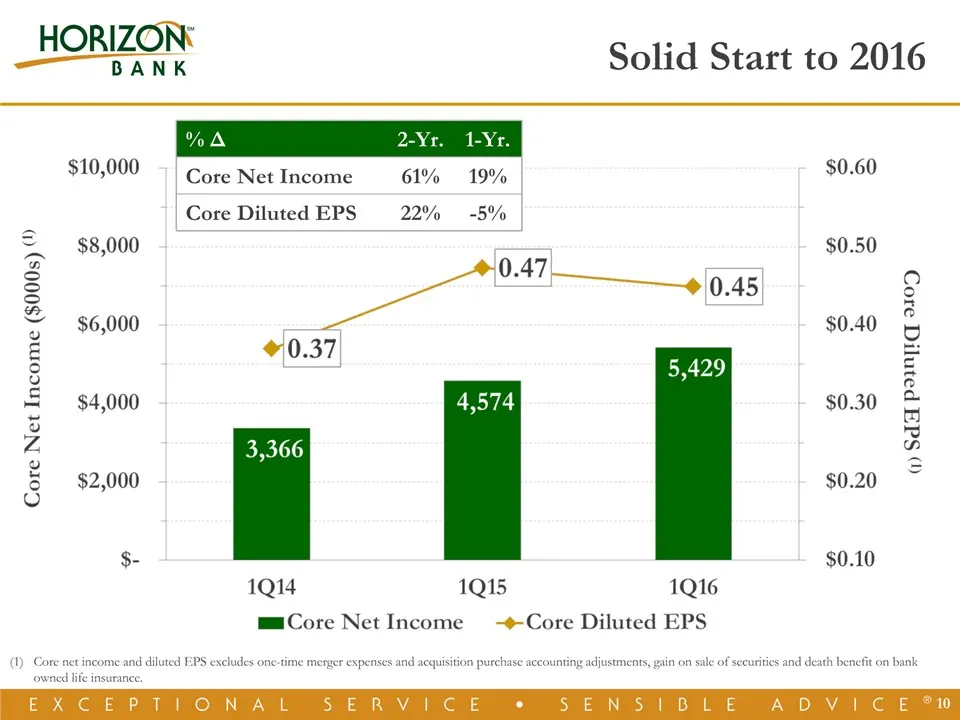
* Solid Start to 2016 % Δ 2-Yr. 1-Yr. Core Net Income 61% 19% Core Diluted EPS 22% -5% Core net income and diluted EPS excludes one-time merger expenses and acquisition purchase accounting adjustments, gain on sale of securities and death benefit on bank owned life insurance.
Slide 11: Strong Growth Year Over Year With Seasonality in 1Q16
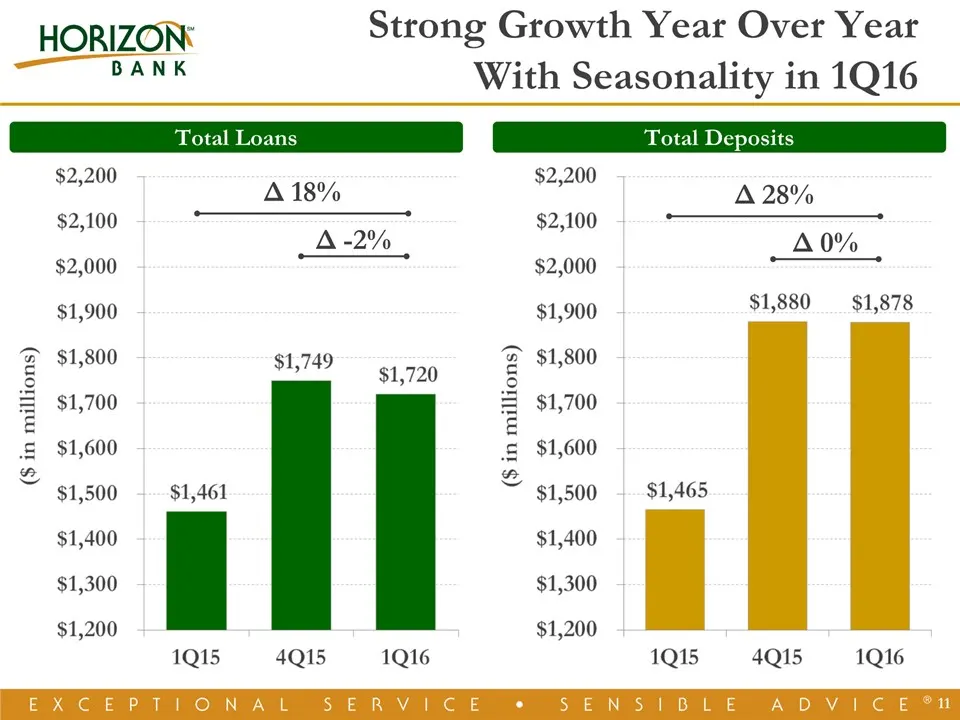
* Total Loans Total Deposits Δ 18% Δ -2% Δ 28% Δ 0% Strong Growth Year Over Year With Seasonality in 1Q16
Slide 12: Shift to Commercial Lending
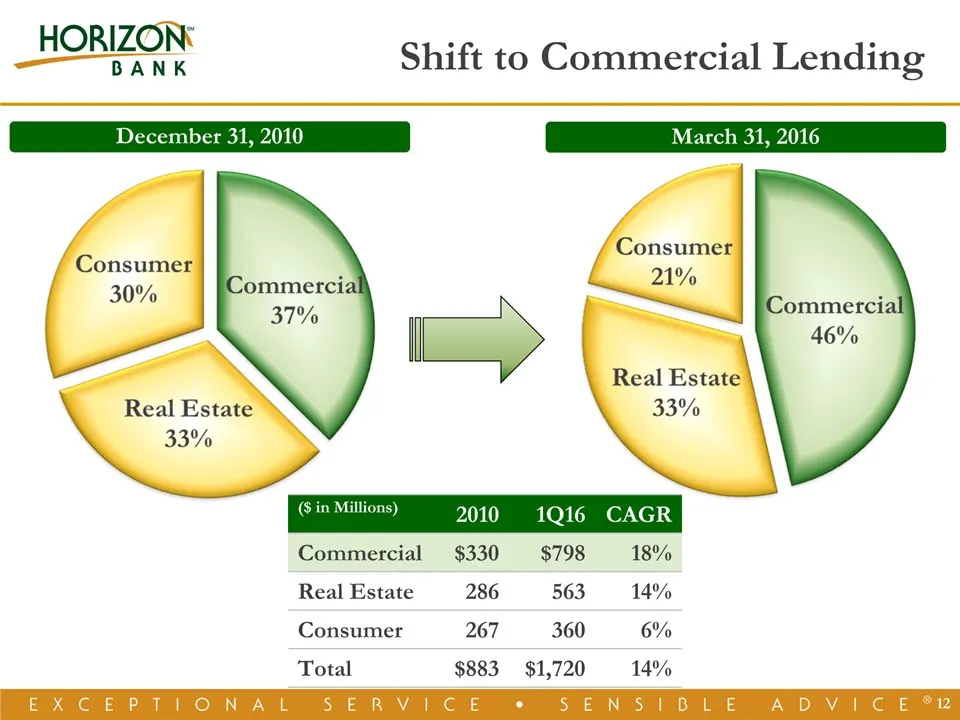
March 31, 2016 December 31, 2010 ($ in Millions) 2010 1Q16 CAGR Commercial $330 $798 18% Real Estate 286 563 14% Consumer 267 360 6% Total $883 $1,720 14% * Shift to Commercial Lending
Slide 13: Strong Low Cost Deposit Growth
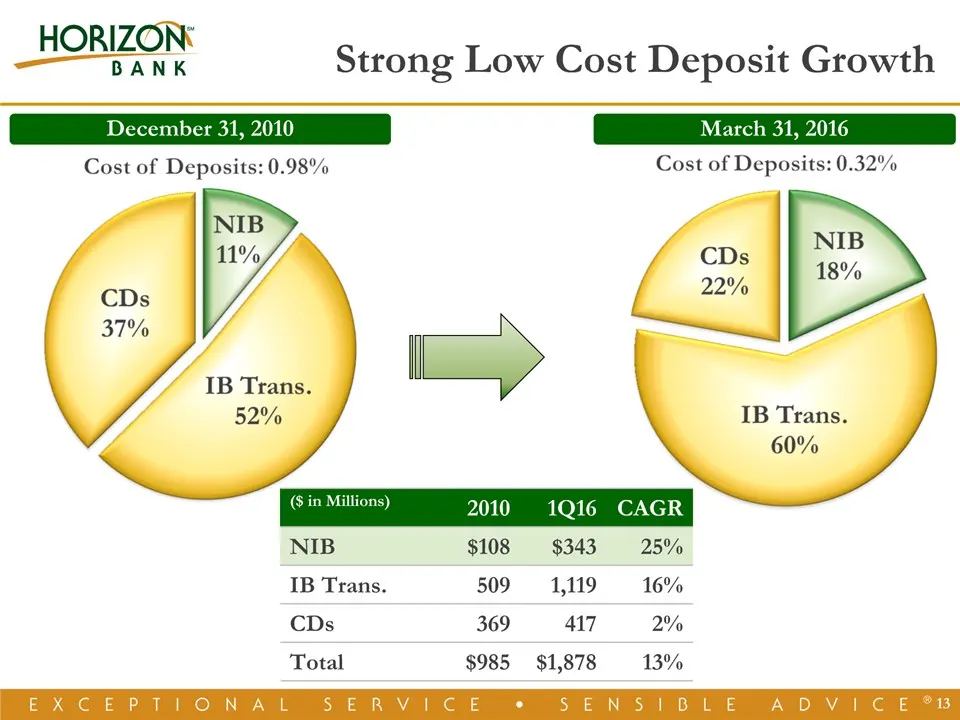
December 31, 2010 March 31, 2016 Strong Low Cost Deposit Growth * ($ in Millions) 2010 1Q16 CAGR NIB $108 $343 25% IB Trans. 509 1,119 16% CDs 369 417 2% Total $985 $1,878 13%
Slide 14: Pending Mergers Adds Talent, EPS Accretion & Market Share
Pending MergersAdds Talent, EPS Accretion & Market Share *
Slide 15: Bolsters Indiana Presence and Growth Potential
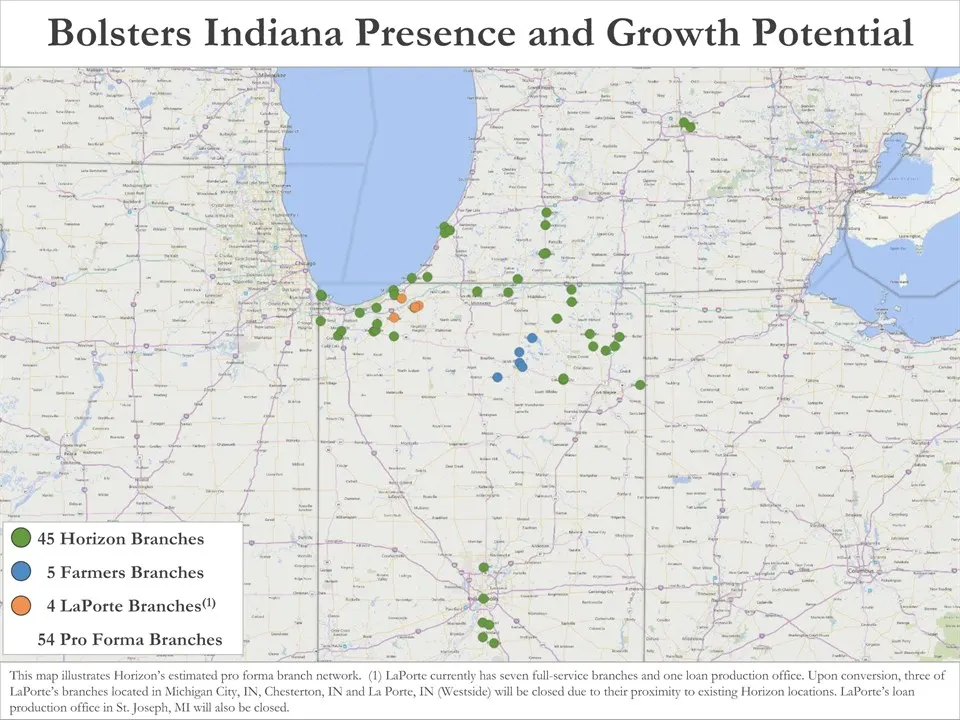
* Bolsters Indiana Presence and Growth Potential This map illustrates Horizon’s estimated pro forma branch network. (1) LaPorte currently has seven full-service branches and one loan production office. Upon conversion, three of LaPorte’s branches located in Michigan City, IN, Chesterton, IN and La P
Slide 16: Increases Scale and Operating Leverage
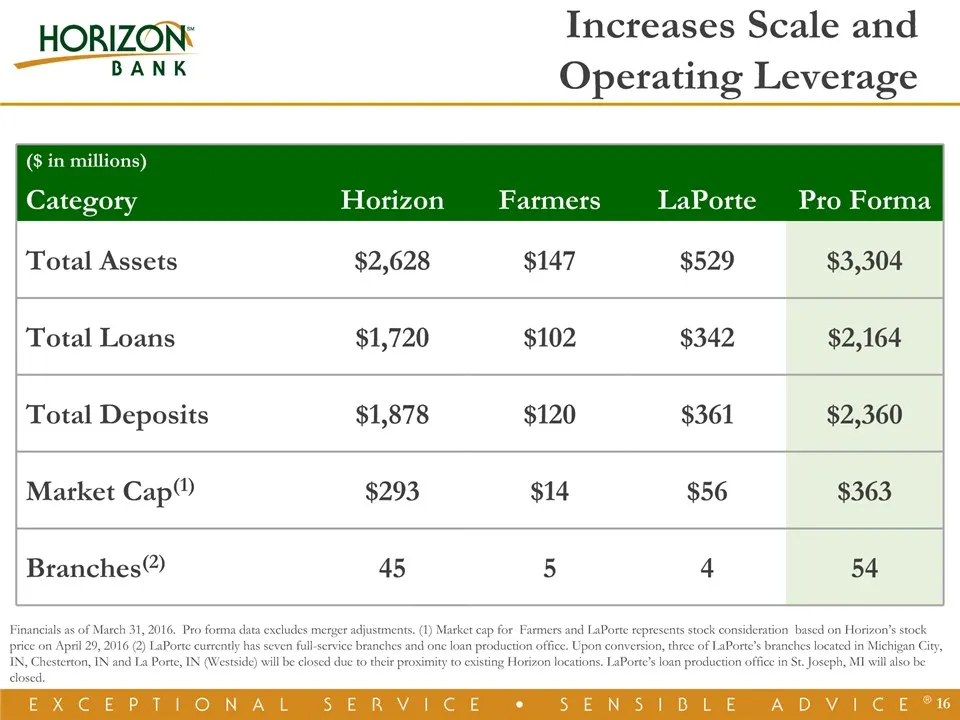
* Increases Scale and Operating Leverage ($ in millions)Category Horizon Farmers LaPorte Pro Forma Total Assets $2,628 $147 $529 $3,304 Total Loans $1,720 $102 $342 $2,164 Total Deposits $1,878 $120 $361 $2,360 Market Cap(1) $293 $14 $56 $363 Branches(2) 45 5 4 54 Financials as of March 31, 2016. Pr
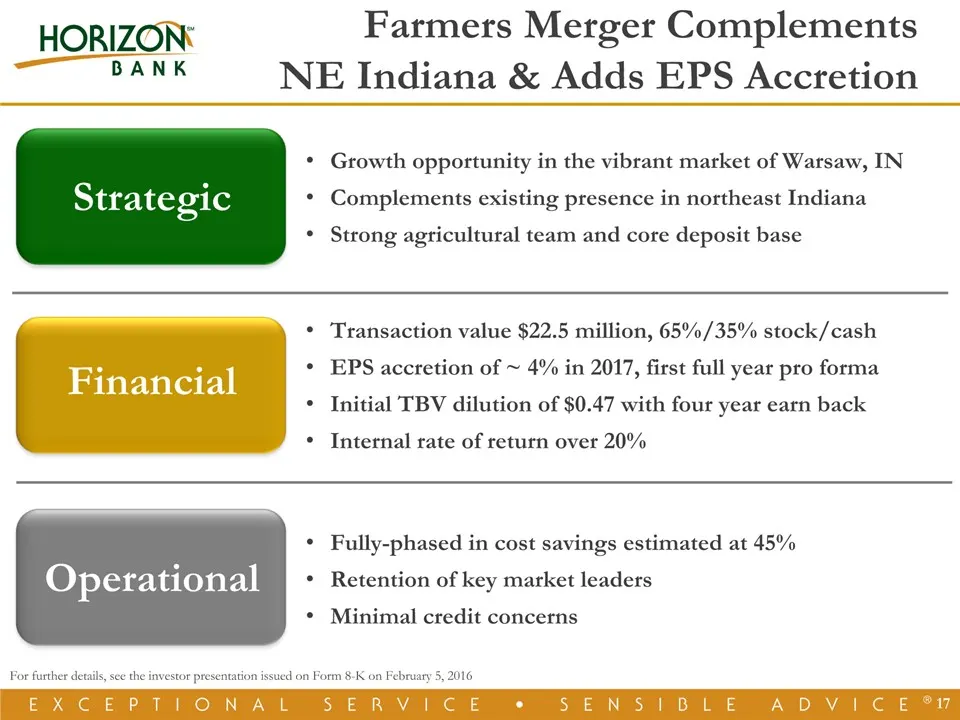
Slide 17: Farmers Merger Complements NE Indiana & Adds EPS Accretion
* Strategic Financial Operational Growth opportunity in the vibrant market of Warsaw, INComplements existing presence in northeast IndianaStrong agricultural team and core deposit base Transaction value $22.5 million, 65%/35% stock/cashEPS accretion of ~ 4% in 2017, first full year pro formaInitial
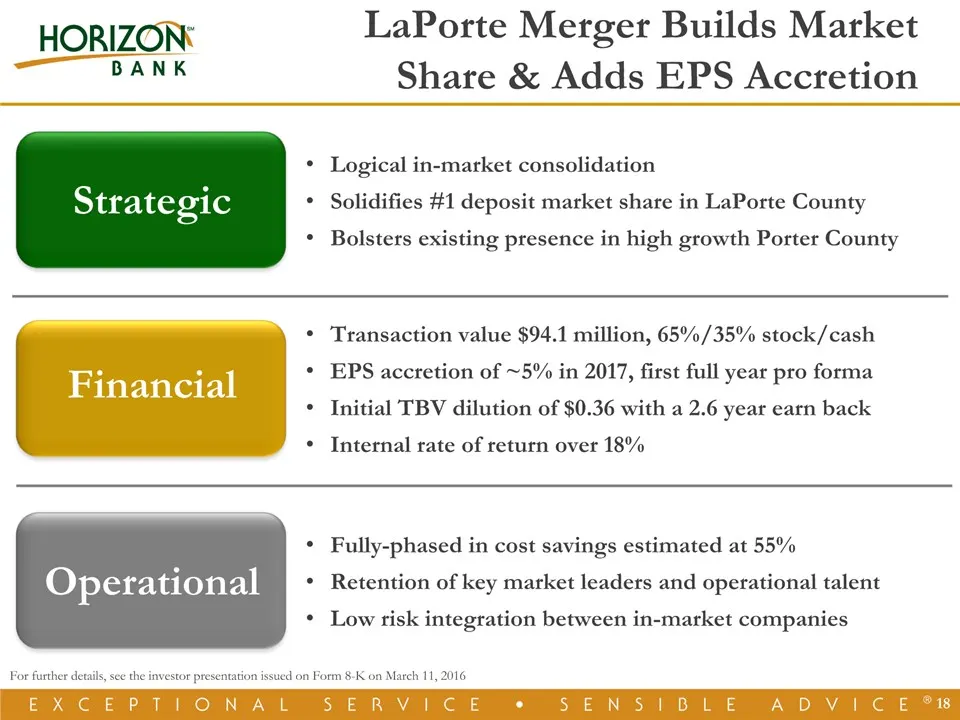
Slide 18: LaPorte Merger Builds Market Share & Adds EPS Accretion
* Strategic Financial Operational Logical in-market consolidationSolidifies #1 deposit market share in LaPorte CountyBolsters existing presence in high growth Porter County Transaction value $94.1 million, 65%/35% stock/cashEPS accretion of ~5% in 2017, first full year pro formaInitial TBV dilution
Slide 19: Craig M. Dwight, Chairman & Chief Executive Officer
Craig M. DwightChairman & Chief Executive Officer *

Slide 20: Investment Thesis – Building for the Future
- Investment Thesis –Building for the FutureTrust, Action, Results *
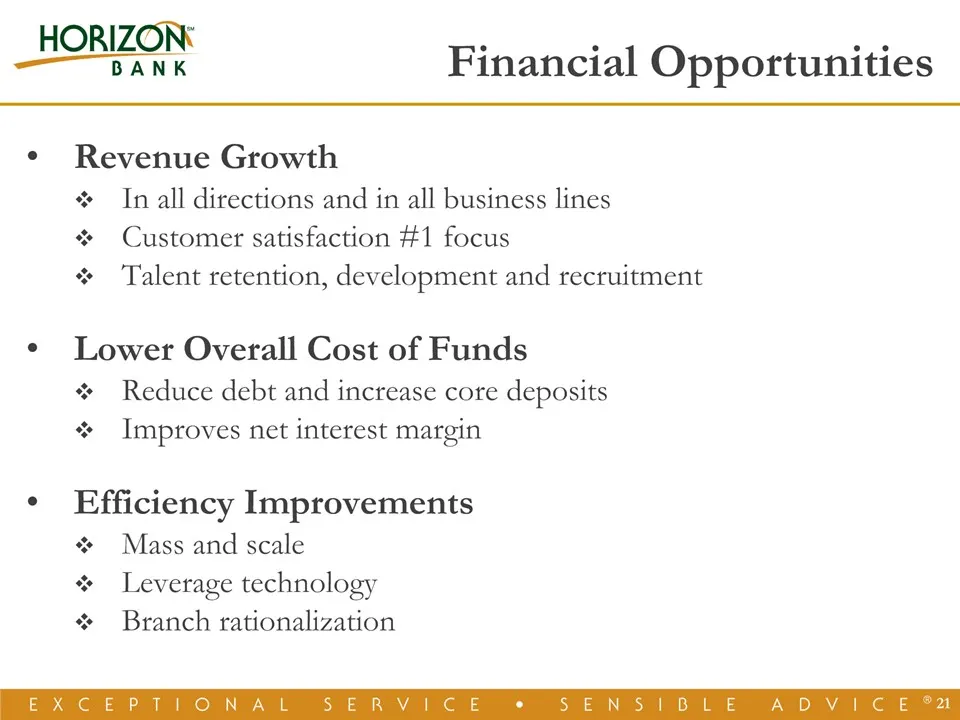
Slide 21: Financial Opportunities
Financial Opportunities * Revenue GrowthIn all directions and in all business linesCustomer satisfaction #1 focusTalent retention, development and recruitmentLower Overall Cost of FundsReduce debt and increase core depositsImproves net interest marginEfficiency ImprovementsMass and scaleLeverage tec
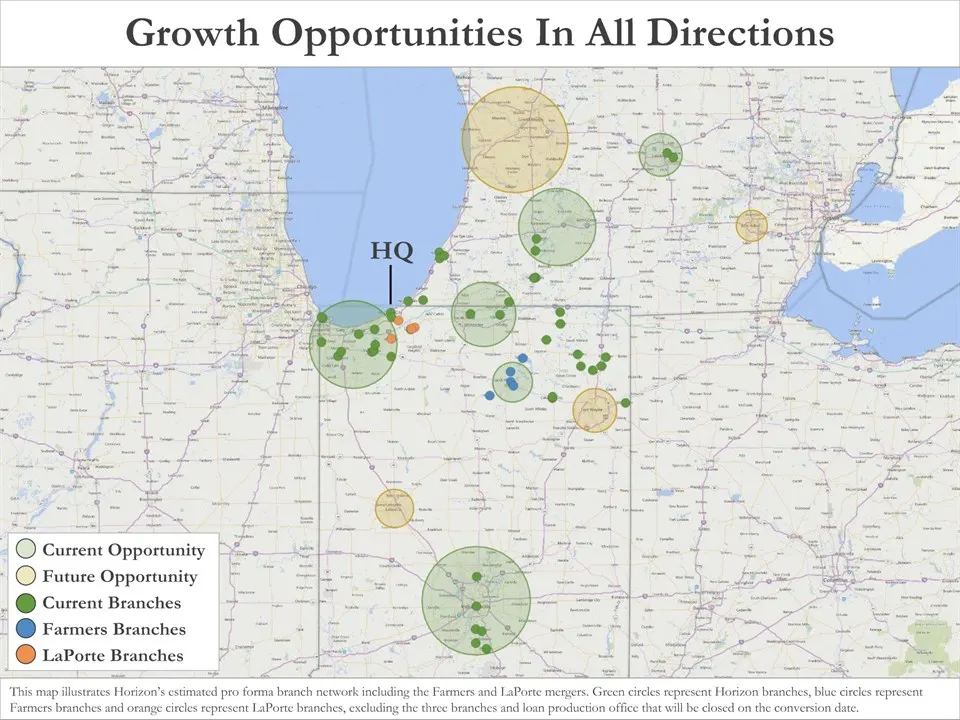
Slide 22: Growth Opportunities In All Directions
* Growth Opportunities In All Directions Current Opportunity Future OpportunityCurrent BranchesFarmers BranchesLaPorte Branches This map illustrates Horizon’s estimated pro forma branch network including the Farmers and LaPorte mergers. Green circles represent Horizon branches, blue circles represen
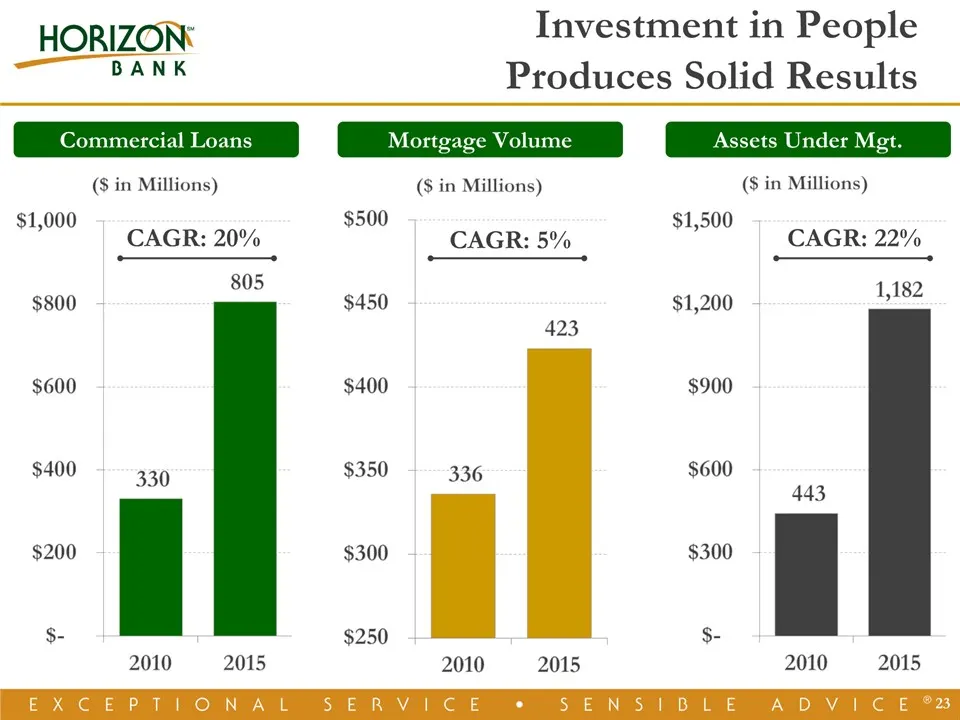
Slide 23: Investment in People Produces Solid Results
* Commercial Loans Mortgage Volume Assets Under Mgt. CAGR: 20% CAGR: 22% CAGR: 5% Investment in PeopleProduces Solid Results
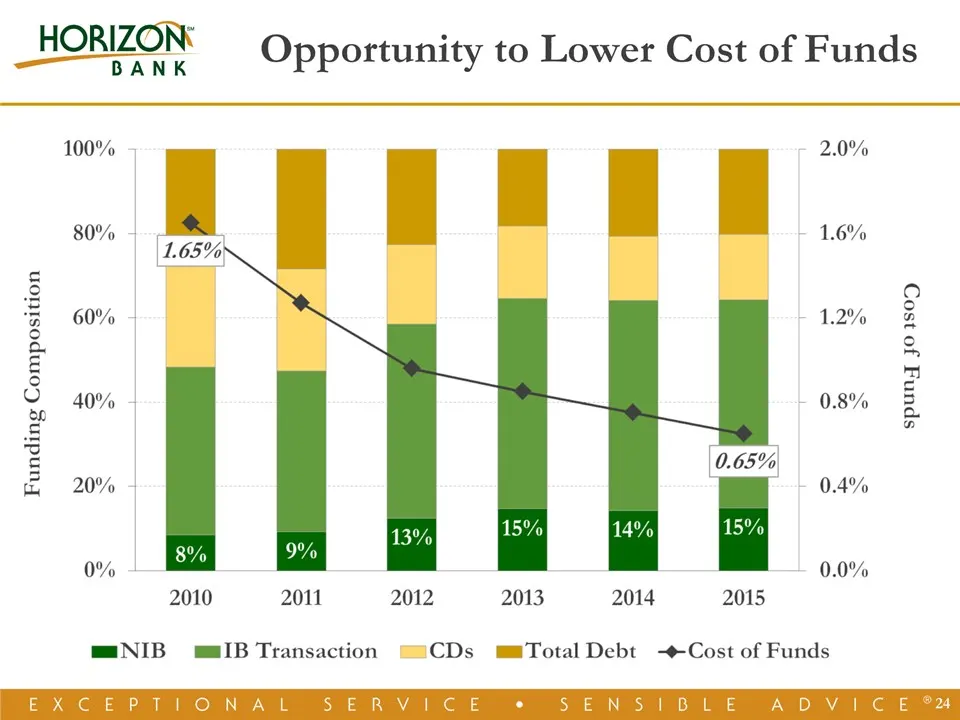
Slide 24: Opportunity to Lower Cost of Funds
* Commercial Loan Balances Opportunity to Lower Cost of Funds
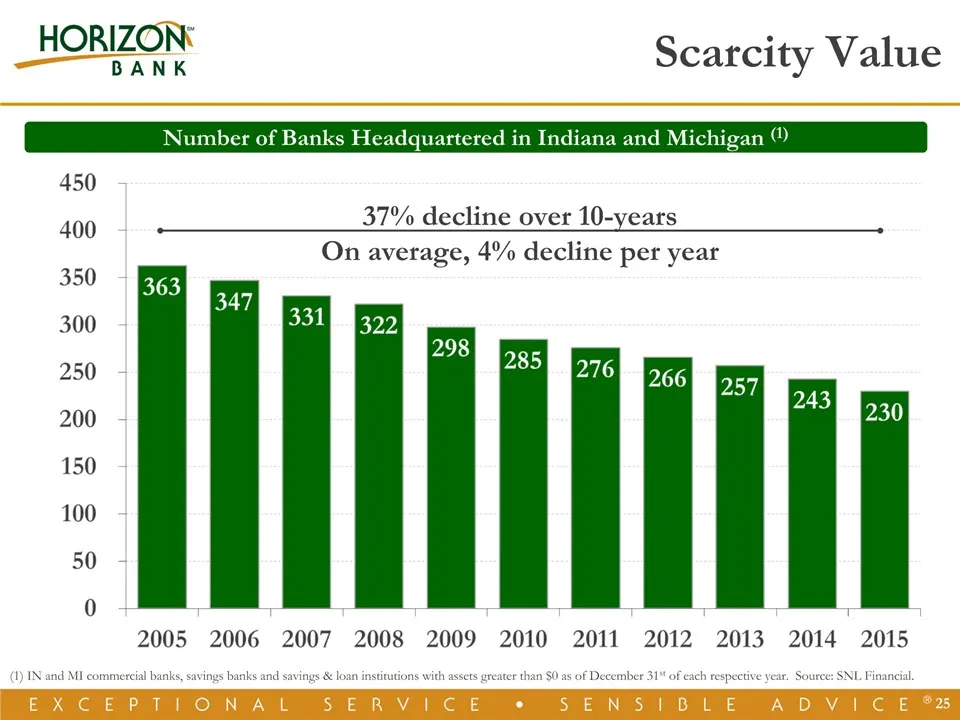
Slide 25: Scarcity Value
* Number of Banks Headquartered in Indiana and Michigan (1) Scarcity Value 37% decline over 10-yearsOn average, 4% decline per year (1) IN and MI commercial banks, savings banks and savings & loan institutions with assets greater than $0 as of December 31st of each respective year. Source: SNL Finan
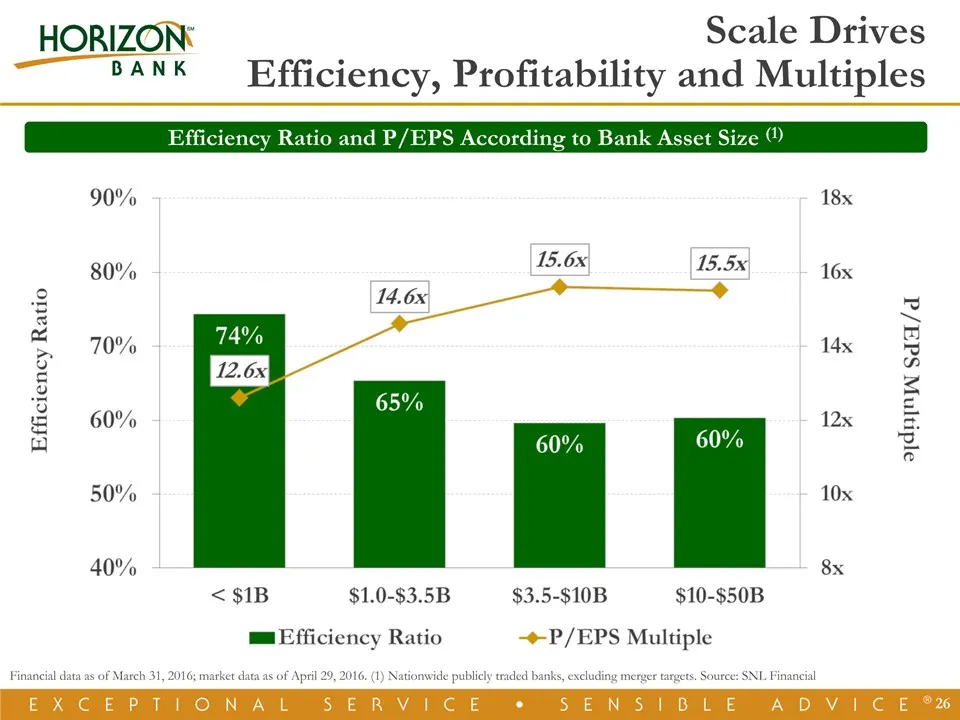
Slide 26: Scale Drives Efficiency, Profitability and Multiples
* Efficiency Ratio and P/EPS According to Bank Asset Size (1) Scale Drives Efficiency, Profitability and Multiples Financial data as of March 31, 2016; market data as of April 29, 2016. (1) Nationwide publicly traded banks, excluding merger targets. Source: SNL Financial
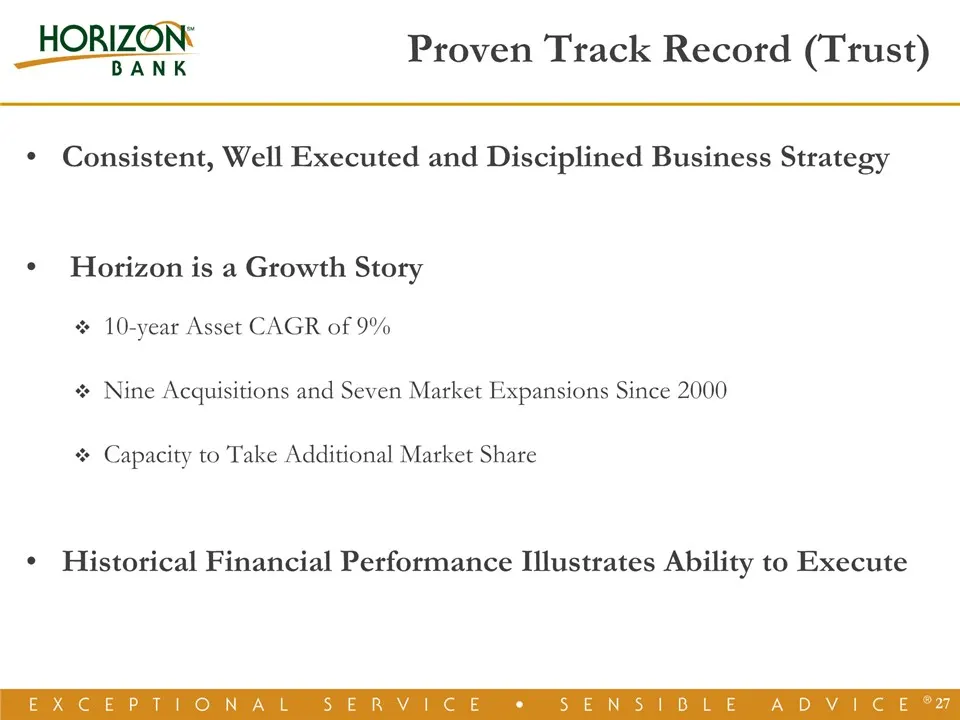
Slide 27: Proven Track Record (Trust)
Consistent, Well Executed and Disciplined Business Strategy Horizon is a Growth Story10-year Asset CAGR of 9%Nine Acquisitions and Seven Market Expansions Since 2000Capacity to Take Additional Market ShareHistorical Financial Performance Illustrates Ability to Execute * Proven Track Record (Trust)
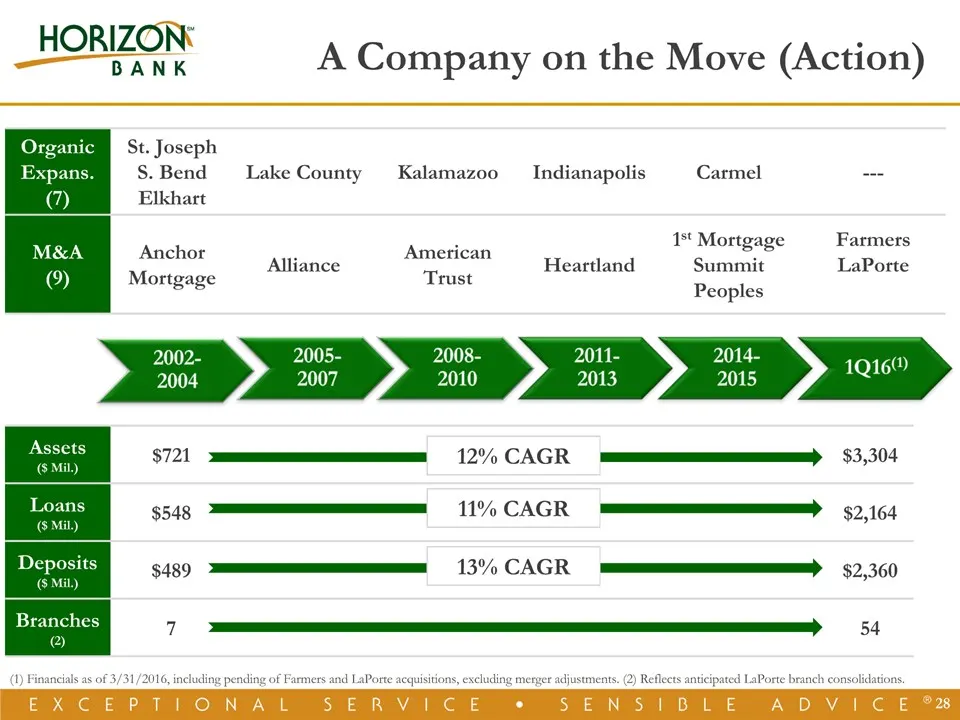
Slide 28: A Company on the Move (Action)
A Company on the Move (Action) * Assets ($ Mil.) $721 $3,304 Loans($ Mil.) $548 $2,164 Deposits($ Mil.) $489 $2,360 Branches (2) 7 54 OrganicExpans.(7) St. JosephS. BendElkhart Lake County Kalamazoo Indianapolis Carmel --- M&A(9) Anchor Mortgage Alliance American Trust Heartland 1st MortgageSummitPe
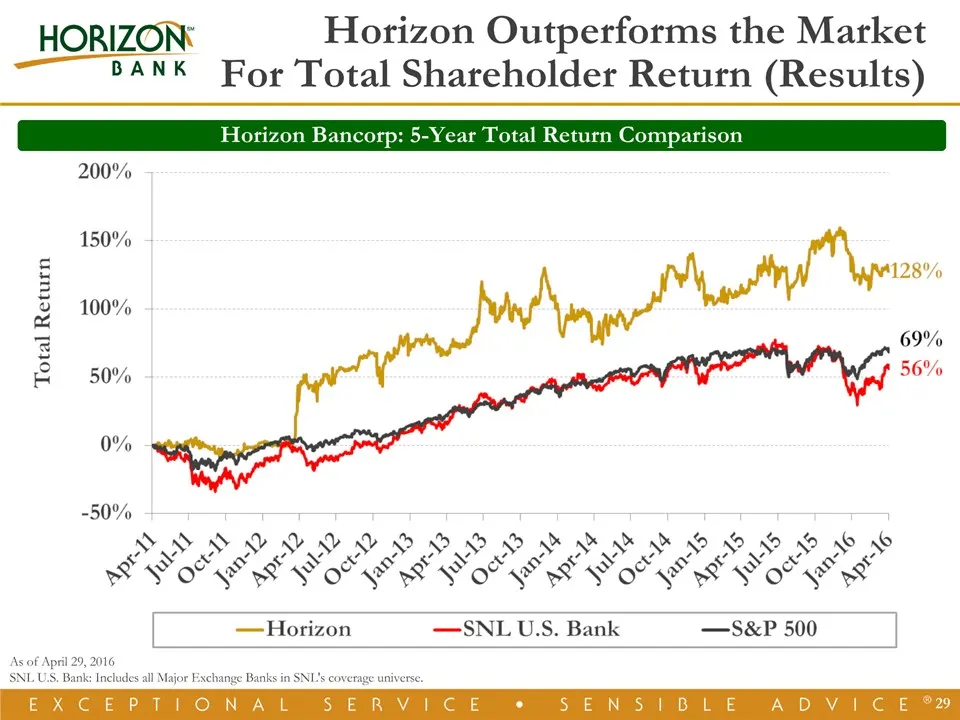
Slide 29: Horizon Outperforms the Market For Total Shareholder Return
Horizon Outperforms the MarketFor Total Shareholder Return (Results) As of April 29, 2016SNL U.S. Bank: Includes all Major Exchange Banks in SNL's coverage universe. * Horizon Bancorp: 5-Year Total Return Comparison
Slide 30: Thank You for Your Investment in Horizon Bancorp
Thank Youfor Your Investment inHorizon Bancorp
Slide 31: A NASDAQ Traded Company - Symbol HBNC
A NASDAQ Traded Company - Symbol HBNC
Slide 32: Appendix
HORIZON — BAN BANK Appendix EX GEP TO NAL SvECR Val Coe
Slide 33: Non-GAAP Reconciliations
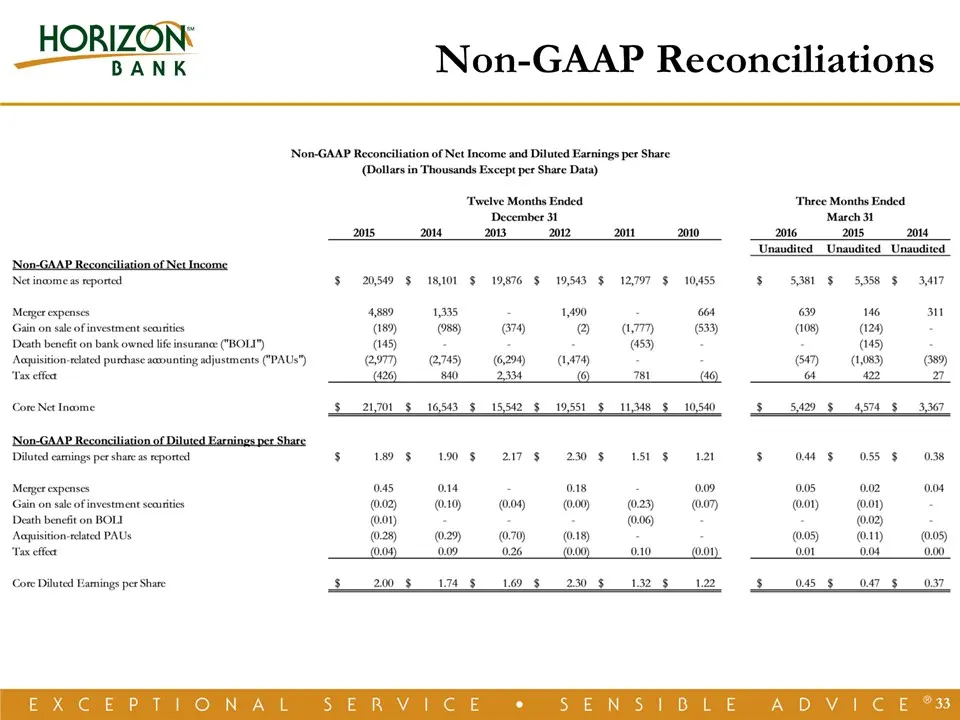
HORIZON‘ BANK Non-GAAP Reconciliations [Non-GAAP Reconciliation of Net Income and Diluted Earnings per Share (Dollars in Thousands Except per Share Data) ‘Non-GAAP Reconciliation of Net Income Net ineomeas reported s ‘Twelve Months Ended, ‘Three Months Ended December 31 March 31 2015 2014 2013 2012
Source: SEC EDGAR · 425 filed May 5, 2016
More decks from LaPorte Bancorp Inc
 Merger or Acquisition (March 2016)16 slides · Mar 11, 2016
 Shareholder Meeting (May 2015)15 slides · May 12, 2015
 Investor Presentation (February 2015)16 slides · Feb 12, 2015
 Shareholder Meeting (May 2014)16 slides · May 13, 2014
 Investor Presentation (December 2013)16 slides · Dec 16, 2013
 Shareholder Meeting (May 2013)15 slides · May 14, 2013