LaPorte Bancorp — Shareholder Meeting (May 2013)
15 slides from LaPorte Bancorp's shareholder meeting presentation, May 14, 2013

Slide 1: LaPorte Bancorp, Inc. Annual Shareholder Meeting
Exhibit 99.1 LaPorte Bancorp, Inc. LPSB Annual Shareholder Meeting May 14, 2013 Michele M. Thompson – President & Chief Financial Officer
Slide 2: Forward-Looking Statements
Forward-Looking Statements The presentation contains “forward-looking statements” within the meaning of Section 27A of the Securities Act of 1933, as amended and Section 21E of the Securities Exchange Act of 1934, as amended. We intend such forward-looking statements to be covered by the safe harbor
Slide 3: Forward-Looking Statements (continued)
Forward-Looking Statements (continued) general economic conditions, either nationally or in our market areas, that are worse than expected; changes in prevailing real estate values and loan demand, both nationally and within our current and future market area; inflation and changes in the interest r
Slide 4: LaPorte Bancorp, Inc. Timeline
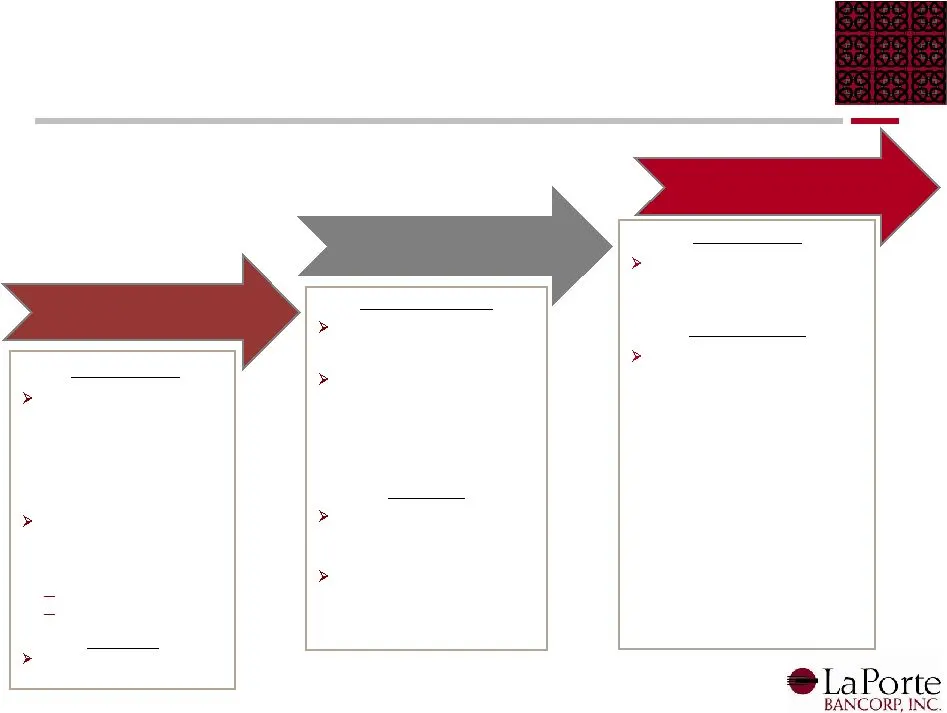
2007 - 2008 2009 - 2011 2012 - 2013 LaPorte Bancorp, Inc. Timeline October 2007 LaPorte raises $13 million of common equity in its initial public offering and converts into a mutual holding company structure LaPorte simultaneously completes acquisition of City Savings Financial Corp. July 2008 LaPor
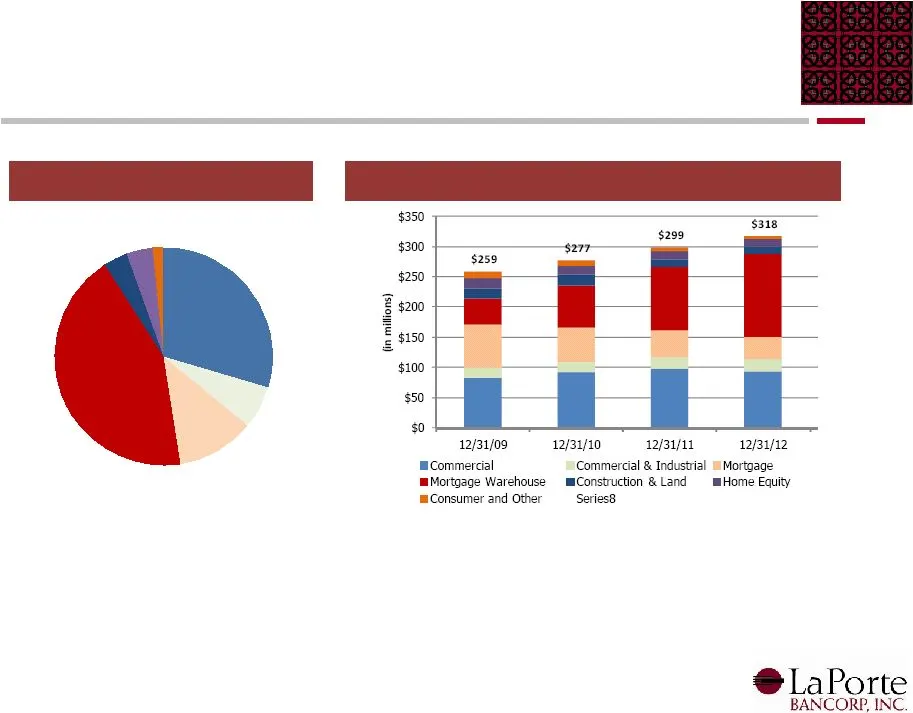
Slide 5: Historical Loan Trends ($MM) Loan Composition
Historical Loan Trends ($MM) Loan Composition Loan Composition 29.6% 6.3% 11.6% 43.3% 3.7% 3.9% 1.6% Note: Total loans excludes deferred loan fees and loans held for sale
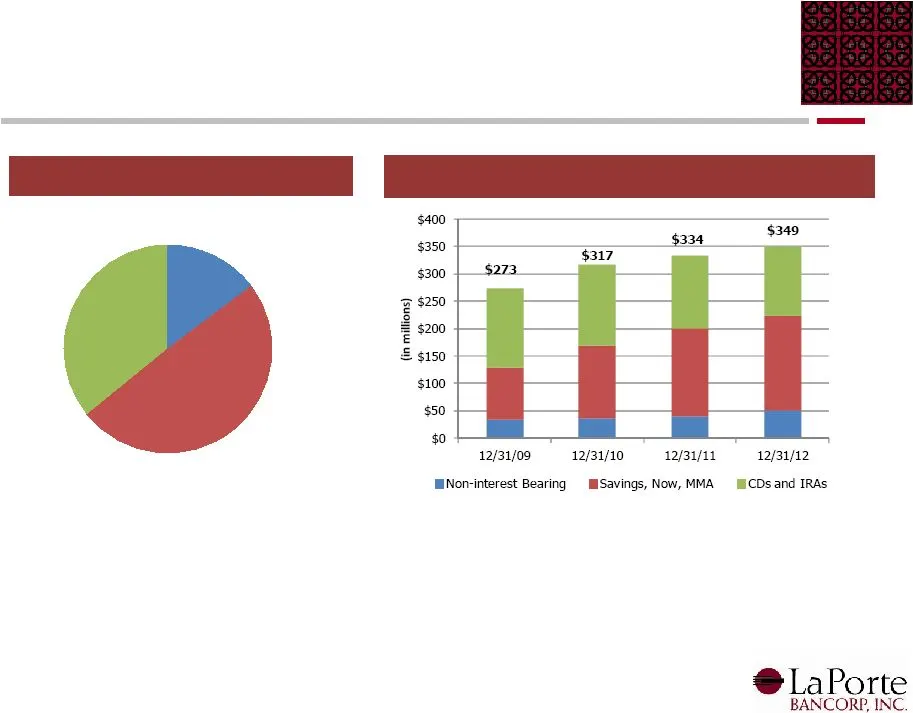
Slide 6: Historical Deposit Trends ($MM) Deposit Composition
Historical Deposit Trends ($MM) Deposit Composition Deposit Composition 14.6% 49.6% 35.8%
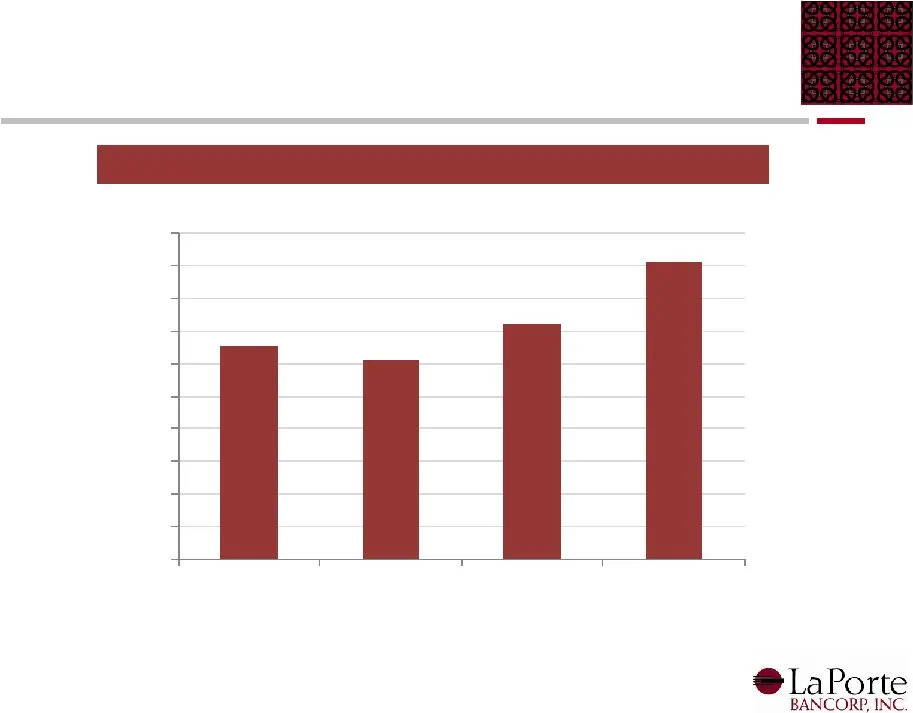
Slide 7: Return on Average Assets (ROAA) (%)
Return on Average Assets (ROAA) (%) Return on Average Assets (ROAA) 0.65 0.61 0.72 0.91 0.00 0.10 0.20 0.30 0.40 0.50 0.60 0.70 0.80 0.90 1.00 2009Y 2010Y 2011Y 2012Y
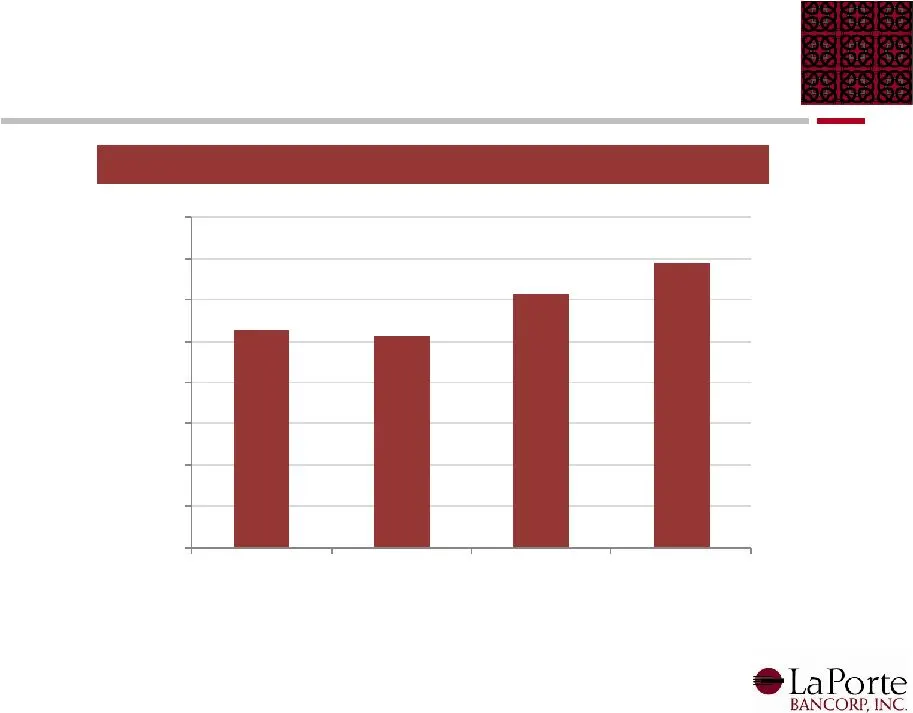
Slide 8: Return on Average Equity (ROAE) (%)
Return on Average Equity (ROAE) (%) Return on Average Equity (ROAE) 5.25 5.12 6.15 6.91 0.00 1.00 2.00 3.00 4.00 5.00 6.00 7.00 8.00 2009Y 2010Y 2011Y 2012Y
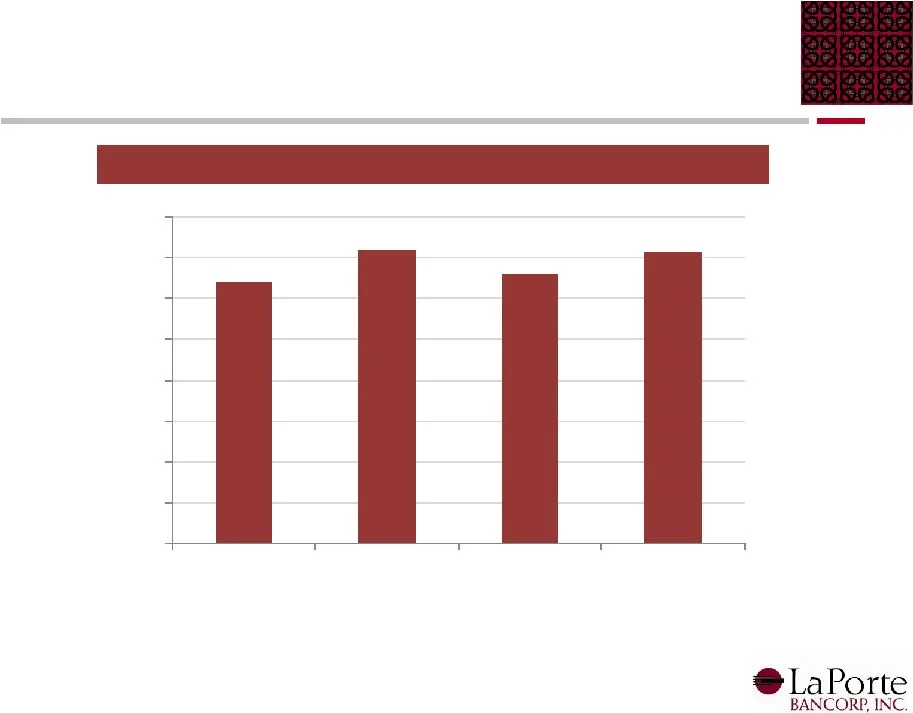
Slide 9: Net Interest Margin (NIM) (%)
Net Interest Margin (NIM) (%) Net Interest Margin (NIM) 3.21 3.59 3.31 3.57 0.00 0.50 1.00 1.50 2.00 2.50 3.00 3.50 4.00 2009Y 2010Y 2011Y 2012Y
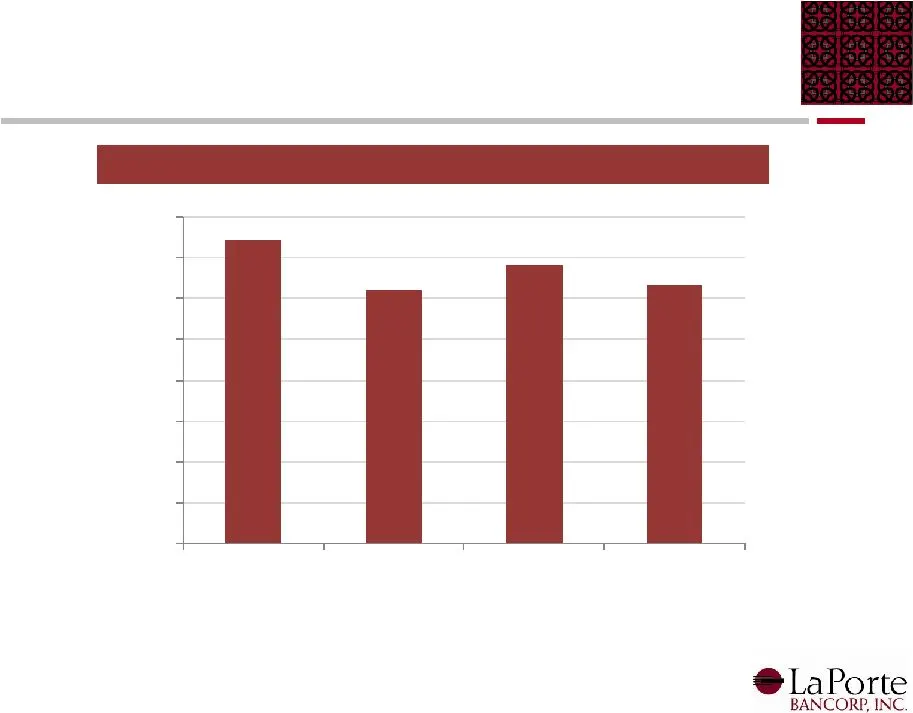
Slide 10: Efficiency Ratio (%)
Efficiency Ratio (%) Efficiency Ratio 74.66 62.06 68.36 63.34 0.00 10.00 20.00 30.00 40.00 50.00 60.00 70.00 80.00 2009Y 2010Y 2011Y 2012Y
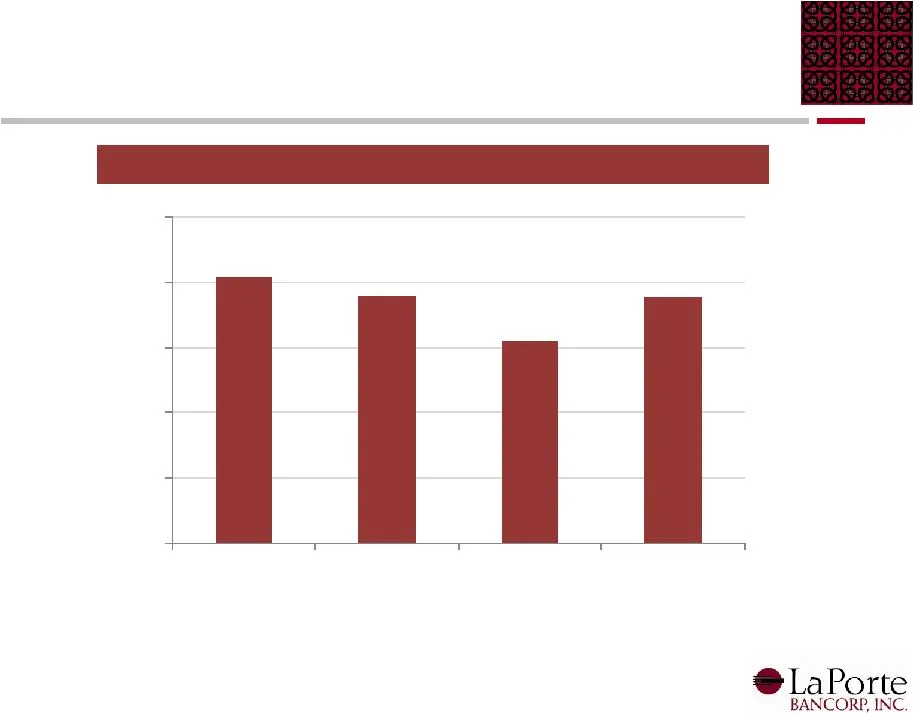
Slide 11: NPAs/ Assets (%)
NPAs/ Assets (%) 1 Non-performing Assets / Assets (1) NPAs/Assets includes TDRs 2.04 1.89 1.55 1.88 0.00 0.50 1.00 1.50 2.00 2.50 2009Y 2010Y 2011Y 2012Y
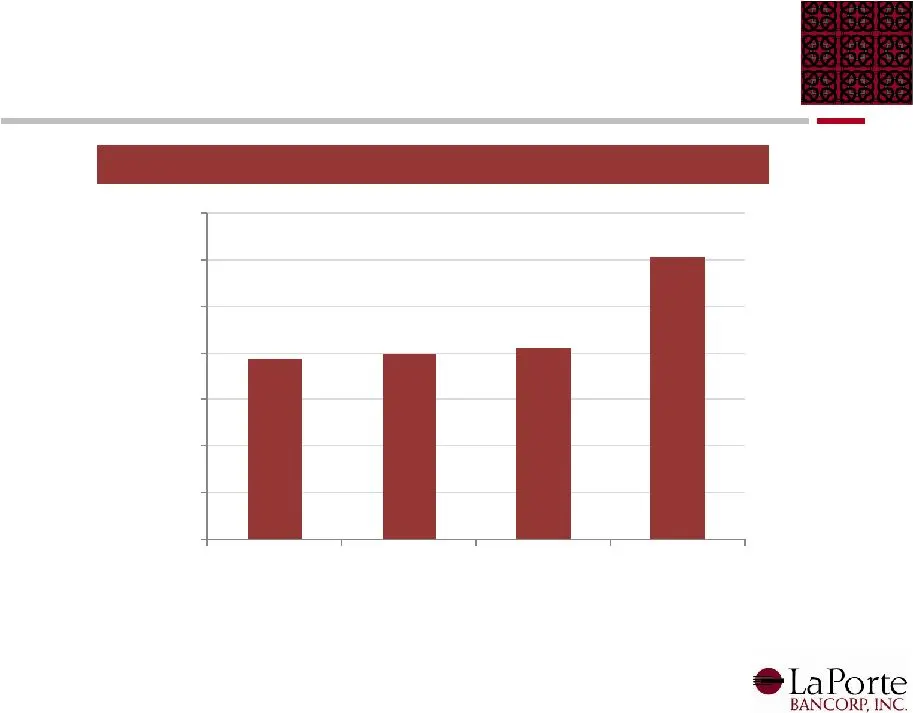
Slide 12: Tangible Book Value Per Share ($)
Tangible Book Value Per Share ($) Tangible Book Value Per Share $7.76 $7.95 $8.21 $12.13 $- $2.00 $4.00 $6.00 $8.00 $10.00 $12.00 $14.00 2009Y* 2010Y* 2011Y* 2012Y *2009, 2010 and 2011 tangible book value per share are exchange ratio adjusted
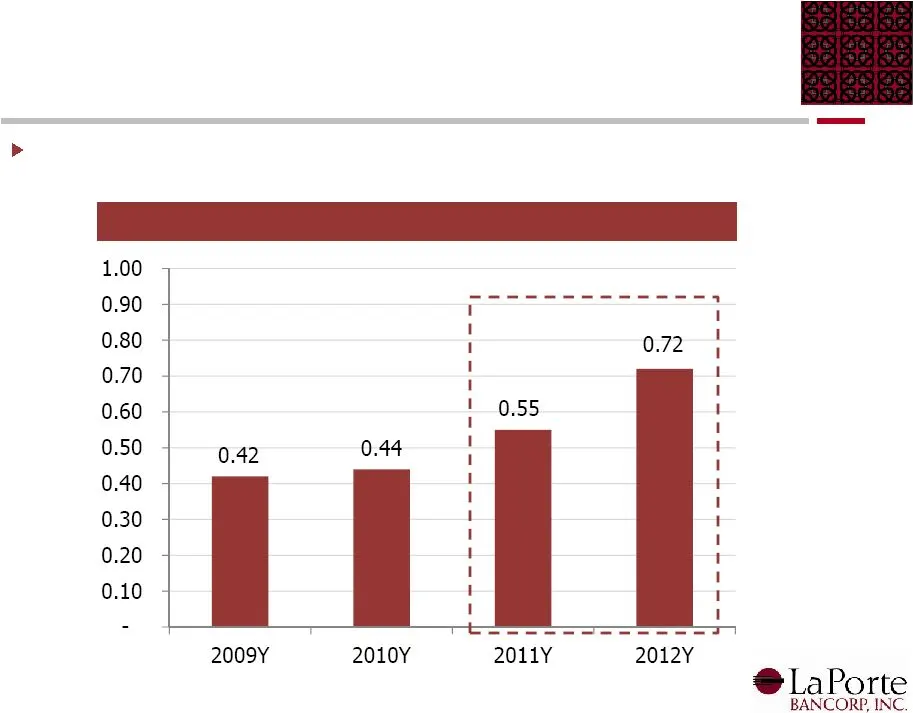
Slide 13: Earnings Per Share ($)
Earnings Per Share ($) 1 Consistent Growth in Earnings Per Share Our management team has been consistently focused on generating profits for our shareholders (1) EPS calculation is exchange ratio adjusted
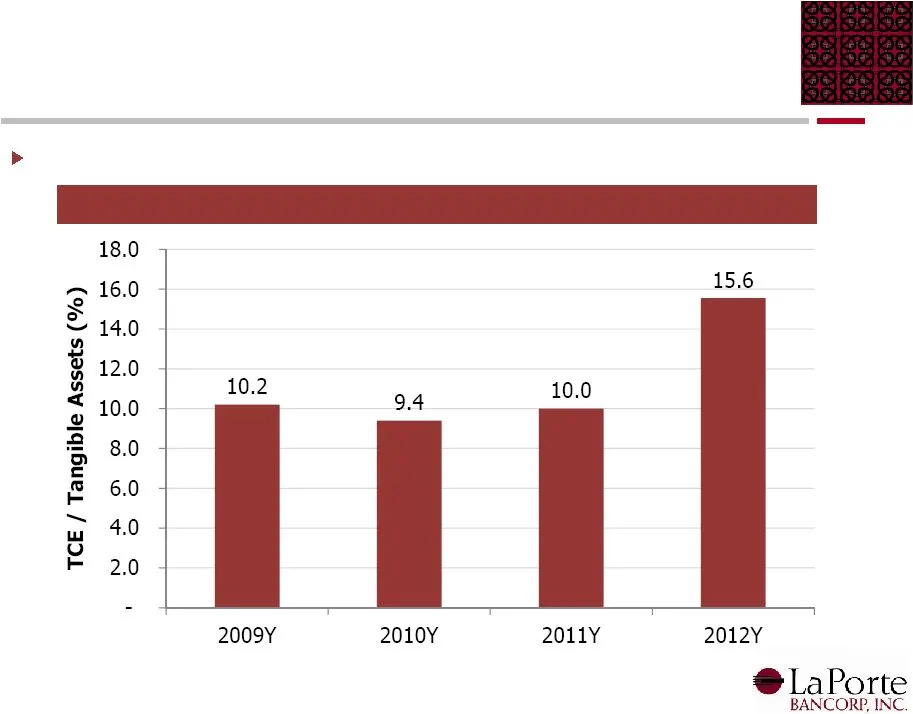
Slide 14: Strong Capital Levels
Strong Capital Levels Strong Capital Position LaPorte maintains a low risk profile with strong capital levels

Slide 15: INC.
INC. D BANCORP @ LaPorte
Source: SEC EDGAR · 8-K filed May 14, 2013
More decks from LaPorte Bancorp Inc
 Merger or Acquisition (May 2016)33 slides · May 5, 2016
 Merger or Acquisition (March 2016)16 slides · Mar 11, 2016
 Shareholder Meeting (May 2015)15 slides · May 12, 2015
 Investor Presentation (February 2015)16 slides · Feb 12, 2015
 Shareholder Meeting (May 2014)16 slides · May 13, 2014
 Investor Presentation (December 2013)16 slides · Dec 16, 2013