LaPorte Bancorp — Shareholder Meeting (May 2014)
16 slides from LaPorte Bancorp's shareholder meeting presentation, May 13, 2014
Slide 1: Annual Shareholder Meeting
LaPorte Bancorp, Inc. LPSB Annual Shareholder Meeting May 13, 2014 @ LaPorte CORP, INC
Slide 2: Forward-Looking Statements
Forward-Looking Statements The contains “fc rd-looking statements” within the meaning of Section 27A of the Securities Act of 1933, as amended and Section 21E of the Securities Exchange Act of 1934, as amended. We intend such forward-looking statements to be covered by the safe harbor provisions ba
Slide 3: Forward-Looking Statements (continued)
Forward-Looking Statements (continued) The following factors, among others, could cause actual results to differ materially from the anticipated results or other expectations express'in the forward-looking statements: changes in prevailing real estate values and loan demand, both nationally and with
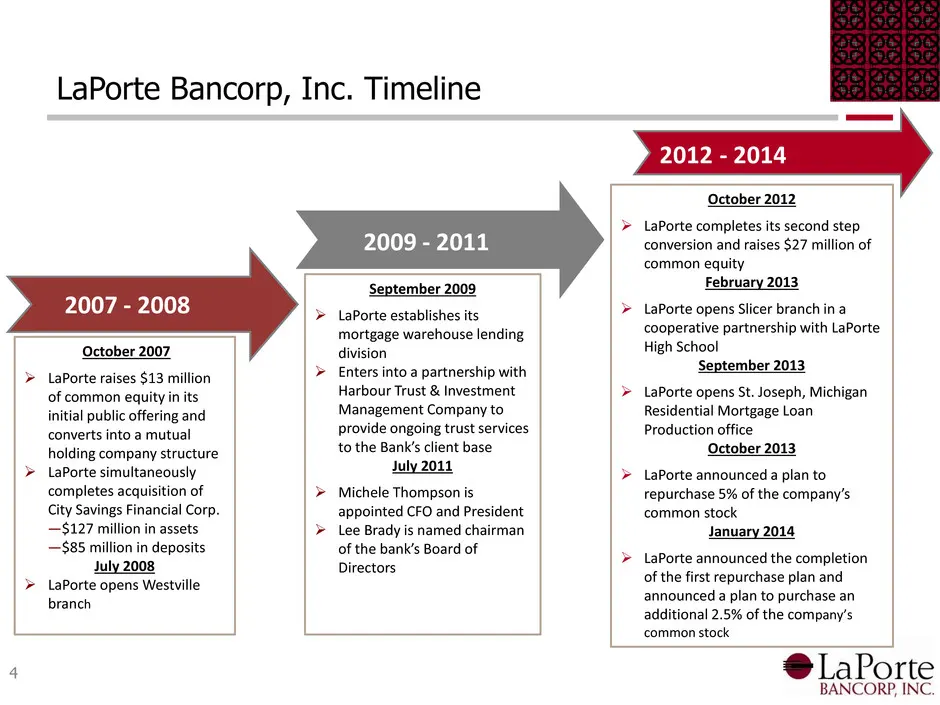
Slide 4: LaPorte Bancorp, Inc. Timeline
v - v LaPorte Bancorp, Inc. Timeline 2007 - 2008 October 2007, LaPorte raises $13 ity in its initial public offering and City Sevag Financia corp. $127 million in assets —$85 million in deposits duly 2008 LaPorte opens Westville branch ¥ v y =e 2009 - 2011 September 2009 aoe establishes its jortgage
Slide 5: Loan Composition
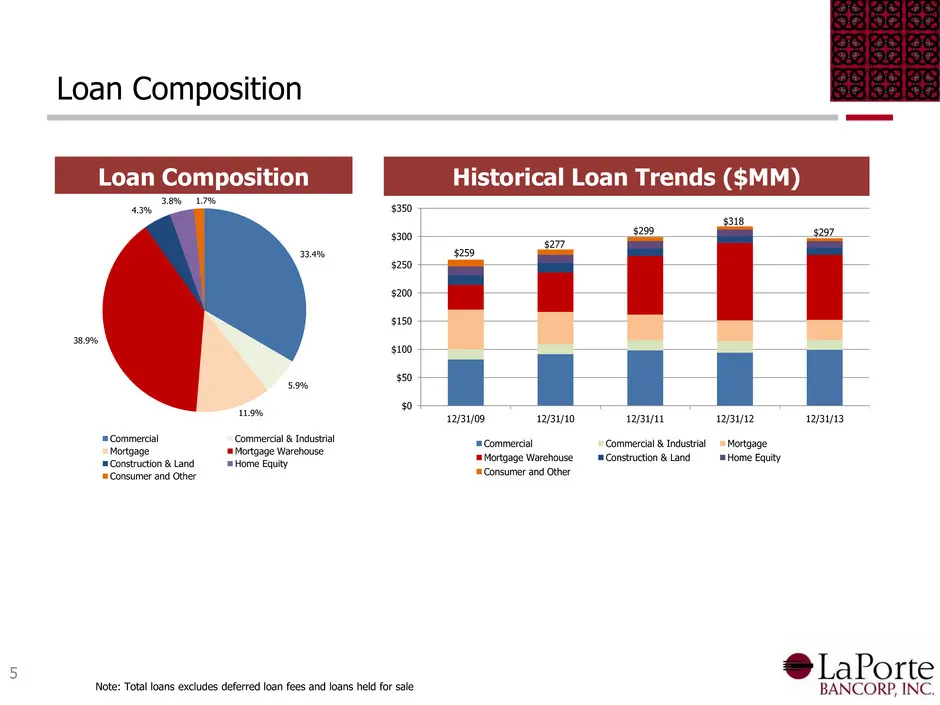
a Loan Composition Loan Composition Sere 3% 119% "commercial Commercial & Industral ‘sMortgage Warehouse Home Equity Note: Total loans excludes deferred loan fees and loans held for sale Historical Loan Trends ($MM) 318 5259 ll $257 22/31/10 py raps Commercial &Industial = Mortgage ‘Construction & l
Slide 6: Deposit Composition
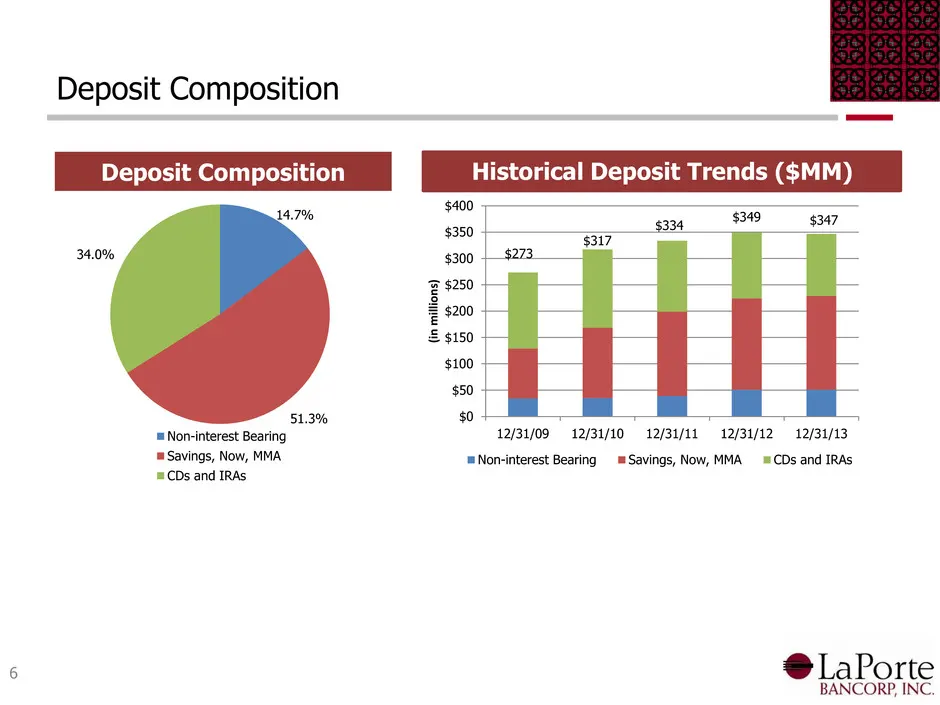
Deposit Composition Deposit Composition $400 4.7% 50 | 334 $349 $347 $317 Historical Deposit Trends ($MM) = Non-interest Bearing 12/31/09 12/31/10 12/31/11. 12/31/12 12/31/13 "= Savings, Now, MMA ‘= Non-interest Bearing = Savings, Now, MMA = CDs and IRAs |= CDs and IRAs @LaPorte BANCORP, INC.
Slide 7: Return on Average Assets (ROAA)
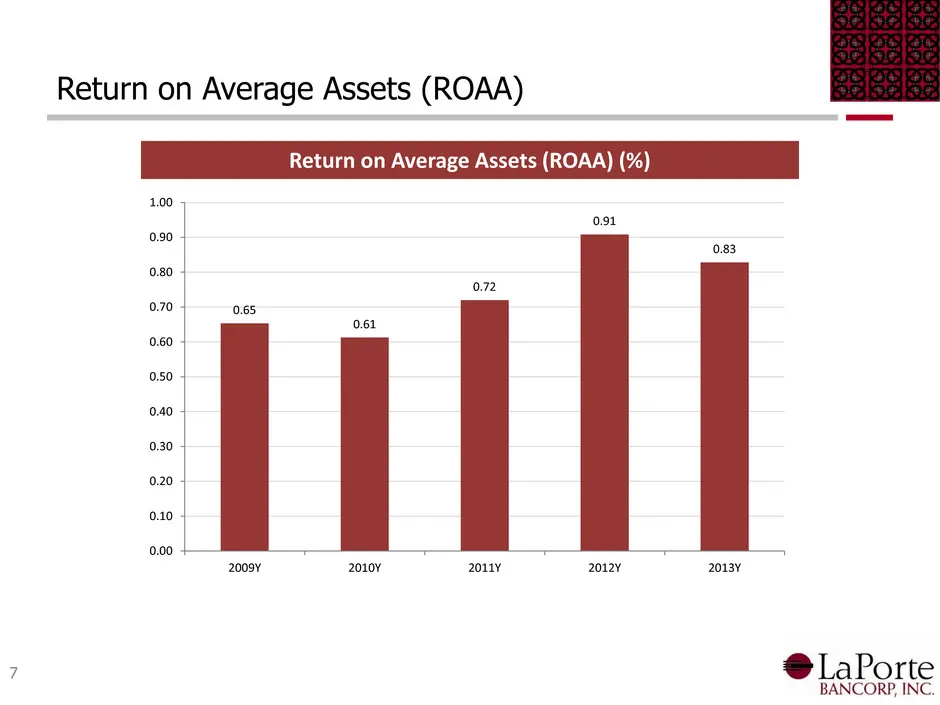
Return on Average Assets (ROAA) Return on Average Assets (ROAA) (%) 0.91 20097 2010¥ 2o1y 2012Y 20137 @LaPorte BANCORP, INC.
Slide 8: Return on Average Equity (ROAE)
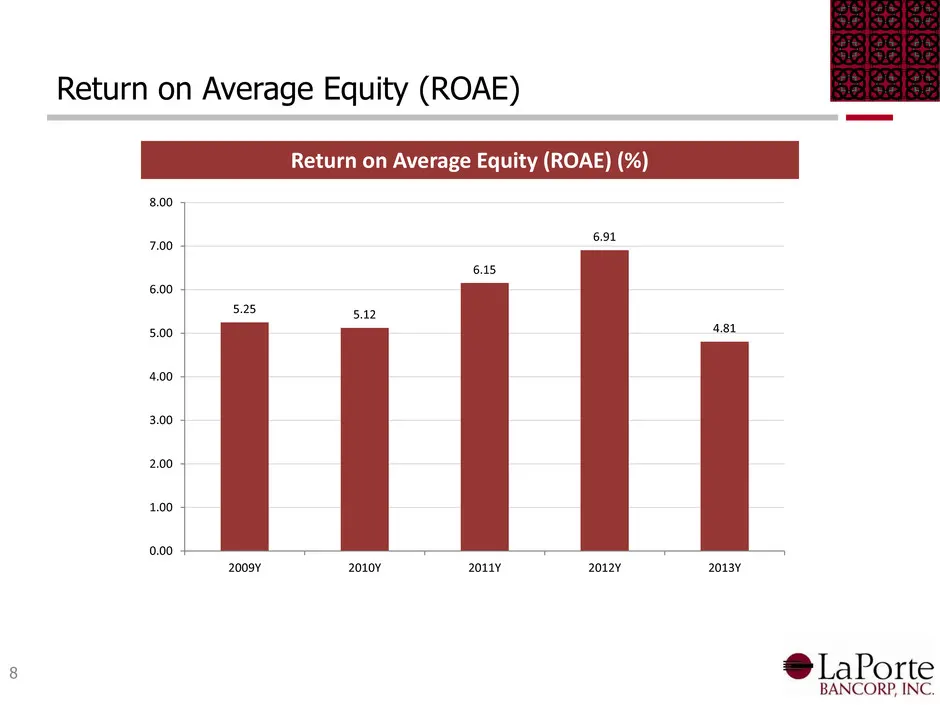
Return on Average Equity (ROAE) Return on Average Equity (ROAE) (%) 20097 2010¥ 2o1y 2012Y 20137 @LaPorte BANCORP, INC.
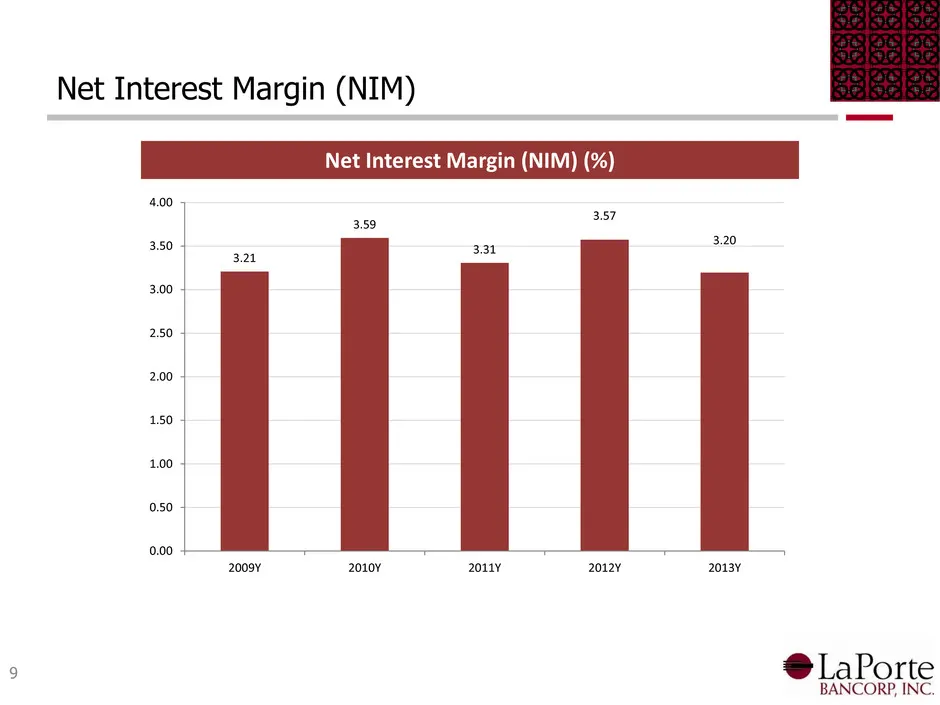
Slide 9: Net Interest Margin (NIM)
Net Interest Margin (NIM) Net Interest Margin (NIM) (%) 5 3.87 20097 2010¥ 2o1y 2012Y 20137 @LaPorte BANCORP, INC.
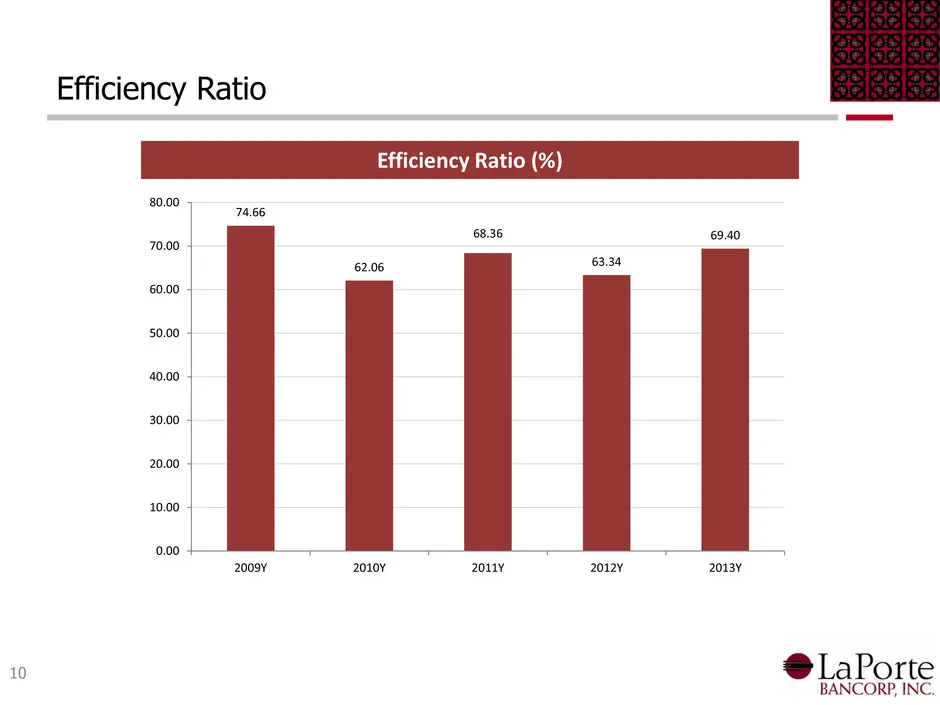
Slide 10: Efficiency Ratio
Efficiency Ratio 20097 20107 2011y 2012Y 2013 @LaPorte BANCORP, INC.
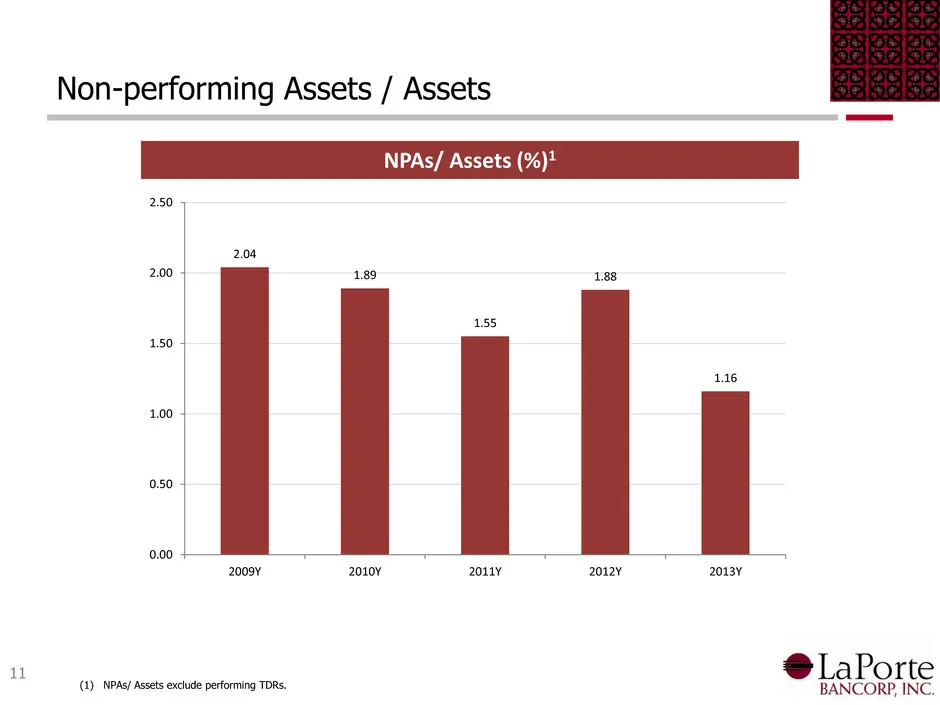
Slide 11: Non-performing Assets / Assets
Non-performing Assets / Assets NPAs/ Assets (%)1 2009 2010" 2o11y 2012 2013 hn @ LaPorte (1) _NPAs/ Assets exclude performing TDRs. BANCORP, INC.
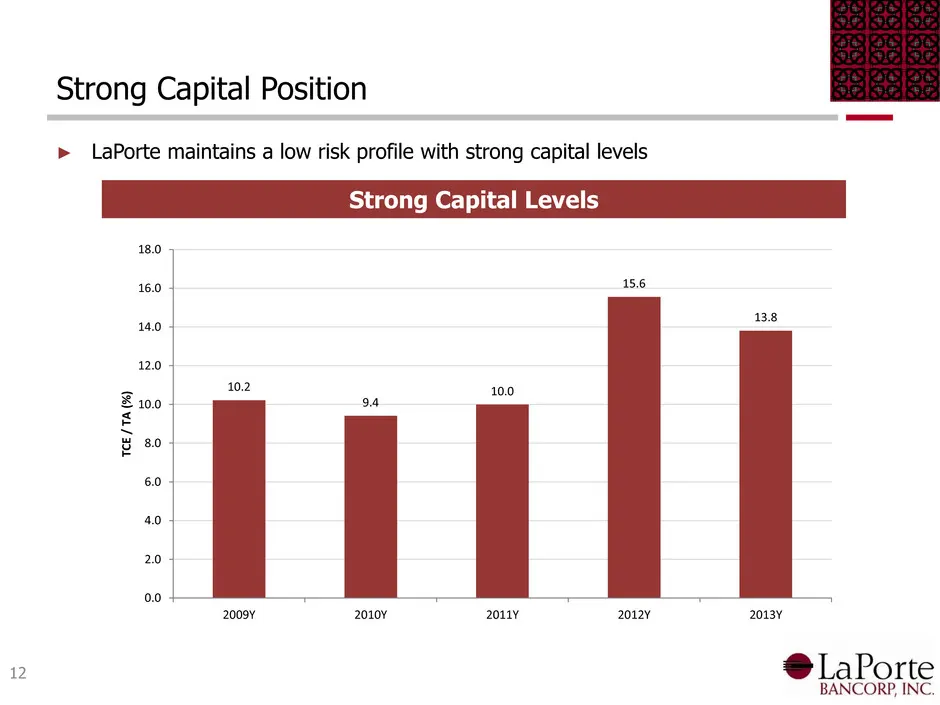
Slide 12: Strong Capital Position
Strong Capital Position > LaPorte maintains a low risk profile with strong capital levels Strong Capital Levels 180 80 156 14.0 235: 120 102 = 100 F100 94 & 3 80 e 60 40 20 00 2009 20107 aouy 2012 20137 @ LaPorte BANCORP, INC.
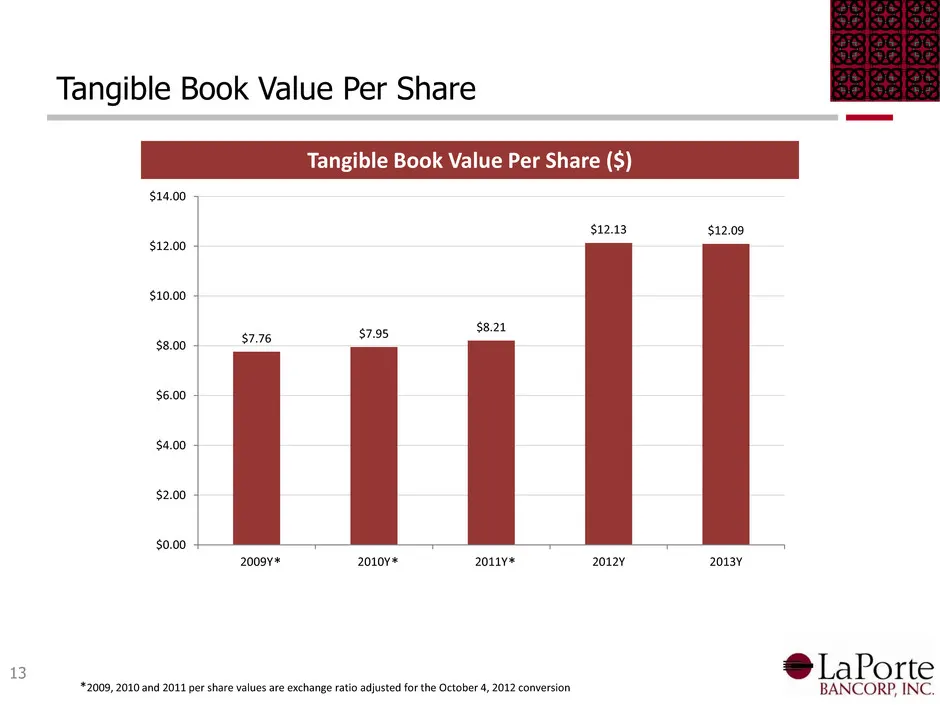
Slide 13: Tangible Book Value Per Share
Tangible Book Value Per Share $14.00 $12.13 $12.09 $8.21 $7.95 alba) $7.76 20097" 2o10v* 2ouy* 2012Y 2013 Bo @ LaPorte 1, 2012 conversion BANCORP, INC.
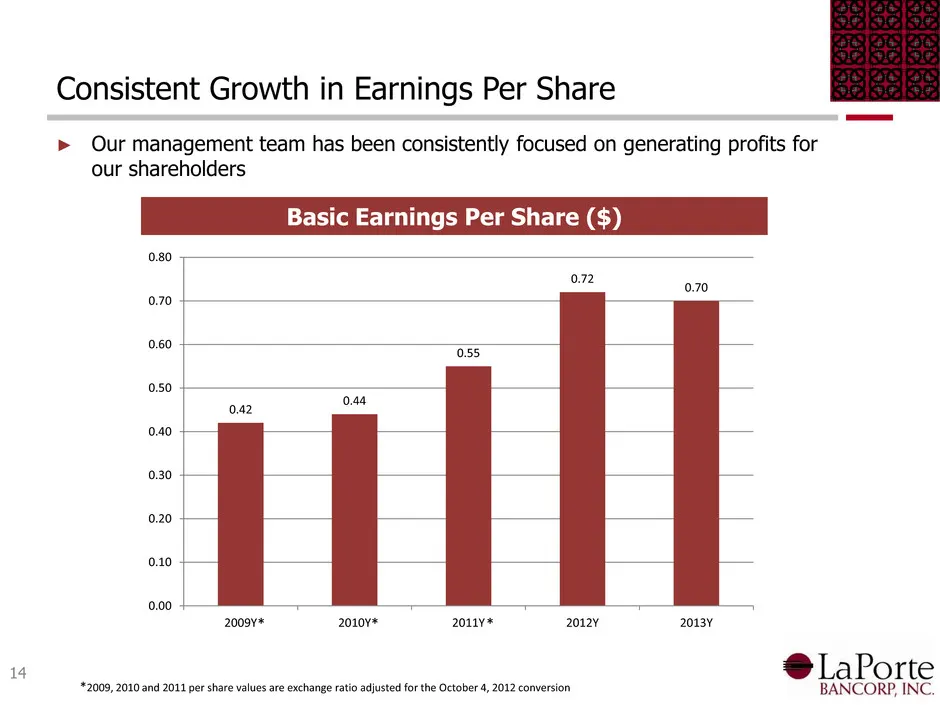
Slide 14: Consistent Growth in Earnings Per Share
Consistent Growth in Earnings Per Share > Our management team has been c our shareholders Basic Earnings Per Share ($) focused on ing profits for 20097" 0.48 2o10v* 0.72 2ouy* 20127 2013 2012 conversion @LaPorte BANCORP, INC.
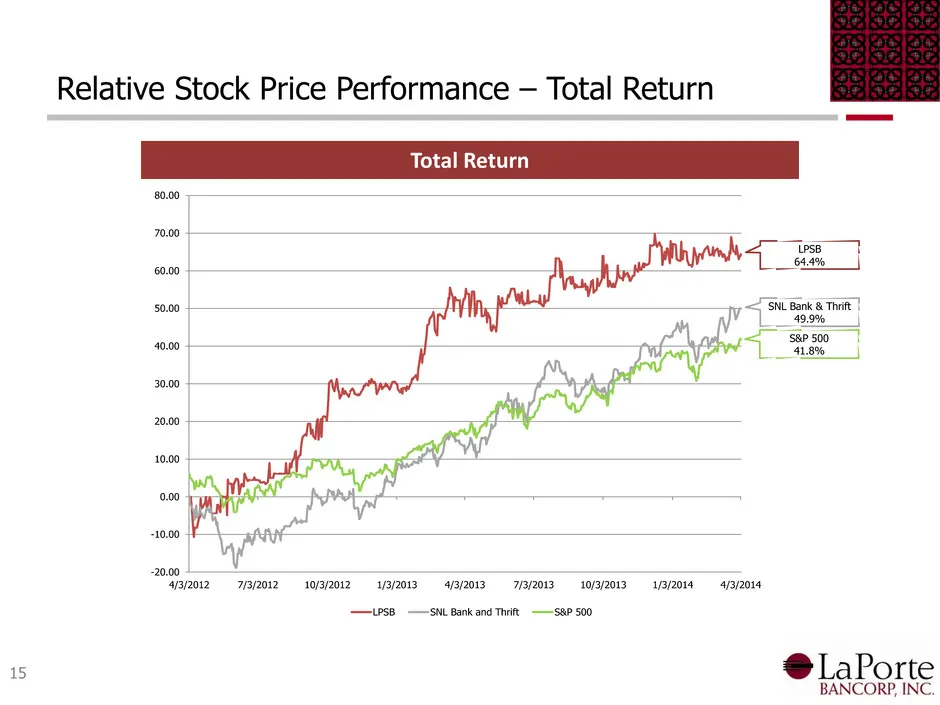
Slide 15: Relative Stock Price Performance — Total Return
Relative Stock Price Performance — Total Return Total Return om bby el Ml ae ith yay a N faghe eth an gor eMpRo — 7ARO —s0AROR ARO sR ROI ORO yao —_—aaO18 70.00 —Lrs8 —sNt Bank and Thi’. —Sap 500 15 @LaPorte alo BANCORP, INC
Slide 16: Questions?
Questions? LaPorte BANCORP, INC
Source: SEC EDGAR · 8-K filed May 13, 2014
More decks from LaPorte Bancorp Inc
 Merger or Acquisition (May 2016)33 slides · May 5, 2016
 Merger or Acquisition (March 2016)16 slides · Mar 11, 2016
 Shareholder Meeting (May 2015)15 slides · May 12, 2015
 Investor Presentation (February 2015)16 slides · Feb 12, 2015
 Investor Presentation (December 2013)16 slides · Dec 16, 2013
 Shareholder Meeting (May 2013)15 slides · May 14, 2013